In this review, evidence is presented to support the hypothesis that reduced sleep duration may be part of the behavioral modi fi cations that played a role in the development of the current epidemic of obesity and diabetes. An important consideration when trying to explain the epidemiologic link between sleep loss and metabolic risk is that it is not clear whether the physiological effects of sleep restriction observed under laboratory condi-tions over a period of a few days can be translated to chronic sleep restric-tion as it occurs in free-living individuals. Also, when comparing different laboratory studies of sleep restriction, differences in the “dose” of sleep loss relative to the physiological need of the individual are often ignored. While the body of evidence suggestive of an interaction between sleep loss and the epidemics of obesity and diabetes continues to build at a rapid pace, much remains to be discovered as far as mechanisms and the transition from short-term laboratory conditions to chronic partial sleep deprivation in real life. Intervention studies extending sleep in habitual short sleepers and examining the impact on metabolic outcomes are needed to further address the direction of causality of the association between insuf fi cient sleep, obesity, and diabetes and the potential clinical implications.
Secular Trends in Sleep Duration and the Prevalence of Obesity and Diabetes
In the past few decades, the prevalence of obesity and, consequently, of type 2 diabetes mellitus (T2DM) have increased alarmingly worldwide.
Such a rapid increase cannot be explained by an alteration in the genetic pool; it is more likely due to environmental, socioeconomic, behavioral, and demographic factors and the interaction between genetics and these factors. Food market-ing practices with increased portion size and widespread availability of high caloric fast food are often cited as a major culprit, alongside reduced physical activity. In recent years, there has been an increased interest in nontraditional behavioral and environmental factors that could also contribute to the epidemic of obesity and
S. Pannain, MD • G. Beccuti, MD • E. Van Cauter, PhD (*) Department of Medicine , University of Chicago , 5841 S. Maryland Avenue , Chicago , IL 60637 , USA e-mail: [email protected]
The Connection Between Sleep Loss, Obesity, and Type 2 Diabetes
Silvana Pannain , Guglielmo Beccuti, and Eve Van Cauter
134 S. Pannain et al.
diabetes [ 1 ] . Among these, one novel behavior that seems to have developed during the past few decades and has become highly prevalent is chronic partial sleep curtailment.
Secular trends in sleep duration are poorly documented, but a comparison of surveys con-ducted in the 1960s and 1970s to those conducted after 2000 suggests a marked decrease in sleep duration. For example, in 1960, a survey study conducted by the American Cancer Society found the modal sleep duration to be 8.0–8.9 h [ 2 ] and, in 1975, more than 85% of the participants in the Older Finnish Twin Cohort reported sleeping more than 7 h per night [ 3 ] . In contrast, the “Sleep in America” poll conducted by the National Sleep Foundation in 2008 revealed that the average number of hours of sleep on workdays was 6 h 40 min, with an extension to 7 h 25 min on non-workdays [ 4 ] . A report from the National Health Interview Survey indicated that the percentage of adults between the ages of 30 and 65 years who report sleeping 6 h or less increased by approxi-mately 5–6% between 1985 and 2004, such that in 2004, more than 30% of men and women in this age group reported sleeping 6 h or less [ 5 ] . According to recent polls from the US Centers for Disease Control and Prevention (CDC), approximately 29% of US adults report sleeping less than 7 h per night, and 50–70 million have chronic sleep and wakefulness disorders [ 6 ] . When sleep duration is measured objectively (using wrist actigraphy) rather than self-reported, the fi ndings are not less alarming. For example, the Coronary Artery Risk Development in Young Adults (CARDIA) Sleep Study measured the sleep of adults aged 38–50 years for 3 consecu-tive days on two occasions spaced approximately 1 year apart. The mean sleep duration was 6.1 (± 1.2) h, and it varied across race–gender groups from 6.7 (± 0.9) h for white women to only 5.1 (± 1.3) h for African-American men [ 7 ] .
Insuf fi cient sleep may be due to a voluntary restriction of time spent in bed or may be the result of a sleep disorder, such as insomnia or obstructive sleep apnea (OSA). Unfortunately, the vast majority of epidemiologic studies that addressed the relationship between sleep
duration and the risk of obesity or diabetes did not distinguish between voluntary sleep curtail-ment and sleep loss due to a pathological condi-tion. Chronic partial sleep loss in contemporary society is certainly partly self-imposed. Our 24-h society involves demands and opportuni-ties to extend the waking period for evening and nighttime work and leisure activities, and consequently a sacri fi ce of hours available for sleep. These relatively novel behaviors have had a major impact on bedtime duration and duration of dark exposure, resulting in later bed-times, reduced total sleep time, and the opportu-nity to be active and ingest food during the natural night.
The function of sleep is most frequently described as a restorative process for the brain, but there is now abundant evidence that sleep is a healthy behavior that is also important for the rest of the body, consistent with the important modu-latory effects of sleep on neuroendocrine func-tion and glucose metabolism [ 8 ] . The decrease in sleep duration (and the associated increase in sleep complaints) in modern society [ 9 ] may be considered as a sleep disorder because it pro-duces both daytime and nighttime alterations of neurobehavioral and physiological systems and raises concerns for a negative impact on health in general, not only mental health.
The gold standard method for assessing sleep is polysomnography (PSG), which combines an all night recording of the EEG with measures of muscle tone and eye movements and allows for the scoring of sleep in stages I, II, III, IV, REM, and Wake. A single night of PSG does not gener-ally provide a good estimation of habitual sleep duration. Objective estimations of sleep duration and sleep fragmentation may be obtained under ambulatory conditions by wrist actigraphy moni-toring (WAM). WAM has been validated against PSG, demonstrating a correlation for sleep dura-tion between 0.82 in insomniacs and 0.97 in healthy subjects [ 10 ] . Lastly, a number of vali-dated questionnaires to assess subjective sleep duration and quality have been developed. Subjective sleep duration often overestimates the actual sleep duration [ 11 ] .
13510 The Connection Between Sleep Loss, Obesity, and Type 2 Diabetes
Short Sleep Duration and Obesity: Epidemiologic Evidence
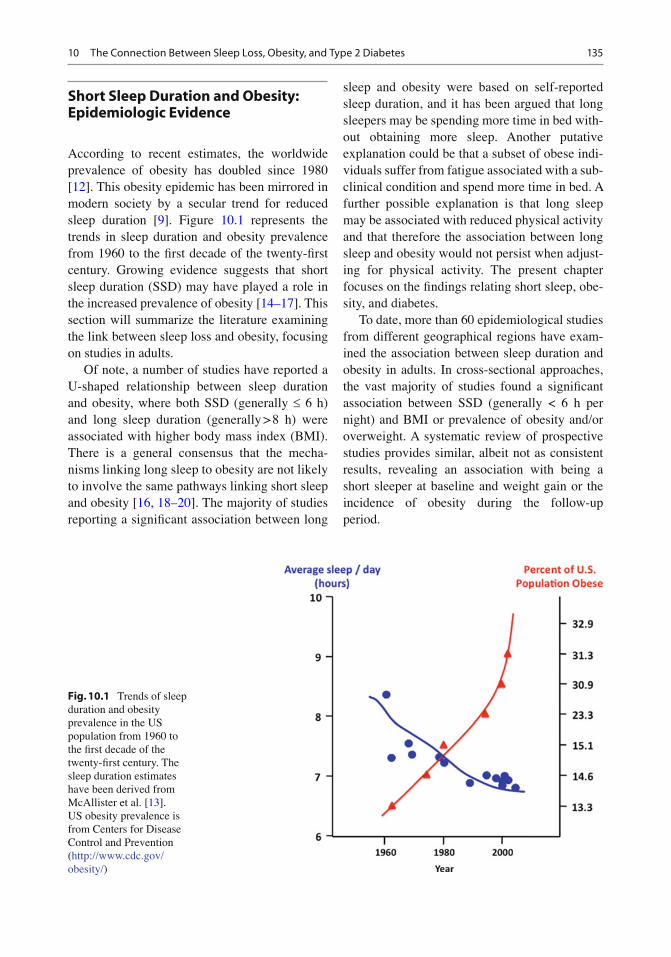
According to recent estimates, the worldwide prevalence of obesity has doubled since 1980 [ 12 ] . This obesity epidemic has been mirrored in modern society by a secular trend for reduced sleep duration [ 9 ] . Figure 10.1 represents the trends in sleep duration and obesity prevalence from 1960 to the fi rst decade of the twenty- fi rst century. Growing evidence suggests that short sleep duration (SSD) may have played a role in the increased prevalence of obesity [ 14– 17 ] . This section will summarize the literature examining the link between sleep loss and obesity, focusing on studies in adults.
Of note, a number of studies have reported a U-shaped relationship between sleep duration and obesity, where both SSD (generally £ 6 h) and long sleep duration (generally > 8 h) were associated with higher body mass index (BMI). There is a general consensus that the mecha-nisms linking long sleep to obesity are not likely to involve the same pathways linking short sleep and obesity [ 16, 18– 20 ] . The majority of studies reporting a signi fi cant association between long
sleep and obesity were based on self-reported sleep duration, and it has been argued that long sleepers may be spending more time in bed with-out obtaining more sleep. Another putative explanation could be that a subset of obese indi-viduals suffer from fatigue associated with a sub-clinical condition and spend more time in bed. A further possible explanation is that long sleep may be associated with reduced physical activity and that therefore the association between long sleep and obesity would not persist when adjust-ing for physical activity. The present chapter focuses on the fi ndings relating short sleep, obe-sity, and diabetes.
To date, more than 60 epidemiological studies from different geographical regions have exam-ined the association between sleep duration and obesity in adults. In cross-sectional approaches, the vast majority of studies found a signi fi cant association between SSD (generally < 6 h per night) and BMI or prevalence of obesity and/or overweight. A systematic review of prospective studies provides similar, albeit not as consistent results, revealing an association with being a short sleeper at baseline and weight gain or the incidence of obesity during the follow-up period.
Fig. 10.1 Trends of sleep duration and obesity prevalence in the US population from 1960 to the fi rst decade of the twenty- fi rst century. The sleep duration estimates have been derived from McAllister et al. [ 13 ] . US obesity prevalence is from Centers for Disease Control and Prevention ( http://www.cdc.gov/obesity/ )
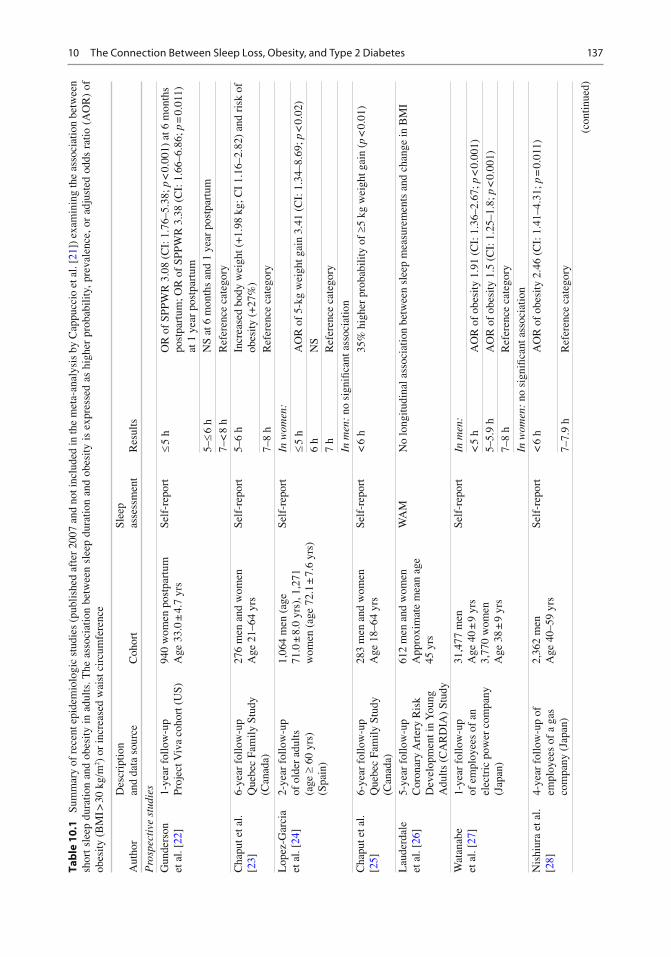
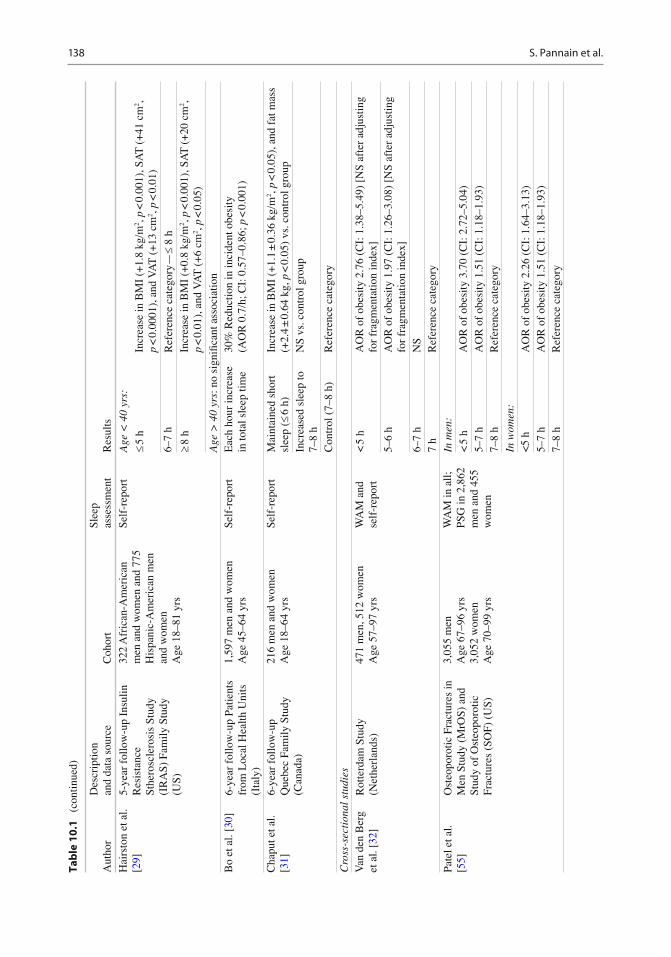
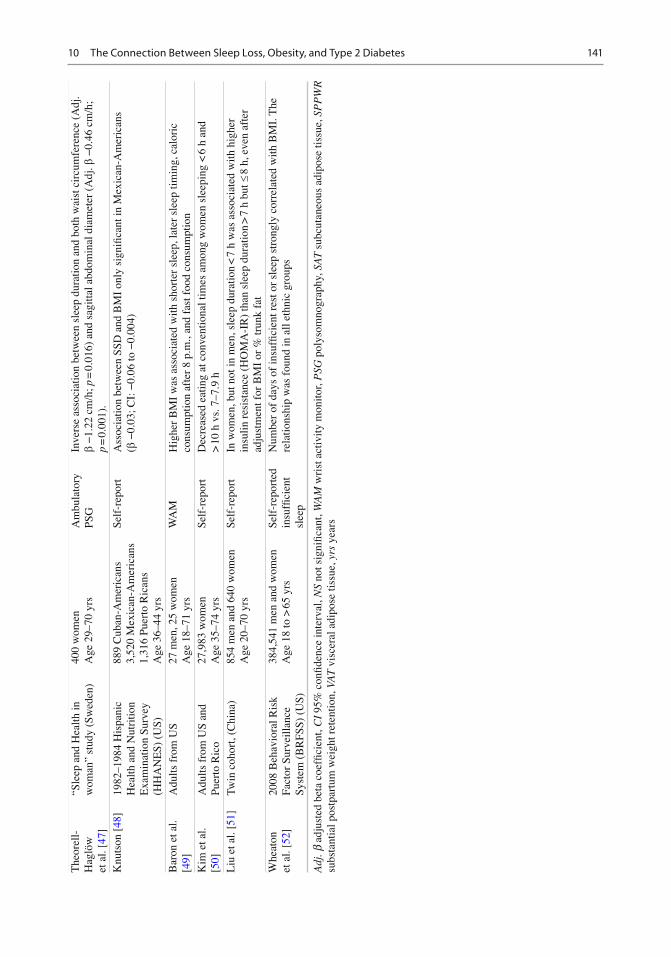
A meta-analysis published in 2008 combined data from 18 cross-sectional studies including 604,509 adults from 12 different countries and demonstrated a pooled obesity odds ratio (OR) of 1.55 (CI: 1.43–1.68; p < 0.0001) for sleep dura-tions <5 h as compared to 7–8 h [ 21 ] . A dose–response effect became apparent such that for each additional hour of sleep, the BMI decreased by 0.35 kg/m 2 (95% confi dence interval – CI: −0.57 to −0.12), which would translate to a 1.4 kg decrease in weight in an individual of 178 cm of height. This study represents the fi rst systematic review and meta-analysis of the population-based studies published up to 2008 and demonstrates a consistent association between sleep duration and obesity in different populations around the world. Direction of causality cannot be inferred from these cross-sectional studies. Table 10.1 summarizes the prospective and cross-sectional epidemiologic studies published since 2008, which were not included in the meta-analysis by Cappuccio et al. [ 21 ] . We were able to identify 31 such studies, of which 10 involved a longitudinal analysis. Only one of the ten prospective studies had negative fi ndings [ 46 ] . In the cross-sectional studies, all but one study found a signi fi cant asso-ciation between short sleep and obesity, although signi fi cance was not always found for subsets of subjects (e.g., in men vs. women or conversely). The studies originated from all over the world and involve diverse adult populations.
In sum, the number of concordant studies lends strong support to the hypothesis that SSD may indeed represent a risk factor for obesity. One caveat is that the vast majority of studies have assessed sleep duration by self-report with only fi ve studies so far using objective assess-ment by WAM and/or PSG. Further, in the major-ity of studies, there was no information regarding the cause for short sleep, i.e., voluntary bedtime curtailment or biologic inability to obtain more sleep. As shown later in this chapter, laboratory studies where sleep was restricted experimentally in healthy lean volunteers and appetite regulation and/or food intake were examined offer some indication regarding the direction of causality. Intervention studies involving sleep extension in
short sleepers will be important to further support a causative role for short sleep on the risk of obe-sity. A National Institute of Health (NIH)-funded randomized control trial [ 53 ] has enrolled 150 US short sleeper adults (< 6.5 h per night) to examine the feasibility of increasing sleep duration to a healthy length (approximately 7.5 h) and to deter-mine the effect of sleep extension on body weight. The fi ndings have not yet been published.
In the subsequent subsections, we discuss the fi ndings of the studies that have used objective assessments of sleep duration and then summa-rize the state of knowledge regarding the possi-bility of sex differences in the relationship between sleep and obesity. We then brie fl y dis-cuss studies that have addressed the impact of genetics and race/ethnicity. Lastly, we review the few studies that have examined the contribution of dietary habits to the relationship between SSD and obesity risk.
Studies Using Objective Measurements of Sleep Duration
When examining epidemiologic studies, one concern is that comparative studies have shown that self-reported sleep duration correlates only moderately with more objective estimations of sleep duration such as those derived from WAM or PSG, and that self-report may overestimate the amount of sleep [ 11, 54 ] . A discrepancy between self-report and sleep duration derived from WAM has been con fi rmed in the Rotterdam Study, a population-based cohort of elderly adults [ 32 ] . In that cohort, men overestimated sleep duration by self-report by 0.61 h, while the difference between self-reported and measured sleep durations was only 0.14 h for women. The possibility of a sys-tematic bias in the estimation of the relationship between sleep duration and obesity was sug-gested by Lauderdale et al. who noted that obese persons tend to report shorter sleep duration for the same amount of objectively assessed sleep than non-obese individuals [ 26 ] .
To date, only fi ve studies have used objective methods to assess sleep duration in population
13710 The Connection Between Sleep Loss, Obesity, and Type 2 Diabetes
Tab
le 1
0.1
Su
mm
ary
of r
ecen
t epi
dem
iolo
gic
stud
ies
(pub
lishe
d af
ter
2007
and
not
incl
uded
in th
e m
eta-
anal
ysis
by
Cap
pucc
io e
t al.
[ 21 ]
) ex
amin
ing
the
asso
ciat
ion
betw
een
shor
t sl
eep
dura
tion
and
obes
ity i
n ad
ults
. The
ass
ocia
tion
betw
een
slee
p du
ratio
n an
d ob
esity
is
expr
esse
d as
hig
her
prob
abili
ty, p
reva
lenc
e, o
r ad
just
ed o
dds
ratio
(A
OR
) of
ob
esity
(B
MI >
30
kg/m
2 ) o
r in
crea
sed
wai
st c
ircu
mfe
renc
e
Aut
hor
Des
crip
tion
and
data
sou
rce
Coh
ort
Slee
p as
sess
men
t R
esul
ts
Pro
spec
tive
stu
dies
G
unde
rson
et
al.
[ 22 ]
1-
year
fol
low
-up
Proj
ect V
iva
coho
rt (
US)
94
0 w
omen
pos
tpar
tum
A
ge 3
3.0
± 4.
7 yr
s Se
lf-r
epor
t £
5 h
OR
of
SPPW
R 3
.08
(CI:
1.7
6–5.
38; p
< 0
.001
) at
6 m
onth
s po
stpa
rtum
; OR
of
SPPW
R 3
.38
(CI:
1.6
6–6.
86; p
= 0
.011
) at
1 y
ear
post
part
um
5– £
6 h
NS
at 6
mon
ths
and
1 ye
ar p
ostp
artu
m
7–<
8 h
R
efer
ence
cat
egor
y C
hapu
t et a
l. [ 2
3 ]
6-ye
ar f
ollo
w-u
p Q
uebe
c Fa
mily
Stu
dy
(Can
ada)
276
men
and
wom
en
Age
21–
64 y
rs
Self
-rep
ort
5–6
h In
crea
sed
body
wei
ght (
+ 1.
98 k
g ; C
I 1.
16–2
.82)
and
ris
k of
ob
esity
(+
27%
) 7–
8 h
Ref
eren
ce c
ateg
ory
Lop
ez-G
arci
a et
al.
[ 24 ]
2-
year
fol
low
-up
of o
lder
adu
lts
(age
³ 6
0 yr
s)
(Spa
in)
1,06
4 m
en (
age
71.0
± 8
.0 y
rs),
1,2
71
wom
en (
age
72.1
± 7
.6 y
rs)
Self
-rep
ort
In w
omen
:
£ 5
h A
OR
of
5-kg
wei
ght g
ain
3.41
(C
I: 1
.34–
8.69
; p <
0.0
2)
6 h
NS
7 h
Ref
eren
ce c
ateg
ory
In m
en:
no s
igni
fi can
t ass
ocia
tion
Cha
put e
t al.
[ 25 ]
6-
year
fol
low
-up
Que
bec
Fam
ily S
tudy
(C
anad
a)
283
men
and
wom
en
Age
18–
64 y
rs
Self
-rep
ort
< 6
h
35%
hig
her
prob
abili
ty o
f ³ 5
kg
wei
ght g
ain
( p <
0.0
1)
Lau
derd
ale
et a
l. [ 2
6 ]
5-ye
ar f
ollo
w-u
p C
oron
ary
Art
ery
Ris
k D
evel
opm
ent i
n Y
oung
A
dults
(C
AR
DIA
) St
udy
612
men
and
wom
en
App
roxi
mat
e m
ean
age
45 y
rs
WA
M
No
long
itudi
nal a
ssoc
iatio
n be
twee
n sl
eep
mea
sure
men
ts a
nd c
hang
e in
BM
I
Wat
anab
e et
al.
[ 27 ]
1-
year
fol
low
-up
of
em
ploy
ees
of a
n el
ectr
ic p
ower
com
pany
(J
apan
)
31,4
77 m
en
Age
40
± 9
yrs
3,77
0 w
omen
A
ge 3
8 ±
9 yr
s
Self
-rep
ort
In m
en:
< 5
h
AO
R o
f ob
esity
1.9
1 (C
I: 1
.36–
2.67
; p <
0.0
01)
5–5.
9 h
AO
R o
f ob
esity
1.5
(C
I: 1
.25–
1.8;
p <
0.0
01)
7–8
h R
efer
ence
cat
egor
y In
wom
en:
no s
igni
fi can
t ass
ocia
tion
Nis
hiur
a et
al.
[ 28 ]
4-
year
fol
low
-up
of
empl
oyee
s of
a g
as
com
pany
(Ja
pan)
2,36
2 m
en
Age
40–
59 y
rs
Self
-rep
ort
< 6
h
AO
R o
f ob
esity
2.4
6 (C
I: 1
.41–
4.31
; p =
0.0
11)
7–7.
9 h
Ref
eren
ce c
ateg
ory
(con
tinue
d)
138 S. Pannain et al.
Tab
le 1
0.1
(c
ontin
ued)
Aut
hor
Des
crip
tion
and
data
sou
rce
Coh
ort
Slee
p as
sess
men
t R
esul
ts
Hai
rsto
n et
al.
[ 29 ]
5-
year
fol
low
-up
Insu
lin
Res
ista
nce
Sthe
rosc
lero
sis
Stud
y (I
RA
S) F
amily
Stu
dy
(US)
322
Afr
ican
-Am
eric
an
men
and
wom
en a
nd 7
75
His
pani
c-A
mer
ican
men
an
d w
omen
A
ge 1
8–81
yrs
Self
-rep
ort
Age
< 4
0 yr
s:
£ 5
h In
crea
se in
BM
I (+
1.8
kg/m
2 , p
< 0
.001
), S
AT
(+
41 c
m 2 ,
p <
0.0
001)
, and
VA
T (
+ 13
cm
2 , p
< 0
.01)
6–
7 h
Ref
eren
ce c
ateg
ory—
£ 8
h
³ 8
h In
crea
se in
BM
I (+
0.8
kg/m
2 , p
< 0
.001
), S
AT
(+
20 c
m 2 ,
p <
0.0
1), a
nd V
AT
(+
6 cm
2 , p
< 0
.05)
A
ge >
40
yrs:
no
sign
ifi ca
nt a
ssoc
iatio
n B
o et
al.
[ 30 ]
6-
year
fol
low
-up
Patie
nts
from
Loc
al H
ealth
Uni
ts
(Ita
ly)
1,59
7 m
en a
nd w
omen
A
ge 4
5–64
yrs
Se
lf-r
epor
t E
ach
hour
incr
ease
in
tota
l sle
ep ti
me
30%
Red
uctio
n in
inci
dent
obe
sity
(A
OR
0.7
/h ; C
I: 0
.57–
0.86
; p <
0.0
01)
Cha
put e
t al.
[ 31 ]
6-
year
fol
low
-up
Que
bec
Fam
ily S
tudy
(C
anad
a)
216
men
and
wom
en
Age
18–
64 y
rs
Self
-rep
ort
Mai
ntai
ned
shor
t sl
eep
( £ 6
h)
Incr
ease
in B
MI
(+ 1.
1 ±
0.36
kg/
m 2 ,
p <
0.0
5), a
nd f
at m
ass
(+ 2.
4 ±
0.64
kg ,
p <
0.0
5) v
s. c
ontr
ol g
roup
In
crea
sed
slee
p to
7–
8 h
NS
vs. c
ontr
ol g
roup
Con
trol
(7–
8 h)
R
efer
ence
cat
egor
y C
ross
-sec
tion
al s
tudi
es
Van
den
Ber
g et
al.
[ 32 ]
R
otte
rdam
Stu
dy
(Net
herl
ands
) 47
1 m
en, 5
12 w
omen
A
ge 5
7–97
yrs
W
AM
and
se
lf-r
epor
t <
5 h
A
OR
of
obes
ity 2
.76
(CI:
1.3
8–5.
49)
[NS
afte
r ad
just
ing
for
frag
men
tatio
n in
dex]
5–
6 h
AO
R o
f ob
esity
1.9
7 (C
I: 1
.26–
3.08
) [N
S af
ter
adju
stin
g fo
r fr
agm
enta
tion
inde
x]
6–7
h N
S 7
h R
efer
ence
cat
egor
y Pa
tel e
t al.
[ 55 ]
O
steo
poro
tic F
ract
ures
in
Men
Stu
dy (
MrO
S) a
nd
Stud
y of
Ost
eopo
rotic
Fr
actu
res
(SO
F) (
US)
3,05
5 m
en
Age
67–
96 y
rs
3,05
2 w
omen
A
ge 7
0–99
yrs
WA
M in
all;
PS
G in
2,8
62
men
and
455
w
omen
In m
en:
< 5
h
AO
R o
f ob
esity
3.7
0 (C
I: 2
.72–
5.04
) 5–
7 h
AO
R o
f ob
esity
1.5
1 (C
I: 1
.18–
1.93
) 7–
8 h
Ref
eren
ce c
ateg
ory
In w
omen
: <
5 h
AO
R o
f ob
esity
2.2
6 (C
I: 1
.64–
3.13
) 5–
7 h
AO
R o
f ob
esity
1.5
1 (C
I: 1
.18–
1.93
) 7–
8 h
Ref
eren
ce c
ateg
ory
13910 The Connection Between Sleep Loss, Obesity, and Type 2 Diabetes A
utho
r D
escr
iptio
n an
d da
ta s
ourc
e C
ohor
t Sl
eep
asse
ssm
ent
Res
ults
Vgo
ntza
s et
al.
[ 33 ]
Pe
nn S
tate
Coh
ort (
US)
56
1 m
en
Age
50.
8 ±
12.6
yrs
73
9 w
omen
A
ge 5
4.9
± 13
.6 y
rs
Self
-rep
ort
Com
pare
d to
the
grou
p of
sub
ject
s w
ho s
lept
> 6
and
£ 7
h, B
MI
decr
ease
d pr
opor
tiona
lly to
incr
ease
d sl
eep
for
thos
e w
ho s
lept
less
( p
< 0
.05)
. BM
I re
mai
ned
sim
ilar
for
thos
e w
ho s
lept
mor
e (N
S).
Hal
l et a
l. [ 3
4 ]
Adu
lt H
ealth
and
B
ehav
ior
Proj
ect r
egis
try
(US)
568
men
, 646
wom
en
83.7
% N
on-H
ispa
nic
Cau
casi
an
Age
45
± 7
yrs
Self
-rep
ort
< 6
h
AO
R o
f ce
ntra
l adi
posi
ty 1
.73
(CI:
1.2
1–2.
57)
6–7
h A
OR
of
cent
ral a
dipo
sity
1.6
4 (C
I: 1
.22–
2.20
) 7–
8 h
Ref
eren
ce c
ateg
ory
Cho
i et a
l. [ 3
5 ]
2001
Kor
ean
Nat
iona
l H
ealth
and
Nut
ritio
n Su
rvey
(KN
HN
S) (K
orea
)
1,82
2 m
en, 2
,400
wom
en
Age
44.
1 ±
0.4
yrs
Self
-rep
ort
£ 5
h Pr
eval
ence
of
abdo
min
al o
besi
ty 4
1.4%
(C
I: 3
5.9–
47.2
)
6 h
Prev
alen
ce o
f ab
dom
inal
obe
sity
31.
5% (
CI:
28.
4–34
.8)
7 h
Prev
alen
ce o
f ab
dom
inal
obe
sity
29.
2% (
CI:
26.
5–32
.2)
Lop
ez-G
arci
a et
al.
[ 24 ]
O
lder
adu
lts
(age
³ 6
0 yr
s)
from
Spa
in
1,73
9 m
en, 2
,269
wom
en
Age
71.
6 ±
7.7
yrs
Self
-rep
ort
£ 5
h A
OR
of
obes
ity 1
.33
(CI:
1.0
0–1.
77; p
< 0
.005
) an
d se
vere
ob
esity
2.0
8 (C
I: 1
.31–
3.32
; p <
0.0
04)
6 h
NS
7 h
Ref
eren
ce c
ateg
ory
Park
et a
l. [ 3
6 ]
2001
and
200
5 K
NH
NS
(Kor
ea)
3,72
3 m
en, 4
,994
wom
en
Age
20–
65 y
rs
Self
-rep
ort
£ 5
h A
OR
of
gene
ral o
besi
ty 1
.24
(CI:
1.0
5–1.
47)
and
abdo
mi-
nal o
besi
ty 1
.22
(CI:
1.0
1–1.
47)
6 h
AO
R o
f ge
nera
l obe
sity
1.1
6 (C
I: 1
.02–
1.31
) an
d ab
dom
i-na
l obe
sity
NS
7 h
Ref
eren
ce c
ateg
ory
Cha
put e
t al.
[ 25 ]
Q
uebe
c Fa
mily
Stu
dy
(Can
ada)
C
ross
-sec
tiona
l ana
lysi
s:
537
men
and
wom
en
Age
18–
64 y
rs
Self
-rep
ort
< 6
h
6% n
on-o
bese
vs.
30.
1% o
verw
eigh
t/obe
se, O
R 4
.66
(CI:
2.
98–6
.48)
, p <
0.0
1
³ 7
h N
S
Lau
derd
ale
et a
l. [ 2
6 ]
CA
RD
IA S
tudy
(U
SA)
612
men
and
wom
en
App
roxi
mat
e m
ean
age
45 y
rs
WA
M
With
incr
easi
ng c
ateg
ory
of s
leep
dur
atio
n (<
4.5
h, 4
.5–6
h, 6
–7.5
h, ³
7.5
h),
th
ere
was
a 0
.78
kg/m
2 dec
reas
e in
BM
I
St O
nge
et a
l. [ 3
7 ]
CA
RD
IA s
tudy
(U
SA)
3,47
3 m
en a
nd w
omen
A
ge 3
3–45
yrs
Se
lf-r
epor
t N
o as
soci
atio
ns b
etw
een
slee
p m
easu
rem
ents
and
BM
I w
hen
cont
rolle
d fo
r ph
ysic
al a
ctiv
ity.
Ada
mko
va
et a
l. [ 3
8 ]
Adu
lts f
rom
Cze
ch
Rep
ublic
2,
038
men
, 1,9
32 w
omen
A
ge 1
8–65
yrs
Se
lf-r
epor
t 4–
6 h
BM
I 27
.46
± 4.
919
7 h
BM
I 25
.40
± 4.
201
p <
0.0
01 f
or tr
end
8–11
B
MI
25.1
8 ±
4.86
8 D
i Mili
a et
al.
[ 39 ]
E
mpl
oyee
s in
coa
l in
dust
ry a
nd u
nive
rsity
(A
ustr
alia
)
292
men
, 59
wom
en
Age
41
± 11
yrs
Se
lf-r
epor
t A
OR
of
obes
ity 2
.05
(CI:
1.0
3–3.
55, p
0.0
5) f
or <
6 h
sle
ep
(con
tinue
d)
140 S. Pannain et al.
Tab
le 1
0.1
(c
ontin
ued)
Aut
hor
Des
crip
tion
and
data
sou
rce
Coh
ort
Slee
p as
sess
men
t R
esul
ts
Tho
mas
et a
l. [ 4
0 ]
EA
DS/
Aug
sbur
g co
hort
st
udy
(Ger
man
y)
1,04
7 m
en, 1
16 w
omen
A
ge 3
9 ±
11 y
rs
Self
-rep
ort
Sign
i fi ca
nt a
ssoc
iatio
n be
twee
n sl
eep
dura
tion
and
BM
I ( b
st =
−0.
06, p
= 0
.04)
w
hen
dem
ogra
phic
, hea
lth b
ehav
ior,
and
wor
k st
atus
var
iabl
es w
ere
incl
uded
W
atso
n et
al.
[ 41 ]
U
nive
rsity
of
Was
hing
ton
Twin
Reg
istr
y (U
S)
1,22
4 tw
ins:
423
m
onoz
ygot
ic, 1
43
dizy
gotic
, and
46
pair
s of
un
know
n zy
goci
ty
Mea
n ag
e 36
.9 y
rs
Self
-rep
ort
Diz
ygot
ic p
airs
dis
cord
ant f
or s
leep
dur
atio
n ( n
= 5
7): n
o B
MI
diff
eren
ce.
Mon
ozyg
otic
pai
rs d
isco
rdan
t for
sle
ep d
urat
ion
( n =
167
):
< 7
h
Hig
her
mea
n B
MI
( p <
0.0
2)
7–8.
9 h
Ref
eren
ce c
ateg
ory
Bux
ton
et a
l. [ 4
2 ]
Nat
iona
l Hea
lth I
nter
view
Su
rvey
(U
S)
56,5
07 m
en a
nd w
omen
A
ge 1
8–85
yrs
Se
lf-r
epor
t <
7 h
6%
Hig
her
prob
abili
ty o
f ob
esity
7–
8 h
Ref
eren
ce c
ateg
ory
Mag
ee e
t al.
[ 43 ]
“4
5 an
d U
P St
udy”
(A
ustr
alia
) 40
,834
men
and
wom
en
Age
45–
65 y
rs
Self
-rep
ort
In m
en:
< 6
h
AO
R o
f ob
esity
1.7
2 (C
I: 1
.34–
2.20
; p <
0.0
17)
6 h
AO
R o
f ob
esity
1.5
1 (C
I: 1
.32–
1.73
; p <
0.0
17)
7 h
Ref
eren
ce c
ateg
ory
In w
omen
:
< 6
h
AO
R o
f ob
esity
1.4
2 (C
I: 1
.16–
1.75
; p <
0.0
17)
6 h
AO
R o
f ob
esity
1.3
5 (C
I: 1
.19–
1.52
; p <
0.0
17)
7 h
Ref
eren
ce c
ateg
ory
Mag
ee e
t al.
[ 44 ]
“4
5 an
d U
P St
udy”
(A
ustr
alia
) 45
,325
men
and
wom
en
Age
55–
95 y
rs
Self
-rep
ort
Age
55–
64 y
rs:
< 6
h
AO
R o
besi
ty 1
.52
(CI:
1.2
1–1.
89; p
< 0
.001
) 6
h A
OR
obe
sity
1.4
2 (C
I: 1
.26–
1.61
; p <
0.0
01)
7 h
Ref
eren
ce c
ateg
ory
Age
> 6
5 yr
s: n
o si
gnifi
cant
ass
ocia
tion
Mag
ee e
t al.
[ 45 ]
“4
5 an
d U
P St
udy”
(A
ustr
alia
) 16
,951
men
and
wom
en,
full
time
wor
kers
A
ge 4
5–65
yrs
Self
-rep
ort
Inve
rse
asso
ciat
ion
betw
een
slee
p du
ratio
n an
d B
MI
( p <
0.0
01)
Ani
c et
al.
[ 46 ]
C
olla
bora
tive
Bre
ast
Can
cer
Stud
y (U
S)
5,54
9 w
omen
A
ge 2
0–75
yrs
Se
lf-r
epor
t <
6 h
A
OR
obe
sity
1.8
9 (C
I: 1
.45–
2.47
; p <
0.0
001)
; A
OR
ext
rem
e ob
esity
3.1
2 (C
I: 1
.70–
5.75
; p =
0.0
003)
6–
6.9
h A
OR
obe
sity
1.5
2 (C
I: 1
.23–
1.89
; p =
0.0
003)
; A
OR
ext
rem
e ob
esity
2.2
2 (C
I: 1
.27–
3.87
; p =
0.0
003)
7–
7.9
h R
efer
ence
cat
egor
y
14110 The Connection Between Sleep Loss, Obesity, and Type 2 Diabetes A
utho
r D
escr
iptio
n an
d da
ta s
ourc
e C
ohor
t Sl
eep
asse
ssm
ent
Res
ults
The
orel
l-H
aglö
w
et a
l. [ 4
7 ]
“Sle
ep a
nd H
ealth
in
wom
an”
stud
y (S
wed
en)
400
wom
en
Age
29–
70 y
rs
Am
bula
tory
PS
G
Inve
rse
asso
ciat
ion
betw
een
slee
p du
ratio
n an
d bo
th w
aist
cir
cum
fere
nce
(Adj
. b
−1.
22 c
m/h
; p =
0.0
16)
and
sagi
ttal a
bdom
inal
dia
met
er (
Adj
. b −
0.46
cm
/h;
p =
0.0
01).
K
nuts
on [
48 ]
1982
–198
4 H
ispa
nic
Hea
lth a
nd N
utri
tion
Exa
min
atio
n Su
rvey
(H
HA
NE
S) (
US)
889
Cub
an-A
mer
ican
s 3,
520
Mex
ican
-Am
eric
ans
1,31
6 Pu
erto
Ric
ans
Age
36–
44 y
rs
Self
-rep
ort
Ass
ocia
tion
betw
een
SSD
and
BM
I on
ly s
igni
fi can
t in
Mex
ican
-Am
eric
ans
( b −
0.03
; CI:
−0.
06 to
−0.
004)
Bar
on e
t al.
[ 49 ]
A
dults
fro
m U
S 27
men
, 25
wom
en
Age
18–
71 y
rs
WA
M
Hig
her
BM
I w
as a
ssoc
iate
d w
ith s
hort
er s
leep
, lat
er s
leep
tim
ing,
cal
oric
co
nsum
ptio
n af
ter
8 p.
m.,
and
fast
foo
d co
nsum
ptio
n K
im e
t al.
[ 50 ]
A
dults
fro
m U
S an
d Pu
erto
Ric
o 27
,983
wom
en
Age
35–
74 y
rs
Self
-rep
ort
Dec
reas
ed e
atin
g at
con
vent
iona
l tim
es a
mon
g w
omen
sle
epin
g <
6 h
and
>
10
h vs
. 7–7
.9 h
L
iu e
t al.
[ 51 ]
Tw
in c
ohor
t, (C
hina
) 85
4 m
en a
nd 6
40 w
omen
A
ge 2
0–70
yrs
Se
lf-r
epor
t In
wom
en, b
ut n
ot in
men
, sle
ep d
urat
ion
< 7
h w
as a
ssoc
iate
d w
ith h
ighe
r in
sulin
res
ista
nce
(HO
MA
-IR
) th
an s
leep
dur
atio
n >
7 h
but
£ 8
h, e
ven
afte
r ad
just
men
t for
BM
I or
% tr
unk
fat
Whe
aton
et
al.
[ 52 ]
20
08 B
ehav
iora
l Ris
k Fa
ctor
Sur
veill
ance
Sy
stem
(B
RFS
S) (
US)
384,
541
men
and
wom
en
Age
18
to >
65
yrs
Self
-rep
orte
d in
suf fi
cien
t sl
eep
Num
ber
of d
ays
of in
suf fi
cien
t res
t or
slee
p st
rong
ly c
orre
late
d w
ith B
MI.
The
re
latio
nshi
p w
as f
ound
in a
ll et
hnic
gro
ups
Adj
. b a
djus
ted
beta
coe
f fi ci
ent,
CI
95%
con
fi den
ce in
terv
al, N
S no
t sig
ni fi c
ant,
WA
M w
rist
act
ivit
y m
onit
or, P
SG p
olys
omno
grap
hy, S
AT
sub
cuta
neou
s ad
ipos
e ti
ssue
, SP
PW
R
subs
tant
ial p
ostp
artu
m w
eigh
t ret
entio
n, V
AT
vis
cera
l adi
pose
tiss
ue, y
rs y
ears
142 S. Pannain et al.
studies. A 2008 study by Van den Berg et al. recorded sleep by WAM in 983 participant of the Rotterdam Study of Aging and found that both short sleepers and long sleepers were more likely to be obese, compared to participants who slept 7 to < 8 h [ 32 ] . BMI also increased with sleep fragmentation. After adjustment for sleep frag-mentation, the relationship between short sleep and BMI was no longer signi fi cant whereas it remained signi fi cant for long sleep. Of note, in this cohort of elderly participants, self-reported habitual sleep duration was not associated with BMI or obesity, further suggesting that self-reported sleep duration may not correctly esti-mate actual sleep duration. The largest study based on objective sleep assessments was pub-lished by Patel et al. who analyzed WAM record-ings from a cohort of elderly men ( n = 3,055; age: 67–96 years) and women ( n = 3,052; age: 70–99 years) participating in the Osteoporotic Fracture Study [ 55 ] . As summarized in Table 10.1 , the study had positive fi ndings in both men and women. The special interest of this cross-sectional study is that a subgroup of 2,862 men and 455 women also underwent a PSG study to assess the presence and severity of sleep apnea. Compared to those sleeping an average of 7–8 h per night, sleep duration (based on WAM) < 5 h was associ-ated with a BMI on average 2.5 kg/m 2 greater in men and 1.8 kg/m 2 greater in women. Additionally the odds of obesity were 3.7-fold greater in men and 2.3-fold greater in women who slept < 5 h. These associations persisted after adjusting for the severity of sleep apnea as assessed by the Apnea Hypopnea Index (AHI), insomnia and daytime sleepiness. This remarkable study was the fi rst to demonstrate that the association between sleep duration and obesity is in part dependent on the presence and severity of sleep apnea but persists after controlling for AHI or when limiting the analysis to participants without signi fi cant sleep apnea. While the fi ndings sug-gest that the association between short sleep and obesity may be stronger in men, a direct compari-son is not possible as the women were nearly a decade older than the men. An additional unique
contribution of this study is the demonstration that the impact of reduced sleep times (assessed objectively) on obesity risk is also present in older populations. This is in contrast with other reports that assessed sleep duration by self-report and indicated that short sleep may not be rele-vant to obesity risk in older populations [ 29, 44, 56 ] . The CARDIA Sleep Study assessed sleep by WAM for 6 days and involved both a cross-sectional and a longitudinal analysis [ 26 ] . The cross-sectional analysis con fi rmed the associa-tion between SSD and higher BMI reported in previous studies (0.78 kg/m 2 decrease in BMI for each increasing sleep duration category). Greater sleep fragmentation was also associated with higher BMI. The presence of snoring (by self-report) signi fi cantly affected the cross-sectional association such that the sleep duration-BMI association observed across the entire sample was stronger among the participants who reported snoring. This fi nding suggests that obesity-related comorbidities such as OSA may affect sleep duration or conversely that OSA has an independent effect on obesity risk. The prospec-tive analysis did not fi nd an association between sleep duration and weight change over the 5-year follow-up [ 26 ] . A small actigraphy-based study by Baron et al. [ 49 ] was innovative as it looked not only at sleep duration but also sleep timing. Sleep duration was a signi fi cant predictor of BMI while sleep timing did not predict BMI after con-trolling for sleep duration. Calories consumed after 8 p.m. predicted BMI after controlling for sleep timing and duration, suggesting that eve-ning eating may promote obesity risk, consistent with fi ndings from animal models. Lastly, a study by Theorell-Haglöw et al. performed a PSG in 400 women (aged 29–70 years) participants in the Sleep and Health in Women Study [ 47 ] . Sleep duration was inversely related to waist circum-ference, after adjusting for multiple confound-ers, including AHI. This study is consistent with the fi ndings of Patel et al. [ 55 ] who found that the association between short sleep and obesity is not entirely dependent on the presence and severity of OSA.
14310 The Connection Between Sleep Loss, Obesity, and Type 2 Diabetes
Sex Differences in the Relationship Between Sleep and Obesity Risk
Sex differences in sleep duration and quality have been well documented. Women have more sleep complaints, particularly insomnia, but are much less likely to have OSA than men. Somewhat paradoxically, objective sleep duration and the amount and intensity of non-REM sleep are higher in women than in men. There are also well-established sex differences in eating behav-ior. It is therefore logical that the relationship between sleep duration and obesity risk may be sex-dependent. So far, the studies that have addressed this issue have had contradictory or inconclusive results. Of note, all these studies assessed sleep duration by self-report.
Two prospective studies [ 24, 27 ] and three cross-sectional studies [ 45, 51, 55 ] have explic-itly addressed sex differences. A few additional studies have included women only.
A prospective study conducted in Spain reported that women reporting sleeping <5 h per night had increased odds of gaining 5 kg or more over the following 2 years compared to those who reported sleeping 7 h per night. This associa-tion was not found in men [ 24 ] . Contrasting with these fi ndings, a Japanese prospective study with a 1-year follow-up showed that the increased risk of obesity for self-described short sleepers was present in men but not in women [ 27 ] . In this lat-ter study, the lack of a signi fi cant fi nding in women could be due to the small sample size. Vgontzas et al. in a cross-sectional analysis found a negative linear relationship between hours of sleep duration and BMI. When the analysis was strati fi ed by sex, the association was signi fi cant only for men [ 33 ] . An analysis of the CARDIA Sleep Study indicated the existence of an inverse relationship between reported sleep duration and BMI in both sex groups, but in unadjusted analy-ses, the fi ndings appeared more robust in women than in men [ 26 ] . Liu et al. were the fi rst to exam-ine the gender-speci fi c association of sleep dura-tion with body composition as assessed by Dual-emission X-ray absorptiometry (DXA) [ 51 ] . To adjust for the decrease of sleep duration
with age, age-speci fi c quartiles of sleep duration were considered. Additionally the analysis also considered sleep quality factors such as sleep dis-turbance and habitual snoring. Women in the lowest quartile of short-sleep duration had higher overall and central adiposity and lower lean body mass when compared to those with moderate sleep duration (second and third quartiles). The association persisted after excluding subjects who reported either habitual snoring or sleep dis-turbance, suggesting that the sleep duration itself is a potential determinant of increased adiposity. A similar association was not found in men.
Four studies up to date have included only women [ 22, 46, 47, 50 ] and all four had positive fi ndings linking short sleep with obesity risk. Gunderson et al. found that women who reported shorter sleep duration ( £ 5 h within a 24-h period) at 6 months postpartum were 2.3 times more likely to retain at 1 year substantial postpartum weight ( ³ 5 kg above pre-pregnancy weight) independent of potential confounders including maternal socio-demographics, pre-pregnancy BMI, gestational weight gain, parity, and postpartum behaviors [ 22 ] . Additionally, women who reported a reduc-tion in hours of sleep at 1 year postpartum were two times more likely to have substantial postpar-tum weight retention. The study from Theorell-Haglöw et al. performed a PSG in 400 participants (aged 29–70 years) in the Sleep and Health in Women Study [ 47 ] . Not only sleep duration but also sleep quality, as determined by sleep ef fi ciency and sleep architecture (speci fi cally minutes of SWS, the “deep restorative sleep”), was inversely related to waist circumference, after adjusting for age, level of physical activity, smoking status, alcohol consumption, and AHI. Associations were stronger in age <50 years. In a cohort of 5,549 US adult women of similar age range, Anic et al. con fi rmed an association between SSD and obe-sity [ 46 ] . The association was stronger in partici-pants with morbid obesity [ 46 ] . The analysis explored a possible causal relationship by examin-ing the association between lifetime sleep dura-tion (possibly preceding the onset of obesity) and obesity and found a weaker association than with sleep duration measured during the study. The
144 S. Pannain et al.
authors tentatively concluded that short sleep might have been the consequence of obesity. However, self-reported measures of lifetime sleep duration may be poorly reliable and have never been validated. Lastly, Kim et al. collected infor-mation about eating behavior and source of calo-ries and correlated to various sleep categories in a cohort of nearly 28,000 women only [ 50 ] . SSD was associated with disrupted eating patterns and poor food choices, and thus potentially to a risk of weight gain and obesity.
Impact of Genetic Factors and Race/Ethnicity
A recent study examined self-reported sleep dura-tion and BMI in 1,224 twins (423 monozygotic, 143 dizygotic, and 46 indeterminate pairs), mean age 36.9 years [ 41 ] . In a multivariate adjusted analysis including all twins, the mean BMI was found to be 1.2 kg/m 2 higher in short sleeping twins (< 7 h/night) compared to twins sleeping 7–8.9 h per night. The novelty of this study lies in the within-pair analyses. Even when restricted to monozygotic twins, the short sleeping member of the pair had a signi fi cantly elevated BMI by 1.0 kg/m 2 compared to the reference group. The persistence of the association within individuals with an identical genetic background supports the hypothesis that behavioral curtailment of sleep, rather than genetic factors, drives the asso-ciation. Bivariate analysis revealed little evidence of shared genetics between sleep duration and BMI. Consistent fi ndings were reported in a twin study of a Chinese rural population where herita-bility of sleep duration appeared to be primarily determined by environmental factors whereas heritability of body composition (assessed by DXA) had a strong genetic component [ 51 ] .
In a cross-sectional analysis of the CARDIA Sleep Study which by design enrolled similar proportions of middle-aged White and African-American men and women, a signi fi cant relation-ship between objective sleep duration based on WAM and BMI emerged, and this association did not vary by race/sex groups [ 26 ] . Another pro-spective study by Hairston et al. focused on minorities (322 African-Americans and 775
Hispanic Americans men and women) known to be at higher risk of metabolic disorders, and used abdominal computer tomography scans to evalu-ate visceral and subcutaneous adipose tissue (VAT and SAT, respectively) [ 29 ] . After control-ling for multiple confounders, short sleep ( £ 5 h) was associated with greater fat accumulation over the 5-year follow-up with increased BMI (+1.8 kg/m 2 , p < 0.001), SAT (+41 cm 2 , p < 0.0001), and VAT (+13 cm 2 , p < 0.01) as com-pared to > 6–7 h sleepers. There were no signi fi cant interactions between sleep duration and race groups, suggesting that the impact of short sleep was similar in African-Americans and Hispanics. The relationship was signi fi cant in younger par-ticipants only (< 40 years old). Because there is an elevated prevalence of short sleepers in these ethnic minorities, these fi ndings raise the possi-bility that their increased risk of metabolic disor-ders may be partly mediated by sleep habits. Knutson et al. explored the impact of ethnicity on the association between sleep and body size mea-sured from BMI, skin folds, arm, and calf circum-ference using data from the Hispanic Health and Nutrition Examination Survey (HHANES) [ 48 ] . In a cross-sectional analysis, SSD was associated with larger body size in Mexican-Americans ( n = 3,520), but not in Cubans-Americans ( n = 889) or Puerto Ricans ( n = 1,316), indicating that dis-tinct factors (e.g., diet intake vs. physical activ-ity) in different ethnic groups could in fl uence the risk of weight gain. One limitation of this study is that the data analyzed were collected over 25 years ago, which was at the beginning of the obesity epidemic and at the time when the preva-lence of short sleepers was very small. In fact only 3–5% of the HHANES ethnic groups reported sleeping less than 6 h per night. It is pos-sible that today the association between sleep duration and body size may be detectable in all Hispanic groups. Most recently, in a large cohort of almost 400,000 US adults, of whom 70% white non-Hispanic, there was a positive-graded rela-tionship between days of perceived insuf fi cient sleep and BMI categories from normal weight through different obesity grades among both men and women and in all ethnic groups [ 52 ] . Of note, perceived insuf fi cient sleep does not distinguish between sleep duration and sleep quality.
14510 The Connection Between Sleep Loss, Obesity, and Type 2 Diabetes
Role of Dietary Habits in the Relationship Between Short Sleep and Obesity
In 2010 and 2011, four epidemiologic studies examined the contribution of dietary habits to the association between sleep duration and obesity [ 28, 30, 49, 50 ] . Nishiura et al. analyzed the dietary patterns of 2,362 non-obese Japanese workers. The increased risk of obesity at 4 years for the short sleepers (AOR 2.46 for < 6 h; CI 1.41–4.31) was slightly attenuated but remained signi fi cant after controlling for food preferences and unhealthy behavior such as skip-ping breakfast, snacking, and eating out [ 28 ] . In a prospective study with a 6-year follow-up, Bo et al. showed in an Italian cohort that hours of sleep per night, home temperature, and numbers of restaurant meals were each associated with higher obesity incidence [ 30 ] . Kim et al. collected information regarding eating behavior in almost 28,000 women. Short sleep (< 5 h/night) was cross-sectionally associated with an increased tendency for eating at unconventional times and dominance of snacks over meals [ 50 ] . These eat-ing patterns were associated with increased caloric intake from sweets and fat and lower intake of fruits and vegetables. The fi nding suggests that short sleep may promote disrupted eating patterns and unhealthy food choices. Lastly, a small cross-sectional study showed that later sleep time and short sleep were associated with increased BMI, but that the association was mostly due to the increased caloric intake after 8 p.m., suggesting that the relationship between short sleep time and obesity could also be mediated by the opportunity of ingesting food during the natural night [ 49 ] .
Sleep Duration and Diabetes: Epidemiologic Evidence
As for obesity risk, there is evidence for associa-tions of both short sleep and long sleep with an increased risk of T2DM [ 57– 59 ] . Very different mechanisms are likely to be involved and the present review will focus on short sleep only and on the recent and best-documented studies
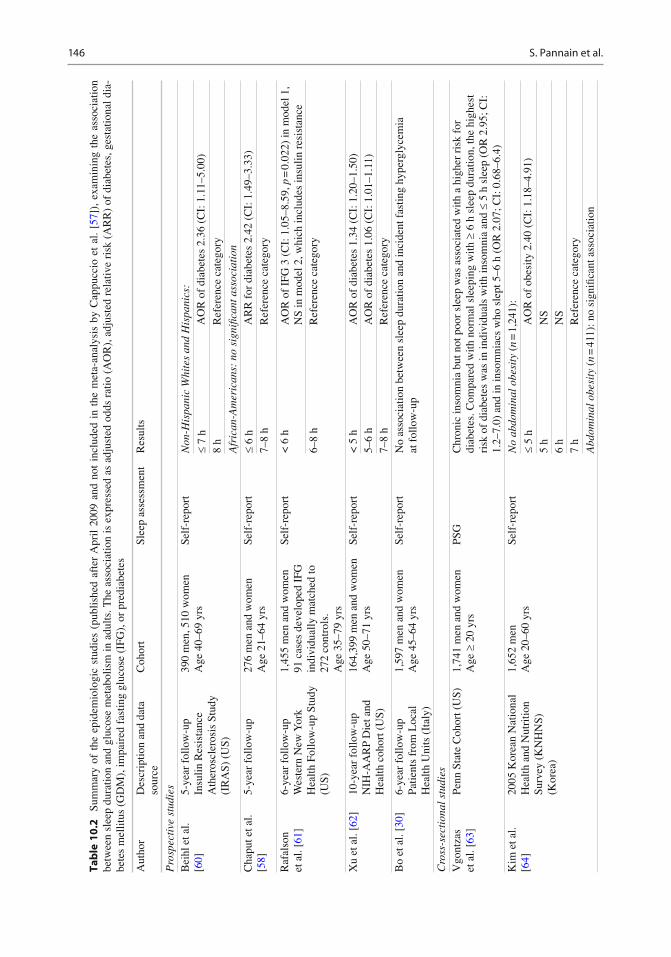
(summarized in Table 10.2 ). Additionally, in the last subsection, we review the relationship between short sleep and gestational diabetes risk.
Prospective Studies
A number of prospective studies have examined the association between SSD and incident diabetes. Ten prospective studies published between 2003 and 2007 are included in a meta-analysis reported in 2010 by Cappuccio et al. [ 57 ] . The estimated pooled OR of incident diabetes for short sleep was 1.28 (CI: 1.03–1.6). There was however a signi fi cant sex difference. The OR was 2.07 (CI: 1.16–3.72) for men but only 1.07 (CI: 0.90–1.28) for women. Dif fi culty initiating sleep and dif fi culty maintaining sleep were also signi fi cant predictors of incident diabetes. We will review here the recent prospective epidemiologic studies that were not included in this meta-analysis [ 57 ] .
In a 2009 article, Chaput et al. examined the predictors of T2DM or impaired glucose toler-ance (IGT), as assessed by the oral glucose toler-ance test (OGTT), over a 6-year follow-up period in 276 participants of the Quebec Family Study [ 58 ] . Sleep was self-reported. After adjusting for multiple confounders, using adults with 7–8 h of sleep as a reference, the adjusted relative risk (RR) for the development of T2DM/IGT was 2.78 (CI: 1.61–4.12) for those with sleep duration £ 6 h. The RR was attenuated but remained signi fi cant after adjustment for BMI, waist cir-cumference, or percent body fat. The latter fi nding suggests that obesity could partially mediate the developing of T2DM in short sleepers. Data from a community-based cohort of nondiabetics men and women from the Western New York Health Follow-up Study followed for an average of 6 years were used to examine biomarkers that pre-dicted the incidence of T2DM [ 61 ] . Participants who were free of T2DM and cardiovascular dis-ease at baseline (1996–2001) were reexamined in the period 2003–2004. Sleep duration < 6 h was categorized as short sleep and sleep duration of 6–8 h served as the reference. A nested case–con-trol study was used to test the hypothesis that being a short sleeper at baseline is associated
146 S. Pannain et al.
Tab
le 1
0.2
Su
mm
ary
of t
he e
pide
mio
logi
c st
udie
s (p
ublis
hed
afte
r A
pril
2009
and
not
inc
lude
d in
the
met
a-an
alys
is b
y C
appu
ccio
et
al.
[ 57 ]
), e
xam
inin
g th
e as
soci
atio
n be
twee
n sl
eep
dura
tion
and
gluc
ose
met
abol
ism
in a
dults
. The
ass
ocia
tion
is e
xpre
ssed
as
adju
sted
odd
s ra
tio (
AO
R),
adj
uste
d re
lativ
e ri
sk (
AR
R)
of d
iabe
tes,
ges
tatio
nal d
ia-
bete
s m
ellit
us (
GD
M),
impa
ired
fas
ting
gluc
ose
(IFG
), o
r pr
edia
bete
s
Aut
hor
Des
crip
tion
and
data
so
urce
C
ohor
t Sl
eep
asse
ssm
ent
Res
ults
Pro
spec
tive
stu
dies
B
eihl
et a
l. [ 6
0 ]
5-ye
ar f
ollo
w-u
pIn
sulin
Res
ista
nce
Ath
eros
cler
osis
Stu
dy
(IR
AS)
(U
S)
390
men
, 510
wom
en
Age
40–
69 y
rs
Self
-rep
ort
Non
-His
pani
c W
hite
s an
d H
ispa
nics
:
£ 7
h A
OR
of
diab
etes
2.3
6 (C
I: 1
.11–
5.00
)
8 h
Ref
eren
ce c
ateg
ory
Afr
ican
-Am
eric
ans:
no
sign
ifi ca
nt a
ssoc
iati
on
Cha
put e
t al.
[ 58 ]
5-
year
fol
low
-up
276
men
and
wom
en
Age
21–
64 y
rs
Self
-rep
ort
£ 6
h A
RR
for
dia
bete
s 2.
42 (
CI:
1.4
9–3.
33)
7–8
h R
efer
ence
cat
egor
y
Raf
also
n et
al.
[ 61 ]
6-
year
fol
low
-up
Wes
tern
New
Yor
k H
ealth
Fol
low
-up
Stud
y (U
S)
1,45
5 m
en a
nd w
omen
91
cas
es d
evel
oped
IFG
in
divi
dual
ly m
atch
ed to
27
2 co
ntro
ls.
Age
35–
79 y
rs
Self
-rep
ort
< 6
h
AO
R o
f IF
G 3
(C
I: 1
.05–
8.59
, p =
0.0
22)
in m
odel
1,
NS
in m
odel
2, w
hich
incl
udes
insu
lin r
esis
tanc
e 6–
8 h
Ref
eren
ce c
ateg
ory
Xu
et a
l. [ 6
2 ]
10-y
ear
follo
w-u
pN
IH-A
AR
P D
iet a
nd
Hea
lth c
ohor
t (U
S)
164,
399
men
and
wom
en
Age
50–
71 y
rs
Self
-rep
ort
< 5
h
AO
R o
f di
abet
es 1
.34
(CI:
1.2
0–1.
50)
5–6
h A
OR
of
diab
etes
1.0
6 (C
I: 1
.01–
1.11
) 7–
8 h
Ref
eren
ce c
ateg
ory
Bo
et a
l. [ 3
0 ]
6-ye
ar f
ollo
w-u
pPa
tient
s fr
om L
ocal
H
ealth
Uni
ts (
Ital
y)
1,59
7 m
en a
nd w
omen
A
ge 4
5–64
yrs
Se
lf-r
epor
t N
o as
soci
atio
n be
twee
n sl
eep
dura
tion
and
inci
dent
fas
ting
hype
rgly
cem
ia
at f
ollo
w-u
p
Cro
ss-s
ecti
onal
stu
dies
V
gont
zas
et a
l. [ 6
3 ]
Penn
Sta
te C
ohor
t (U
S)
1,74
1 m
en a
nd w
omen
A
ge ³
20
yrs
PSG
C
hron
ic in
som
nia
but n
ot p
oor
slee
p w
as a
ssoc
iate
d w
ith a
hig
her
risk
for
di
abet
es. C
ompa
red
with
nor
mal
sle
epin
g w
ith ³
6 h
sle
ep d
urat
ion,
the
high
est
risk
of
diab
etes
was
in in
divi
dual
s w
ith in
som
nia
and
£ 5
h sl
eep
(OR
2.9
5; C
I:
1.2–
7.0)
and
in in
som
niac
s w
ho s
lept
5–6
h (
OR
2.0
7; C
I: 0
.68–
6.4)
K
im e
t al.
[ 64 ]
20
05 K
orea
n N
atio
nal
Hea
lth a
nd N
utri
tion
Surv
ey (
KN
HN
S)
(Kor
ea)
1,65
2 m
en
Age
20–
60 y
rs
Self
-rep
ort
No
abdo
min
al o
besi
ty (
n =
1,2
41):
£ 5
h A
OR
of
obes
ity 2
.40
(CI:
1.1
8–4.
91)
5 h
NS
6 h
NS
7 h
Ref
eren
ce c
ateg
ory
Abd
omin
al o
besi
ty (
n =
411
): n
o si
gni fi
cant
ass
ocia
tion
14710 The Connection Between Sleep Loss, Obesity, and Type 2 Diabetes
Shan
kar
et a
l. [ 6
5 ]
2008
Beh
avio
ral R
isk
Fact
or S
urve
illan
ce
Syst
em (
BR
FSS)
(U
S)
372,
144
men
and
wom
en
Age
> 2
0 yr
s Se
lf-r
epor
ted
perc
eptio
n of
in
suf fi
cien
t res
t or
sle
ep
0 da
ys o
f in
suf fi
cien
t re
st/s
leep
R
efer
ence
cat
egor
y
14–2
9 da
ys o
f in
suf fi
cien
t res
t/sle
ep
AO
R o
f di
abet
es 1
.15
(CI:
1.0
7–1.
23)
30 d
ays
of in
suf fi
cien
t re
st/s
leep
A
OR
of
diab
etes
1.3
1 (C
I: 1
.21–
1.41
)
Knu
tson
et a
l. [ 6
6 ]
Cor
onar
y A
rter
y R
isk
Dev
elop
men
t in
You
ng
Adu
lts (
CA
RD
IA)
Stud
y (U
S)
200
men
; 331
wom
en
Age
18–
30 y
rs
WA
M
Abs
ence
of
diab
etes
N
o as
soci
atio
n be
twee
n sl
eep
mea
sure
s an
d fa
stin
g gl
ucos
e, in
sulin
, or
HO
MA
In
dia
betic
s: 1
0% h
ighe
r sl
eep
frag
men
tatio
n A
ssoc
iate
d w
ith:
9% h
ighe
r fa
stin
g gl
ucos
e le
vel
30%
hig
her
fast
ing
insu
lin le
vel
43%
hig
her
HO
MA
leve
l C
hao
et a
l. [ 5
9 ]
2006
–200
7 he
alth
ex
amin
atio
n in
Ta
iwan
ese
Uni
vers
ity
Hos
pita
l (Ta
iwan
)
2,14
5 m
en, 1
,325
w
omen
A
ge >
18 y
rs
Self
-rep
ort
< 6
h
AO
R o
f pr
edia
bete
s N
S A
OR
of
diab
etes
1.5
5 (C
I: 1
.07–
2.24
, p =
0.0
22)
6–8.
49 h
R
efer
ence
cat
egor
y
Pre
gnan
cy
Qiu
et a
l. [ 6
7 ]
Cro
ss-s
ectio
nal s
tudy
(U
S)
1,29
0 w
omen
in
the
2nd
trim
este
r M
ean
age
33.3
± 4
.4
Self
-rep
ort
Lean
(B
MI <
25
kg/m
2 ):
no s
igni
fi can
t ass
ocia
tion
O
verw
eigh
t (B
MI ≥
25
kg/m
2 ):
£ 7
h A
RR
of
GD
M 9
.83
(CI:
1.1
2–86
.32)
8 h
NS
³ 9
h R
efer
ence
cat
egor
y
Facc
o et
al.
[ 68 ]
Pr
ospe
ctiv
e st
udy
(US)
L
onge
st f
ollo
w-u
p 34
wee
ks
189
heal
thy
nulli
paro
us
wom
en
Mea
n ag
e 29
.7 ±
5.5
yrs
Self
-rep
ort
< 7
h
Hig
her
oral
glu
cose
tole
ranc
e va
lue
(116
± 3
1 m
g/dl
vs
. 105
± 2
3; p
= 0
.008
).
AO
R o
f 1-
h O
GT
³ 1
30 2
.4 (
CI:
1.1
–5.3
) A
OR
of
GD
M 1
1.7
(CI:
1.2
–114
.5)
> 7
h
Ref
eren
ce c
ateg
ory
Reu
trak
ul
et a
l. [ 6
9 ]
Cro
ss-s
ectio
nal s
tudy
(U
S)
169
wom
en in
the
2nd
trim
este
r M
ean
age
28.5
± 5
.5 y
rs
Self
-rep
ort
Eac
h ho
ur o
f sl
eep
redu
ctio
n w
as a
ssoc
iate
d w
ith a
4%
incr
ease
in 1
h g
luco
se
duri
ng th
e sc
reen
ing
50-g
OG
TT
O
R o
f G
DM
3.4
(C
I: 1
.3–8
.7; p
= 0
.01)
if s
hort
sle
ep w
as a
ssoc
iate
d w
ith
bein
g at
incr
ease
d ri
sk f
or S
DB
Adj
. b a
djus
ted
beta
coe
f fi ci
ent,
CI
95%
con
fi den
ce in
terv
al, H
OM
A h
omeo
stat
ic m
odel
ass
essm
ent,
NS
not s
igni
fi can
t, O
GT
ora
l glu
cose
tole
ranc
e, S
S sh
ort s
leep
, SD
B s
leep
di
sord
ered
bre
athi
ng, y
rs y
ears
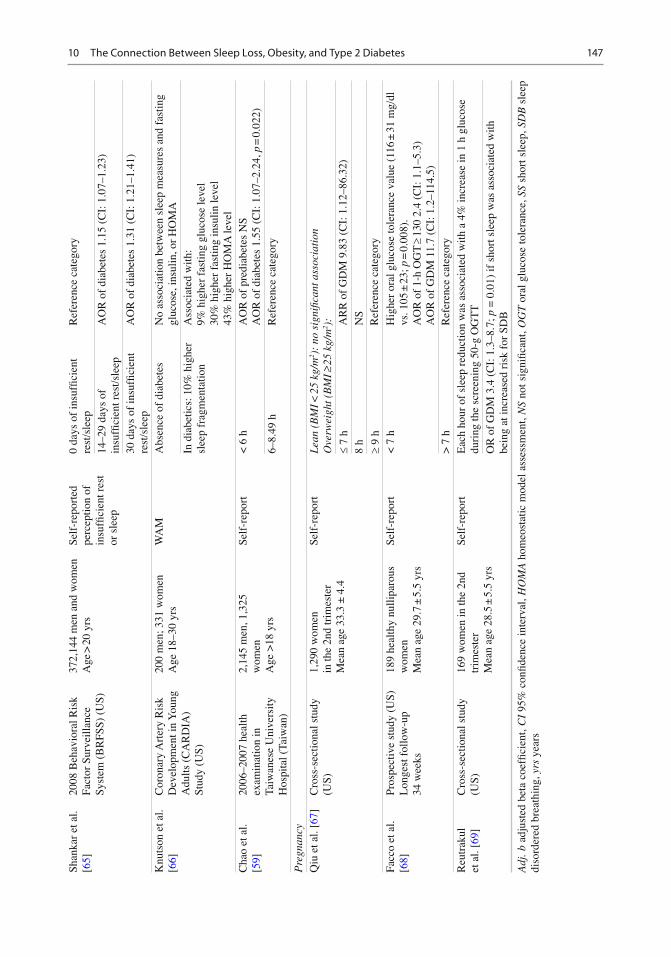
148 S. Pannain et al.
with an increased likelihood of developing impaired fasting glucose (IFG) independently of diabetes risk factors and several confounding variables. From their fi nal cohort of approxi-mately 900 individuals, 91 cases progressed from normal fasting glucose to IFG over the 6-year follow-up. Each case was matched with up to three controls (subjects who had normal fasting glucose at both exams, n = 273) based on sex, race (white vs. other), and duration of follow-up. The average number of hours of weekday sleep duration was 6.8 vs. 7.1 ( p = 0.019) for cases and controls, respectively. Also the HOMA IR, a measure of insulin resistance, was higher in the cases than in the controls. Short sleep was associ-ated with a threefold increased likelihood of developing IFG at 6 years. When HOMA IR was included in the statistical model, the contribution of short sleep was attenuated and no longer statis-tically signi fi cant, suggesting that insulin resis-tance explains in part the association.
The National Institutes of Health (NIH)-AARP Diet and Health was a large prospective study established in 1995–1996 to examine the relationship between diet and health behaviors and cancer [ 62 ] . Six months into the study (1996–1997), a question on hours of day napping and night sleeping was introduced. In 2004–2005, a questionnaire asking to report major chronic diseases including T2DM was mailed to the participants. The fi nal sample included 164,399 participants without diabetes and 10,143 participants with diabetes diagnosed after 2000. [ 62 ] . Both SSD (< 5 h) and daytime napping ( ³ 1 h) were independently associated with risk of incident T2DM, after controlling for several variables, including health-related and socioeco-nomic factors, family history of T2DM, and total energy intake. Duration of daytime napping in 1996–1997 was associated with higher risk of diabetes in 2004–2005 in a dose–response man-ner and in each subgroup of night sleeping duration, after controlling for variable factors, including physical activity. The adjusted RR was moderately attenuated after adjustment for BMI alone or simultaneously with physical activity. The novelty of this study is the prospective
examination of daytime napping as an independent risk factor for T2DM. Daytime napping had been previously linked to diabetes in cross-sectional studies, where the direction of causa-tion could not be inferred and the increased napping was interpreted as a consequence rather than a cause of diabetes [ 70– 72 ] . Daytime nap-ping could be a marker of poor sleep quality or/and of other conditions such as OSA and depres-sion which have been linked to increased risk of diabetes.
Both SSD and T2DM are more prevalent in ethnic/racial minorities than in whites [ 7, 73, 74 ] , and therefore there may be an interaction between sleep duration and race/ethnicity as predictors of the incidence of diabetes. Beihl et al. evaluated the association between sleep duration and incident T2DM in the Insulin Resistance Atherosclerosis Study (IRAS), a cohort including African-Americans (AA), Hispanic, and non-Hispanic whites (NHW) [ 60 ] . They con fi rmed that sleep duration differed by race/ethnic group with the longest mean sleep duration of 7.1 h in the NHW, 6.8 h per night for Hispanics, and 6.3 h per night for AA. Furthermore, they observed a strong interaction between short sleep and race/ethnicity as predictors of incident diabetes, with a signi fi cant association present in NHW and Hispanics but not in African-Americans, after controlling for multiple variables.
In an Italian study of 1,282 patients recruited from the practice of six independent family phy-sicians and studied at baseline and after 6 years of follow-up [ 30 ] , predictors of incidence of obe-sity and fasting hyperglycemia (including IFG and diabetes) were examined. A total of 979 sub-jects had normal fasting glucose levels at base-line. In a multiple logistic regression analysis, after adjusting for sex, education level, alcohol intake, baseline BMI and glucose, and multiple putative risk factors for diabetes, the incidence of obesity but not of fasting hyperglycemia was related to the hours of sleep. It is noteworthy that laboratory studies have been consistent in indi-cating that post-challenge glucose levels are more readily increased by sleep restriction than fasting values.
14910 The Connection Between Sleep Loss, Obesity, and Type 2 Diabetes
Cross-Sectional Studies
Most cross-sectional population studies of the relationship between sleep and metabolism relied on self-reported sleep duration.
A study reported by Vgontzas et al. in 2009 is unique in using PSG to examine in a cohort of 1,741 adults the joint effects of insomnia and objective SSD on diabetes risk [ 63 ] , while con-trolling for sleep apnea, a major confounder for both sleep disturbance and risk of T2DM. Complaining of insomnia for 1 year and having the lowest objectively de fi ned sleep duration ( £ 5 h) increased the odds for prevalent diabetes by nearly threefold (OR 2.95; CI 1.24–7.05), compared with the group who had no insomnia/poor sleep complaint and slept for >6 h. The risk did not change after adjusting for PSG variables such as number of awakenings, number of sleep stage changes, percentage of stage 1 sleep, and periodic limb movements. The second highest OR was found in the group of insomniacs who slept 5–6 h, with a near twofold but nonsigni fi cant increase in the risk of diabetes. Finally, objective SSD in the absence of a sleep complaint was associated with a nonsigni fi cant increase in the odds for diabetes, but this subgroup was of rela-tively small size. Shankar et al. [ 65 ] examined the data on 372,144 participants of the Behavioral Risk Factor Surveillance System (BRFSS), a large multiethnic, nationally representative, cross-sectional survey conducted annually by the Center for Disease Control (CDC) in men and women, of all race-ethnicities from all 50 US states, the District of Columbia, and the three ter-ritories. A recent report based on this survey found that an estimated 11.1% of Americans reported experiencing insuf fi cient rest or sleep every day for the preceding 30 days and only 30.7% of respondents reported no days of insuf fi cient rest or sleep [ 6 ] . The analysis by Shankar et al. focused on cardiovascular disease, diabetes mellitus, and obesity in relationship to days of insuf fi cient rest or sleep. Increasing cat-egories of self-reported insuf fi cient rest/sleep in the previous month were found to be positively associated with all three outcomes. Speci fi cally 13 days of insuf fi cient sleep in 1 month compared
to 0 days increased the risk of diabetes by 30%, with a graded relationship to the number of days, after adjustment for a large number of potential confounders. This relationship persisted when men and women were analyzed separately. The strength of this study is the very large size of the cohort and the equal representation of men and women. One caveat is that perceived insuf fi cient rest or sleep is a subjective measure; additionally, it may be related to other factors such as underly-ing sleep disordered breathing (SDB), psychoso-cial stress, depressive symptom, endocrine disorders, or the effect of lifestyle choices which all may predispose to diabetes mellitus and car-diovascular disease. An analysis of data of the 2004–2005 US National Health Interview Survey in 56,507 adults, 49% males, age range 18–85 years, showed that both short sleep (< 7 h) and long sleep (>8 h) were positively associated with the risk of obesity, diabetes, hypertension, and cardiovascular disease [ 42 ] . The researchers employed a multilevel logistic regression, simul-taneously controlling for individual characteris-tics (e.g., ethno-racial group, gender, age, education), other health behaviors (e.g., exercise, smoking), family environment (e.g., income, size, education), and geographic context (e.g., census region). The CARDIA Sleep Study col-lected information on objective sleep duration and fragmentation by WAM in more than 600 middle-aged adults. A recent paper from Knutson et al. [ 66 ] examined the association between sleep measures and fasting glucose, fasting insu-lin, and HOMA-IR in participants with and with-out diabetes. Sleep fragmentation, but not habitual sleep duration, was related to higher fasting glu-cose, insulin, and estimated insulin resistance in subjects with diabetes but not in those without diabetes. These fi ndings are consistent with a previous survey study from the same group [ 75 ] which showed that self-reported sleep distur-bances may adversely affect diabetes control.
Kim et al. examined the data from the Third Korean National Health and Nutrition Examination Survey 2005 in 1,652 male adults [ 64 ] . SSD ( £ 5 h, self-reported) was signi fi cantly associated with an increased prevalence of diabe-tes among men without abdominal obesity (AOR
150 S. Pannain et al.
of diabetes 2.40; CI: 1.18–4.91) compared to those with sleep duration of 7 h after adjustment of age, smoking, drinking, exercise, education, household income, residential area, hypertension, general obesity, abdominal obesity, high triglyc-eride, low HDL-C, and high cholesterol. The adjusted OR for diabetes was not signi fi cantly elevated in short sleepers with abdominal obe-sity, suggesting that abdominal obesity may have had a predominant role on diabetes risk. This was the fi rst study that demonstrated an association between sleep duration and diabetes in an Asian population. Chao et al. examined the relationship between sleep duration and prediabetes/newly diagnosed T2DM in a Taiwanese population [ 59 ] . After excluding the subjects with a high risk of OSA, those with a positive history of T2DM, and those taking hypnotic drugs, a total of 3,470 adults were recruited. Each subject completed a questionnaire on sleep duration and lifestyle fac-tors. Subjects were classi fi ed into short (< 6.0 h), normal (6.0–8.49 h), and long sleepers ( ³ 8.5 h). The proportion of subjects with normal glucose tolerance, prediabetes, and newly diagnosed T2DM was 71.9, 22.9, and 5.2%, respectively. There were signi fi cant differences in age, sex, weight, education level, BMI, waist to hip ratio, systolic and diastolic blood pressure, alcohol and coffee drinking habits, family history of T2DM, and sleep duration among the three glycemic groups. In a multinomial regression, both short and long sleepers had a higher risk of newly diag-nosed T2DM with an OR of 1.55 (CI: 1.07–2.24) and 2.83 (CI: 1.19–6.73), respectively, even after adjustments for age, sex, education level, family history of T2DM, cigarette smoking, alcohol and coffee drinking, and physical exercise. Furthermore, this association remained signi fi cant even after controlling for both general and cen-tral obesity. Sleep duration was not found to relate to prediabetes.
Studies in Pregnancy
Pregnancy is a condition of increased insulin resistance, and women with risk factors for dia-betes such as family history, obesity, and exces-
sive pregnancy-related weight gain may develop hyperglycemia during pregnancy, referred to as gestational diabetes mellitus (GDM). Decreases in both duration and quality of sleep are common in pregnant women [ 76, 77 ] as a result of hor-monal and physical factors. Based on the epide-miologic data in the general adult population discussed above, it is conceivable that pregnant women with insuf fi cient sleep or poor sleep qual-ity may be at increased risk of GDM. Most epide-miologic studies have not included pregnant women; hence very little is known regarding this question.
We discuss here three studies that have exam-ined the risk of GDM in women with sleep dis-turbances, including insuf fi cient sleep. In a pilot study, Qiu et al. interviewed 1,290 women during early pregnancy to obtain self-reported measures of habitual sleep duration and snoring behavior [ 67 ] . Results from screening and diagnostic test-ing for GDM were abstracted from medical records. After adjusting for maternal age and race/ethnicity, women who reported sleeping £ 4 h per night during early pregnancy had a 5.6-fold increased risk of GDM as compared with those women who reported sleeping 9 h per night (the reference group) (RR = 5.56; CI 1.31–23.69). The positive association remained, although somewhat attenuated, after further adjustment for maternal pre-pregnancy BMI (RR = 4.18; CI 0.94–18.60). Overall, snoring was associated with a nonsigni fi cant 1.86-fold increased risk of GDM (RR = 1.86; CI 0.88–3.94). The risk of GDM was particularly elevated among over-weight pregnant women who reported snoring. Compared with lean pregnant women who did not snore, those who were overweight and snored had a 6.9-fold increased risk of GDM (CI 2.87–16.6). Facco et al. conducted a prospective cohort study in a convenience sample of healthy nullipa-rous women during pregnancy [ 68 ] . The women responded to a survey addressing sleep duration and SDB symptoms early and again later in preg-nancy. SSD was de fi ned as < 7 h per night. Subjects were asked about snoring and snoring frequency. Frequent snoring, used as a surrogate marker of SDB, was de fi ned as snoring ³ 3 nights per week. Outcomes in women who reported
15110 The Connection Between Sleep Loss, Obesity, and Type 2 Diabetes
SSD or frequent snoring while pregnant (early and/or late pregnancy) were compared to out-comes in women without these sleep complaints. A total of 189 women participated, 48% reported SSD, and 18.5% reported frequent snoring. Impaired glucose tolerance and GDM were more frequent in women with these sleep disturbances. Both SSD (10.2% vs. 1.1%; p = 0.008) and fre-quent snoring (14.3% vs. 3.3%; p = 0.009) were associated with a higher incidence of GDM com-pared to women without sleep complaints, even after controlling for potential confounders. Reutrakul et al. enrolled pregnant women sched-uled to undergo a 50-g OGTT during the second trimester of gestation, according to standard of care [ 69 ] . Subjects completed standardized ques-tionnaires assessing daytime sleepiness, SDB risk, sleep quality and duration, and sleep distur-bance due to nocturia or other causes. There was an inverse correlation between sleep duration and 1-h glucose values post 50-g OGTT ( r = −0.21, p < 0.01) such that each hour of shorter sleep was associated with a 4% glucose increase. They also noted an increased incidence of preterm delivery in short sleepers. In addition, sleep disturbances, including frequent snoring (after adjustment for BMI), increased SDB risk, short sleep, and a combination of increased SDB and short sleep, were associated with a signi fi cantly higher risk of developing GDM.
These three studies emphasize the need for more research to characterize the impact of sleep disturbances on the risk of GDM and on preg-nancy outcomes as well as the need for interven-tion studies to examine the possible bene fi cial effects of optimizing sleep duration and quality during pregnancy.
Impact of Sleep Restriction on Obesity Risk: Laboratory Studies
While a large body of epidemiologic evidence has pointed to an association between sleep loss and the increased risk of obesity, the direction of causality and the underlying mechanisms are still unclear. Theoretically, sleep loss could affect energy balance via a decrease in energy expendi-
ture or an increase in energy intake. To date, lab-oratory studies examining the impact of experimental sleep deprivation have mainly focused on energy intake and/or the hormonal signals known to regulate hunger and appetite (e.g., leptin, ghrelin, PYY). The potential impact of sleep loss on energy expenditure has been much less explored.
Studies of acute total sleep deprivation (TSD) (as compared to normal nighttime sleep) con-ducted more than two decades ago demonstrated unequivocally that the presence or absence of sleep has a major impact on pituitary-dependent hormonal regulation and glucose metabolism [ 78 ] . In the fi rst part of this section, we review the fi ndings from laboratory studies that have used protocols of TSD to examine the role of sleep and circadian rhythmicity in the 24-h pro fi les of hor-mones involved in the neuroendocrine regulation of appetite ( fi rst part of Table 10.3 ). To date, such studies have focused only on leptin and ghrelin. We then summarize the results from a growing number of laboratory studies that have explored the effects of partial sleep deprivation (PSD) on caloric intake, weight gain, hunger, and appetite and the levels of hormones known to affect energy metabolism (second part of Table 10.3 ).
TSD Studies: Impact on Leptin and Ghrelin
Leptin, a hormone secreted by the adipocytes, provides information about energy status to the neural networks regulating homeostatic feeding in the hypothalamus [ 99, 100 ] . In humans acute caloric shortage or surplus leads to decreased or increased circulating leptin levels, respectively [ 100, 101 ] . These changes in leptin concentra-tions have been associated with reciprocal changes in hunger [ 101 ] . The 24-h leptin pro fi le is not only dependent on the timing and amount of food intake, but appears to be also modulated by sleep and circadian rhythmicity. In a landmark study, when bedtimes were shifted by 8 h and the impact of meal intake was eliminated by admin-istering continuous enteral nutrition to healthy lean young volunteers, a leptin elevation was
152 S. Pannain et al.
Tab
le 1
0.3
Su
mm
ary
of th
e la
bora
tory
stu
dies
exa
min
ing
poss
ible
mec
hani
sms
linki
ng s
leep
dur
atio
n an
d ob
esity
in a
dults
Tota
l sle
ep d
epri
vati
on
Aut
hor
Inte
rven
tion
– tim
e in
bed
Su
bjec
ts
Cal
oric
inta
ke
Cha
nges
with
sle
ep d
epri
vatio
n Si
mon
et a
l. [ 7
9 ]
8 h
× 1
nig
ht (
23:0
0–7:
00)
24 h
sle
ep d
epri
vatio
n (8
h s
hift
of
slee
p)
8 h
dayt
ime
reco
very
7 m
en
Age
21–
25 y
rs
BM
I 22
.2 ±
0.6
kg/
m 2
24 h
con
tinuo
us e
nter
al n
utri
tion
(50%
car
bohy
drat
e, 3
5% f
at, a
nd 1
5%
prot
ein;
378
kilo
joul
es/h
)
Wei
ght:
n/a
Lep
tin w
as in
crea
sed
duri
ng b
oth
the
nigh
t of
tota
l sle
ep d
epri
vatio
n an
d da
ytim
e re
cove
ry s
leep
. A c
irca
dian
el
evat
ion
of le
ptin
inde
pend
ent o
f sl
eep
was
als
o ob
serv
ed.
Ghr
elin
: n/a
H
unge
r: n
/a
Food
inta
ke: n
/a
Mul
lingt
on e
t al.
[ 80 ]
8
h ×
3 n
ight
s (2
3:30
–7.3
0)
88 h
sle
ep d
epri
vatio
n E
ither
7 h
or
14 h
× 3
nig
hts
of
reco
very
10 m
en
Age
22–
37 y
rs
BM
I 20
–34.
5 kg
/m 2
Thr
ee m
eals
/24
h +
opt
iona
l ev
enin
g sn
ack
duri
ng b
asel
ine
and
reco
very
vs.
thre
e m
eals
+ sc
hedu
led
late
eve
ning
sna
ck d
urin
g sl
eep
depr
ivat
ion
Wei
ght:
unch
ange
d L
eptin
: dec
reas
ed d
urin
g ni
ght
Ghr
elin
: n/a
H
unge
r: n
/a
Food
inta
ke: n
/a
Dza
ja e
t al.
[ 81 ]
8
h ×
1 n
ight
(23
:00–
7:00
) 1
nigh
t sle
ep d
epri
vatio
n 10
men
A
ge 2
8 ±
3.1
yrs
BM
I 20
.5–2
9.5
kg/m
2
Mat
ched
sta
ndar
dize
d m
eals
(1
,800
kca
l/24
h; 3
0% f
at, 6
0%
carb
ohyd
rate
s, a
nd 1
0% p
rote
in)
Wei
ght:
n/a
Lep
tin: n
/a
Ghr
elin
: dec
reas
ed d
urin
g ni
ght
Hun
ger:
n/a
Fo
od in
take
: n/a
Sc
hmid
et a
l. [ 8
2 ]
7 h
× 1
nig
ht (
22:0
0–6:
00)
1 ni
ght s
leep
dep
riva
tion
10 m
en
Age
20–
40 y
rs
BM
I 20
.7–2
5 kg
/m 2
No
food
fro
m 2
1:00
to h
ypog
lyce
mic
cl
amp
(at 7
:30)
W
eigh
t: n/
a L
eptin
: n/a
G
hrel
in: n
/a
Hun
ger:
incr
ease
d Fo
od in
take
: n/a
Pe
jovi
c et
al.
[ 41 ]
8
h ×
4 n
ight
s (2
2:30
–6:3
0)
40 h
sle
ep d
epri
vatio
n 8
h ×
2 n
ight
s of
rec
over
y
21 m
en a
nd w
omen
A
ge 1
8–30
yrs
D
ivid
ed in
2 g
roup
s: B
MI
23.2
± 2
.8 a
nd 2
5.0
± 2.
1 kg
/m 2
Unc
ontr
olle
d fo
od in
take
W
eigh
t: n/
a L
eptin
(24
h p
ro fi l
e): i
ncre
ased
G
hrel
in: n
/a
Hun
ger:
unc
hang
ed
Food
inta
ke: u
ncha
nged
P
arti
al s
leep
dep
riva
tion
G
uille
min
ault
et a
l. [ 8
3 ]
8.5
h ×
2 n
ight
s (2
2:30
–7.0
0)
4 h
× 7
nig
hts
( fi rs
t gro
up
22:3
0–02
:30;
sec
ond
grou
p 2:
15–0
6:15
) 1
nigh
t ad
libi
tum
and
8.5
h ×
2
nigh
ts o
f re
cove
ry
8 m
en
Age
18–
25 y
rs
BM
I 22
.9 ±
0.7
kg/
m 2
Stan
dard
ized
die
t (ri
ch in
car
bohy
-dr
ates
on
the
bloo
d-dr
awin
g da
ys)
Wei
ght:
n/a
Lep
tin: r
educ
ed
Ghr
elin
: n/a
H
unge
r: n
/a
Food
inta
ke: n
/a
15310 The Connection Between Sleep Loss, Obesity, and Type 2 Diabetes To
tal s
leep
dep
riva
tion
A
utho
r In
terv
entio
n –
time
in b
ed
Subj
ects
C
alor
ic in
take
C
hang
es w
ith s
leep
dep
riva
tion
Spie
gel e
t al.
[ 84 ]
8
h ×
3 n
ight
s (2
3:00
–7:0
0)
4 h
× 6
nig
hts
(1:0
0–5:
00)
12 h
× 7
nig
hts
(21:
00–9
:00)
11 m
en
Age
22
± 1
yrs
BM
I 23
.4 ±
0.5
kg/
m 2
Wei
ght-
mai
nten
ance
mea
ls o
n th
e da
y pr
eced
ing
and
on th
e da
y of
bl
ood
sam
plin
g
Wei
ght:
unch
ange
d L
eptin
: red
uced
G
hrel
in: n
/a
Hun
ger:
n/a
Fo
od in
take
: n/a
Sp
iege
l et a
l. [ 8
5 ] .
10 h
× 2
nig
hts
(22:
00–8
:00)
4
h ×
2 n
ight
s (1
:00–
5:00
) 12
men
A
ge 2
2 ±
2 yr
s B
MI
23.6
± 2
kg/
m 2
Mat
ched
din
ner
on th
e se
cond
nig
ht
Mat
ched
glu
cose
infu
sion
dur
ing
bloo
d sa
mpl
ing
Wei
ght:
unch
ange
d L
eptin
: red
uced
G
hrel
in: i
ncre
ased
H
unge
r: in
crea
sed
Food
inta
ke: n
/a
Schm
id e
t al.
[ 86 ]
7
h ×
1 n
ight
(1s
t ses
sion
) 4.
5 h
× 1
nig
ht (
2nd
sess
ion)
1
nigh
t of
slee
p de
priv
atio
n (3
rd
sess
ion)
9 m
en
Age
20–
40 y
rs
BM
I 20
.7–2
5.0
kg/m
2
No
food
fro
m 2
1:00
to s
ingl
e m
orni
ng b
lood
dra
w
Wei
ght:
n/a
Lep
tin: u
ncha
nged
G
hrel
in: i
ncre
ased
H
unge
r: in
crea
sed
Food
inta
ke: n
/a
Bos
y-W
estp
hal
et a
l. [ 8
7 ]
>8
h ×
2 n
ight
s Fo
ur n
ight
s of
con
secu
tivel
y in
crea
sing
sle
ep c
urta
ilmen
t (7
h, 6
h, 6
h, 4
h)
>8
h ×
2 n
ight
s of
rec
over
y
14 w
omen
A
ge 2
3–38
yrs
B
MI
20–3
6.6
kg/m
2
Ad
libi
tum
die
t pri
or to
OG
TT
W
eigh
t: in
crea
sed
(+0.
4 kg
) L
eptin
: inc
reas
ed
Ghr
elin
: unc
hang
ed
Hun
ger:
unc
hang
ed
Food
inta
ke: i
ncre
ased
(+
20%
by
die
tary
rec
ords
) R
estin
g m
etab
olic
rat
e an
d to
tal
ener
gy e
xpen
ditu
re: u
ncha
nged
Sc
hmid
et a
l. [ 8
8 ]
7 h
× 1
nig
ht (
22.3
0–6.
30)
4.5
h ×
1 n
ight
(22
.30–
3.00
) 10
men
A
ge 2
0–40
yrs
B
MI
20.7
–25.
0 kg
/m 2
No
food
fro
m 2
1:00
to
hypo
glyc
emic
cla
mp
Wei
ght:
n/a
Lep
tin: n
/a
Ghr
elin
: n/a
H
unge
r: u
ncha
nged
Fo
od in
take
: n/a
Sc
hmid
et a
l. [ 8
9 ]
8 h
15 m
in ×
2 n
ight
s (2
2.45
–7.0
0)
4 h
15 m
in (
2.45
–7.0
0) ×
2 n
ight
s
15 m
en
Age
20–
40 y
rs
BM
I 22
.9 ±
0.3
kg/
m 2
Unc
ontr
olle
d fo
od in
take
unt
il th
e m
orni
ng o
f th
e 2n
d ni
ght w
hen
bloo
d sa
mpl
ing
was
initi
ated
and
ad
libi
tum
foo
d of
fere
d
Wei
ght:
n/a
Lep
tin: u
ncha
nged
G
hrel
in: u
ncha
nged
H
unge
r: u
ncha
nged
Fo
od in
take
: inc
reas
ed in
bot
h sl
eep
cond
ition
s (6
0% e
xces
s in
ene
rgy
inta
ke v
s. th
eir
estim
ated
dai
ly
ener
gy d
eman
d)
Phys
ical
act
ivity
: dec
reas
ed d
urin
g th
e da
ytim
e un
der
free
-liv
ing
and
shif
ted
tow
ard
low
er in
tens
ity le
vels
(con
tinue
d)
154 S. Pannain et al.
Tabl
e 10
.3
(con
tinue
d)
Tota
l sle
ep d
epri
vati
on
Aut
hor
Inte
rven
tion
– tim
e in
bed
Su
bjec
ts
Cal
oric
inta
ke
Cha
nges
with
sle
ep d
epri
vatio
n M
agee
et a
l. [ 9
0 ]
8 h
× 1
nig
ht (
22.3
0–6.
30)
5 h
× 2
nig
hts
(1.3
0–6.
30)
8–10
h ×
1 n
ight
of
reco
very
10 m
en
Age
19–
23 y
rs
Non
-obe
se
Stan
dard
ized
eve
ning
mea
l (1
,546
–1,9
92 K
J)
Wei
ght:
n/a
Lep
tin: u
ncha
nged
G
hrel
in: u
ncha
nged
H
unge
r: u
ncha
nged
but
sig
ni fi c
ant
redu
ctio
n in
sat
iety
C
alor
ic in
take
: n/a
Ta
sali
et a
l. [ 9
1 ]
8.5
h ×
4 n
ight
s 4.
5 h
× 4
nig
hts
10 m
en a
nd w
omen
A
ge 1
8–28
yrs
B
MI
20–2
5 kg
/m 2
Mat
ched
mea
ls.
Ad
libi
tum
buf
fet a
t the
end
W
eigh
t: un
chan
ged
Lep
tin (
sing
le A
M a
sses
smen
t):
incr
ease
d G
hrel
in: n
/a
Hun
ger:
n/a
C
alor
ic in
take
: inc
reas
ed b
y >
400
Kca
l N
edel
tche
va e
t al.
[ 92 ]
8.
5 h
× 1
4 ni
ghts
5.
5 h
× 1
4 ni
ghts
6
men
, 5 w
omen
A
ge 3
4–49
yrs
B
MI
24–2
9 kg
/m 2
Ad
libi
tum
die
t. Id
entic
al m
eals
on
the
bloo
d sa
mpl
ing
day
Wei
ght:
sim
ilar
incr
ease
in b
oth
slee
p co
nditi
ons
Lep
tin: u
ncha
nged
G
hrel
in: u
ncha
nged
H
unge
r: n
/a
Cal
oric
inta
ke: i
ncre
ased
sna
cks
Om
isad
e et
al.
[ 93 ]
10
h ×
2 n
ight
s (2
2.00
–8.0
0)
3 h
× 1
nig
ht (
5.00
–8.0
0)
15 w
omen
A
ge 1
8–25
yrs
B
MI
18.3
–51.
9 kg
/m 2
Mat
ched
mea
ls
Wei
ght:
n/a
Lep
tin (
AM
and
PM
ass
essm
ent)
: in
crea
sed
Ghr
elin
: n/a
H
unge
r: u
ncha
nged
C
alor
ic in
take
: n/a
va
n L
eeuw
en e
t al.
[ 94 ]
8
h ×
2 n
ight
s (2
3.00
–7.0
0)
4 h
× 5
nig
hts
(3.0
0–7.
00)
8 h
× 3
nig
hts
(23.
00–7
.00)
of
reco
very
15 m
en
Age
19–
29 y
rs
BM
I 23
.3 ±
2.7
kg/
m 2
Mat
ched
mea
ls a
nd s
nack
s + o
ne
mor
e sn
ack
(fru
it; 5
0 kc
al)
at 0
:30
duri
ng s
leep
res
tric
tion
Wei
ght:
n/a
Lep
tin: i
ncre
ased
G
hrel
in: n
/a
Hun
ger:
unc
hang
ed
Food
inta
ke: n
/a
Sim
pson
et a
l. [ 9
5 ]
10 h
× 2
nig
hts
(22.
00–8
.00)
4
h ×
5 n
ight
s (3
.00–
8.00
) 13
6 m
en a
nd w
omen
A
ge 2
2–45
yrs
B
MI
17.7
–32.
6 kg
/m 2
Ad
libi
tum
foo
d ac
cess
W
eigh
t: n/
a L
eptin
(si
ngle
AM
ass
essm
ent)
: in
crea
sed
Ghr
elin
: n/a
H
unge
r: n
/a
Cal
oric
inta
ke: n
/a
15510 The Connection Between Sleep Loss, Obesity, and Type 2 Diabetes To
tal s
leep
dep
riva
tion
A
utho
r In
terv
entio
n –
time
in b
ed
Subj
ects
C
alor
ic in
take
C
hang
es w
ith s
leep
dep
riva
tion
Ned
eltc
heva
et a
l. [ 9
6 ]
7 h
× 2
nig
hts
5.5
h ×
14
nigh
ts
8.5
h ×
14
nigh
ts
10 m
en a
nd w
omen
M
ean
age
41 ±
5 y
rs
Mea
n B
MI
27.4
± 2
kg/
m 2
Cal
oric
con
tent
res
tric
ted
to 9
0%
of r
estin
g m
etab
olic
rat
e 5.
5 h
(vs.
8.5
):
Sam
e w
eigh
t los
s, b
ut d
ecre
ased
fat
m
ass
loss
and
incr
ease
d fa
t-fr
ee
mas
s lo
ss
Lep
tin (
24 h
pro
fi le)
: unc
hang
ed
Acy
late
d gh
relin
(24
h p
ro fi l
e):
incr
ease
d H
unge
r: in
crea
sed
Bro
ndel
et a
l. [ 9
7 ]
8 h
× 2
nig
hts
(00.
00–8
.00)
4
h ×
1 n
ight
(2.
00–6
.00)
12
men
A
ge 1
8–29
yrs
B
MI
19–2
4.6
kg/m
2
Ad
libi
tum
foo
d in
take
aft
er s
leep
re
stri
ctio
n.
Wei
ght:
n/a
Lep
tin: n
/a
Ghr
elin
: n/a
H
unge
r: in
crea
sed
befo
re b
reak
fast
an
d di
nner
C
alor
ic in
take
: inc
reas
es o
f 56
0 kc
al
Phys
ical
act
ivity
: inc
reas
ed b
y 48
kc
l Pos
itive
24
h en
ergy
bal
ance
of
510
kcal
St
Ong
e et
al.
[ 98 ]
9
h ×
5 n
ight
s 4
h ×
5 n
ight
s 15
men
and
15
wom
en
Age
30–
45 y
rs
BM
I 22
–26
kg/m
2
Food
inta
ke c
ontr
olle
d d
urin
g fi r
st
4 da
ys, t
hen
ad li
bitu
m
Wei
ght:
n/a
Lep
tin: n
/a
Ghr
elin
: n/a
H
unge
r: in
crea
sed
befo
re b
reak
fast
an
d di
nner
C
alor
ic in
take
: inc
reas
ed
Res
ting
met
abol
ic r
ate
and
tota
l en
ergy
exp
endi
ture
: unc
hang
ed
yrs
year
s, O
GT
T o
ral g
luco
se to
lera
nce
test
156 S. Pannain et al.
observed when sleep was allowed during the daytime after the night of TSD [ 79 ] , suggesting that the sleep state, irrespective of time of day, affects leptin release. The possibility that sleep may promote the release of leptin and thus the control of satiety was further supported by the demonstration that prolonged TSD resulted in a decreased amplitude of the leptin diurnal varia-tion and that sleep recovery restores the normal circadian variation [ 80 ] . While the two previous studies [ 79, 80 ] included only men, more recent work by Pejovic et al. involving both men and women con fi rmed a dampening of the 24-h circa-dian rhythm of leptin following a night of TSD but the fl attening of the rhythm was due to higher daytime, rather than lower nighttime, levels [ 102 ] . Hunger ratings were unchanged but caloric intake and meal composition were not strictly controlled.
Ghrelin, a peptide produced predominantly by the stomach, is also involved in energy homeo-stasis, but, in contrast to leptin, ghrelin stimulates appetite [ 103 ] . The 24-h pro fi le of ghrelin levels shows a marked nocturnal rise, which re fl ects at least partly the rebound of ghrelin following sup-pression by the evening meal. The nocturnal rebound is eventually attenuated as the night pro-gresses, suggesting the inhibitory effects of sleep on ghrelin secretion, and therefore on the hunger-promoting effects of ghrelin [ 104 ] . The impact of TSD on the nocturnal ghrelin pro fi le has been examined in only one study in which the noctur-nal ghrelin elevation was paradoxically damp-ened when subjects were sleep deprived [ 81 ] . More recently, Schmid et al. reported that a single night of TSD resulted in increased subjective hunger the following morning [ 82 ] but neither leptin nor ghrelin levels were assessed.
PSD Studies: Impact on Leptin and Ghrelin
The pioneer “sleep debt study” of Spiegel et al. looked at the impact of recurrent PSD (bedtime restricted to 4 h per night for 6 nights, as com-pared to a fully rested condition) in healthy young men and demonstrated a robust decrease of leptin
levels throughout the 24-h cycle, despite identical amounts of caloric intake, similar sedentary con-ditions, and stable weight [ 84 ] . The magnitude of the decrease was comparable to that observed in a similar subject population after 3 days of under-feeding by approximately 900 cal/day [ 105 ] . These observations con fi rmed preliminary fi ndings by Guilleminault et al. [ 83 ] who reported that 7 nights of sleep restriction to 5-h bedtimes led to a reduction in peak nocturnal leptin levels. In the “sleep debt study,” the reduction in leptin levels in the debt condition was paralleled by an increase in peripheral sympathetic nervous activ-ity, measured via an analysis of heart rate vari-ability. The fi ndings suggested that repeated PSD could result in a reduced ability of leptin to accu-rately sense energy balance. The fi ndings sug-gested that if exposed to ad libitum food, the subjects, under sleep restriction, would have increased their food intake and possibly gained weight. This initial demonstration of an adverse impact of sleep loss on appetite regulation was con fi rmed and extended in a follow-up random-ized crossover design study examining the impact of 2 nights of 4 h as compared to 8 h in bed on leptin, ghrelin, and hunger and appetite [ 85 ] . Relative to the rested condition, sleep restriction was associated with an 18% decrease in leptin levels, a 28% increase in ghrelin, and more than 70% increase in the ghrelin:leptin ratio [ 85 ] . Hunger showed a 23% increase and appetite for nutrients with high carbohydrate content (such as sweets, salty snacks, and starchy foods) was increased by more than 30% [ 85 ] . Importantly, there was a remarkable correlation between the increase in subjective hunger ratings and the increase in the ghrelin:leptin ratio.
Based on these initial fi ndings, subsequent PSD studies examined measures of caloric intake. A preliminary study in 10 healthy young adults estimated that after 4 nights of restricted sleep to 4.5 h in bed, participants ingested on average an excess of more than 400 kcal from an ad libitum buffet relative to when they were allowed 8.5 h bedtimes. This nearly 14% increase in caloric intake was achieved mainly by excess intake of carbohydrate-rich nutrients [ 91 ] . Con fi rming and extending these fi ndings, a recent
15710 The Connection Between Sleep Loss, Obesity, and Type 2 Diabetes
randomized crossover study comparing 5 nights of 4 h in bed to 5 nights of 9 h in bed in 15 men and 15 women found that when presented with ad lib food on the fi fth day of each condition, the subjects consumed nearly 300 more Kcal when sleep restricted [ 98 ] . There was no signi fi cant impact of sex on this increase in caloric intake. Of note, in these two studies involving ad libitum conditions, caloric intake was controlled and kept identical under both sleep conditions prior to access to ad libitum food. In another study, 14 young women were exposed to an ad libitum diet during an 8-day at home protocol including 2 days of bedtimes > 8 h, followed by 4 days of bedtime progressively decreased to 7 h, 6 h, 6 h, and 4 h (for a total of 9 h of bedtime loss over a 4-day period relative to 8 h in bed). Sleep was not recorded and caloric intake was self-reported. The women reported on average a 20% increase in food consumption over the 4 days of sleep restriction and 11 of the 14 participants experi-enced weight gain (mean: +0.4 kg) [ 87 ] . A ran-domized crossover design study of 14 nights of sleep restriction or extension by ±1.5 h per night in overweight middle-aged adults who had ad libitum access to palatable food throughout the study demonstrated an increased consumption of carbohydrates and calories mostly from snacks, particularly in the evening and overnight, in the restricted sleep condition [ 92 ] . In this study, signi fi cant weight gain was observed under both sleep conditions because the participants con-sumed excessive amounts of calories in the “obe-sigenic” sedentary environment of the laboratory.
When interpreting the fi ndings regarding the neuroendocrine regulation of appetite from stud-ies that provided ad libitum access to food, one must keep in mind that weight gain may obliter-ate or obscure the impact of sleep loss on leptin and/or ghrelin since the release of both hormones is readily affected by changes in adiposity. A recent study in a large sample ( n = 136) observed an increase in morning leptin levels after fi ve to 7 nights of bedtime restriction to 4 h per night [ 95 ] . This increase in leptin levels was larger in women than in men and also larger in those with higher baseline BMI. The fi ndings are suggestive of
increased food intake and consequent weight gain following sleep restriction. However, nei-ther food intake nor changes in body weight across the study period were evaluated.
Infrequent sampling for leptin and/or ghrelin (both hormones are secreted in a pulsatile fash-ion, and are modulated by circadian rhythmicity) may also complicate data interpretation. For example, in a study involving a single assessment of satiety and leptin levels at 7:30 a.m. after 5 nights of 4 h in bed (bedtimes from 3 a.m. to 7 a.m.) and after fi ve nights of habitual sleep (bedtimes from 11 p.m. to 7 a.m.), no effect of bedtime restriction on satiety could be detected and leptin levels were elevated, rather than decreased [ 94 ] . However, bedtime restriction was achieved by delaying the timing of lights off, a condition that usually results in a phase delay of the central circadian pacemaker. As the nocturnal elevation in leptin levels is in fl uenced by circa-dian rhythmicity [ 79 ] , the elevated morning lep-tin level is likely to re fl ect a phase delay of the nocturnal rise in leptin.
Short-term studies involving one or two nights of bedtime restriction as compared to normal sleep have had variable results. A 2010 study comparing one night of 8 h in bed vs. one night of 4 h in bed in a randomized crossover design con-ducted in 12 young lean men observed a large increase in caloric intake (+22% or nearly 560 Kcal) and an increase in hunger ratings before breakfast and dinner [ 97 ] . In a subsequent study comparing 2 nights of 4 h 15 bedtimes vs. 2 nights of 8 h 15 bedtimes, appetite ratings, day-time levels of leptin and ghrelin, hunger, and calories consumed were similar after both sleep conditions. Of note, the fi rst experimental day was spent under ambulatory conditions and food intake was not controlled [ 89 ] . A recent report where bedtimes were restricted to 3 h for only one night and leptin levels were measured in saliva at two isolated time points during the fol-lowing day did not fi nd signi fi cant changes in hunger or craving scores, while morning leptin levels were elevated after short sleep [ 93 ] .
Lastly, a recent report has examined for the fi rst time the response of PYY levels of sleep restriction. PYY is a peptide secreted by the neuroendocrine
158 S. Pannain et al.
L cells in the ileum and colon in response to a meal. The postprandial release of PYY appears to be involved in meal-related satiety and to con-tribute to meal termination. Similarly, glucagon-like peptide-1 (GLP-1) is secreted by the same L cells in response to a meal and has multiple actions, mostly related to glucose homeostasis, and decreases food intake by increasing satiety via central nervous system (CNS) mechanisms. Adiponectin, released by adipose tissues, pro-motes insulin sensitivity. Levels of adiponectin are reduced in obese and diabetic subjects. The study with PYY determinations involved 2 nights of 5 h in bed as compared to a fully rested night (8–10 h in bed) and examined peripheral levels of PYY, ghrelin, adiponectin, and leptin in young healthy men [ 90 ] . Satiety was reduced and levels of PYY were lower in the sleep loss condition. The other hormones were not affected. Although hormonal levels were assessed at a single time point upon awakening, this is the fi rst report of decreased PYY levels after sleep restriction in humans, which could represent another mecha-nism underlying the reduced feeling of satiety consistently reported by sleep-deprived individu-als. Lastly, young healthy men and women stud-ied in a forced desynchrony protocol (involving over 1 month of laboratory conditions on a 28-h sleep–wake and dark–light cycle with four isoca-loric meals per 28-h cycle) exhibited lower leptin levels when they ate and slept 12 h out of phase from their usual schedule [ 106 ] . Sleep ef fi ciency was 67% when circadian disruption was maxi-mal, compared to 84% in conditions of circadian alignment. The fi ndings are consistent with an inhibition of leptin levels by sleep disruption but the relative contributions of circadian misalign-ment and sleep loss in such a protocol cannot be unambiguously dissected.
Cross-sectional population studies that exam-ined leptin levels in relation to sleep duration have had con fl icting fi ndings. In the Wisconsin Sleep Cohort study, 5 h of habitual sleep time as compared to 8 h of sleep and both self-reported habitual sleep duration and PSG were obtained. Short habitual sleep was associated with a 15.5% decrease in morning leptin levels, while short PSG-based sleep duration was associated with
14.9% increase in morning ghrelin levels, after controlling for BMI [ 19 ] . In contrast, in a more recent study by Hayes et al. on data from the Cleveland Family Study, for each hour of decreased sleep there was a 6% increase in leptin levels after controlling for obesity and associated comorbidities [ 107 ] . A recent paper by Knutson et al. suggests that the data obtained in lean sub-jects may not be easily extrapolated to individu-als with obesity [ 108 ] . The authors performed a cross-sectional analyses of data from participants in an ongoing sleep extension study of obese men and women, aged 18–50 years, who report sleep-ing less than 6.5 h per night on average [ 53 ] . Habitual nocturnal sleep duration and quality were also estimated using WAM. SDB was assessed over one night using a portable screen-ing device. Using the baseline data available on 80 participants at the time of the analysis, no signi fi cant associations between leptin levels adjusted for the degree of adiposity and any of the sleep measures, including sleep duration, sleep ef fi ciency, and SDB, were found.
In summary, the bulk of the current evidence from laboratory studies of sleep restriction points to a dysregulation of appetite. Inconsistent fi ndings regarding the neurohormonal control of appetite during partial sleep restriction may be attributed to differences in the study design such as the duration of sleep restriction (1–2 vs. mul-tiple days), the circadian timing of the restricted bedtimes, caloric intake and weight changes dur-ing the study, and fi nally the timing and frequency of hormonal measurements. The original fi nding of a decrease in leptin levels after PSD was obtained under conditions of strictly controlled caloric intake, fi xed circadian timing, and BMI was unchanged [ 84, 85 ] . When feeding is ad libi-tum, an increase in weight generally occurs and has therefore the opposite effect on leptin levels, which may be more responsive to changes in adi-posity than to changes in sleep duration. Ghrelin levels were measured in only one of the six stud-ies. It is possible that the impact of sleep restric-tion on the neuroendocrine regulation of appetite is more clearly apparent in conditions of weight maintenance caloric intake or in conditions where caloric intake is lower than energy requirements.
15910 The Connection Between Sleep Loss, Obesity, and Type 2 Diabetes
If this was the case, sleep restriction could under-mine the success of a reduced calorie diet by decreasing the compliance to the dietary regimen and its ef fi cacy. The fi ndings of a recent study [ 96 ] support this hypothesis.
Sleep Loss and Energy Expenditure
Beside the changes in neurohormones involved in the regulation of food intake, reduced energy expenditure (EE) is to date a poorly explored pathway that could also link short sleep and the risk of obesity. The amount of total daily energy expenditure (TEE) comprises three components: (1) Resting metabolic rate (RMR, 60% of TEE) de fi ned as the energy expenditure of an individual under basal conditions (at rest, after an overnight fast); (2) Thermic effects of meal (TEM 10% of TEE), which includes the energy expenditure involved in digestion, absorption metabolism, and storage of food; (3) Activity-related energy expen-diture (AEE, 30% of TEE), which involves all volitional and non-volitional activities. For most individuals, AEE is not accounted for by physical exercise, but rather by low-moderate intensity activities of daily living such as sitting, standing, walking, and other occupational, volitional, and spontaneous activities, all together referred to as nonexercise activity thermogenesis (NEAT) [ 109 ] . AEE is the most variable component of TEE, has a major weight in the energy balance equation, and is critical for long-term weight maintenance.
Subjects with sleep problems and/or excessive daytime sleepiness have reported signi fi cant reductions in energy ratings and in levels of physical activity [ 110, 111 ] , which could re fl ect both reduced amounts of exercise and reductions in NEAT, and thus an overall decrease in AEE. Subjective sleepiness and fatigue increase imme-diately and signi fi cantly with sleep deprivation [ 112 ] , however, is not clear if these would affect volitional or non-volitional daily activities or other components of TEE. Prospective data from the Nurses’ Health Study showed differences in risk of weight gain in short sleepers but no differ-ence in self-reported levels of voluntary activity in the women sleeping £ 6 h per day vs. those
sleeping 7 h per day [ 113 ] . In the cross-sectional analysis of the CARDIA sleep study, BMI was independently associated with sleep duration and sleep fragmentation in over 600 early-middle-aged adults, and this association was not modi fi ed by accounting for self-reported levels of physical activity [ 26 ] . In participants in the Third National Health and Nutrition Examination Survey, self-reported fatigue was associated with a higher BMI, higher waist circumference, and a reduced likelihood of getting recommended levels of physical activity [ 114 ] .
The fi ndings from the fi ve studies that exam-ined the impact of short-term sleep restriction on physical activity have not been entirely consis-tent. In comparison with a rested night (7 to > 8 h in bed), Schmid et al. demonstrated that sleep restriction to 4 h for 2 nights led to a reduction in physical activity measured by accelerometry under free-living conditions, but there were no signi fi cant changes in food intake, hunger and appetite, and levels of leptin and ghrelin [ 89 ] . In contrast, Brondel et al., also using accelerometry, observed increased physical activity in the after-noon and evening after one night of PSD [ 97 ] , but caloric intake increased by 560 kcal with sleep deprivation, likely resulting in a overall positive energy balance. Bosy-Westphal et al. studied 14 healthy lean and obese women after 4 nights of 5.5 h in bed, by indirect calorimetry; compared to the rested condition (9 h sleep for 2 nights), there was no change in resting EE, even when adjusted for fat-free mass or total EE. In a protocol involving a more prolonged sleep restriction (14 nights of 5.5 h vs. 14 nights of 8.5 h in bed) in healthy overweight subjects who remained in the laboratory under sedentary con-ditions, total EE assessed by the gold standard doubly labeled water method, RMR assessed by indirect calorimetry, and the TEM were not affected by the bedtime condition [ 87 ] . The most recent study [ 98 ] examined EE by the doubly labeled water method in subjects who partici-pated in a randomized crossover design compari-son of 5 nights of 4 h in bed vs. 5 nights of 9 h in bed and did not detect a difference in TEE.
In sum, the bulk of the evidence points at reduced or unchanged energy expenditure in
160 S. Pannain et al.
subjects submitted to repeated partial sleep loss. Of note, a recent study that compared total energy expenditure during a night of sleep and during a night of TSD in subjects who remained in a whole room indirect calorimeter for 3 days found that the energy cost of sustained wakefulness across the night under sedentary conditions was only 134 ± 2 Kcal [ 115 ] . The energy cost of sleep restriction by 2–4 h per night is likely to be less, may be as low as 50–70 Kcal, in sharp contrast with 300–600 Kcal increases in energy intake which were observed in several laboratory stud-ies of partial sleep restriction [ 87, 98 ] .
Impact of Sleep Restriction on Diabetes Risk: Laboratory Studies
Studies in healthy volunteers who underwent experimental sleep restriction have unequivo-cally demonstrated that insuf fi cient sleep may cause alterations in glucose metabolism and have suggested mechanisms by which sleep loss might increase the risk of diabetes.
Total Sleep Deprivation
Kuhn et al. published in 1969 the very fi rst labo-ratory study of the effect of prolonged TSD (for 72–126 h) on oral glucose tolerance and showed that TSD leads to a marked increase in glucose levels [ 116 ] . These fi ndings were ignored for a long time, most probably because such extended periods of TSD are uncommon in real life. In 1981, another study involving 120 h of TSD demonstrated alterations of glucose metabolism at the level of the muscle consistent with a pre-diabetic state and increased fasting glucose levels at the end of the sleep deprivation period [ 117 ] . In 1993, a study involving 60 h of TSD observed increases in fasting insulin levels, as well as in the insulin response to OGTT, without change in glucose levels, suggesting decreased insulin sen-sitivity [ 118 ] . These important studies may not have had the scienti fi c impact they deserved because TSD is a condition invariably followed by sleep recovery and a correction of metabolic
abnormalities. Chronic PSD is much more com-mon and may involve irreversible alterations.
Partial Sleep Deprivation
The fi rst laboratory study of PSD in healthy lean adults [ 18 ] found that restricting sleep to 4 h per night for 6 nights resulted in a 40% decrease in glucose tolerance, impaired beta-cell function, reduced noninsulin-dependent glucose utiliza-tion, and a trend for decreased insulin sensitivity (SI) as assessed by minimal model analysis of a frequently sampled intravenous glucose toler-ance test (ivGTT). The ivGTT is a validated tool that provides assessments of SI, pancreatic beta-cell responsiveness (referred to as “acute insulin response to glucose”, AIRg), and glucose effec-tiveness (SG), a measure of noninsulin-dependent glucose disposal [ 119 ] . The SG was 30% lower in the state of sleep debt. AIRg was reduced by more than 30% after sleep restriction despite a trend for decreased SI. The disposition index (DI), i.e., the product of SI and AIRg, is a vali-dated marker of diabetes risk [ 120 ] . In the state of sleep debt, the DI was decreased by an average of about 40% as compared to the fully rested state. The glucose tolerance values observed after 5 nights of 4-h bedtimes in the young lean partici-pants were similar to those reported in older adults with impaired glucose tolerance [ 121 ] . The metabolic fi ndings in the sleep debt condi-tion were paralleled by an increase in the activity of the sympathetic nervous system. At the end of the recovery phase, glucose tolerance normalized to levels expected for healthy young adults [ 122 ] . A criticism of this initial “sleep debt study” is that sleep restriction (6 nights of 4-h bedtimes) was more severe than commonly occurring in real life. Also, the study did not follow a random-ized crossover design and therefore the possibil-ity of an order effect (sleep restriction preceded sleep extension) could not be excluded. These issues were addressed in a follow-up study of 2 nights with 10 h in bed vs. 2 nights with 4 h in a randomized crossover design [ 85 ] . After the second night of each bedtime condition, caloric intake was replaced by an intravenous glucose
16110 The Connection Between Sleep Loss, Obesity, and Type 2 Diabetes
infusion at a constant rate to avoid fl uctuations of hunger and appetite related to meal ingestion. Even though sleep duration was restricted for only two nights, glucose tolerance was decreased as observed in the initial study, partly as a result of inadequate insulin secretion [ 123 ] . In a recent study in non-obese healthy men, sleep restriction to 5 h per night for 1 week resulted in a signi fi cant reduction in SI as assessed by hyperinsulinemic euglycemic clamp, considered the gold standard method for SI determination [ 124 ] . The volun-teers also underwent an ivGTT on a separate day and again, SI was decreased following sleep restriction, without adequate compensation by insulin release and therefore diabetes risk, as assessed by the DI, was elevated. In a 2008 study involving women only and performed under ambulatory conditions without objective sleep assessment and without control of caloric intake, progressive sleep curtailment over 4 nights (for an average bedtime restriction of 2.5 h per night, relative to 8-h bedtimes) had no impact on oral glucose tolerance [ 87 ] . More recently, Nedeltcheva et al. [ 125 ] examined the effects of moderate but prolonged sleep curtailment (5.5 h per night for 14 nights) in sedentary middle-aged men and women, and observed a decrease in glu-cose tolerance due to decreased SI in the absence of adequate beta-cell compensation. In addition, SG was increased. Such recurrent bedtime restric-tion is closer to the sleep curtailment experienced by many people in everyday life, and in people at risk it may facilitate the development of insulin resistance, reduced glucose tolerance, and ulti-mately diabetes. Indeed, epidemiologic studies suggest that people who sleep less than 6 h per night are at higher risk of T2DM. Consistent fi ndings were reported by Van Leeuwen et al. who simulated in healthy young men the cumula-tive sleep debt as it can occur during a regular fi ve working days schedule [ 94 ] with bed times restricted to 4 h per night. After the fi fth day of sleep restriction, morning fasting glucose levels were unchanged, but fasting insulin concentra-tions were increased, suggesting reduced insulin sensitivity. After two nights of recovery sleep, fasting glucose was lower than at baseline, while insulin returned to baseline levels. The authors
suggested that the effects of one workweek of sleep restriction could be reversed by recovery sleep on weekends. Donga et al. evaluated SI in middle-aged men and women after one single night of partial sleep restriction with the hyperin-sulinemic euglycemic clamp and observed a reduction in glucose infusion and disposal rates, indicating a deterioration of glucose tolerance and peripheral insulin sensitivity [ 126 ] . They also assessed endogenous hepatic glucose production rate, by continuous infusion of [6,6-2H
2]-glucose,
and found an increase by approximately 22% after sleep restriction. Free fatty acid levels were also increased. These fi ndings point to increased insulin resistance at the level of the liver and adi-pose tissue, respectively.
Putative Mechanisms and Implication
Multiple pathways are likely to mediate the adverse effects of sleep loss on the risk of obesity and diabetes, and much work is needed to eluci-date their respective roles and interactions. Figure 10.2 presents a simpli fi ed schematic rep-resentation. Among the effects of insuf fi cient sleep that have been documented are alterations of the central neurohormonal control of energy homeostasis and glucose metabolism, a decrease in brain glucose utilization, an increase in sympa-thetic activity and a decrease in vagal tone, increases in the levels of circulating hormones counter-regulatory to insulin action (cortisol, growth hormone, and catecholamines), a putative decrease in EE, an increase in in fl ammation, and fi nally more time to eat.
An upregulation of the activity of orexin neu-rons, concentrated in the lateral hypothalamus, may be one of the primary mechanisms linking sleep deprivation and some of its adverse meta-bolic effects. Indeed, the orexin system plays a key role in the interaction between sleeping and feeding. Orexin producing neurons have an extensive and divergent projection system inner-vating numerous structures in the CNS including all the components of the ascending arousal system and the entire cortex [ 127 ] . This system is involved in the regulation of many functions such
162 S. Pannain et al.
as sleep–wakefulness, locomotor activity, feed-ing, thermoregulation, sympatho-vagal balance, and neuroendocrine and cardiovascular control [ 128 ] . Orexigenic neurons are fi ring during the wake period and are inactive during deep non-REM sleep due to a direct inhibition by GABA-ergic hypothalamic neurons [ 129 ] . Orexin-containing neurons play a central role in the maintenance of arousal. De fi ciencies in the orexin system are associated with sleep disorders that involve chronic excessive daytime sleepi-ness, including narcolepsy and OSA [ 130, 131 ] . In contrast, when sleep deprivation is enforced behaviorally, the orexin system is overactive, most likely to maintain wakefulness against the increased sleep pressure [ 132– 134 ] . There is evi-dence that orexins may stimulate food intake, particularly the early part of the usual sleep period, which is when voluntary sleep depriva-tion most often occurs in humans [ 130, 135 ] . Orexigenic neurons regulate the homeostatic feeding center in the hypothalamic arcuate nucleus (ARC), and concurrently affect hedonic feeding mediated by the “reward centers” (ven-tro-tegmental area and nucleus accumbens) [ 136, 137 ] . During starvation, the orexin neurons may
be disinhibited by low levels of the anorexigenic hormone leptin and low glucose levels [ 129 ] , and are excited by the hunger-promoting hormone ghrelin [ 138 ] . The peripheral metabolic cues, including insulin, leptin, and ghrelin, directly interact with ARC in the hypothalamus and ulti-mately indirectly modulate the activity of the orexigenic neurons to regulate food intake [ 135 ] . Additionally, the peripheral hormonal signals may in fl uence the activity of orexigenic neurons via vagal afferents to the nucleus of the solitary tract (NST) [ 139 ] .
As reviewed in this chapter, multiple studies of experimental sleep restriction have shown alterations in the metabolic hormones that are involved in the regulation of energy balance, including elevated evening cortisol levels, extended duration of daytime elevated growth hormone (GH) levels, and reductions in thyroid-stimulating hormone (TSH), lower leptin levels, and higher ghrelin levels [ 18, 84 ] . Insuf fi cient sleep also results in elevations of markers of sympathetic nervous activity and in decreases in vagal tone. At the level of the pancreatic beta cell, this altered sympatho-vagal balance is likely to impair the expected compensatory
Fig. 10.2 Schematic representation of the multiple pathways likely to mediate the adverse effects of sleep loss on the risk of obesity and diabetes
16310 The Connection Between Sleep Loss, Obesity, and Type 2 Diabetes
hyperinsulinemia needed to compensate the reduced insulin sensitivity associated with sleep loss. Furthermore, elevated cortisol levels have been shown to promote increased food intake and the accumulation of visceral fat in humans [ 140, 141 ] . Similarly, since TSH normally func-tions to stimulate basal metabolic rate, the reduc-tions in TSH resulting from sleep restriction [ 84 ] may lead to a reduction in EE.
Another important mechanism that may pro-mote hyperglycemia, considering that brain is the major user of glucose, is reduced brain glucose utilization after sleep deprivation, as shown by PET studies [ 142 ] . Finally, sleep loss and sleep disturbances have been associated with increased concentrations of C-reactive protein (CRP) [ 143 ] . Both partial and total sleep loss, in young, healthy individuals results in elevation of the levels of the in fl ammatory cytokine Il-6, which will in turn increase CPR production [ 144, 145 ] . TSD also increases the plasma levels of TNF-alpha soluble receptor 1 [ 146 ] . Low-grade in fl ammation predis-pose to both insulin and leptin resistance [ 147 ] . Thus, sleep disturbances appear to promote sys-temic in fl ammation that could, over time, further contribute to metabolic disturbances and increase the risk of obesity and diabetes. CRP has been recently proposed as a leptin-binding protein, and thus the increase in CRP resulting from sleep restriction may further limit the amount of free leptin that is able to penetrate the blood–brain barrier and inhibit central orexigenic activity.
Conclusion
In sum, the evidence reviewed in this chapter support the hypothesis that reduced sleep dura-tion may be part of the behavioral modi fi cations that played a role in the development of the cur-rent epidemics of obesity and diabetes. An impor-tant consideration when trying to explain the epidemiologic link between sleep loss and meta-bolic risk is that it is not clear whether the physi-ological effects of sleep restriction observed under laboratory conditions over a period of a few days can be translated to chronic sleep restriction as it occurs in free-living individuals.
Also, when comparing different laboratory stud-ies of sleep restriction, differences in the “dose” of sleep loss relative to the physiological need of the individual are often ignored. While the body of evidence suggestive of an interaction between sleep loss and the epidemics of obesity and dia-betes continues to build at a rapid pace, much remains to discover as far as mechanisms and the transition from short-term laboratory conditions to chronic PSD in real life. Intervention studies extending sleep in habitual short sleepers and examining the impact on metabolic outcomes are needed to further address the direction of causal-ity of the association between insuf fi cient sleep, obesity, and diabetes and the potential clinical implications.
Acknowledgments The preparation of this chapter was partly supported by NIH grants PO1 AG-11412, RO1 DK-071696, RO1 OH-009482, P50-HD057796, and P60-DK20595.
References
1. Keith SW, Redden DT, Katzmarzyk PT, et al. Putative contributors to the secular increase in obe-sity: exploring the roads less traveled. Int J Obes (Lond). 2006;30(11):1585–94.
2. Kripke D, Simons R, Gar fi nkel L, Hammond E. Short and long sleep and sleeping pills. Is increased mortality associated? Arch Gen Psychiatr. 1979;36(1):103–16.
3. Hublin C, Partinen M, Koskenvuo M, Kaprio J. Sleep and mortality: a population-based 22-year follow-up study. Sleep. 2007;30(10):1245–53.
4. National Sleep Foundation. 2008 Sleep in America poll. www.sleepfoundation.org. 2008.
5. National Center Health Statistics. QuickStats: per-centage of adults who reported an average of £ 6 hours of sleep per 24-hour period, by sex and age group - United States, 1985 and 2004. MMWR Morb Mortal Wkly Rep. 2005;54:933.
6. Center for Disease Control. Perceived insuf fi cient rest or sleep among adults - United States, 2008. MMWR Morb Mortal Wkly Rep. 2009;58(42):1175–9.
7. Lauderdale DS, Knutson KL, Yan LL, et al. Objectively measured sleep characteristics among early-middle-aged adults: the CARDIA study. Am J Epidemiol. 2006;164(1):5–16.
8. Pannain S, Van Cauter E. Modulation of endocrine function by sleep-wake homeostasis and circadian rhythmicity. Sleep Med Clin. 2007;2(2):147–59.
9. Center for Disease Control. Unhealthy sleep-related behaviors–12 States, 2009. MMWR Morb Mortal Wkly Rep. 2011;60(8):233–8.
10. Jean-Louis G, von Gizycki H, Zizi F, Spielman A, Hauri P, Taub H. The actigraph data analysis soft-ware: I. A novel approach to scoring and interpreting sleep-wake activity. Percept Mot Skills. 1997;85:207–16.
11. Lauderdale DS, Knutson KL, Yan LL, Liu K, Rathouz PJ. Self-reported and measured sleep duration: how similar are they? Epidemiology. 2008;19(6):838–45.
12. Finucane MM, Stevens GA, Cowan MJ, et al. National, regional, and global trends in body-mass index since 1980: systematic analysis of health examination surveys and epidemiological studies with 960 country-years and 9.1 million participants. Lancet. 2011;377(9765):557–67.
13. McAllister EJ, Dhurandhar NV, Keith SW, et al. Ten putative contributors to the obesity epidemic. Crit Rev Food Sci Nutr. 2009;49(10):868–913.
14. Morselli L, Leproult R, Balbo M, Spiegel K. Role of sleep duration in the regulation of glucose metabo-lism and appetite. Best Pract Res Clin Endocrinol Metab. 2010;24(5):687–702.
15. Knutson KL. Sleep duration and cardiometabolic risk: a review of the epidemiologic evidence. Best Pract Res Clin Endocrinol Metab. 2010;24(5):731–43.
16. Pannain S, Van Cauter E. Sleep loss, obesity and diabetes: prevalence, association and emerging evi-dence for causation. Obesity Metabol. 2008;4(1):28–41.
17. Patel SR, Hu FB. Short sleep duration and weight gain: a systematic review. Obesity (Silver Spring). 2008;16(3):643–53.
18. Spiegel K, Leproult R, Van Cauter E. Impact of sleep debt on metabolic and endocrine function. Lancet. 1999;354(9188):1435–9.
19. Taheri S, Lin L, Austin D, Young T, Mignot E. Short sleep duration is associated with reduced leptin, ele-vated ghrelin, and increased body mass index. PLoS Med. 2004;1(3):e62.
20. Beccuti G, Pannain S. Sleep and obesity. Curr Opin Clin Nutr Metab Care. 2011;14(4):402–12.
21. Cappuccio FP, Taggart FM, Kandala NB, et al. Meta-analysis of short sleep duration and obesity in chil-dren and adults. Sleep. 2008;31(5):619–26.
22. Gunderson EP, Rifas-Shiman SL, Oken E, et al. Association of fewer hours of sleep at 6 months postpartum with substantial weight retention at 1 year postpartum. Am J Epidemiol. 2008;167(2):178–87.
23. Chaput JP, Despres JP, Bouchard C, Tremblay A. The association between sleep duration and weight gain in adults: a 6-year prospective study from the Quebec Family Study. Sleep. 2008;31(4):517–23.
24. Lopez-Garcia E, Faubel R, Leon-Munoz L, Zuluaga MC, Banegas JR, Rodriguez-Artalejo F. Sleep dura-tion, general and abdominal obesity, and weight change among the older adult population of Spain. Am J Clin Nutr. 2008;87(2):310–6.
25. Chaput JP, Leblanc C, Perusse L, Despres JP, Bouchard C, Tremblay A. Risk factors for adult overweight and obesity in the Quebec Family Study: have we been barking up the wrong tree? Obesity (Silver Spring). 2009;17(10):1964–70.
26. Lauderdale DS, Knutson KL, Rathouz PJ, Yan LL, Hulley SB, Liu K. Cross-sectional and longitudinal associations between objectively measured sleep duration and body mass index: the CARDIA Sleep Study. Am J Epidemiol. 2009;170(7):805–13.
27. Watanabe M, Kikuchi H, Tanaka K, Takahashi M. Association of short sleep duration with weight gain and obesity at 1-year follow-up: a large-scale pro-spective study. Sleep. 2010;33(2):161–7.
28. Nishiura C, Hashimoto H. A 4-year study of the association between short sleep duration and change in body mass index in Japanese male workers. J Epidemiol. 2010;20(5):385–90.
29. Hairston KG, Bryer-Ash M, Norris JM, Haffner S, Bowden DW, Wagenknecht LE. Sleep duration and fi ve-year abdominal fat accumulation in a minority cohort: the IRAS family study. Sleep. 2010;33(3):289–95.
30. Bo S, Ciccone G, Durazzo M, et al. Contributors to the obesity and hyperglycemia epidemics. A pro-spective study in a population-based cohort. Int J Obes (Lond). 2011;35(11):1442–9.
31. Chaput JP, Despres JP, Bouchard C, Tremblay A. Longer sleep duration associates with lower adipos-ity gain in adult short sleepers. International Journal of Obesity advance online publication, 7 June 2011; doi:10.1038/ijo.2011.110.
32. van den Berg JF, Knvistingh Neven A, Tulen JH, et al. Actigraphic sleep duration and fragmenta-tion are related to obesity in the elderly: the Rotterdam study. Int J Obes (Lond). 2008;32(7):1083–90.
33. Vgontzas AN, Lin HM, Papaliaga M, et al. Short sleep duration and obesity: the role of emotional stress and sleep disturbances. Int J Obes (Lond). 2008;32(5):801–9.
34. Hall MH, Muldoon MF, Jennings JR, Buysse DJ, Flory JD, Manuck SB. Self-reported sleep duration is associated with the metabolic syndrome in midlife adults. Sleep. 2008;31(5):635–43.
35. Choi KM, Lee JS, Park HS, Baik SH, Choi DS, Kim SM. Relationship between sleep duration and the metabolic syndrome: Korean National Health and Nutrition Survey 2001. Int J Obes (Lond). 2008;32(7):1091–7.
36. Park SE, Kim HM, Kim DH, Kim J, Cha BS, Kim DJ. The association between sleep duration and gen-eral and abdominal obesity in Koreans: data from the Korean National Health and Nutrition Examination Survey, 2001 and 2005. Obesity (Silver Spring). 2009;17(4):767–71.
37. St-Onge MP, Perumean-Chaney S, Desmond R, et al. Gender differences in the association between sleep duration and body composition: the Cardia study. Int J Endocrinol. 2010:726071.
16510 The Connection Between Sleep Loss, Obesity, and Type 2 Diabetes
38. Adamkova V, Hubacek JA, Lanska V, et al. Association between duration of the sleep and body weight. Physiol Res. 2009;58 Suppl 1:S27–31.
39. Di Milia L, Mummery K. The association between job related factors, short sleep and obesity. Ind Health. 2009;47(4):363–8.
40. Thomas A, Schussler MN, Fischer JE, Terris DD. Employees’ sleep duration and body mass index: potential confounders. Prev Med. 2009;48(5):467–70.
41. Watson NF, Buchwald D, Vitiello MV, Noonan C, Goldberg J. A twin study of sleep duration and body mass index. J Clin Sleep Med. 2010;6(1):11–7.
42. Buxton OM, Marcelli E. Short and long sleep are positively associated with obesity, diabetes, hyperten-sion, and cardiovascular disease among adults in the United States. Soc Sci Med. 2010;71(5):1027–36.
43. Magee CA, Iverson DC, Caputi P. Sleep duration and obesity in middle-aged Australian adults. Obesity (Silver Spring). 2010;18(2):420–1.
44. Magee CA, Caputi P, Iverson DC. Is sleep duration associated with obesity in older Australian adults? J Aging Health. 2010;22(8):1235–55.
45. Magee CA, Caputi P, Iverson DC. Short sleep medi-ates the association between long work hours and increased body mass index. J Behav Med. 2011;34:83–91.
46. Anic GM, Titus-Ernstoff L, Newcomb PA, Trentham-Dietz A, Egan KM. Sleep duration and obesity in a population-based study. Sleep Med. 2010;11(5):447–51.
47. Theorell-Haglow J, Berne C, Janson C, Sahlin C, Lindberg E. Associations between short sleep dura-tion and central obesity in women. Sleep. 2010;33(5):593–8.
48. Knutson KL. Association between sleep duration and body size differs among three Hispanic groups. Am J Hum Biol. 2011;23(1):138–41.
49. Baron KG, Reid KJ, Kern AS, Zee PC. Role of sleep timing in caloric intake and BMI. Obesity (Silver Spring). 2011;19(7):1374–81.
50. Kim S, DeRoo LA, Sandler DP. Eating patterns and nutritional characteristics associated with sleep dura-tion. Public Health Nutr. 2011;14(5):889–95.
51. Liu R, Liu X, Arguelles LM, et al. A population-based twin study on sleep duration and body compo-sition. Obesity (Silver Spring). 2011;20:192–9.
52. Wheaton AG, Perry GS, Chapman DP, McKnight-Eily LR, Presley-Cantrell LR, Croft JB. Relationship between body mass index and per-ceived insuf fi cient sleep among U.S. adults: an analysis of 2008 BRFSS data. BMC Public Health. 2011;11:295.
53. Cizza G, Marincola P, Mattingly M, et al. Treatment of obesity with extension of sleep duration: a ran-domized, prospective, controlled trial. Clin Trials. 2010;7(3):274–85.
54. Silva GE, Goodwin JL, Sherrill DL, et al. Relationship between reported and measured sleep times: the Sleep Heart Health Study (SHHS). J Clin Sleep Med. 2007;3(6):622–30.
55. Patel SR, Blackwell T, Redline S, et al. The associa-tion between sleep duration and obesity in older adults. Int J Obes (Lond). 2008;32(12):1825–34.
56. Gangwisch JE, Malaspina D, Boden-Albala B, Heyms fi eld SB. Inadequate sleep as a risk factor for obesity: analyses of the NHANES I. Sleep. 2005;28(10):1289–96.
57. Cappuccio FP, D’Elia L, Strazzlillo P, Miller MA. Quantity and quality of sleep and incidence of type 2 diabetes - a systematic review and meta-analysis. Diabetes Care. 2010;33(2):414–20.
58. Chaput JP, Despres JP, Bouchard C, Astrup A, Tremblay A. Sleep duration as a risk factor for the development of type 2 diabetes or impaired glucose tolerance: analyses of the Quebec Family Study. Sleep Med. 2009;10(8):919–24.
59. Chao CY, Wu JS, Yang YC, et al. Sleep duration is a potential risk factor for newly diagnosed type 2 dia-betes mellitus. Metabolism. 2011;60(6):799–804.
60. Beihl DA, Liese AD, Haffner SM. Sleep duration as a risk factor for incident type 2 diabetes in a multi-ethnic cohort. Ann Epidemiol. 2009;19(5):351–7.
61. Rafalson L, Donahue RP, Stranges S, et al. Short sleep duration is associated with the development of impaired fasting glucose: the Western New York Health Study. Ann Epidemiol. 2010;20(12):883–9.
62. Xu Q, Song Y, Hollenbeck A, Blair A, Schatzkin A, Chen H. Day napping and short night sleeping are associated with higher risk of diabetes in older adults. Diabetes Care. 2010;33(1):78–83.
63. Vgontzas AN, Liao D, Pejovic S, Calhoun S, Karataraki M, Bixler EO. Insomnia with objective short sleep duration is associated with type 2 diabe-tes: a population-based study. Diabetes Care. 2009;32(11):1980–5.
64. Kim J, Kim HM, Kim KM, Kim DJ. The association of sleep duration and type 2 diabetes in Korean male adults with abdominal obesity: the Korean National Health and Nutrition Examination Survey 2005. Diabetes Res Clin Pract. 2009;86(2):e34–6.
65. Shankar A, Syamala S, Kalidindi S. Insuf fi cient rest or sleep and its relation to cardiovascular disease, diabetes and obesity in a national, multiethnic sam-ple. PLoS One. 2010;5(11):e14189.
66. Knutson KL, Van Cauter E, Zee P, Liu K, Lauderdale DS. Cross-sectional associations between measures of sleep and markers of glucose metabolism among subjects with and without diabetes: the Coronary Artery Risk Development in Young Adults (CARDIA) Sleep Study. Diabetes Care. 2011;34(5):1171–6.
67. Qiu C, Enquobahrie D, Frederick IO, Abetew D, Williams MA. Glucose intolerance and gestational diabetes risk in relation to sleep duration and snoring during pregnancy: a pilot study. BMC Womens Health. 2010;10:17.
68. Facco FL, Grobman WA, Kramer J, Ho KH, Zee PC. Self-reported short sleep duration and frequent snoring in pregnancy: impact on glucose metabo-lism. Am J Obstet Gynecol. 2010;203(2):142 e141–5.
166 S. Pannain et al.
69. Reutrakul S, Zaidi N, Wroblewski K, et al. Sleep dis-turbances and their relationship to glucose tolerance in pregnancy. Diabetes Care. 2011;34(11):2454–7.
70. Picarsic JL, Glynn NW, Taylor CA, et al. Self-reported napping and duration and quality of sleep in the life-style interventions and independence for elders pilot study. J Am Geriatr Soc. 2008;56(9):1674–80.
71. Goldman SE, Hall M, Boudreau R, et al. Association between nighttime sleep and napping in older adults. Sleep. 2008;31(5):733–40.
72. Asplund R. Daytime sleepiness and napping amongst the elderly in relation to somatic health and medical treatment. J Intern Med. 1996;239(3):261–7.
73. Hicks RA, Lucero-Gorman K, Bautista J, Hicks GJ. Ethnicity, sleep duration, and sleep satisfaction. Percept Mot Skills. 1999;88(1):234–5.
74. Cowie CC, Rust KF, Ford ES, et al. Full accounting of diabetes and pre-diabetes in the U.S. population in 1988-1994 and 2005-2006. Diabetes Care. 2009;32(2):287–94.
75. Knutson KL, Ryden AM, Mander BA, Van Cauter E. Role of sleep duration and quality in the risk and severity of type 2 diabetes mellitus. Arch Intern Med. 2006;166(16):1768–74.
76. Lee KA, Zaffke ME, McEnany G. Parity and sleep patterns during and after pregnancy. Obstet Gynecol. 2000;95(1):14–8.
77. Sahota PK, Jain SS, Dhand R. Sleep disorders in preg-nancy. Curr Opin Pulm Med. 2003;9(6):477–83.
78. Van Cauter E, Polonsky KS, Scheen AJ. Roles of cir-cadian rhythmicity and sleep in human glucose regu-lation. Endocr Rev. 1997;18(5):716–38.
79. Simon C, Gron fi er C, Schlienger JL, Brandenberger G. Circadian and ultradian variations of leptin in normal man under continuous enteral nutrition: rela-tionship to sleep and body temperature. J Clin Endocrinol Metab. 1998;83:1893–9.
80. Mullington JM, Chan JL, Van Dongen HP, et al. Sleep loss reduces diurnal rhythm amplitude of leptin in healthy men. J Neuroendocrinol. 2003;15(9):851–4.
81. Dzaja A, Dalal MA, Himmerich H, Uhr M, Pollmacher T, Schuld A. Sleep enhances nocturnal plasma ghrelin levels in healthy subjects. Am J Physiol Endocrinol Metab. 2004;286(6):E963–7.
82. Schmid SM, Hallschmid M, Jauch-Chara K, Bandorf N, Born J, Schultes B. Sleep loss alters basal meta-bolic hormone secretion and modulates the dynamic counterregulatory response to hypoglycemia. J Clin Endocrinol Metab. 2007;92(8):3044–51.
83. Guilleminault C, Powell NB, Martinez S, et al. Preliminary observations on the effects of sleep time in a sleep restriction paradigm. Sleep Med. 2003;4(3):177–84.
84. Spiegel K, Leproult R, L’Hermite-Baleriaux M, Copinschi G, Penev PD, Van Cauter E. Leptin levels are dependent on sleep duration: relationships with sympathovagal balance, carbohydrate regulation, cortisol, and thyrotropin. J Clin Endocrinol Metab. 2004;89(11):5762–71.
85. Spiegel K, Tasali E, Penev P, Van Cauter E. Brief communication: sleep curtailment in healthy young men is associated with decreased leptin levels, ele-vated ghrelin levels, and increased hunger and appe-tite. Ann Intern Med. 2004;141(11):846–50.
86. Schmid SM, Hallschmid M, Jauch-Chara K, Born J, Schultes B. A single night of sleep deprivation increases ghrelin levels and feelings of hunger in normal-weight healthy men. J Sleep Res. 2008;17(3):331–4.
87. Bosy-Westphal A, Hinrichs S, Jauch-Chara K, et al. In fl uence of partial sleep deprivation on energy bal-ance and insulin sensitivity in healthy women. Obes Facts. 2008;1(5):266–73.
88. Schmid SM, Jauch-Chara K, Hallschmid M, Schultes B. Mild sleep restriction acutely reduces plasma glu-cagon levels in healthy men. J Clin Endocrinol Metab. 2009;94(12):5169–73.
89. Schmid SM, Hallschmid M, Jauch-Chara K, et al. Short-term sleep loss decreases physical activity under free-living conditions but does not increase food intake under time-deprived laboratory condi-tions in healthy men. Am J Clin Nutr. 2009;90(6):1476–82.
90. Magee C, Huang X, Iverson D, Caputi P. Acute sleep restriction alters neuroendocrine hormones and appetite in healthy male adults. Sleep Biol Rhythms. 2009;7:125–7.
91. Tasali E, Broussard J, Day A, Kilkus J, Van Cauter E. Sleep curtailment in healthy young adults is asso-ciated with increased ad lib food intake. Sleep. 2009;32(Suppl):A163.
92. Nedeltcheva AV, Kilkus JM, Imperial J, Kasza K, Schoeller DA, Penev PD. Sleep curtailment is accompanied by increased intake of calories from snacks. Am J Clin Nutr. 2009;89(1):126–33.
93. Omisade A, Buxton OM, Rusak B. Impact of acute sleep restriction on cortisol and leptin levels in young women. Physiol Behav. 2010;99(5):651–6.
94. van Leeuwen WM, Hublin C, Sallinen M, Harma M, Hirvonen A, Porkka-Heiskanen T. Prolonged sleep restriction affects glucose metabolism in healthy young men. Int J Endocrinol. 2010;2010:108641.
95. Simpson NS, Banks S, Dinges DF. Sleep restriction is associated with increased morning plasma leptin concentrations, especially in women. Biol Res Nurs. 2010;12(1):47–53.
96. Nedeltcheva AV, Kilkus JM, Imperial J, Schoeller DA, Penev PD. Insuf fi cient sleep undermines dietary efforts to reduce adiposity. Ann Intern Med. 2010;153(7):435–41.
97. Brondel L, Romer MA, Nougues PM, Touyarou P, Davenne D. Acute partial sleep deprivation increases food intake in healthy men. Am J Clin Nutr. 2010;91(6):1550–9.
98. St-Onge MP, Roberts AL, Chen J, et al. Short sleep duration increases energy intakes but does not change energy expenditure in normal-weight indi-viduals. Am J Clin Nutr. 2011;94(2):410–6.
16710 The Connection Between Sleep Loss, Obesity, and Type 2 Diabetes
99. Ahima RS, Saper CB, Flier JS, Elmquist JK. Leptin regulation of neuroendocrine systems. Front Neuroendocrinol. 2000;21(3):263–307.
100. Kolaczynski JW, Considine RV, Ohannesian J, et al. Responses of leptin to short-term fasting and refeed-ing in humans: a link with ketogenesis but not ketones themselves. Diabetes. 1996;45(11):1511–5.
101. Chin-Chance C, Polonsky KS, Schoeller D. Twenty-four hour leptin levels respond to cumulative short-term energy imbalance and predict subsequent intake. J Clin Endocrinol Metab. 2000;85:2685–91.
102. Pejovic S, Vgontzas AN, Basta M, et al. Leptin and hunger levels in young healthy adults after one night of sleep loss. J Sleep Res. 2010;19(4):552–8.
103. Havel PJ. Peripheral signals conveying metabolic information to the brain: short-term and long-term regulation of food intake and energy homeostasis. Exp Biol Med. 2001;226(11):963–77.
104. Spiegel K, Tasali E, Leproult R, Scherberg N, Van Cauter E. Twenty-four-hour pro fi les of acylated and total ghrelin: relationship with glucose levels and impact of time of day and sleep. J Clin Endocrinol Metab. 2010;96(2):486–93.
105. Chin-Chance C, Polonsky KS, Schoeller DA. Twenty-four-hour leptin levels respond to cumulative short-term energy imbalance and predict subsequent intake. J Clin Endocrinol Metabol. 2000;85(8):2685–91.
106. Scheer FA, Hilton MF, Mantzoros CS, Shea SA. Adverse metabolic and cardiovascular consequences of circadian misalignment. Proc Natl Acad Sci USA. 2009;106(11):4453–8.
107. Hayes AL, Xu F, Babineau D, Patel SR. Sleep dura-tion and circulating adipokine levels. Sleep. 2011;34(2):147–52.
108. Knutson KL, Galli G, Zhao X, Mattingly M, Cizza G. No association between leptin levels and sleep duration or quality in obese adults. Obesity (Silver Spring). 2011;19(12):2433–5.
109. Rising R. Total daily energy expenditure. J Am Coll Nutr. 1994;13(4):309–10.
110. Weaver T, Laizner A, Evans L, et al. An instrument to measure functional status outcomes for disorders of excessive sleepiness. Sleep. 1997;20(10):835–43.
111. Briones B, Adams N, Strauss M, et al. Sleepiness and health: relationship between sleepiness and gen-eral health status. Sleep. 1996;19(7):583–8.
112. Dinges D, Pack F, Williams K, et al. Cumulative sleepiness, mood disturbance, and psychomotor vig-ilance performance decrements during a week of sleep restricted to 4-5 hours per night. Sleep. 1997;20:267–77.
113. Patel SR, Malhotra A, White DP, Gottlieb DJ, Hu FB. Association between reduced sleep and weight gain in women. Am J Epidemiol. 2006;164(10):947–54.
114. Resnick HE, Carter EA, Aloia M, Phillips B. Cross-sectional relationship of reported fatigue to obesity, diet, and physical activity: results from the third national health and nutrition examination survey. J Clin Sleep Med. 2006;2(2):163–9.
115. Jung CM, Melanson EL, Frydendall EJ, Perreault L, Eckel RH, Wright KP. Energy expenditure during sleep, sleep deprivation and sleep following sleep deprivation in adult humans. J Physiol. 2011;589(Pt 1):235–44.
116. Kuhn E, Brodan V, Brodanova M, Rysanek K. Metabolic effects of sleep deprivation. Activitas Nervosa Superior . 1969(11-3-1969):165–74.
117. Vondra K, Brodan V, Bass A, et al. Effects of sleep deprivation on the activity of selected metabolic enzymes in skeletal muscle. Eur J Appl Physiol Occup Physiol. 1981;47(1):41–6.
118. VanHelder T, Symons JD, Radomski MW. Effects of sleep deprivation and exercise on glucose tolerance. Aviat Space Environ Med. 1993;64:487–92.
120. Lyssenko V, Almgren P, Anevski D, et al. Predictors of and longitudinal changes in insulin sensitivity and secretion preceding onset of type 2 diabetes. Diabetes. 2005;54(1):166–74.
121. Garcia G, Freeman R, Supiano M, Smith M, Galecki A, Halter J. Glucose metabolism in older adults: a study including subjects more than 80 years of age. J Am Geriatr Soc. 1997;45:813–7.
122. Prigeon RL, Kahn SE, Porte Jr D. Changes in insulin sensitivity, glucose effectiveness, and B-cell func-tion in regularly exercising subjects. Metabolism. 1995;44(10):1259–63.
123. Spiegel K, Knutson K, Leproult R, Tasali E, Van Cauter E. Sleep loss: a novel risk factor for insulin resistance and type 2 diabetes. J Appl Physiol. 2005;99(5):2008–19.
124. Buxton OM, Pavlova M, Reid EW, Wang W, Simonson DC, Adler GK. Sleep restriction for 1 week reduces insulin sensitivity in healthy men. Diabetes. 2010;59(9):2126–33.
125. Nedeltcheva AV, Kessler L, Imperial J, Penev PD. Exposure to recurrent sleep restriction in the setting of high caloric intake and physical inactivity results in increased insulin resistance and reduced glucose toler-ance. J Clin Endocrinol Metab. 2009;94(9):3242–50.
126. Donga E, van Dijk M, van Dijk JG, et al. A single night of partial sleep deprivation induces insulin resis-tance in multiple metabolic pathways in healthy sub-jects. J Clin Endocrinol Metab. 2010;95(6):2963–8.
127. Saper CB, Scammell TE, Lu J. Hypothalamic regu-lation of sleep and circadian rhythms. Nature. 2005;437(7063):1257–63.
128. Nunez A, Rodrigo-Angulo ML, Andres ID, Garzon M. Hypocretin/orexin neuropeptides: participation in the control of sleep-wakefulness cycle and energy homeostasis. Curr Neuropharmacol. 2009;7(1):50–9.
129. Saper CB, Chou TC, Elmquist JK. The need to feed: homeostatic and hedonic control of eating. Neuron. 2002;36(2):199–211.
130. Sakurai T. Roles of orexin/hypocretin in regulation of sleep/wakefulness and energy homeostasis. Sleep Med Rev. 2005;9(4):231–41.
168 S. Pannain et al.
131. de Lecea L, Sutcliffe JG. The hypocretins and sleep. FEBS J. 2005;272(22):5675–88.
132. Wu MF, John J, Maidment N, Lam HA, Siegel JM. Hypocretin release in normal and narcoleptic dogs after food and sleep deprivation, eating, and move-ment. Am J Physiol Regul Integr Comp Physiol. 2002;283(5):R1079–86.
133. Estabrooke IV, McCarthy MT, Ko E, et al. Fos expression in orexin neurons varies with behavioral state. J Neurosci. 2001;21(5):1656–62.
134. Zeitzer JM, Buckmaster CL, Lyons DM, Mignot E. Increasing length of wakefulness and modulation of hypocretin-1 in the wake-consolidated squirrel mon-key. Am J Physiol Regul Integr Comp Physiol. 2007;293(4):R1736–42.
135. Adamantidis A, de Lecea L. The hypocretins as sensors for metabolism and arousal. J Physiol. 2009;587(Pt 1):33–40.
136. Harris GC, Aston-Jones G. Arousal and reward: a dichotomy in orexin function. Trends Neurosci. 2006;29(10):571–7.
137. Harris GC, Wimmer M, Aston-Jones G. A role for lateral hypothalamic orexin neurons in reward seek-ing. Nature. 2005;437(7058):556–9.
138. Yamanaka A, Beuckmann CT, Willie JT, et al. Hypothalamic orexin neurons regulate arousal according to energy balance in mice. Neuron. 2003;38(5):701–13.
139. Badman MK, Flier JS. The gut and energy balance: visceral allies in the obesity wars. Science. 2005;307(5717):1909–14.
140. Rosmond R, Dallman MF, Bjorntorp P. Stress-related cortisol secretion in men: relationships with abdomi-nal obesity and endocrine, metabolic and hemody-namic abnormalities. J Clin Endocrinol Metab. 1998;83(6):1853–9.
141. Bjorntorp P, Rosmond R. Obesity and cortisol. Nutrition. 2000;16(10):924–36.
142. Thomas M, Sing H, Belenky G, et al. Neural basis of alertness and cognitive performance impairments during sleepiness. I. Effects of 24 h of sleep depriva-tion on waking human regional brain activity. J Sleep Res. 2000;9(4):335–52.
143. Meier-Ewert HK, Ridker PM, Rifai N, et al. Effect of sleep loss on C-reactive protein, an in fl ammatory marker of cardiovascular risk. J Am Coll Cardiol. 2004;43(4):678–83.
144. Vgontzas AN, Papanicolaou DA, Bixler EO, et al. Circadian interleukin-6 secretion and quantity and depth of sleep. J Clin Endocrinol Metab. 1999;84(8):2603–7.
145. Vgontzas AN, Zoumakis E, Bixler EO, et al. Adverse effects of modest sleep restriction on sleepiness, per-formance, and in fl ammatory cytokines. J Clin Endocrinol Metab. 2004;89(5):2119–26.
146. Shearer WT, Reuben JM, Mullington JM, et al. Soluble TNF-alpha receptor 1 and IL-6 plasma lev-els in humans subjected to the sleep deprivation model of space fl ight. [see comments]. J Allergy Clin Immunol. 2001;107(1):165–70.
147. Chen K, Li F, Li J, et al. Induction of leptin resis-tance through direct interaction of C-reactive protein with leptin. Nat Med. 2006;12(4):425–32.