Overview of the Yarrabah and broader Cairns region Slide 1 Department of Employment Overview of the Yarrabah and broader Cairns region 9 December 2014 Ivan Neville Branch Manager Labour Market Research and Analysis Branch
Transcript
Overview of the Yarrabah and broader Cairns region
Slide 1
Department of Employment
Overview of the Yarrabah and broader Cairns region
9 December 2014
Ivan Neville
Branch Manager
Labour Market Research and Analysis Branch
Slide 2Cairns and Yarrabah
Cairns and Yarrabah
The Cairns Region is made up of the following Local Government Areas:
Cairns LGACassowary Coast LGATablelands LGAYarrabah LGA• SLAs within the Cairns LGA:
• SLAs within the Tablelands LGA:- Atherton- Eacham- Herberton- Mareeba
• SLAs within the Yarrabah LGA:- Yarrabah
Slide 3How young people are going in your labour market
Indicator Cairns region Australia
Youth Unemployment rate 20.5% 13.1%
Proportion of unemployed who are long term unemployed 25% 22%
Young people neither studying nor working 23% 13%
Completed Year 12 (25-34 years) 69% 75%
Families who are jobless 20% 14%
How young people are going in your labour marketSource: ABS, Labour Force Survey, October 2014 (12 month averages); ABS, Census of Population and Housing 2011; Department of Employment administrative data, September 2014; Estimated Residential Population, 2012
This table shows the economic indicators that affect a young person in the Cairns region, compared with Australia.
Slide 4Cairns and Yarrabah Population Profile
Region Adult Population (15+) 2012
Growth (15+) 2007 to 2012 Median Age 2011
Cairns LGA 129,980 13% 36
Cassowary Coast LGA 23,270 2% 42
Tablelands LGA 36,360 7% 43
Yarrabah LGA 1,720 10% 22
Cairns region 191,330 10% 38
Queensland 3,658,500 12% 36
Australia 18,419,600 10% 37
Cairns and Yarrabah Population ProfileSource: Estimated Residential Population, 2007 and 2012; ABS, Census of Population and Housing 2011
The adult population in the Cairns region grew by 10 per cent from 2007 to 2012, on par with Australia (10 per cent).
Slide 5People in Yarrabah stay in Yarrabah
People in Yarrabah stay in YarrabahSource: ABS, Census of Population and Housing 2011
85 per cent of the people who lived in Yarrabah at the time of the 2011 Census were there for 5 years or longer.
Only 15 per cent of the 2011 Census population in Yarrabah moved to the region in the 5 years prior to the Census.
Slide 6Age distribution
Age distributionSource: ABS Estimated Residential Population, 2012
This graph shows the age distributions of the Cairns region as of 2012.
While there is a dip in the 20-34 year old proportion of the population, this is relatively small compared with some other regions in Australia.
Slide 7Higher unemployment rate
Higher unemployment rateSource: ABS Labour Force Data, October 2014 (12 month averages)
The unemployment rate for the Cairns region has remained consistently above the national rate since February 2008.
Slide 8Regional disparity
RegionUnemployment Rate
June 2014
Cairns LGA 7.4%
Cassowary Coast LGA 7.4%
Tablelands LGA 9.0%
Yarrabah LGA 54.7%
Cairns region 7.9%
Regional disparitySource: Department of Employment, Small Area Labour Markets, June Quarter 2014
In June 2014 the unemployment rate in the Cairns region was 7.9 per cent.
Within the Cairns region, the Yarrabah LGA had the highest unemployment rate (54.7 per cent).
Slide 9Indigenous labour market outcomes weaker
RegionIndigenous Population
(WAP)
Unemployment Rate Participation Rate
Indigenous Non-Indigenous Indigenous Non-
Indigenous
Cairns LGA 8% 24.0% 5.7% 57.2% 80.8%
Cassowary Coast LGA 9% 18.5% 5.4% 59.0% 77.7%
Tablelands LGA 11% 29.2% 5.5% 41.0% 74.4%
Yarrabah LGA 97% 63.2% - 53.5% 77.5%
Cairns region 10% 28.3% 5.6% 53.8% 79.3%
Queensland 3% 24.0% 5.7% 57.2% 80.8%
Indigenous labour market outcomes weakerSource: ABS, Census of Population and Housing, 2011
A relatively large proportion of the working age population of the Cairns region(10 per cent) is from an Indigenous background compared with Queensland (3 per cent)
Indigenous people in the Cairns region typically face weaker labour market outcomes, with high unemployment (28.3 per cent) and low participation (53.8 per cent) compared with Non-Indigenous people.
Slide 10One quarter of unemployed are long-term unemployed
Region
Long-term unemployed(52 weeks or more) Average duration of
unemployment (weeks)
Persons Per cent of all unemployed
Cairns SA4 2,400 25% 41 Weeks
Queensland 34,000 22% 38 Weeks
Australia 160,100 22% 41 Weeks
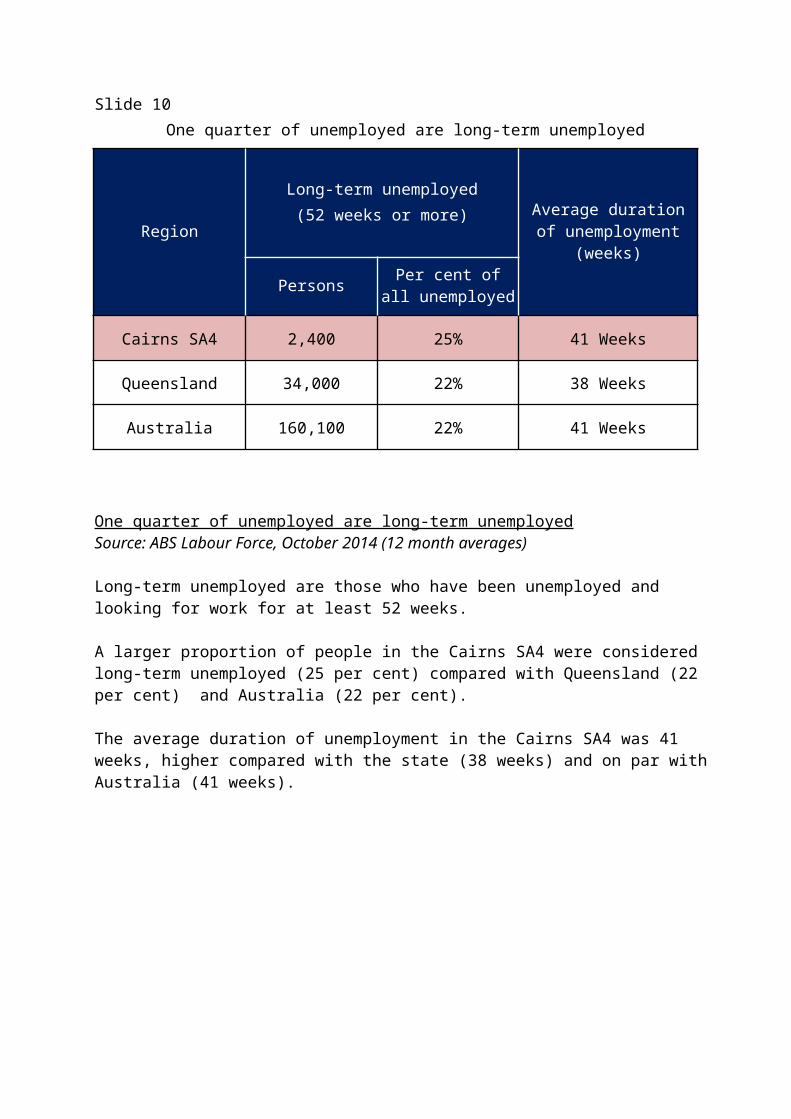
One quarter of unemployed are long-term unemployedSource: ABS Labour Force, October 2014 (12 month averages)
Long-term unemployed are those who have been unemployed and looking for work for at least 52 weeks. A larger proportion of people in the Cairns SA4 were considered long-term unemployed (25 per cent) compared with Queensland (22 per cent) and Australia (22 per cent). The average duration of unemployment in the Cairns SA4 was 41 weeks, higher compared with the state (38 weeks) and on par with Australia (41 weeks).
Slide 11What are people in Yarrabah doing?
What are people in Yarrabah doing?Source: ABS, Census of Population and Housing, 2011
300 people were employed in Yarrabah, of these people 37 per cent were employed in Public Administration and Safety, 21 per cent employed in Health Care and Social Assistance and 60 per cent were aged 35-54 years old.
1,160 people were not in work or education/training in Yarrabah, of these people 85 per cent
were aged between 15-54 years.
75 per cent of the Yarrabah adult population are not studying, not employed or not looking for
work.
Slide 12High rates of income support in Yarrabah
High rates of income support in YarrabahSource: Department of Employment, Administrative data, December 2013 and December 2012; Estimated Resident Population, 2012
83 per cent of the adult population in Yarrabah are in receipt of an income support payment.
Of these people, 35 per cent were on unemployment benefits, 13 per cent were on parenting payments and 12 per cent on ABSTUDY payments.
Slide 13Jobless families - Families with children under the age of 15 - Cairns region
Jobless families - Families with children under the age of 15 - Cairns regionSource: ABS, Census of Population and Housing, 2011
At the time of the 2011 Census: • 20 per cent of families with children under the age of 15 (4,500 families) in the region were
jobless.• 47 per cent of one parent families with children under the age of 15 (3,300 families) in the
region were jobless.• There were around 9,000 children (15 years and under) from jobless families.
High youth unemploymentSource: ABS, Labour Force Survey, October 2014 (12 month averages)
The youth (15-24 years) unemployment rate in Cairns (20.5 per cent) was higher compared with Queensland (13.8 per cent) and Australia (13.1 per cent).
Slide 15What are the youth doing?
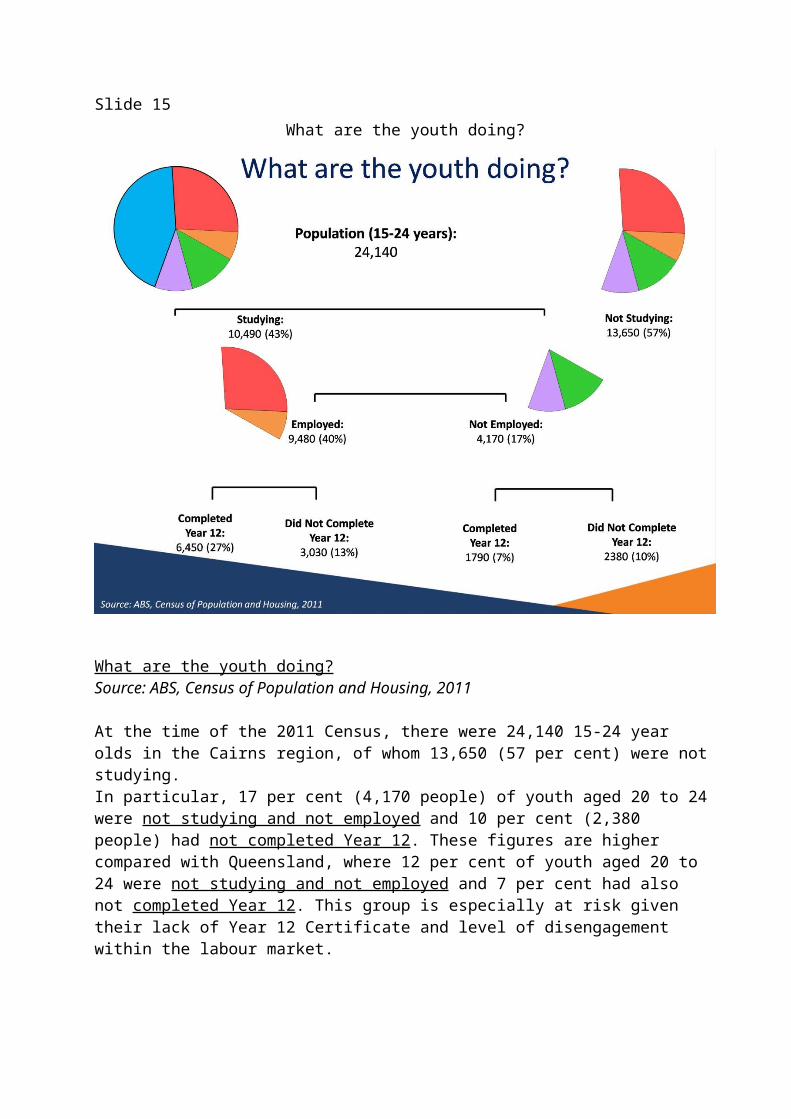
What are the youth doing?Source: ABS, Census of Population and Housing, 2011
At the time of the 2011 Census, there were 24,140 15-24 year olds in the Cairns region, of whom 13,650 (57 per cent) were not studying. In particular, 17 per cent (4,170 people) of youth aged 20 to 24 were not studying and not employed and 10 per cent (2,380 people) had not completed Year 12. These figures are higher compared with Queensland, where 12 per cent of youth aged 20 to 24 were not studying and not employed and 7 per cent had also not completed Year 12. This group is especially at risk given their lack of Year 12 Certificate and level of disengagement within the labour market.
Note: Not stated records for FT/PT Student Status, Labour Force Status and Higher Year of School Completed have not been included.
Slide 16Young people in Yarrabah not in employment, education or training, 20-24 years
Young people in Yarrabah not in employment, education or training, 20-24 yearsSource: ABS, Census of Population and Housing, 2011
For young adult males in the region, 9 per cent were not in the labour force and not studying and 10 per cent were unemployed and not studying. For young adult females in the region, 20 per cent were not in the labour force and not studying and a further 6 per cent were unemployed and not studying.
The proportion of those aged 20-24 years in the Yarrabah LGA who were neither working nor studying was particularly high. Some 54 per cent of males were unemployed and not studying, while 31 per cent were not in the labour force and not studying. While 33 per cent of females aged 20-24 were unemployed and not studying, a very large proportion (54 per cent) were not in the labour force and not studying.
Slide 17Low levels of educational attainment persons aged 25-34 years
RegionCompleted Yr 12
Attained Advanced Diploma, Diploma or
CertificateIII & IV
Attained Bachelor Degree or Higher
2011 2006
Cairns LGA 71% 69% 36% 22%
Cassowary Coast LGA 63% 56% 34% 14%
Tablelands LGA 63% 60% 34% 15%
Yarrabah LGA 37% 31% 14% 2%
Cairns region 69% 66% 35% 20%
Queensland 74% 68% 32% 29%
Low levels of educational attainment persons aged 25-34 yearsSource: ABS, Census of Population and Housing, 2011 Job seekers who have not completed Year 12 and have limited experience in the workforce are likely to lack many basic employability skills that employers value and look for in applicants, particularly for lower skilled vacancies and entry level positions such as apprenticeships and traineeships.
At the time of the 2011 Census, the proportion of 25 to 34 year olds in the Cairns region who had completed Year 12 or equivalent was 69 per cent, smaller than Queensland (74 per cent).
20 per cent of 25-34 year olds in the Cairns region had attained a Bachelor Degree or Higher, lower than Queensland (29 per cent). However, the proportion of people in the region who attained an Advanced Diploma, Diploma, or Certificate III and IV level (35 per cent) was larger than Queensland (32 per cent).
Slide 18Educational attainment and Labour market outcomes
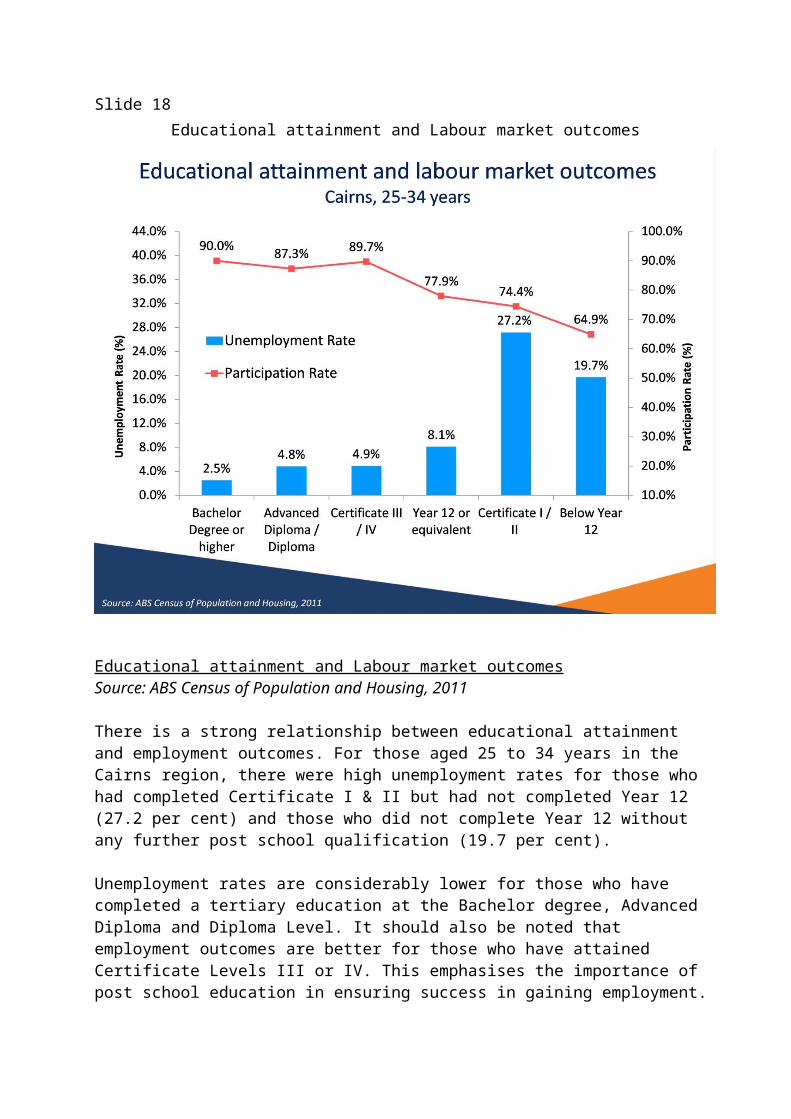
Educational attainment and Labour market outcomesSource: ABS Census of Population and Housing, 2011
There is a strong relationship between educational attainment and employment outcomes. For those aged 25 to 34 years in the Cairns region, there were high unemployment rates for those who had completed Certificate I & II but had not completed Year 12 (27.2 per cent) and those who did not complete Year 12 without any further post school qualification (19.7 per cent).
Unemployment rates are considerably lower for those who have completed a tertiary education at the Bachelor degree, Advanced Diploma and Diploma Level. It should also be noted that employment outcomes are better for those who have attained Certificate Levels III or IV. This emphasises the importance of post school education in ensuring success in gaining employment.
Slide 19Finishing Year 12 dramatically improves your labour market outcomes 25 - 34 year olds
Finishing Year 12 dramatically improves your labour market outcomes 25 - 34 year oldsSource: ABS, Census of Population and Housing, 2011 The unemployment rate for Indigenous persons (25-24 years) who had completed year 12 in Cairns was much lower than that for Indigenous persons who had not completed year 12. The participation rate for this group was also much higher than those who had not completed year 12.
Slide 20Improving employment prospects for Indigenous Australians
Improving employment prospects for Indigenous AustraliansSource: Department of Employment, Survey of Employers’ Recruitment Experiences, Cairns region, July 2013
As part of the Department of Employment’s regional Surveys of Employers’ Recruitment Experiences, more than 1000 employers have been asked what could be done to improve the employment prospects of Indigenous Australians. This question was asked of employers in the Cairns region.
Over half of responding employers in Cairns identified the importance of further developing the skills of Indigenous job seekers to improving employment outcomes. Most commonly mentioned suggestions outlined the need for further education and training. Some employers highlighted the benefits of Indigenous job seekers improving their soft skills or general employability skills, while others emphasised the value of apprenticeships and Work experience.
Slide 21Improving employment prospects for Indigenous Australians
Improving employment prospects for Indigenous AustraliansSource: Department of Employment, Survey of Employers’ Recruitment Experiences, Cairns region, July 2013
As part of the Department of Employment’s regional Surveys of Employers’ Recruitment Experiences, more than 1000 employers have been asked what could be done to improve the employment prospects of Indigenous Australians. This question has been asked of employers in the Cairns region. Almost one in seven responding employers (17 per cent) in Cairns suggested providing employment assistance to improve Indigenous employment outcomes. Suggestions were wide-reaching and targeted at different stages of the recruitment and employment process. Many employers highlighted the need for incentives to encourage people to stay in work. Others suggested mentoring programs or the use of third parties to facilitate the recruitment process. Employers also suggested incentives for business.
Slide 22Largest employing industries
Largest employing industriesSource: ABS Labour Force, August Quarter 2014
The largest employing industries in the Cairns region are the Retail Trade (13 per cent), Health Care and Social Assistance (11 per cent) and Construction (9 per cent) industries.
Slide 23Growth for largest industries - Cairns region, last 5 years
Growth for largest industries - Cairns region, last 5 yearsSource: ABS Labour Force, August Quarter 2014
The Health Care and Social Assistance (1,800) and Education and Training industries (1,300) had the largest growth for the Cairns region over the last five years.
The Accommodation and Food Services (-4,800) industry and Retail Trade (-2,500) industry declined, however in the last year the Accommodation and Food Services industry has increased by 1,600.
Slide 24Projected employment growth for largest employing industries
Projected employment growth for largest employing industriesSource: Department of Employment, Employment Projections (5 years from November 2012 to November 2017)
This graph shows the projected employment growth by industry in the Cairns region. Much of the growth in employment within the region is expected to be in Health Care and Social Assistance, Retail Trade and Education and Training industries.
Slide 25Recruitment activity in Cairns
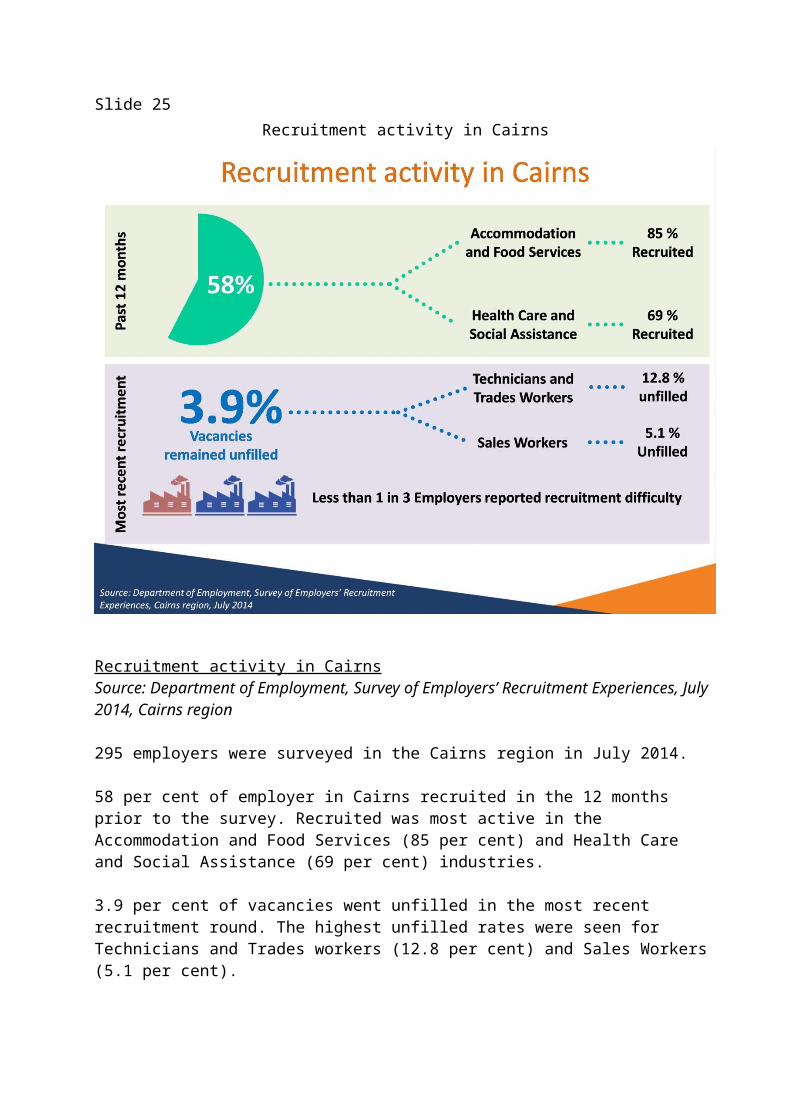
Recruitment activity in CairnsSource: Department of Employment, Survey of Employers’ Recruitment Experiences, July 2014, Cairns region 295 employers were surveyed in the Cairns region in July 2014.
58 per cent of employer in Cairns recruited in the 12 months prior to the survey. Recruited was most active in the Accommodation and Food Services (85 per cent) and Health Care and Social Assistance (69 per cent) industries.
3.9 per cent of vacancies went unfilled in the most recent recruitment round. The highest unfilled rates were seen for Technicians and Trades workers (12.8 per cent) and Sales Workers (5.1 per cent).
Less than 1 in 3 employers reported recruitment difficulty.
Slide 26Strong competition but few suitable applicants
Strong competition but few suitable applicantsSource: Department of Employment, Survey of Employers’ Recruitment Experiences, Cairns region, July 2014
Competition for vacancies was high in the Cairns region, with an average of 13.1 applicants per vacancy.
Clerical and Administration workers had the strongest competition for vacancies (27.3 applicants per vacancy), followed by Machinery operators and drivers (25.5 applicants per vacancy).
Slide 27The recruitment process – in Cairns
The recruitment process – in CairnsSource: Department of Employment, Survey of Employers’ Recruitment Experiences, Cairns region, July 2014
On average employers in Cairns received 13 applicants per vacancy.
Of these applicants on average only 2 were interviewed.
Of these interviewed applicants only 1 was suitable for the vacancy.
The reasons applicants did not get an interview were:- Lack of relevant experience- Poorly written/presented application- Insufficient qualifications or training- Basic employability skills
Slide 28Personality traits and employability skills employers in Cairns viewed as essential
Personality traits and employability skills employers in Cairns viewed as essentialSource: Department of Employment, Survey of Employers’ Recruitment Experiences, Cairns region, July 2014
Employers in Cairns viewed the following employability skills and personality traits as essential:
Employability skills:• Interpersonal/Social Skills• Customer Service Skills• Communication
Personality traits:• Enthusiasm/positive attitude• Reliability, Honesty and Work Ethic• Presentation
Slide 29Any experience is good experience
Any experience is good experience
Slide 30Many jobs are not advertised
Many jobs are not advertisedSource: Department of Employment, Survey of Employers’ Recruitment Experiences, Cairns region, July 2014
Just over half of recruiting employers (52 per cent) used formal methods to advertise for vacancies (i.e. Internet, Newspaper)
The other half (48 per cent) of recruiting employers used Informal methods ONLY to recruit for vacancies (i.e. Word of Mouth, Approached by job seeker)
Slide 31Employers recruiting…
Employers recruiting…Source: Department of Employment, Survey of Employers’ Recruitment Experiences, Cairns region, July 2014
41 per cent of employers expected to recruit in the next 12 months
21 per cent of employers expected to increase staff numbers in the next 12 months
Strong recruitment expected in the Accommodation and Food Services and Health Care and Social Assistance industries in the next 12 months
Slide 32…and likely to be in these jobs
…and likely to be in these jobsSource: Department of Employment, Survey of Employers’ Recruitment Experiences, Cairns region, July 2014
This slide shows the occupations that employers are likely to recruit for in the next 12 months.
WaitersCrop Farm WorkersChefsSales Assistants (General)ReceptionistsBar Attendants and BaristasGeneral ClerksCheckout Operators and Office Cashiers