21
Slide 5-1 Financial Financial Reporting and Reporting and Analysis Analysis Financial Accounting, Tenth Edition
| Date post: | 11-Jan-2016 |
| Category: |
Documents |
| Upload: | simon-lynch |
| View: | 223 times |
| Download: | 0 times |

Slide 5-1
Financial Reporting Financial Reporting and Analysisand Analysis
Financial Accounting, Tenth Edition
Slide 5-2 SO 4 Describe and apply horizontal analysis.
Also called trend analysis, is a technique for evaluating a series of financial statement data over a period of time.
Purpose - to determine increase or decrease that has taken place.
Commonly applied to the balance sheet and income statement.
Comparative AnalysisComparative Analysis
Horizontal Analysis
Slide 5-3
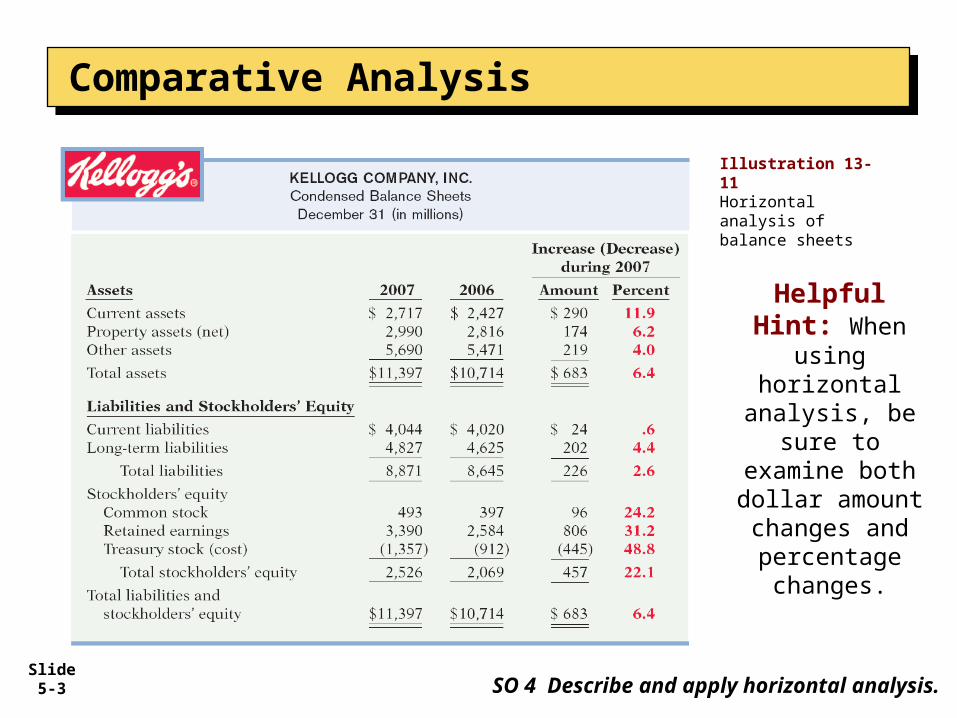
Helpful Hint: When
using horizontal
analysis, be sure to
examine both dollar amountchanges and percentage changes.
Illustration 13-11Horizontal analysis ofbalance sheets
Comparative AnalysisComparative Analysis
SO 4 Describe and apply horizontal analysis.

Slide 5-4
Illustration 13-12Horizontal analysis ofIncome statements
Comparative AnalysisComparative Analysis
Helpful Hint: In horizontal analysis, while the amount column is additive (the total is $99 million), the percentage column is not additive (9.9% is not a total).
SO 4 Describe and apply horizontal analysis.

Slide 5-5 SO 5 Describe and apply vertical analysis.
Also called common-size analysis, is a technique that expresses each financial statement item as a percent of a base amount.
Vertical analysis is commonly applied to the balance sheet and the income statement.
Comparative AnalysisComparative Analysis
Vertical Analysis
Slide 5-6 SO 5 Describe and apply vertical analysis.
Comparative AnalysisComparative Analysis
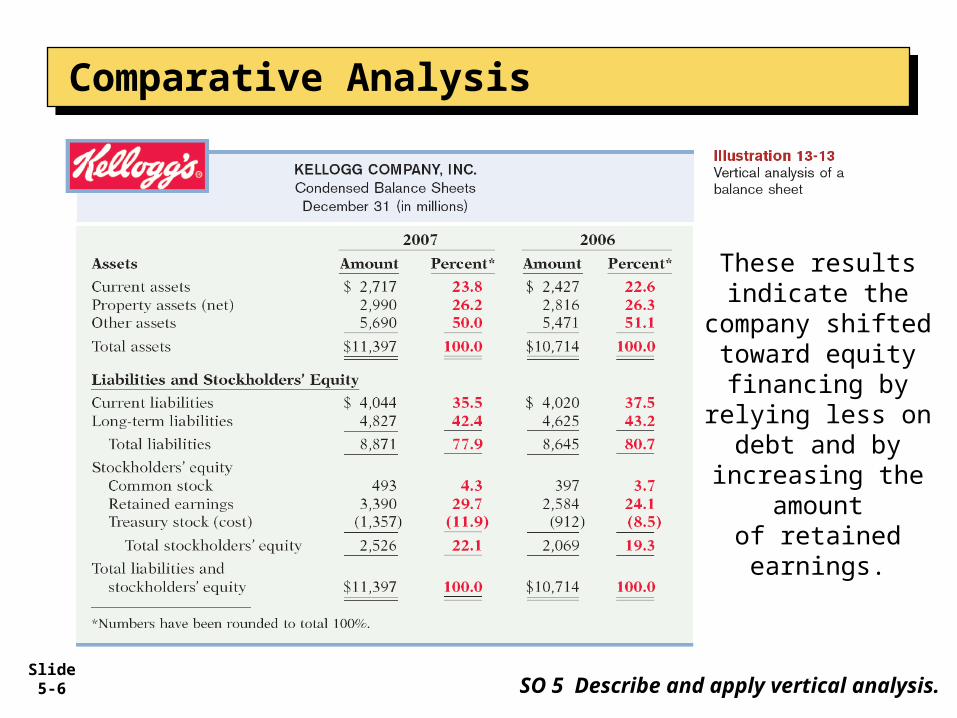
These results indicate the
company shiftedtoward equity financing by
relying less on debt and by
increasing the amount
of retained earnings.

Slide 5-7
Kellogg’s increase in net income as a percentage of sales is due primarily to the decrease in interest expense and income tax expenseas a percent of sales.
SO 5 Describe and apply vertical analysis.
Comparative AnalysisComparative Analysis
Illustration 13-14Vertical analysis of an income statements
Slide 5-8
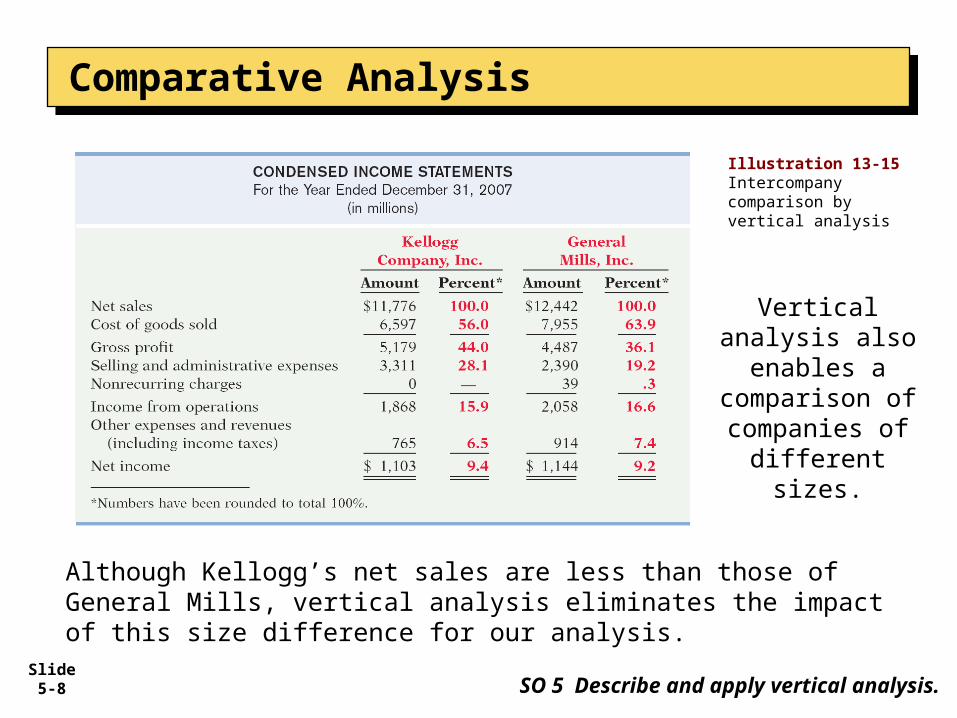
Illustration 13-15Intercompany comparison by vertical analysis
SO 5 Describe and apply vertical analysis.
Although Kellogg’s net sales are less than those of General Mills, vertical analysis eliminates the impact of this size difference for our analysis.
Comparative AnalysisComparative Analysis
Vertical analysis also enables a comparison of companies of
different sizes.

Slide 5-9
Comprehensive Illustration of Ratio AnalysisComprehensive Illustration of Ratio Analysis
Illustration 13A-1

Slide 5-10
Comprehensive Illustration of Ratio AnalysisComprehensive Illustration of Ratio Analysis
Illustration 13A-2
Illustration 13A-4
Slide 5-11
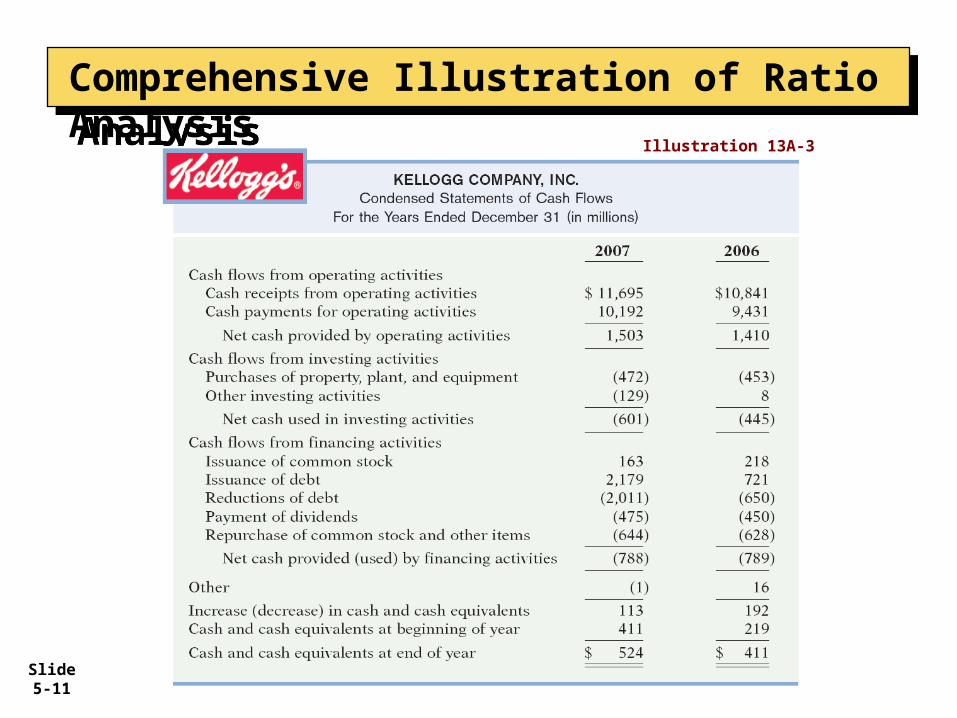
Comprehensive Illustration of Ratio AnalysisComprehensive Illustration of Ratio Analysis
Illustration 13A-3

Slide 5-12
Liquidity RatiosLiquidity Ratios
Measure the short-term ability of the company to pay its maturing obligations and to meet unexpected needs for cash.
Short-term creditors such as bankers and suppliers are particularly interested in assessing liquidity.
Comprehensive Illustration of Ratio AnalysisComprehensive Illustration of Ratio Analysis

Slide 5-13
Comprehensive Illustration of Ratio AnalysisComprehensive Illustration of Ratio Analysis
Current Ratio - Expresses the relationship of current assets to current liabilities. Calculate the current ratio for Kellogg for 2007 and 2006.
What do the measures tell us?
A current ratio of .67 means that for every dollar of current liabilities, Kellogg has $0.67 of current assets.
.67 .60
Illustration 13A-5

Slide 5-14
Profitability RatiosProfitability Ratios
Measure the income or operating success of a company for a given period of time.
Illustration 13A-15Relationships amongprofitability measures
Comprehensive Illustration of Ratio AnalysisComprehensive Illustration of Ratio Analysis

Slide 5-15
Comprehensive Illustration of Ratio AnalysisComprehensive Illustration of Ratio Analysis
Return on Common Stockholders’ Equity Ratio - Shows how many dollars of net income the company earned for each dollar invested by the owners. Calculate the ratio for Kellogg.
Kellogg’s 2007 rate of return on common stockholders’ equity is unusually high at 48%, considering an industry average of 23% and General Mills’s return of 21%.
48% 46%
Illustration 13A-16
Slide 5-16
Comprehensive Illustration of Ratio AnalysisComprehensive Illustration of Ratio Analysis
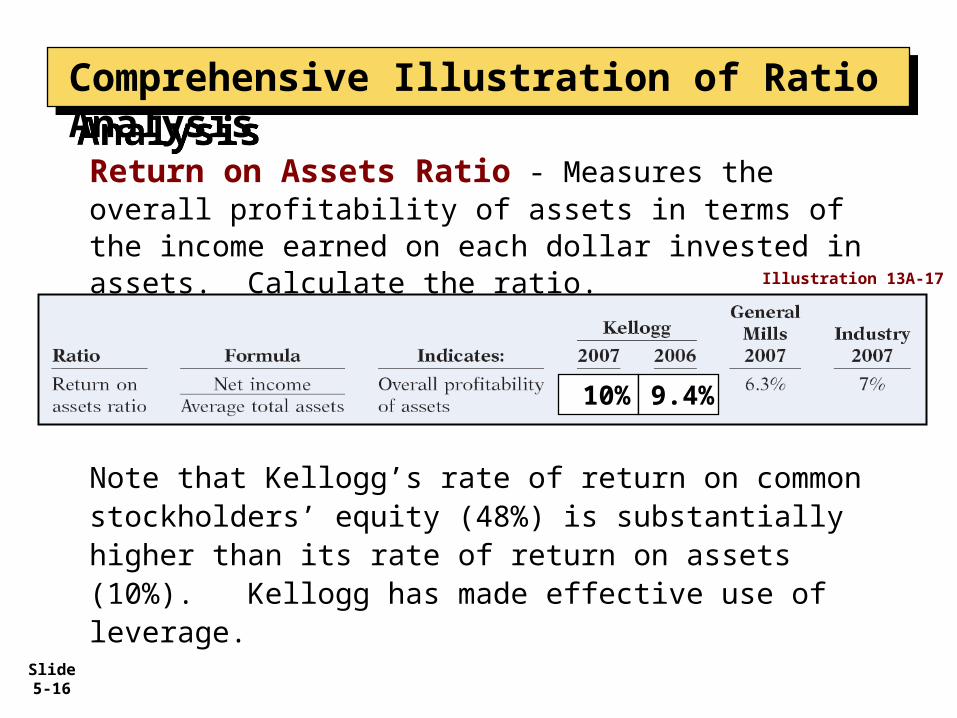
Return on Assets Ratio - Measures the overall profitability of assets in terms of the income earned on each dollar invested in assets. Calculate the ratio.
Note that Kellogg’s rate of return on common stockholders’ equity (48%) is substantially higher than its rate of return on assets (10%). Kellogg has made effective use of leverage.
10% 9.4%
Illustration 13A-17

Slide 5-17
Comprehensive Illustration of Ratio AnalysisComprehensive Illustration of Ratio Analysis
Profit Margin Ratio - Or rate of return on sales, is a measure of the percentage of each dollar of sales thatresults in net income. Calculate the ratio for Kellogg.
High-volume (high inventory turnover) businesses such as grocery stores and pharmacy chains generally have low profit margins.
9.4% 9.2%
Illustration 13A-18

Slide 5-18
Comprehensive Illustration of Ratio AnalysisComprehensive Illustration of Ratio Analysis
Asset Turnover Ratio - Measures how efficiently a company uses its assets to generate sales. Calculate the ratio for Kellogg.
The average asset turnover for utility companies is .45, for example, while the grocery store industry has an average asset turnover of 3.49.
1.07 1.02
Illustration 13A-19

Slide 5-19
Comprehensive Illustration of Ratio AnalysisComprehensive Illustration of Ratio Analysis
You can analyze the combined effects of profit margin and asset turnover on return on assets for Kellogg as shown Illustration 13A-20
Slide 5-20
Comprehensive Illustration of Ratio AnalysisComprehensive Illustration of Ratio Analysis
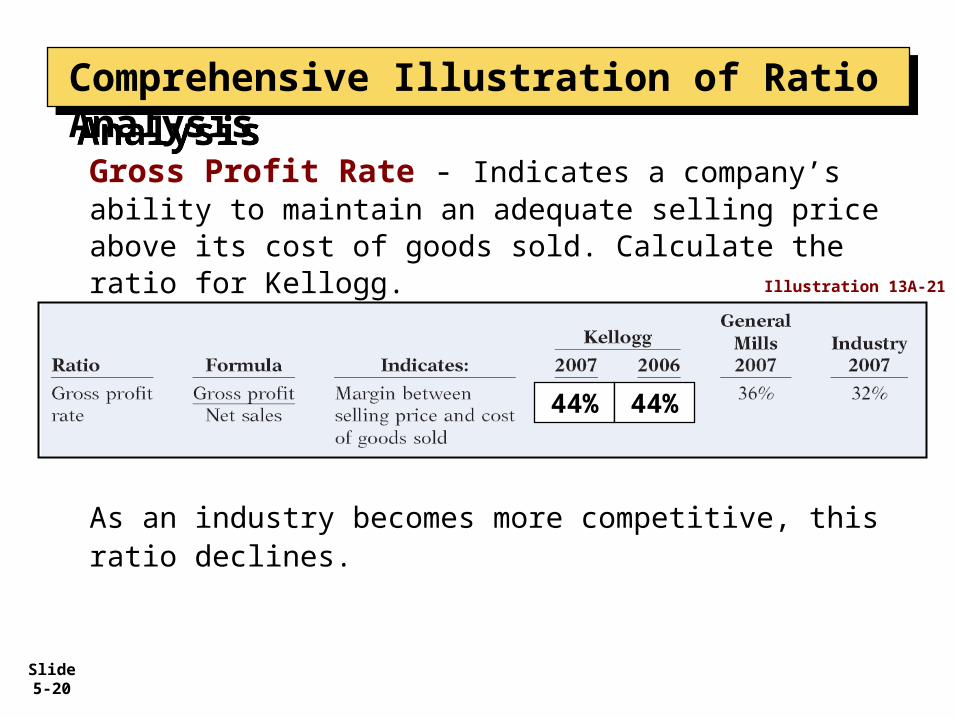
Gross Profit Rate - Indicates a company’s ability to maintain an adequate selling price above its cost of goods sold. Calculate the ratio for Kellogg.
44% 44%
Illustration 13A-21
As an industry becomes more competitive, this ratio declines.
Slide 5-21
“Copyright © 2009 John Wiley & Sons, Inc. All rights reserved. Reproduction or translation of this work beyond that permitted in Section 117 of the 1976 United States Copyright Act without the express written permission of the copyright owner is unlawful. Request for further information should be addressed to the Permissions Department, John Wiley & Sons, Inc. The purchaser may make back-up copies for his/her own use only and not for distribution or resale. The Publisher assumes no responsibility for errors, omissions, or damages, caused by the use of these programs or from the use of the information contained herein.”
CopyrightCopyright


