Arthur CHARPENTIER - Welfare, Inequality and Poverty Arthur Charpentier [email protected]http ://freakonometrics.hypotheses.org/ Université de Rennes 1, January 2015 Welfare, Inequality & Poverty # 1 1
Transcript
Arthur CHARPENTIER - Welfare, Inequality and Poverty
Arthur CHARPENTIER - Welfare, Inequality and Poverty
ReferencesThis course will be on income distributions, and the econometrics of inequalityand poverty indices. For more general thoughts on inequality, equality, fairness,etc., see– Atkinson & Stiglitz Lectures in Public Economics, 1980– Fleurbaey & Maniquet A Theory of Fairness and Social Welfare, 2011– Kolm Justice and Equity, 1997– Sen Idea of Justice, 2009(among others...)
Arthur CHARPENTIER - Welfare, Inequality and Poverty
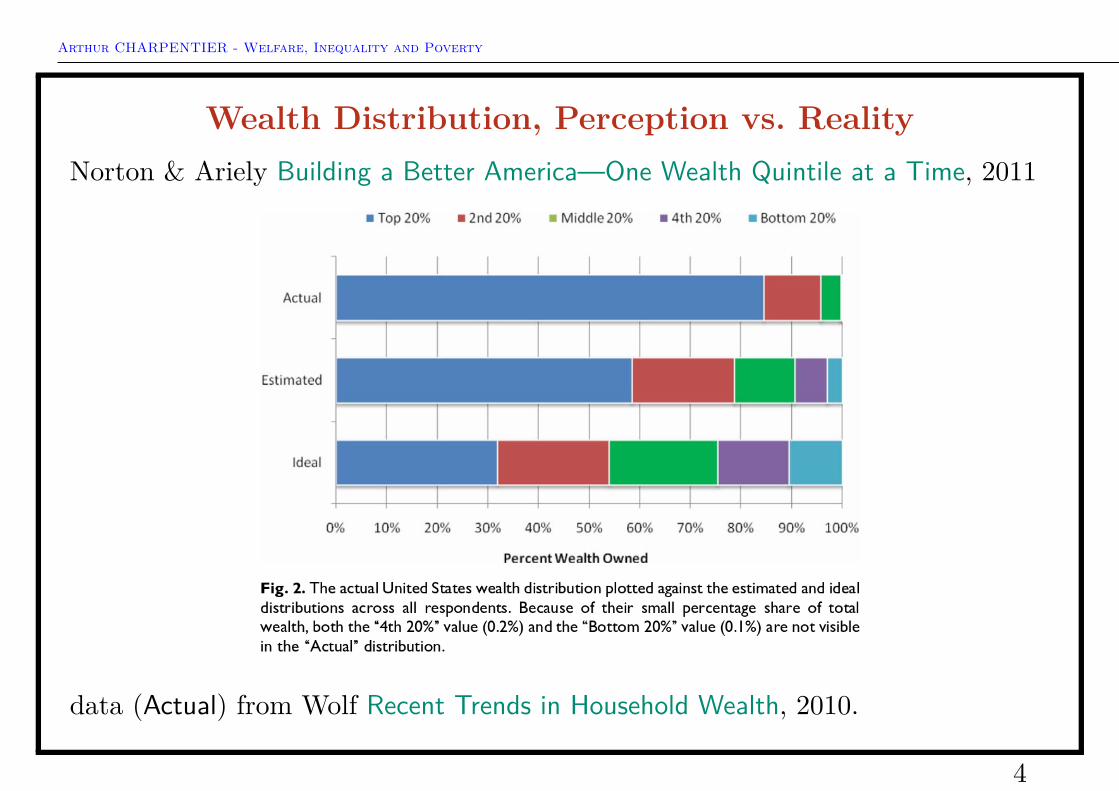
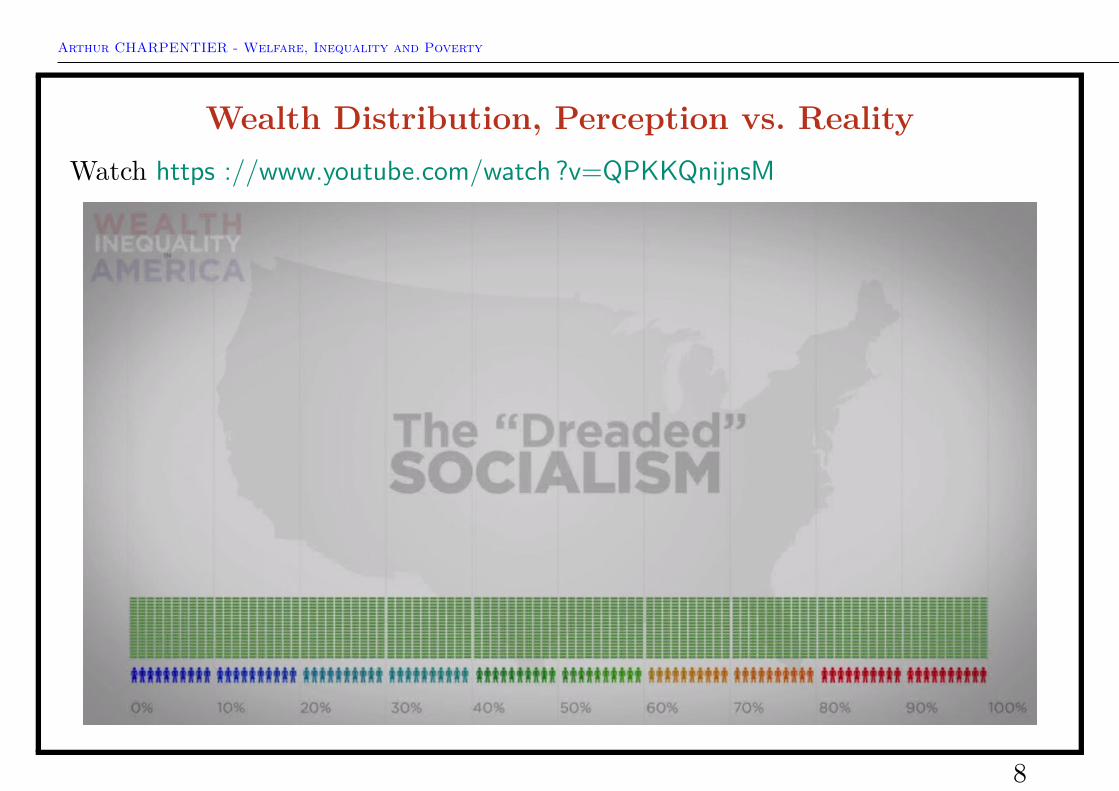
ReferencesFor this very first part, references are– Norton & Ariely Building a Better America—One Wealth Quintile at a Time,
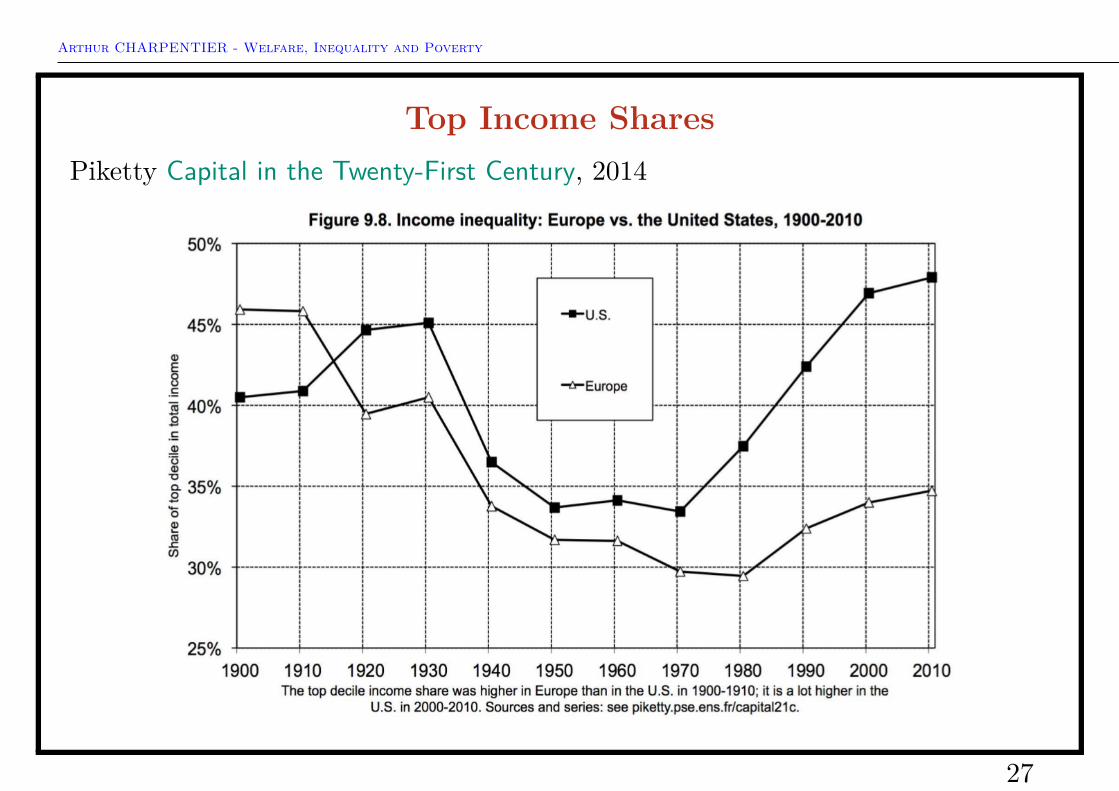
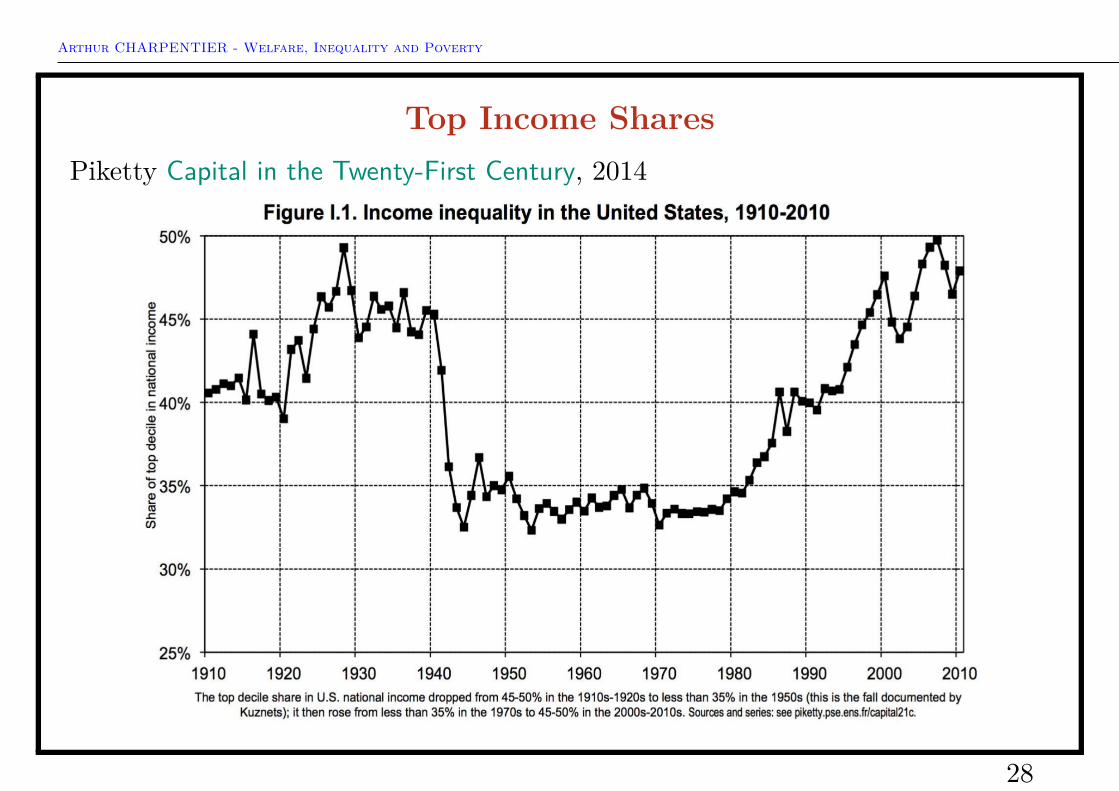
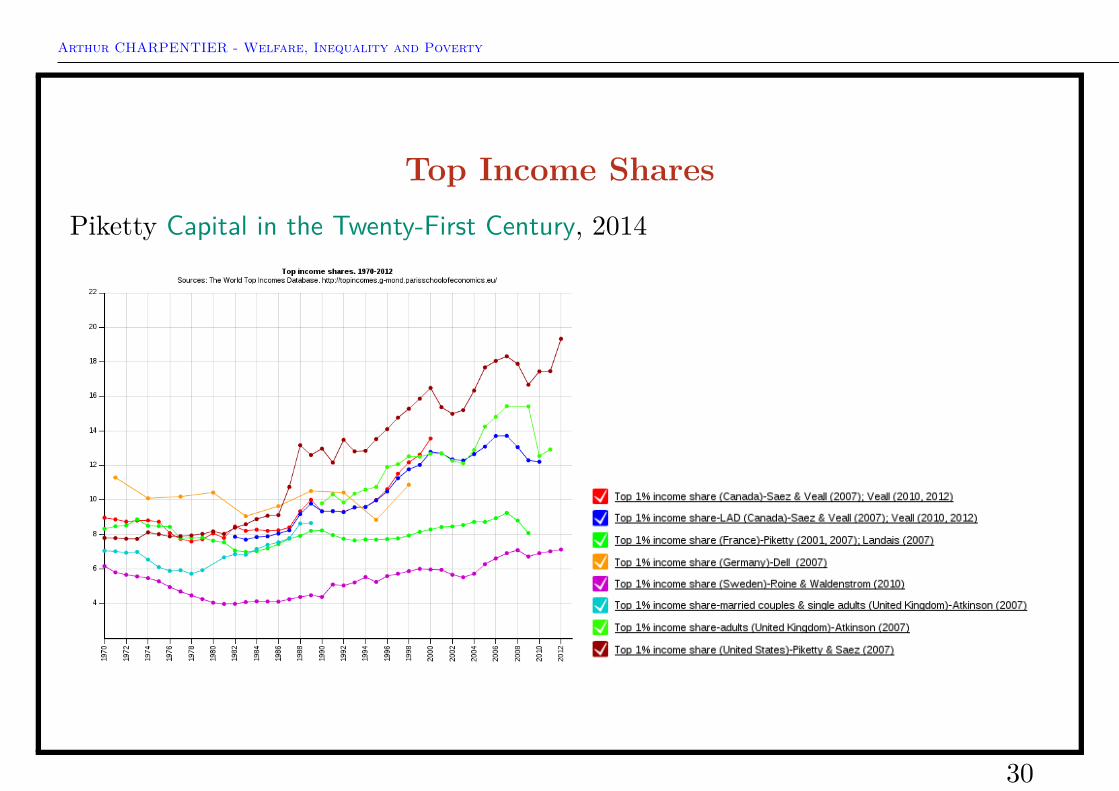
2011 [Income]– Atkinson & Morelli Chartbook of Econonic Inequality, 2014 [Comparisons]– Piketty Capital in the Twenty-First Century, 2014 [Wealth]– Guélaud, Le nombre de pauvres a augmenté de 440.000 en France en 2010, 2012
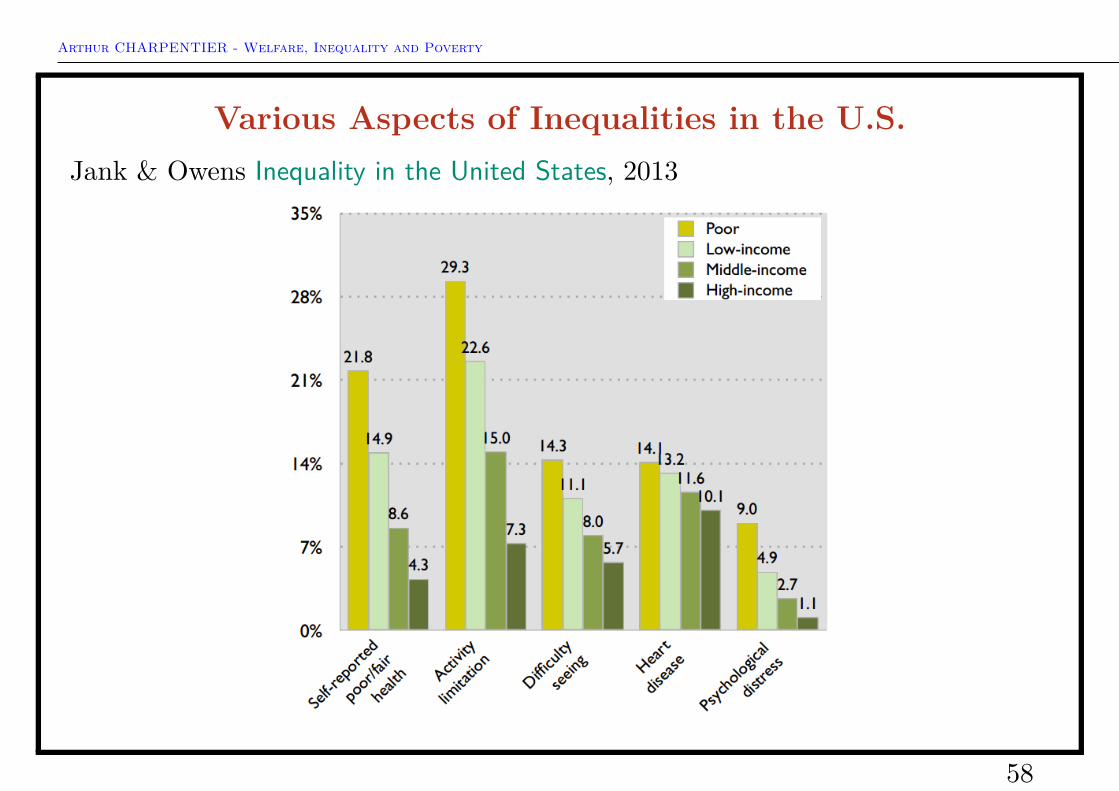
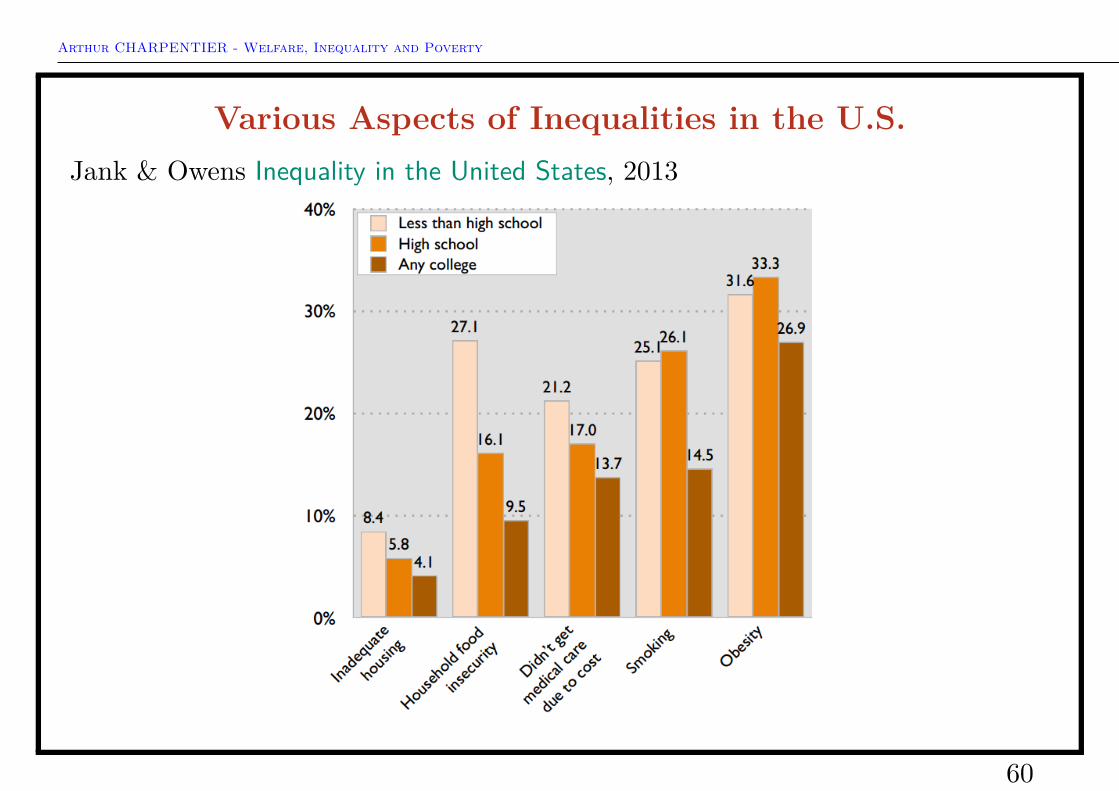
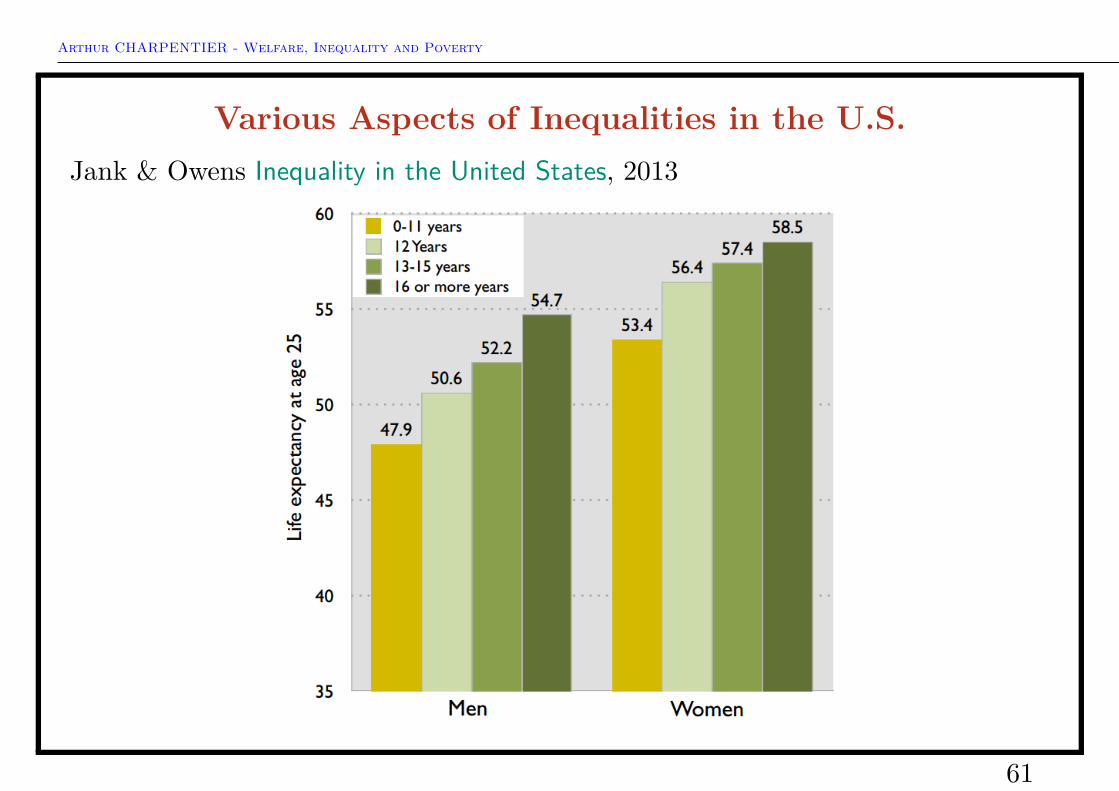
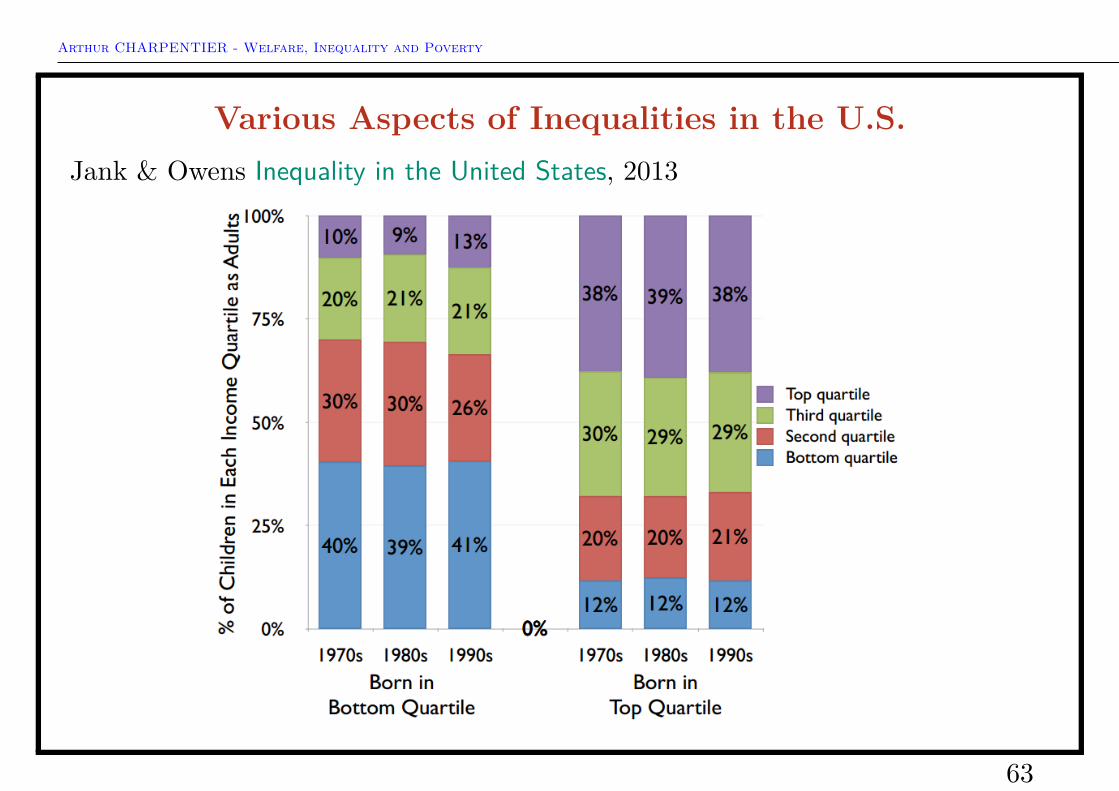
[Poverty]– Burricand, Houdré & Seguin Les niveaux de vie en 2010– Houdré, Missègue & Seguin Inégalités de niveau de vie et pauvreté, 2012– Jank & Owens Inequality in the United States, 2013 [Welfare]
Those slides are inspired by Emmanuel Flachaire’s Econ-473 slides, as well asMichel Lubrano’s M2 notes.
Arthur CHARPENTIER - Welfare, Inequality and Poverty
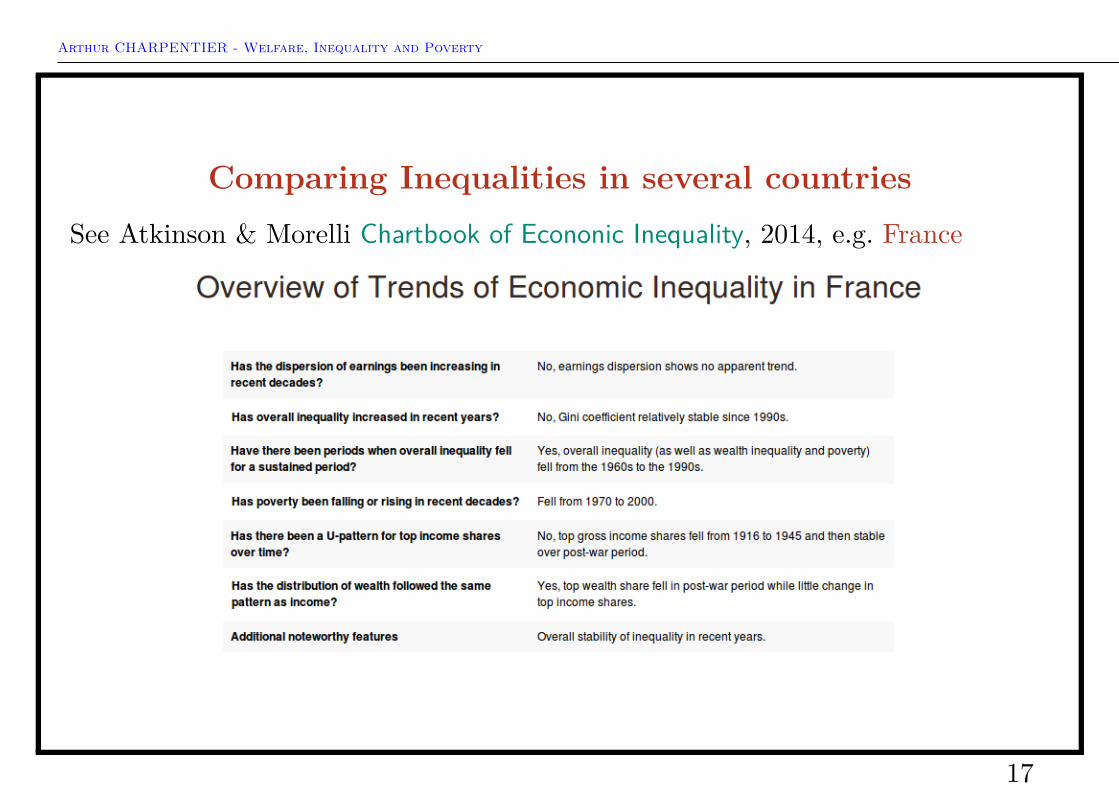
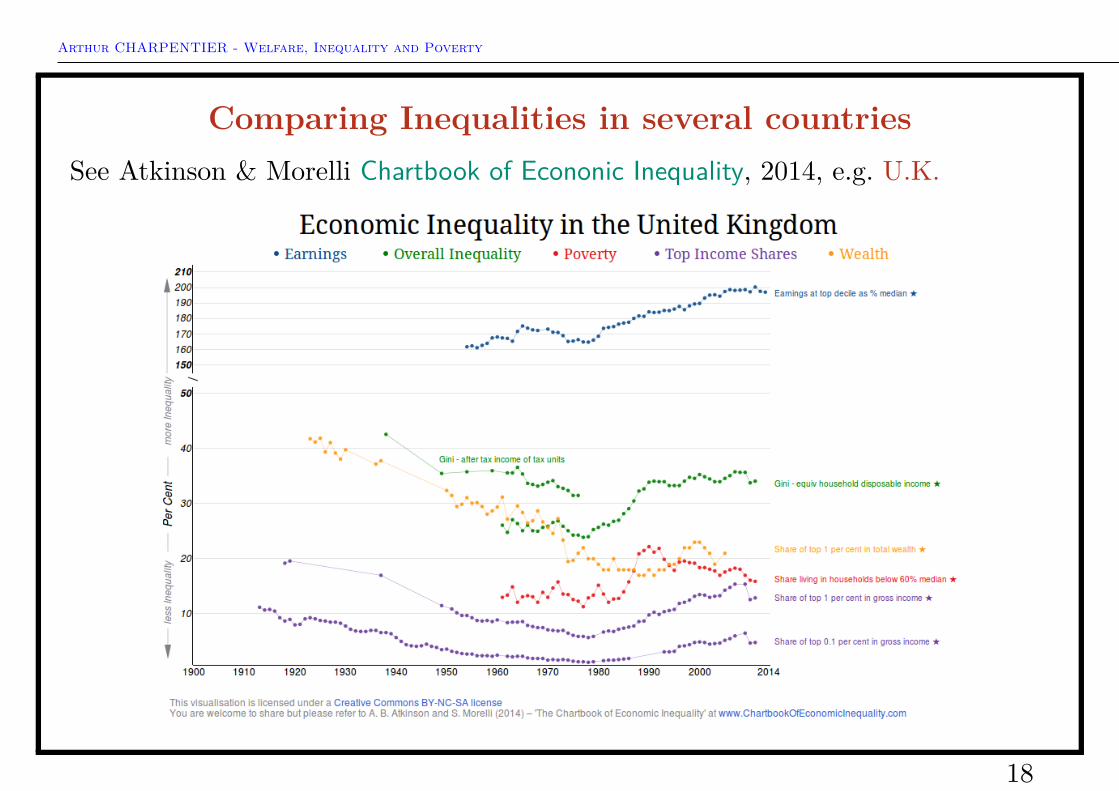
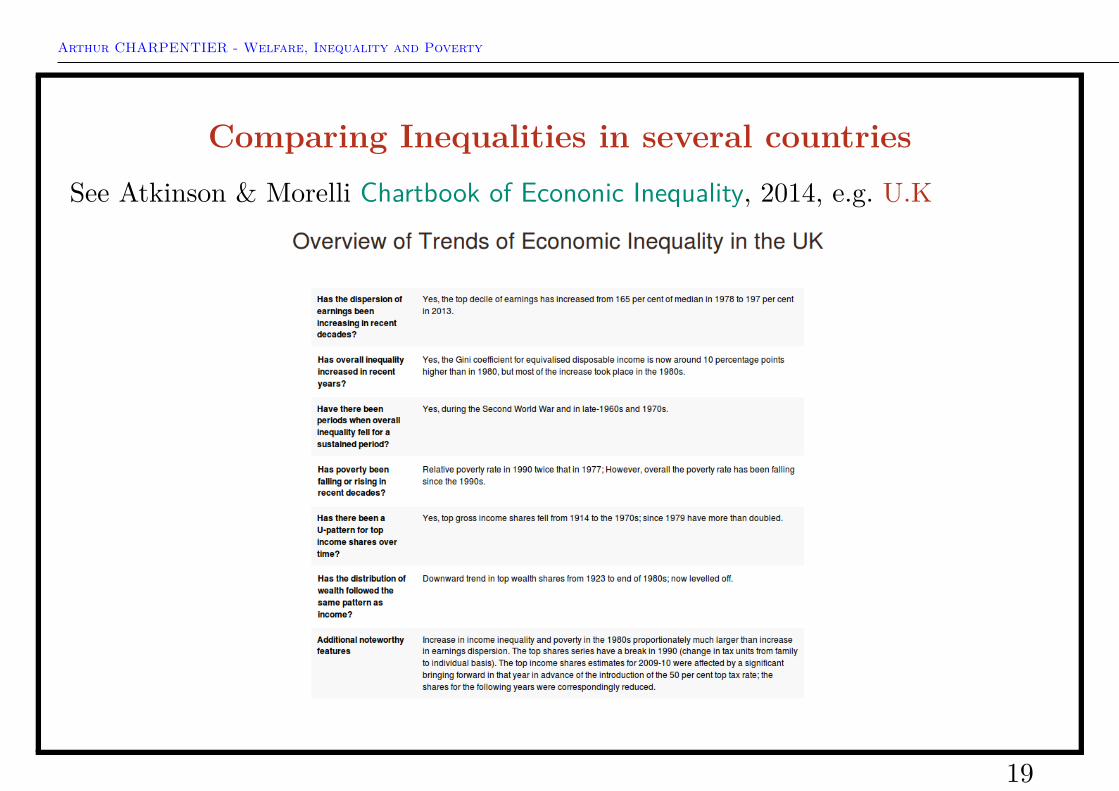
Comparing Inequalities in several countriesAtkinson & Morelli Chartbook of Econonic Inequality, 2014
in Argentina, Brazil, Australia, Canada, Finland, France, Germany, Ice- land,India, Indonesia, Italy, Japan, Malaysia, Mauritius, Netherlands, New Zealand,Norway, Portugal, Singapore, South Africa, Spain, Sweden, Switzerland, the UKand the US, five indicators covering on an annual basis :– Overall income inequality ;– Top income shares– Income (or consumption) based poverty measures ;– Dispersion of individual earnings ;– Top wealth shares.
Arthur CHARPENTIER - Welfare, Inequality and Poverty
Comparing Inequalities in several countriesBut one should be cautious about international comparisons,
– Inequality : Gini index based on gross income for U.S.A. and based ondisposable income for Canada, France and U.K.
– Top income shares : Share of top 1 percent in gross income, for all countries– Poverty : Share in households below 50% of median income for U.S.A. and
Canada and below 60% of median income for France and U.K.
Arthur CHARPENTIER - Welfare, Inequality and Poverty
Poverty, in FranceSee Guélaud, Le nombre de pauvres a augmenté de 440.000 en France en 2010, 2012
La dernière enquête de l’Insee sur les niveaux de vie, rendue publique vendredi 7septembre, est explosive. Que constate-t-elle en effet ? Qu’en 2010, le niveau devie médian (19 270 euros annuels) a diminué de 0,5% par rapport à 2009, queseuls les plus riches s’en sont sortis et que la pauvreté, en hausse, frappedésormais 8,6 millions de personnes, soit 440 000 de plus qu’un an plus tôt.
Avec la fin du plan de relance, les effets de la crise se sont fait sentirmassivement. En 2009, la récession n’avait que ralenti la progression en eurosconstants du niveau de vie médian (+ 0,4%, contre + 1,7% par an en moyennede 2004 à 2008). Il faut remonter à 2004, précise l’Insee, pour trouver un reculsemblable à celui de 2010 (0,5%).
Arthur CHARPENTIER - Welfare, Inequality and Poverty
Poverty, in FranceLa timide reprise économique de 2010 n’a pas eu d’effets miracle, puisquepratiquement toutes les catégories de la population, y compris les classesmoyennes ou moyennes supérieures, ont vu leur niveau de vie baisser. N’aaugmenté que celui des 5% des Français les plus aisés.
Dans un pays qui a la passion de l’égalité, la plupart des indicateurs d’inégalitéssont à la hausse. L’indice de Gini, qui mesure le degré d’inégalité d’unedistribution (en l’espèce, celle des niveaux de vie), a augmenté de 0,290 à 0,299(0 correspondant à l’égalité parfaite et 1 à l’inégalité la plus forte). Le rapportentre la masse des niveaux de vie détenue par les 20 % les plus riches et celledétenue par les 20 % les plus modestes est passé de 4,3 à 4,5.
33
Arthur CHARPENTIER - Welfare, Inequality and Poverty
Poverty, in FranceDéjà en hausse de 0,5 point en 2009, le taux de pauvreté monétaire a augmentéen 2010 de 0,6 point pour atteindre 14,1%, soit son plus haut niveau depuis 1997.8,6 millions de personnes vivaient en 2010 en-dessous du seuil de pauvretémonétaire (964 euros par mois). Elles n’étaient que 8,1 millions en 2009. Mais ily a pire : une personne pauvre sur deux vit avec moins de 781 euros par mois
En 2010, le chômage a peu contribuéà l’augmentation de la pauvreté (leschômeurs représentent à peine 4% de l’accroissement du nombre des personnespauvres). C’est du coté des inactifs qu’il faut plutôt se tourner : les retraités(11%), les adultes inactifs autres que les étudiants et les retraites (16%) - souventles titulaires de minima sociaux - et les enfants. Les moins de 18 ans contribuentpour près des deux tiers (63%) à l’augmentation du nombre de personnes pauvres[...]
34
Arthur CHARPENTIER - Welfare, Inequality and Poverty
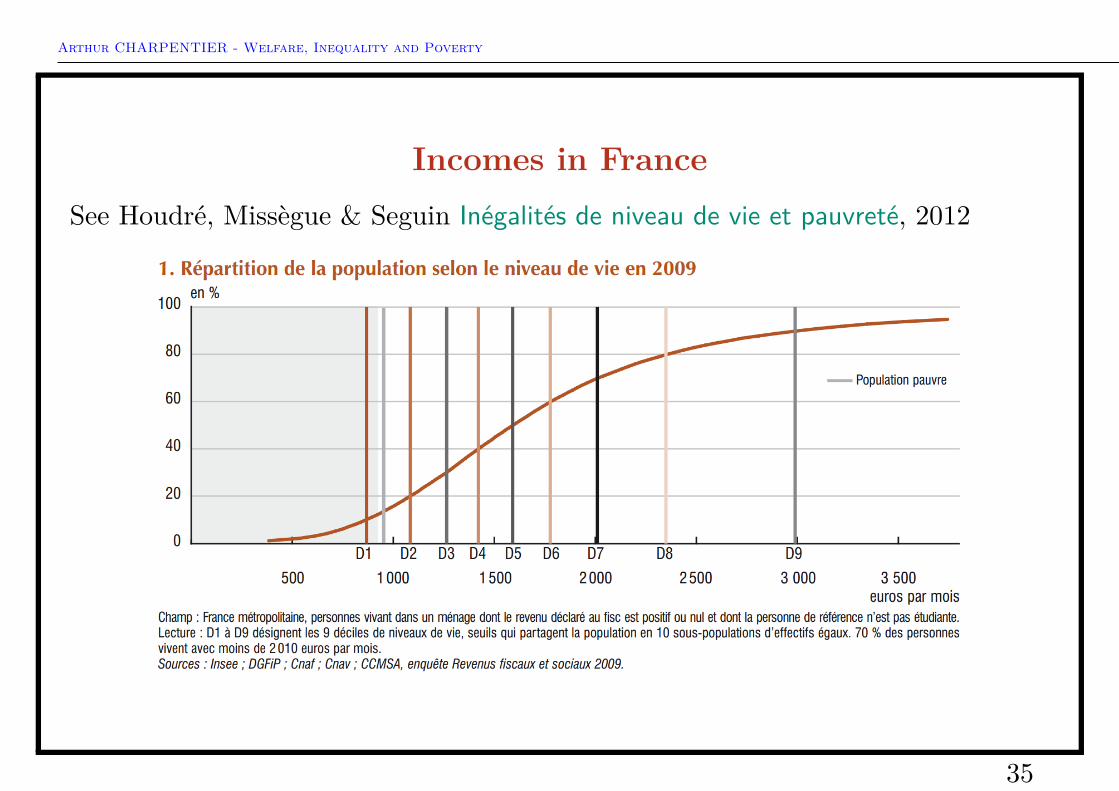
Incomes in FranceSee Houdré, Missègue & Seguin Inégalités de niveau de vie et pauvreté, 2012
Arthur CHARPENTIER - Welfare, Inequality and Poverty
Income ? Micro vs macroTo compare various household incomes• Oxford scale (OECD equivalent scale)◦ 1.0 to the first adult◦ 0.7 to each additional adult (aged 14, and more)◦ 0.5 to each child• OECD-modified equivalent scale (late 90s by eurostat)◦ 1.0 to the first adult◦ 0.5 to each additional adult (aged 14, and more)◦ 0.3 to each child• More recent OECD scale◦ square root of household size
42
Arthur CHARPENTIER - Welfare, Inequality and Poverty
Income ? Micro vs macro
43
Arthur CHARPENTIER - Welfare, Inequality and Poverty
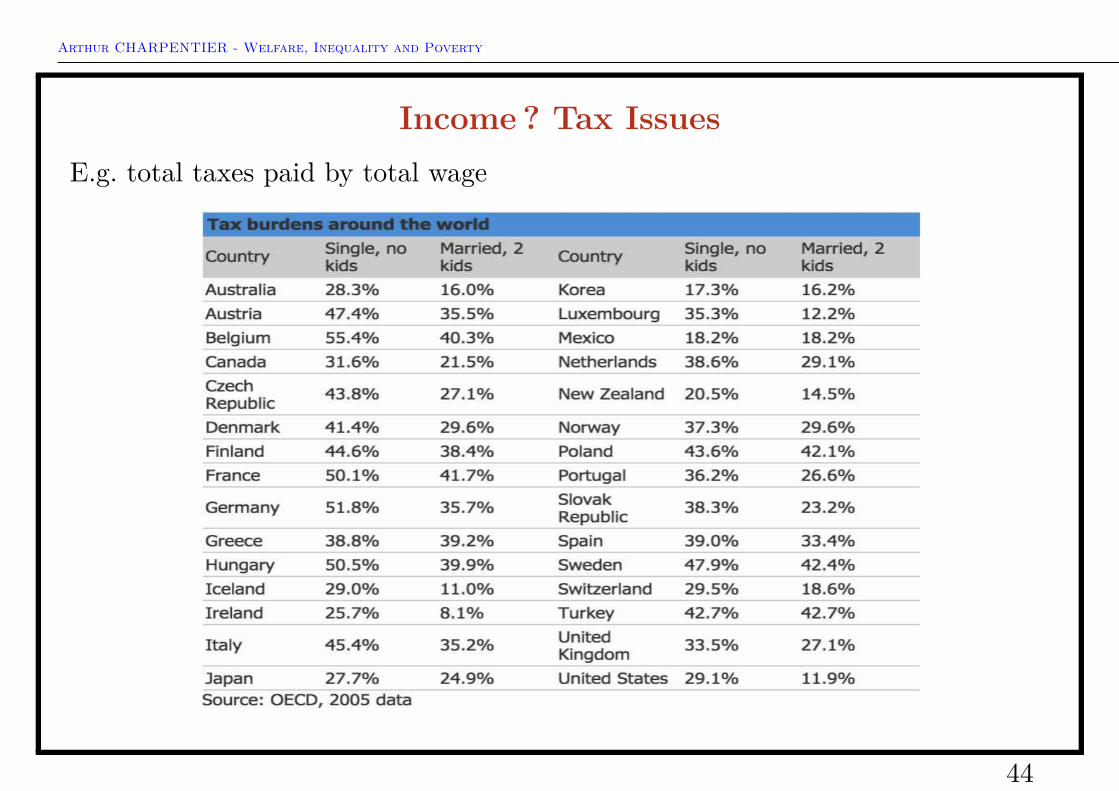
Income ? Tax IssuesE.g. total taxes paid by total wage
44
Arthur CHARPENTIER - Welfare, Inequality and Poverty
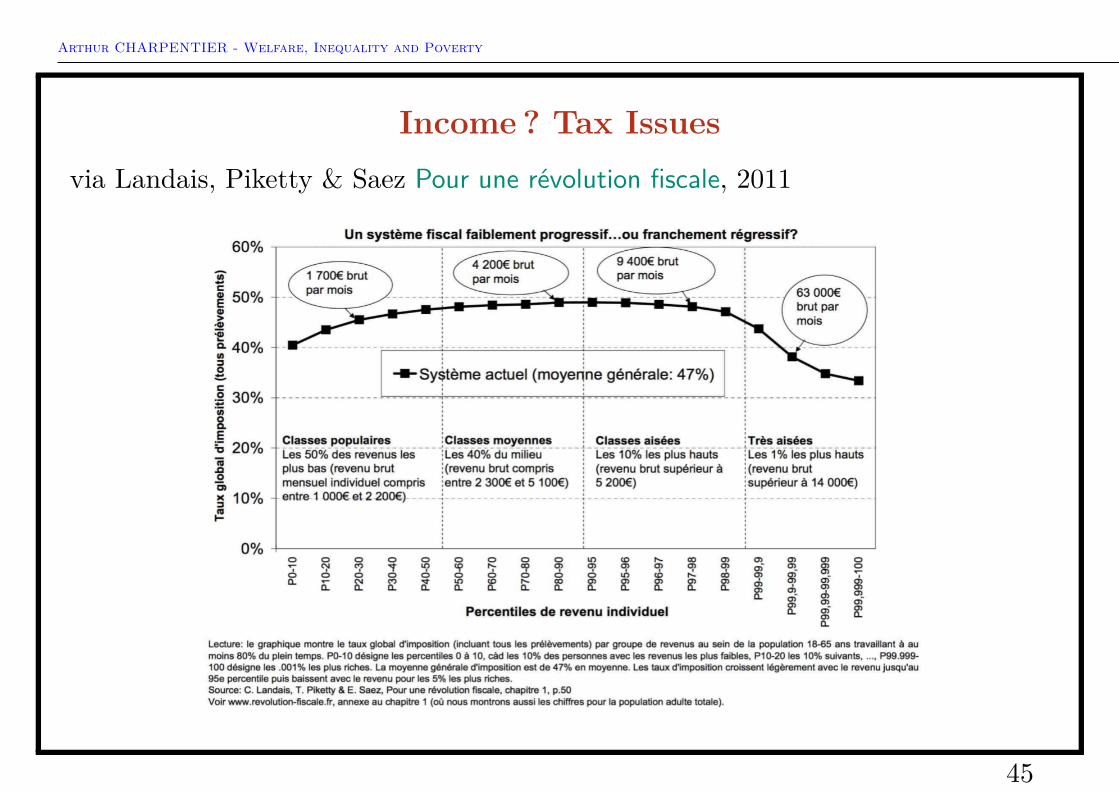
Income ? Tax Issuesvia Landais, Piketty & Saez Pour une révolution fiscale, 2011
Arthur CHARPENTIER - Welfare, Inequality and Poverty
From Income and Wealth to Human DevelopmentThe Human Development Index (HDI, see wikipedia) is a composite statistic oflife expectancy, education, and income indices used to rank countries into fourtiers of human development. It was created by Indian economist Amartya Senand Pakistani economist Mahbub ul Haq in 1990, and was published by theUnited Nations Development Programme.
The HDI is a composite index at value between 0 (awful) and 1 (perfect) basedon the mixing of three basic indices aiming at representing on an equal footingmeasures of helth, education and standard of living.
Arthur CHARPENTIER - Welfare, Inequality and Poverty
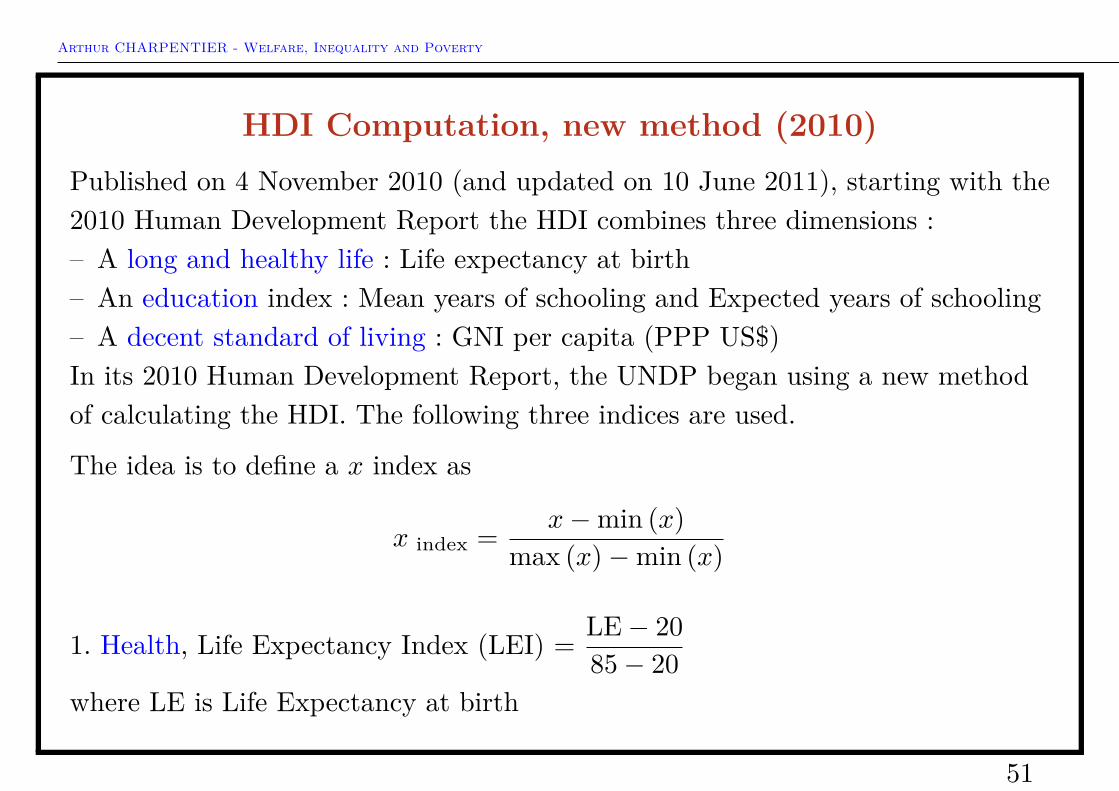
HDI Computation, new method (2010)Published on 4 November 2010 (and updated on 10 June 2011), starting with the2010 Human Development Report the HDI combines three dimensions :– A long and healthy life : Life expectancy at birth– An education index : Mean years of schooling and Expected years of schooling– A decent standard of living : GNI per capita (PPP US$)In its 2010 Human Development Report, the UNDP began using a new methodof calculating the HDI. The following three indices are used.
The idea is to define a x index as
x index = x−min (x)max (x)−min (x)
1. Health, Life Expectancy Index (LEI) = LE− 2085− 20
where LE is Life Expectancy at birth
51
Arthur CHARPENTIER - Welfare, Inequality and Poverty
HDI Computation, new method (2010)
2. Education, Education Index (EI) = MYSI + EYSI2
2.1 Mean Years of Schooling Index (MYSI) = MYS15
where MYS is the Mean years of schooling (Years that a 25-year-old person orolder has spent in schools)
2.2 Expected Years of Schooling Index (EYSI) = EYS18
EYS : Expected years of schooling (Years that a 5-year-old child will spend withhis education in his whole life)
3. Standard of Living Income Index (II) = log(GNIpc)− log(100)log(75, 000)− log(100)
where GNIpc : Gross national income at purchasing power parity per capita
Finally, the HDI is the geometric mean of the previous three normalized indices :HDI = 3
√LEI · EI · II.
52
Arthur CHARPENTIER - Welfare, Inequality and Poverty
Economic Well-BeingSee Osberg The Measurement of Economic Well-Being, 1985 and
Osberg & Sharpe New Estimates of the Index of Economic Well-being, 2002
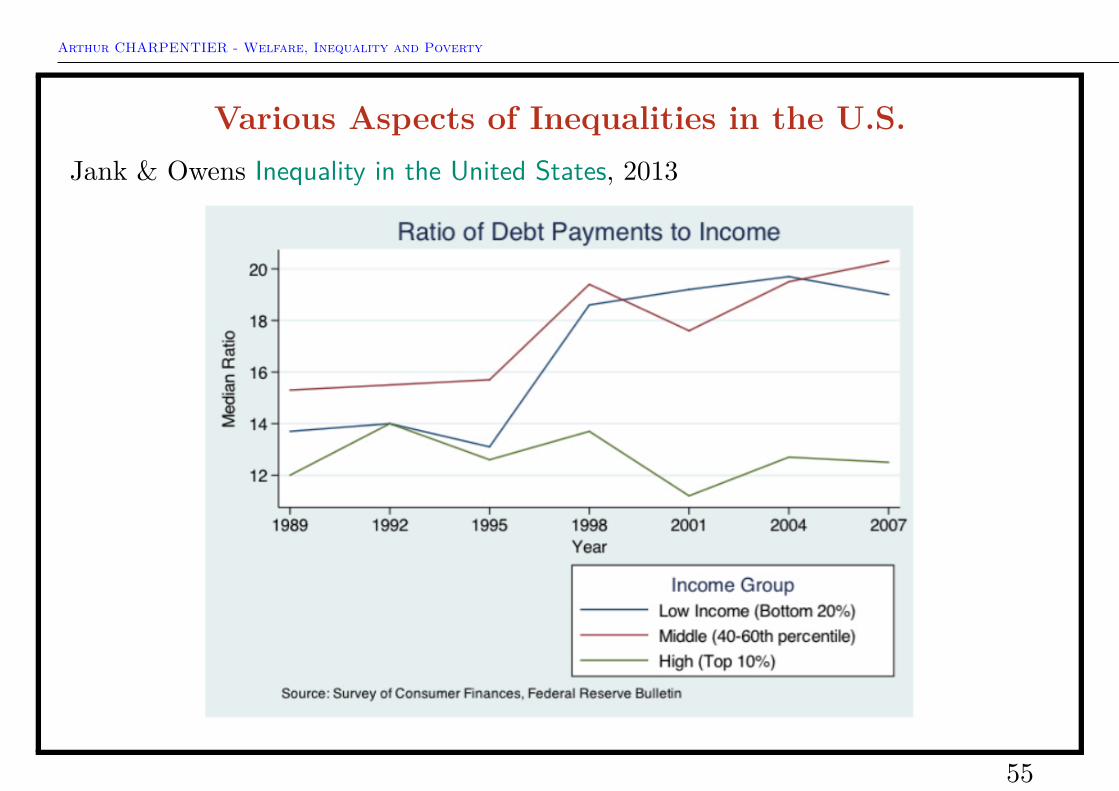
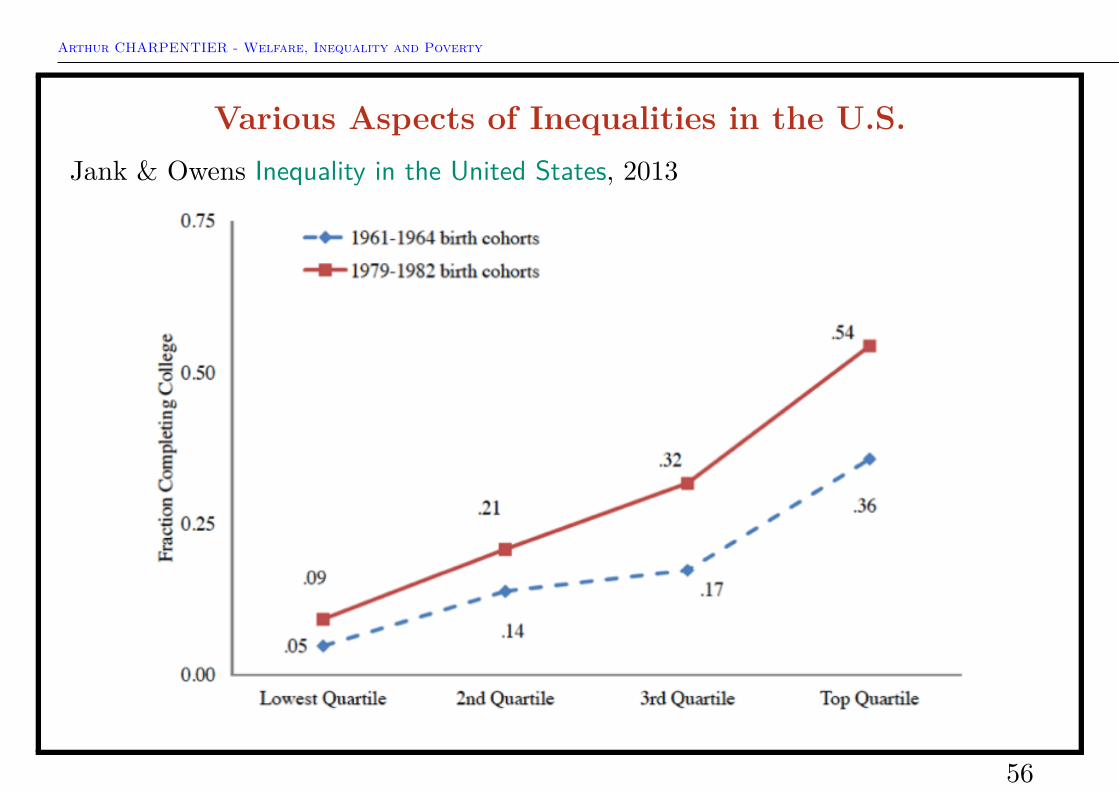
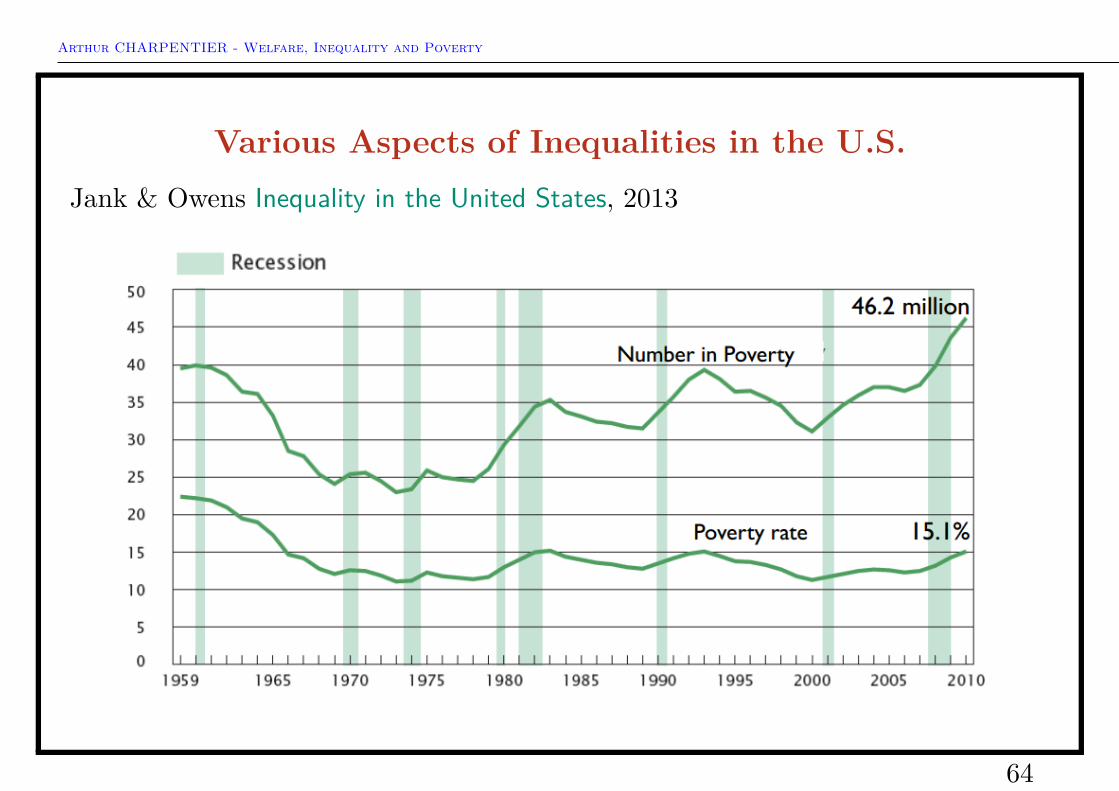
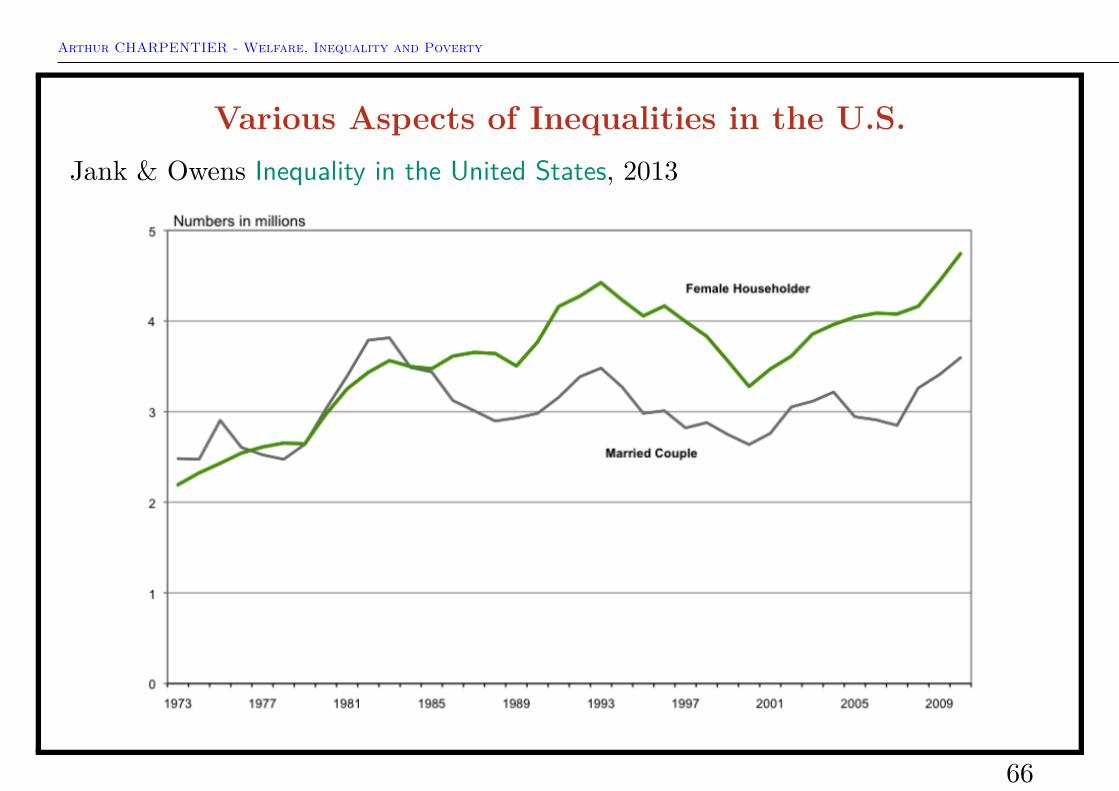
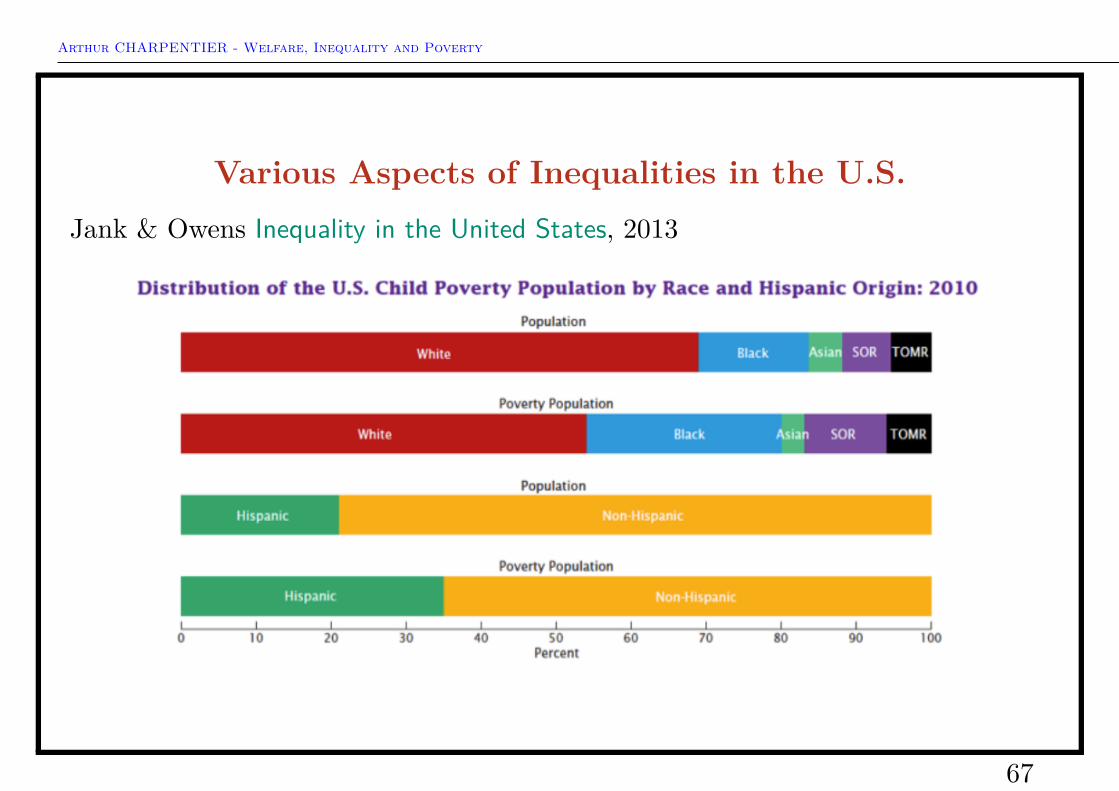
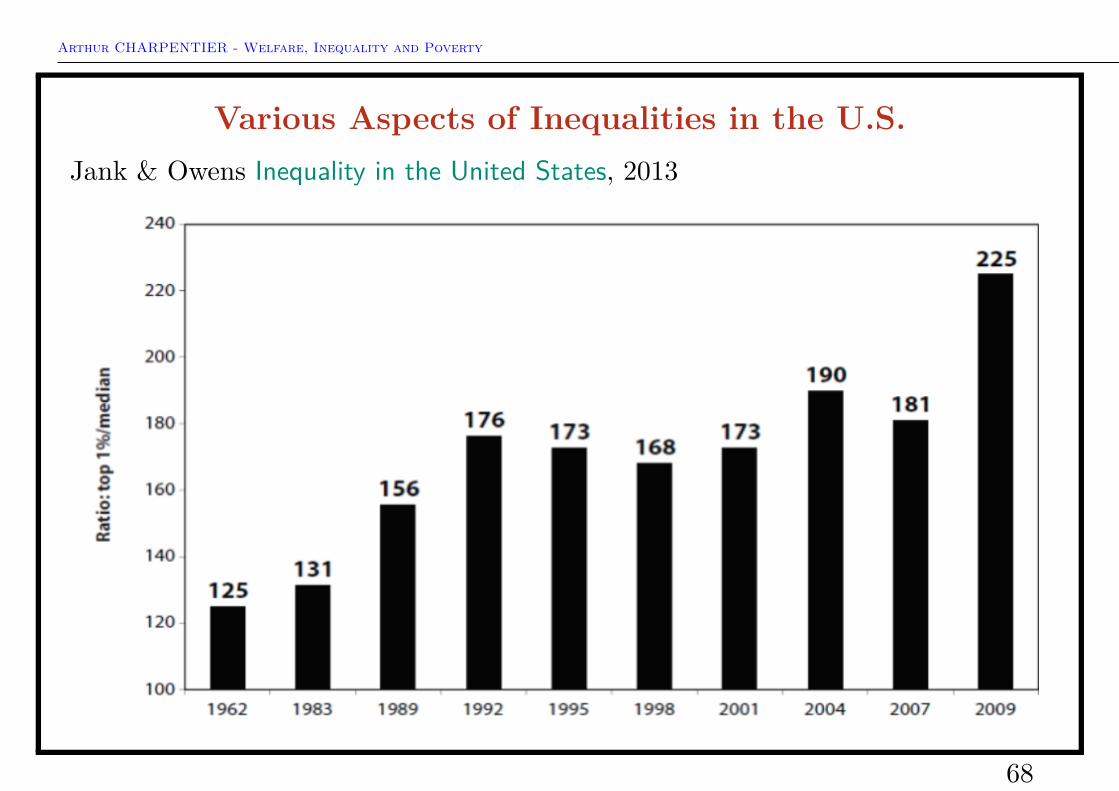
See also Jank & Owens Inequality in the United States, 2013, for stats and graphsabout inequalities in the U.S., in terms of health, education, crime, etc.