13
1 Slide © 2000 South-Western College Publishing/ITP Slides Prepared by JOHN LOUCKS

1 Slide © 2000 South-Western College Publishing/ITP
Slides Prepared by JOHN LOUCKS
2 Slide
Project Management
Managers have been planning, scheduling, monitoring, and controlling large scale projects for hundred years, but it has only been in the last 50 years that management science techniques have been applied to major projects.
In 1957, the Critical Path Method (CPM) was developed by Kelly and Walker to assist in building and maintenance of chemical plants.
In 1958, the special projects office of the US navy developed the Program Evaluation and Review Technique (PERT) to plan and control the Polaris missile program.
In the recent time, PERT and CPM are two popular management science techniques that help mangers plan, schedule, monitor, and control large scale and complex projects
3 Slide
PERT/CPM PERT stands for Program Evaluation and Review Technique.
CPM stands for Critical Path Method.
PERT/CPM is used to plan the scheduling of individual activities that make up a project.
PERT/CPM can be used to determine the earliest/latest start and finish times for each activity, the entire project completion time and the slack time for each activity.
PERT and CPM are similar in their basic approach, they do differ in the way activity times are estimated.
For each PERT activity three times (optimistic, pessimistic and most likely times) are combined to determine the expected activity completion time and its variance. Thus, PERT is a probabilistic technique: it allows us to find the probability of the entire project being completed by any given date.
CPM, on the other hand, is called a deterministic approach. It uses two time estimate, the normal time and the crash time, for each activity
4 Slide
Importance of PERT/CPM By using PERT and CPM analysis you will be able to answer questions
such as:
1. When will the entire project be completed?
2. What are the critical activities or tasks in the project, that is, the ones that will delay the entire project if they are late?
3. Which are the noncritical activities, that is, the ones that can run late without delaying the whole project’s completion time?
4. What is the probability that the project will be completed by a specific date?
5. At any particular date, is the project on schedule, behind schedule, or a head of the schedule?
6. On any given date, is the money spent equal to, less than, or greater than the budgeted amount?
7. Are there enough resources available to finish the project on time?
8. If the project is to be finished in a shorter amount of time, what is the best way to accomplish this at the least cost? (crash analysis)
5 Slide
CPM
Finding the critical path is a major part of controlling a project.
The activities on the critical path represent tasks that will delay the entire project if they are delayed.
Manager gain flexibility by identifying noncritical activities and replanning, rescheduling, and reallocating resources such as personnel and finances

6 Slide
Project Network
A project network can be constructed to model the precedence of the activities.
The arcs of the network represent the activities.
The nodes of the network represent the start and the end of the activities.
A critical path for the network is a path consisting of activities with zero slack. And it is always the longest path in the project network.

7 Slide
Drawing the project network (AOA)
An activity carries the arrow symbol, . This represent a task or subproject that uses time or resources
A node (an event), denoted by a circle , marks the start and completion of an activity, which contain a number that helps to identify its location. For example activity A can be drawn as:
A 1 2
3 days
This means activity A starts at node 1 and finishes at node 2
and it will takes three days
8 Slide
Determining the Critical Path
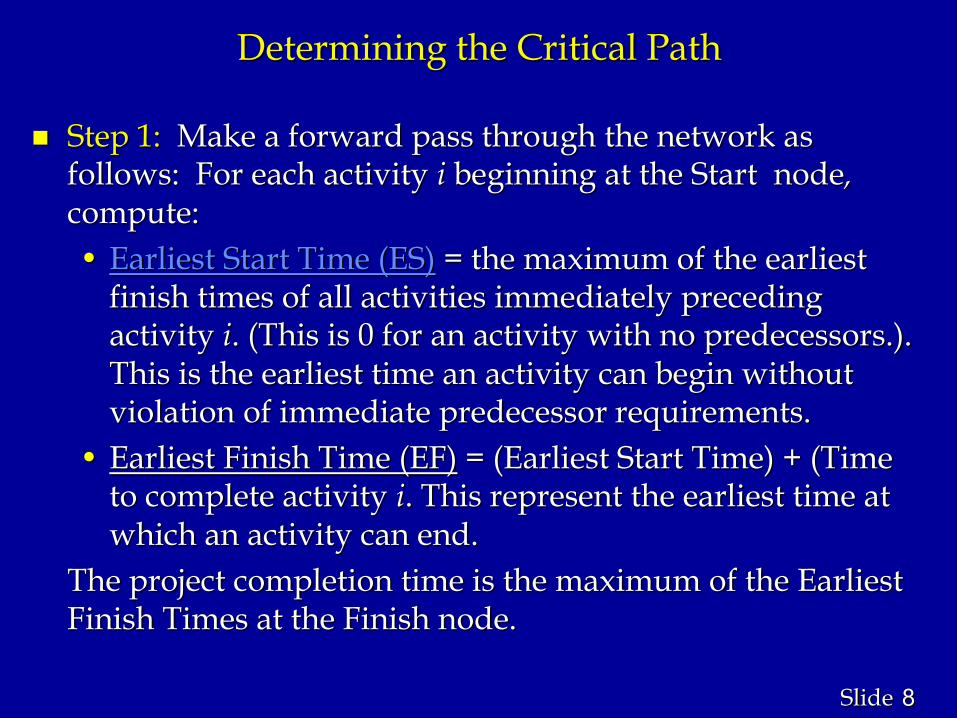
Step 1: Make a forward pass through the network as follows: For each activity i beginning at the Start node, compute:
• Earliest Start Time (ES) = the maximum of the earliest finish times of all activities immediately preceding activity i. (This is 0 for an activity with no predecessors.). This is the earliest time an activity can begin without violation of immediate predecessor requirements.
• Earliest Finish Time (EF) = (Earliest Start Time) + (Time to complete activity i. This represent the earliest time at which an activity can end.
The project completion time is the maximum of the Earliest Finish Times at the Finish node.

9 Slide
Determining the Critical Path
Step 2: Make a backwards pass through the network as follows: Move sequentially backwards from the Finish node to the Start node. At a given node, j, consider all activities ending at node j. For each of these activities, (i,j), compute:
• Latest Finish Time (LF) = the minimum of the latest start times beginning at node j. (For node N, this is the project completion time.). This is the latest time an activity can end without delaying the entire project.
• Latest Start Time (LS) = (Latest Finish Time) - (Time to complete activity (i,j)). This is the latest time an activity can begin without delaying the entire project.

10 Slide
Determining the Critical Path
Step 3: Calculate the slack time for each activity by:
Slack = (Latest Start) - (Earliest Start), or
= (Latest Finish) - (Earliest Finish).
A critical path is a path of activities, from the Start node to the Finish node, with 0 slack times.
11 Slide
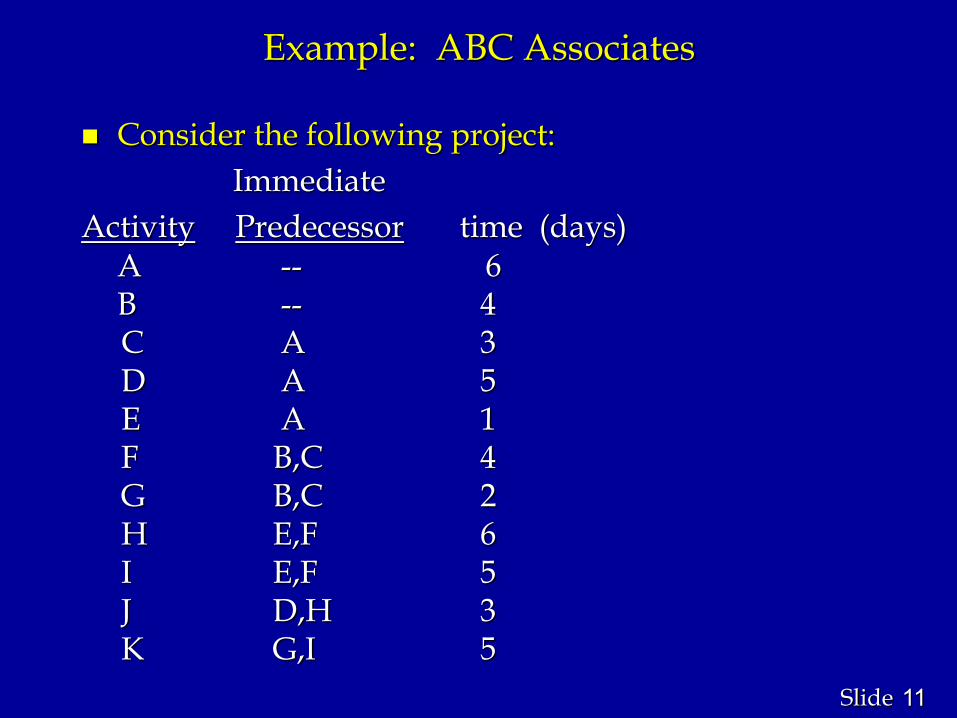
Example: ABC Associates
Consider the following project:
Immediate
Activity Predecessor time (days) A -- 6 B -- 4 C A 3 D A 5 E A 1 F B,C 4 G B,C 2 H E,F 6 I E,F 5 J D,H 3 K G,I 5

12 Slide
Example: network
A
B
C
D
E
F
G
H
I
J
K
1
2
3
4
5
6
7
6
4
3
5
1
4
2
6
5
3
5
0
6
9
13
19
18
23
23
18
20
13
9
6
0
ES
LF
Forward
Backward
13 Slide
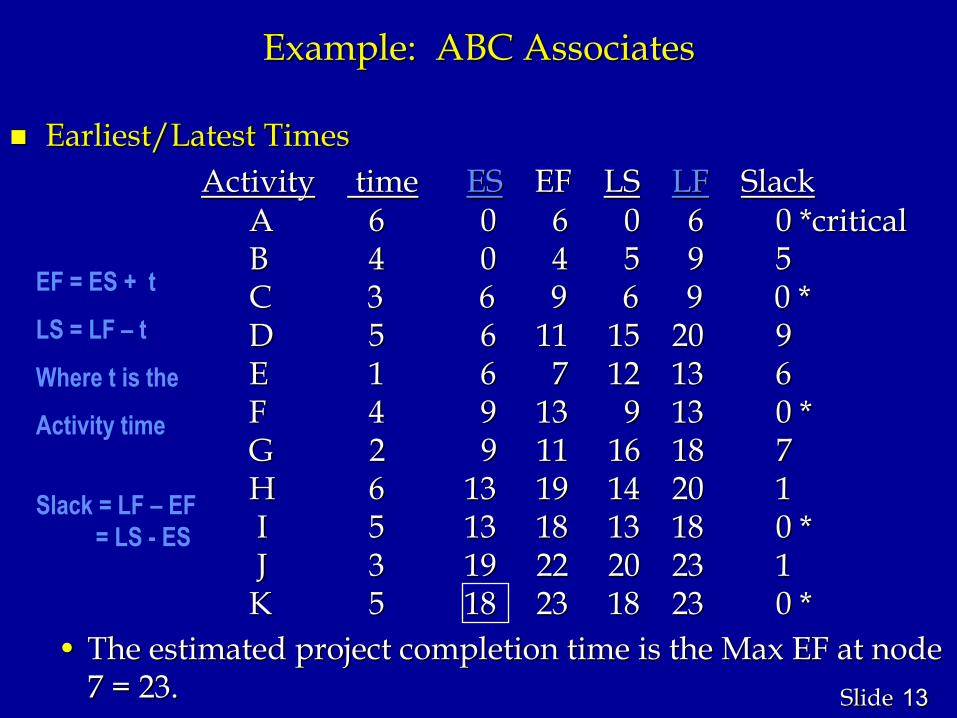
Example: ABC Associates
Earliest/Latest Times
Activity time ES EF LS LF Slack A 6 0 6 0 6 0 *critical B 4 0 4 5 9 5 C 3 6 9 6 9 0 * D 5 6 11 15 20 9 E 1 6 7 12 13 6 F 4 9 13 9 13 0 * G 2 9 11 16 18 7 H 6 13 19 14 20 1 I 5 13 18 13 18 0 * J 3 19 22 20 23 1 K 5 18 23 18 23 0 *
• The estimated project completion time is the Max EF at node 7 = 23.
EF = ES + t
LS = LF – t
Where t is the
Activity time
Slack = LF – EF
= LS - ES


