Slocan Valley Elk Study Aerial Survey Report 2004 Prepared for: Columbia Basin Fish and Wildlife Compensation Program Prepared by: Leo DeGroot Ministry of Water, Land, and Air Protection Nelson, BC March 2005
Transcript
Slocan Valley Elk Study
Aerial Survey Report
2004
Prepared for:
Columbia Basin Fish and Wildlife Compensation Program
Prepared by:
Leo DeGroot
Ministry of Water, Land, and Air Protection
Nelson, BC
March 2005
Slocan Valley Elk Study – Aerial Survey Report March 2005
ABSTRACT An aerial survey was completed in February 2004 to provide a population estimate for the Slocan Valley Elk Study area. This survey covered the complete study area below 1200 meters in elevation. 188 elk were spotted including eight of the 43 collared elk. Two different mark – resight programs estimate the population at 923 and 1010 animals respectively. A sightability model was also used; it determined a population estimate of 362 elk. The large discrepancy in population estimates may result from a combination of the high vegetative cover over much of the study area, the lack of fresh snow, and the lack of complete snow cover. Current harvest levels are based on an elk population of 375, we believe the harvest could be based on a population of 600 – 700 elk.
ii
Slocan Valley Elk Study – Aerial Survey Report March 2005
TABLE OF CONTENTS ABSTRACT ................................................................................................................................................... ii
TABLE OF CONTENTS .............................................................................................................................. iii
STUDY AREA................................................................................................................................................1
Elk Capture and Collaring ...........................................................................................................................3 Aerial Survey...............................................................................................................................................3 Mark Resight ...............................................................................................................................................3 Sightability Model .......................................................................................................................................3
Mark Resight ...............................................................................................................................................6 Sightability Model .......................................................................................................................................7
LITERATURE CITED....................................................................................................................................8
APPENDIX A ..............................................................................................................................................11
Slocan Valley Elk Study – Aerial Survey Report March 2005
INTRODUCTION Rocky Mountain Elk (Cervus elaphus nelsoni), are an indigenous ungulate in the Kootenay region of British Columbia. Some populations in the West Kootenays were supplemented in the early 1970’s with transplants of 75 elk into the Syringa Creek area and 49 elk into the Blueberry – Paulsen area (Demarchi, 1973). These elk were taken from Banff and Jasper National Parks. Many residents place a high value on the elk for hunting, viewing, or simple aesthetic reasons. For some other residents, they are considered to be problem wildlife due to the damage that they cause to gardens, orchards, and crops. Wildlife managers are attempting to satisfy the differing sets of values, but lack critical local information, especially in the West Kootenay (Serrouya, 2002). The Slocan Valley Elk Study, initiated in 2002, is designed to supply this missing information, so that management efforts can meet a wider range of values. The project is jointly funded by the Habitat Conservation Trust Fund (HCTF) from the Arrow Wildlife Trust Account, the Columbia Basin Fish and Wildlife Compensation Program (CBFWCP) and the Ministry of Water, Land, and Air Protection (MWLAP). The MWLAP is implementing and administering the project. This aerial survey and determination of a population estimate was a key component of the overall study. The February 2004 survey was primarily funded by the CBFWCP. This report presents the results of the aerial survey.
STUDY AREA The study area is approximately 800 km2 and is located in the West Kootenay region of south-east British Columbia. It includes the southern 20 km of the Slocan Valley from Passmore south-east to where the Slocan River joins the Kootenay River, 20 km of the Kootenay River Valley from this point south-west to Castlegar, and the Pass Creek Valley – Krestova area north and east of Castlegar (Figure 1). This area is in Wildlife Management Units 4-08, 4-15, 4-16, and 4-17, the Nelson – Creston Electoral Area, and the Arrow/Boundary Forest District. Valley bottoms are generally narrow, between 450 and 600 meters above sea level in elevation, and are largely private land in a rural residential setting. Approximately 5000 people reside in this area (Statistics Canada, 2001). There is some small scale agriculture which includes beef cattle farming, hay production, and fruit and berry crops. Areas above the valley bottoms are predominately Crown land, and are generally of a steep gradient. Commercial forestry is a major use of the Crown land. The area is in the interior wet belt, and falls within several biogeoclimatic zones. Areas below approximately 1500 meters in elevation fall within the Interior Cedar Hemlock (ICH) zone, areas between approximately 1500 and 2000 meters are in the Engelmann
1
Slocan Valley Elk Study – Aerial Survey Report March 2005
Spruce – Subalpine Fir (ESSF) zone. Areas higher in elevation are in the Alpine Tundra (AT) zone (Braumandl and Curran, 1992).
,
,
,
!!
Willow Point
Co
t
a r r e
Blueberry
OotischeniaKinnaird
BrilliantRobsonWest
GrassyMountain
Robson Raspberry
Thrums
Tarrys
Glade
Shoreacres
Valley
Krestova
Pass Creek
Gibson Creek
Kraft
SiwashMtn
MtnCopper
Granite
Blewett
Taghum
BeasleyCorra
LinnFalls
Bonnington
SouthSlocan
Slocan Park
Passmore
Lebahdo
C
r
ee
k
C
S p r o u
le
Gr
oh
ma
n
Cr
G o o s e
e e k
C r e e k
N
rn
s
C r e e ky
LI
TT
L
KO
OT
EN
AY
R I V E R
B
F or t
y ni n e
Cr
Er
ie
Cr
ee
k
b e r r yC r e e k
RI
VE
R
Ska ttebo
Reach
a
Cre
scen
t
Ape
x C
r eek
Ck
Sy
ri
ng
a
C r
A i r
C O L U M B I A Castlegar
N
EW
S(at map centre)
2 0 2 Kilometers1:250,000
Figure 1. The area covered by the Slocan Valley Elk Study is outlined by the ellipse. The contour (grey) lines are 200 meters in elevation apart.
METHODS We captured and attached collars to fifty elk within the study area during the 2002/03 and 2003/04 winters using corral traps. The collars were attached to monitor elk movements, however the presence of collared elk allowed the use of mark – resight methodology of population estimation (Krebs, 1989, Seber, 1982, White, 1996). A sightability model developed by the Idaho Department of Fish and Game (Unsworth, et al, 1999) provided an alternate population estimation method from the aerial survey data.
2
Slocan Valley Elk Study – Aerial Survey Report March 2005
Elk Capture and Collaring Sixteen of 49 elk collared received both a VHF collar (Lotek Wireless, Newmarket, Ontario) and a visual collar with a unique letter identifying the individual (Wheelers Custom Upholstery, Nelson, BC). Twenty five elk received only a visual collar. Eight elk received a Global Positioning System (GPS) collar (Advanced Telemetry Systems (ATS), Isanti, Minnestota) (four GPS collars were actually used, they were removed after 10 months, refurbished, and attached to different animals the second winter). The VHF and four GPS collared elk were all within the study area at the time of the survey. We presume that all of the elk fitted with visual collars were also within the study area. One collared elk had been taken by a hunter, and another killed on a highway. As a result, we estimate that 43 marked elk were within the study area.
Aerial Survey We divided the study area into 12 sub units using boundaries developed previously by the CBFWCP (Heaven et al, 1998). Areas above 1200 meters in elevation were not included in the sub units as elk were not expected to use these areas during the winter due to the deep snow depth. (Snow depth was very close to the long term average at 1200 meters elevation and at lower elevations (MWLAP, 2004)). The sub units were of a size that could be flown in 1-2 hours, with breaks between sub units that were easily identifiable from the air. The sub units were stratified from 1 (low) to 3 (high) depending on usage by elk based on local knowledge. We conducted the aerial survey between February 20 - 25, 2004 using a Bell Jet Ranger 206 (Kokanee Helicopters, Nelson, BC). Standard aerial survey methods were used (MSRM, 2002, Unsworth et al, 1999, Heaven et al, 1998). Three observers in addition to the pilot were employed during the entire survey. Strip transects were flown over the gentler valley bottoms with the width dependent on the openness of the vegetation. Elevational contours of 100 – 130 meters were used over the valley sides. Flight lines and locations of animals were marked on a 1:50,000 map. All 12 sub units were surveyed.
Mark Resight In order to use the mark resight method of population estimation, the sighting of each collared elk with the collar color and letter, was recorded, in addition to a total count. The collar details allowed us to identify the individual animal.
Sightability Model To meet the requirements of the sightability model the percentage of the ground covered by snow and the percentage covered by trees and shrubs was recorded for each group of elk spotted. In addition, when possible the animals were classified as to gender, and the
3
Slocan Valley Elk Study – Aerial Survey Report March 2005
bulls to the number of points on their antlers. Where possible the number of calves was recorded as well.
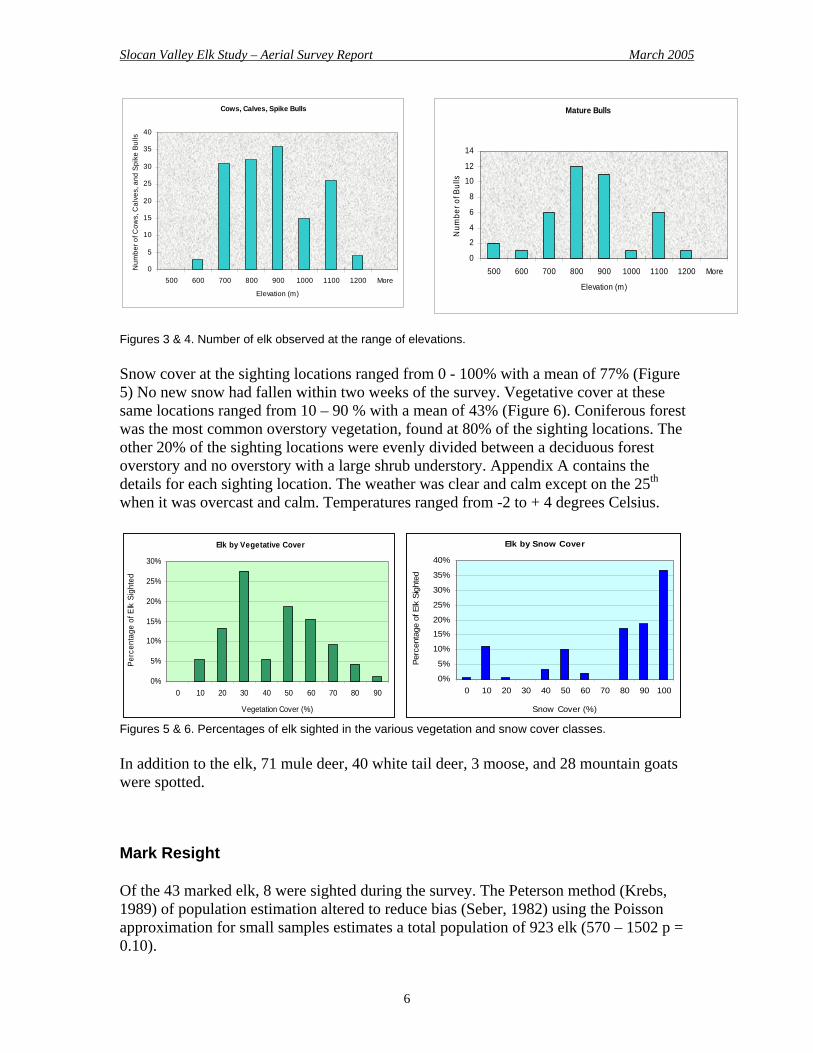
RESULTS A total of 188 elk were observed. The results ranged from 1 to 31 elk per sub unit with an average of 16. Figure 2 illustrates the number of elk per subunit. A breakdown results in 60 cows, 52 bulls, 11 calves, and 65 unclassified. The unclassified category was used when the spotters couldn’t distinguish between cows and calves. Group size ranged from single animals to 16 with a mean of 3.1. Larger groups usually consisted of cows and calves, with the occasional spike bull. The mature bulls were usually alone or in small groups. The elk were spotted at elevations ranging from 500 to 1140 meters above sea level, with an average of 848 meters. Mature bulls were found at slightly lower elevations (819 meters) than cows, calves, and spike bulls (857 meters). Figures 3 and 4 illustrate the elevations of the observed elk.
4
Slocan Valley Elk Study – Aerial Survey Report March 2005
82F.032
82F.033
82F.034
82F.042
82F.043
82F.044
82F.052
82F.053
82F.054
82F.062
82F.063
82F 06
82F 11
OotischeniaKinnaird
BrilliantRobsonWest
GrassyMountain
Robson Raspberry
Thrums
Tarrys
Glade
Shoreacres
Valley
Krestova
Pass Creek
Gibson Creek
Kraft
SiwashMtn
MtnCopper
Mt
Eccles
Castlegar
Granite
Blewett
Taghum
BeasleyCorra
LinnFalls
Bonnington
SouthSlocan
Slocan Park
Passmore
Lebahdo
Winlaw
Willow
Cr
e
e
k
Cr
ee
k
S p r ou
le
Gr
oh
ma
n
Cr
G o o s e
Ck
Sy
ri
ng
a
k e
C r e e k
La
dy
b
i
rd
C r e e k
N
rn
s
C r e e k
Ai r y
LI
TT
LE
C r e e k
KO
OT
EN
AY
RI V E R
B
F or t y n
i n e
Cr
Er
ie
Cr yC r e e k
C O L U M B I A
RI
V
Skattebo
Reach
a
SLO
CAN
Cre
scen
t
Ape
x C
r eek
4-08-07
4-16-07
4-16-15
4-17-15
4-18-064-17-14
4-08-02
4-16-144-15-14 4-16-13 4-08-08
4-15-12
Elk per Sub Unit
1 - 3
4 - 9
10 - 16
17 - 25
26 - 31
Ministry of Water,Land and Air Protection
"Kootenay Region"February 11, 2005
N
EWS
(at map centre)
1:250,000
49°2
0'49°20'
49°3
0'49°30'
117°50'
117°50'
117°40'
117°40'
117°30'
117°30'117°20'
117°20' Elk Density by Survey Sub Unit - Slocan Valley Elk Study
Figure 2. Number of elk sighted per sub unit during the aerial survey.
5
Slocan Valley Elk Study – Aerial Survey Report March 2005
Cows, Calves, Spike Bulls
0
5
10
15
20
25
30
35
40
500 600 700 800 900 1000 1100 1200 More
Elevation (m)
Num
ber o
f Cow
s, C
alve
s, a
nd S
pike
Bul
ls
Mature Bulls
0
2
4
6
8
10
12
14
500 600 700 800 900 1000 1100 1200 More
Elevation (m)
Num
ber o
f Bul
ls
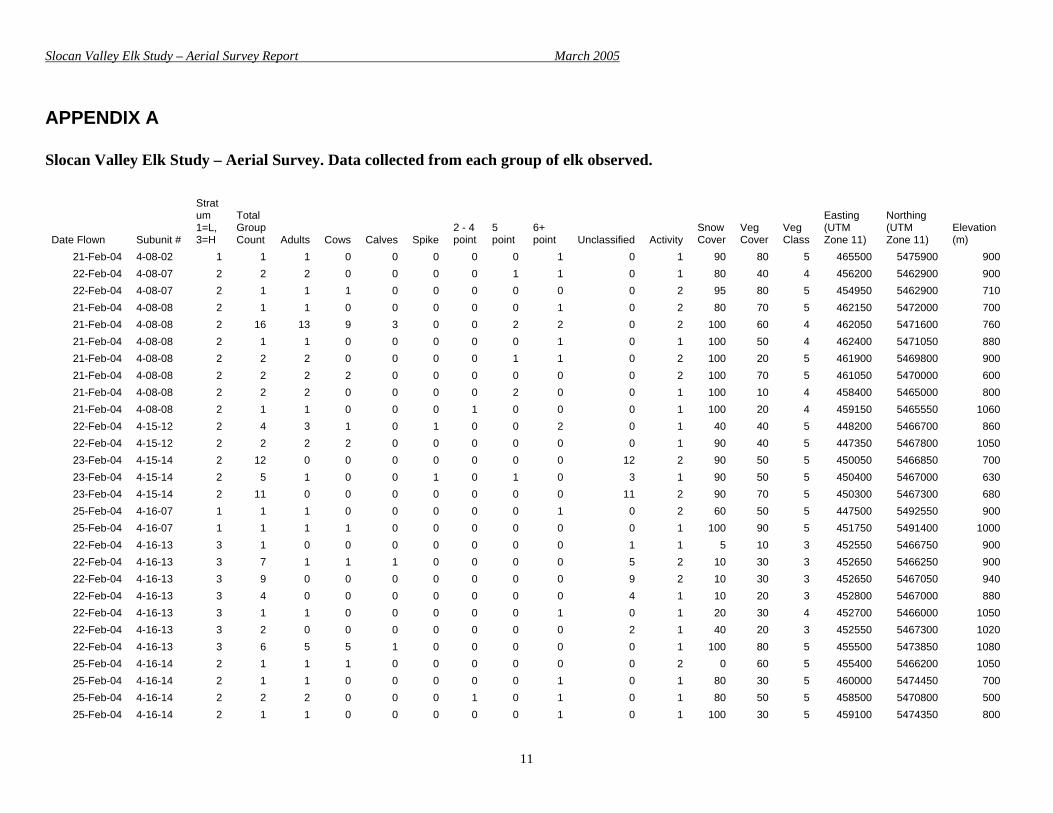
Figures 3 & 4. Number of elk observed at the range of elevations. Snow cover at the sighting locations ranged from 0 - 100% with a mean of 77% (Figure 5) No new snow had fallen within two weeks of the survey. Vegetative cover at these same locations ranged from 10 – 90 % with a mean of 43% (Figure 6). Coniferous forest was the most common overstory vegetation, found at 80% of the sighting locations. The other 20% of the sighting locations were evenly divided between a deciduous forest overstory and no overstory with a large shrub understory. Appendix A contains the details for each sighting location. The weather was clear and calm except on the 25th when it was overcast and calm. Temperatures ranged from -2 to + 4 degrees Celsius.
Elk by Vegetative Cover
0%
5%
10%
15%
20%
25%
30%
0 10 20 30 40 50 60 70 80 90
Vegetation Cover (%)
Perc
enta
ge o
f Elk
Sig
hted
Elk by Snow Cover
0%
5%
10%
15%
20%
25%
30%
35%
40%
0 10 20 30 40 50 60 70 80 90 100
Snow Cover (%)
Perc
enta
ge o
f Elk
Sig
hted
Figures 5 & 6. Percentages of elk sighted in the various vegetation and snow cover classes. In addition to the elk, 71 mule deer, 40 white tail deer, 3 moose, and 28 mountain goats were spotted.
Mark Resight Of the 43 marked elk, 8 were sighted during the survey. The Peterson method (Krebs, 1989) of population estimation altered to reduce bias (Seber, 1982) using the Poisson approximation for small samples estimates a total population of 923 elk (570 – 1502 p = 0.10).
6
Slocan Valley Elk Study – Aerial Survey Report March 2005
The Noremark program using a maximum likelihood joint hyper geometric estimator for closed populations (White, 1996) estimates a total population of 1010 elk (644-1817 p= 0.10)
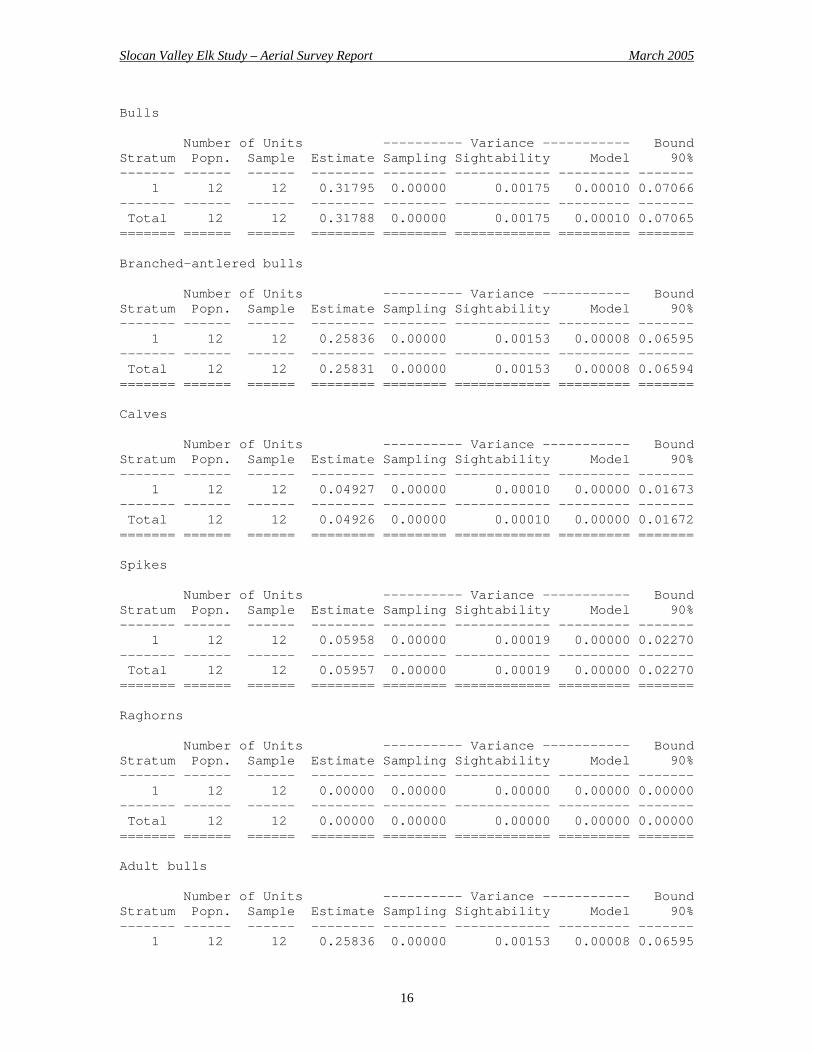
Sightability Model The sightability model estimates a total population of 362 elk (297 – 427) (p = 0.10). The estimation breakdown indicates 144 cows, 94 branch antlered bulls, 22 spike bulls, 18 calves, and 85 unclassified. Appendix B contains the full model output.
DISCUSSION The two mark - resight methods estimated populations of 923 and 1010 elk respectively, while the sightability model provided an estimate of 362 elk. The ratio of cows to bulls and calves was not analyzed due to the large percentage of unclassified animals. We felt that the sightability model may have produced biased results on the south and west facing slopes, as many of the elk were bedded down on the bare ground next to the conifer trees. Snow cover on these slopes ranged from 60 – 90%; however the elk were choosing the snow free areas, which may better fit a lower snow cover estimate. We experimented by running the model with the snow cover percentages on the south and west facing slopes reduced to 30 – 40%. The results only increased the estimation by 17 elk, not enough to explain the large gap between the sightability model estimate and the mark – resight estimates. The large discrepancy in population estimates may result from a combination of the lack of fresh snow, the lack of complete snow cover, and the high vegetative cover over much of the study area. The sightability model is designed to compensate for dense forest conditions; however patchy snow conditions are mentioned as a weakness of the model (Unsworth et al. 1999). Gasaway et al. (1986) consider old snow with some vegetation showing through as poor conditions for moose surveys. They also state that a precise and unbiased estimate for moose sightability cannot be achieved even through intensive searches in semi open coniferous forest, and is futile in closed canopy coniferous forests. These factors, while observed for moose surveys, could be very similar for elk surveys and may explain the fact that only eight of the 43 marked elk were sighted during the survey. The low resight number produces wide confidence intervals in the mark – resight estimates. A combined and rounded best estimate from this survey is an elk population in the study area of 600 to 700 elk, within but at the conservative end of the mark – resight confidence limits and above the population estimate of the sightability model. Estimates by the Ministry of WLAP prior to this survey indicated a population within the study area of 375 elk. The desired harvest rate has been set at 10% of the population annually, between 1999 and 2001 33 animals have been harvested annually (MWLAP, 2002). The absence of systematic previous surveys prevents calculation of a population trend.
MANAGEMENT RECOMMENDATIONS
7
Slocan Valley Elk Study – Aerial Survey Report March 2005
The lack of a precise new population estimate and the fact that the current harvest rate is based on a population lower than the estimate derived from this survey suggest that the present harvest rate is conservative. Cow/calf ratios and population growth parameters have not been calculated here but will be considered in developing future harvest rates. A revised harvest strategy will require consideration of the population goals. In the mean time we recommend that the current harvest be based on a population estimate of 600 – 700 elk, which is at the low end of the population range as determined by the mark – resight methods. Other adjustments to spatial and temporal aspects of the harvest will depend on outcomes of other parts of this study. If harvest adjustments do not reduce the incidents of elk causing damage to human property, it may be prudent to conduct another aerial survey. To improve the results in an efficient manner, we recommend that the five sub units where a low number of elk were sighted in this survey not be resurveyed. The effort could then be concentrated in the other seven subunits. In addition, we recommend that future surveys take place during conditions of 100% snow cover, which in this area are likely to occur during December and January. A survey conducted while the current VHF collars are still active (until approximately 2009) would allow the mark resight methodology to be used again.
ACKNOWLEDGEMENTS The Columbia Basin Fish and Wildlife Compensation Program (CBFWCP) provided funding to cover the helicopter costs for the aerial survey. Observers were funded by the CBFWCP and the Ministry of Water, Land, and Air Protection (MWLAP). The Habitat Conservation Trust Fund (HCTF) from the Arrow Wildlife Trust Account provided much of the funding for the capture / collaring segment of the study. The MWLAP provided office space, vehicles, and many miscellaneous items. G. Woods from the MWLAP initiated the study and has provided invaluable assistance throughout. D. Wassick, Kokanee Helicopters provided expert piloting. Observers during the aerial survey were D. Fear, M. Marello, J. Gwilliam, R. Clarke, D. Miller, and L. DeGroot. D. Fear, M. Marello, W. Savinkoff, C. Stubbe, C. Tarala, P. Sargent, D. Moore, T. Appleby, B. Park, S. Petrovcic, G. Pavan, and S. Shannon played a large part in the capture and collaring success. R. Clarke, J. Gwilliam, J. Krebs, and G. Woods reviewed an earlier draft of this report and provided valuable input.
LITERATURE CITED Braumandl, T.F., and M.P. Curran. 1992. A field guide for the site identification for the
Nelson Forest Region. British Columbia Ministry of Forests, Victoria, British Columbia, Canada
Ministry of Water, Land and Air Protection. – 1970-73.
8
Slocan Valley Elk Study – Aerial Survey Report March 2005
Gasaway, W. C., S. D. DuBois, D. J. Reed, and S. J. Harbo. 1986. Estimating moose population parameters from aerial surveys. Biological Papers No. 22, University of Alaska – Fairbanks, Alaska, USA.
Heaven, P.C., M.T. Tinker, and I. Adams. 1998. Ungulate monitoring plan. Unpublished
report prepared for the Columbia Basin Fish and Wildlife Compensation Program, Athalmer, BC.
Krebs, C.J. 1989. Ecological Methodology. Harper and Rowe Publishers, New York,
New York, USA MELP (Ministry of Environment, Lands, and Parks).1998. Live Animal Capture and
Handling, Guidelines for Wild Mammals, Birds, Amphibians, and Reptiles, Version 2.0. Resources Inventory Committee, Province of British Columbia, Canada
MSRM (Ministry of Sustainable Resource Management). 2002. Aerial Based Inventory
Methods for Selected Ungulates, Version 2.0. Resources Inventory Committee, Province of British Columbia, Canada
MWLAP (Ministry of Water, Land and Air Protection). 2002. Elk resident limited entry
hunt authorization numbers, 2002. Unpublished data. MWLAP (Ministry of Water, Land and Air Protection). 2004. Snowpack and Water
Supply Outlook for British Columbia. Available on the internet: http://wlapwww.gov.bc.ca/rfc/archive/2004/200403/bulletin.htm Accessed on January 7, 2005
Seber, G.A.F. 1982. Estimation of Animal Abundance and Related Parameters. 2nd
Edition. Pages 37 – 43 in Krebs, C.J. 1989. Ecological Methodology. Harper and Rowe Publishers, New York, New York, USA
Serrouya, R. 2002. Slocan Valley Elk Study, Project Proposal. Submitted to the Habitat
Conservation Trust Fund, Ministry of Water, Land, and Air Protection, Province of British Columbia, Canada
Statistics Canada, 2001. Regional District of Central Kootenay Community Profile.
Available on the internet: http://geodepot.statcan.ca/Diss/CP2001/Community.cfm?App=CP01&ID=11650&PlaceName=pass%20creek&SEARCH=BEGINS&lang=0&theme=csd&code=5903056&Province=59
Unsworth, J. W., F. A. Leban, E. O. Garton, D. J. Leptich, and P. Zager. 1999. Aerial
Survey: User’s Manual. Electronic Edition. Idaho Department of Fish & Game, Boise, Idaho, USA.
Slocan Valley Elk Study – Aerial Survey Report March 2005
APPENDIX B Slocan Valley Elk Study – Aerial Survey. Output from sightability model. Aerial Survey 2002, Version 1.00 Beta 6.1.5 (16-Aug-2002) Friday, May 14, 2004 04:11 PM Model: Elk, Hiller 12-E, Idaho (with snow) [Files] Title = H:\Elk Project\Sightability Model\Aerial Survey-May5-04\Slocan Elk #6.ttl Summary = H:\Elk Project\Sightability Model\Aerial Survey-May5-04\Slocan Elk #6.sum ............................................................................... Slocan Elk #6 Section 1: Summary of Raw Counts ------------------------------------------------------------------------------- Units --------- Number of Each Class Counted --------- Stratum Sampled Total Cows Bulls BABull Calves Spikes Raghrn AdBull Unclas ------- ------- ------ ------ ------ ------ ------ ------ ------ ------ ------ 1 12 188 60 52 40 11 12 0 40 65 ------- ------- ------ ------ ------ ------ ------ ------ ------ ------ ------ Total 12 188 60 52 40 11 12 0 40 65 ======= ======= ====== ====== ====== ====== ====== ====== ====== ====== ====== Section 2: Summary of Raw Counts for Perfect Visibility Model ------------------------------------------------------------------------------- This table projects the number of animals that would have been counted if every unit had been flown and visibility had been perfect (no animals obscured by vegetation, etc.) No of Units --------- Number of Each Class Counted --------- Strat Popn Sample Total Cows Bulls BABull Calves Spikes Raghrn AdBull Unclas ----- ---- ------ ----- ------ ------ ------ ------ ------ ------ ------ ------ 1 12 12 188 60 52 40 11 12 0 40 65
13
Slocan Valley Elk Study – Aerial Survey Report March 2005