Slope Monitoring Methods in the Mining Industry Stanley J. Michalek, P.E. Chief, Mine Waste and Geotechnical Engineering Division Pittsburgh Safety and Health Technology Center Mine Safety and Health Administration
Transcript
Slope Monitoring Methods
in the Mining Industry
Stanley J. Michalek, P.E.Chief, Mine Waste and Geotechnical Engineering Division
Pittsburgh Safety and Health Technology Center
Mine Safety and Health Administration
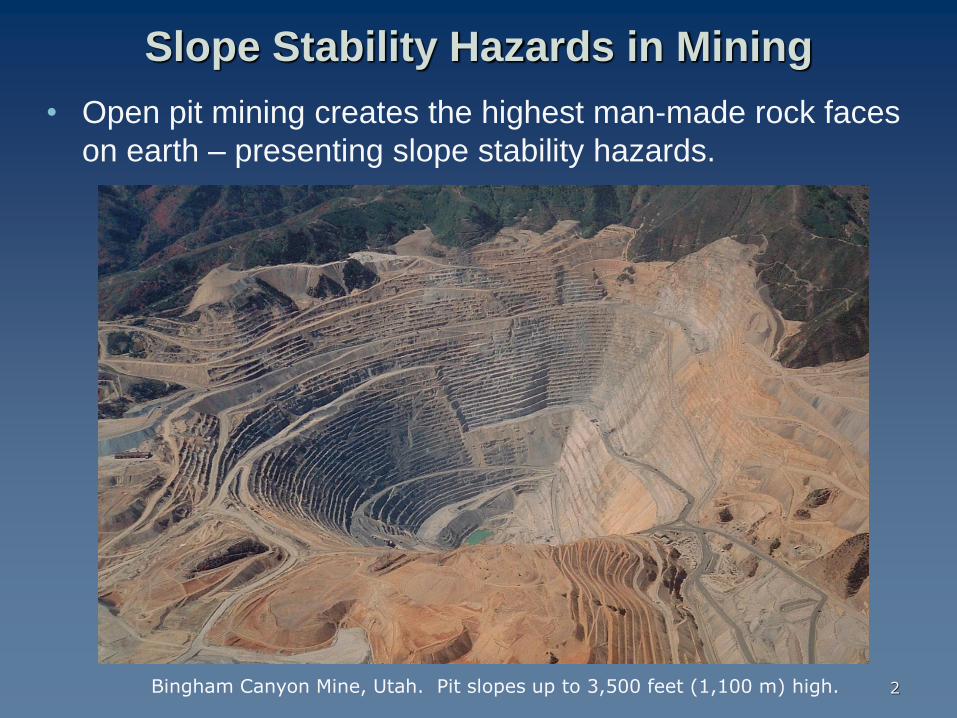
Slope Stability Hazards in Mining
• Open pit mining creates the highest man-made rock faces
on earth – presenting slope stability hazards.
2Bingham Canyon Mine, Utah. Pit slopes up to 3,500 feet (1,100 m) high.
Slopes can present a
hazards to assets(personnel, equipment, ore reserves)
3
4
Gold Mine - Montana
Coal Mine - Wyoming
5
Copper Mine - Arizona
6
Slope Monitoring
• Detect movement
• Measure displacement
• Determine displacement trend
– Uniform
– Decelerating
– Accelerating
7
Slope Monitoring Methods(Low to High Tech)
• Visual observation
• Crack monitors
• Wireline extensometers
• Surveying with prisms
• Slope Stability Radar
• LiDAR
• InSAR
8
Crack Monitoring
9
• Small cracks at the
top of the pit or
unstable area are
often an early
warning sign of
instability.
• Crack monitoring
can start with simple
makeshift devices
as soon as the crack
is noticed.
10
Wireline Extensometer
Wireline tensioned w/weight & pullies
Extensometer
End of line anchored beyond crack
Surveying with Prisms
• Precise (millimeter
precision) 3-axis
slope movement
monitoring of very
large areas.
• Most widely used
slope monitoring
system in mining.
12
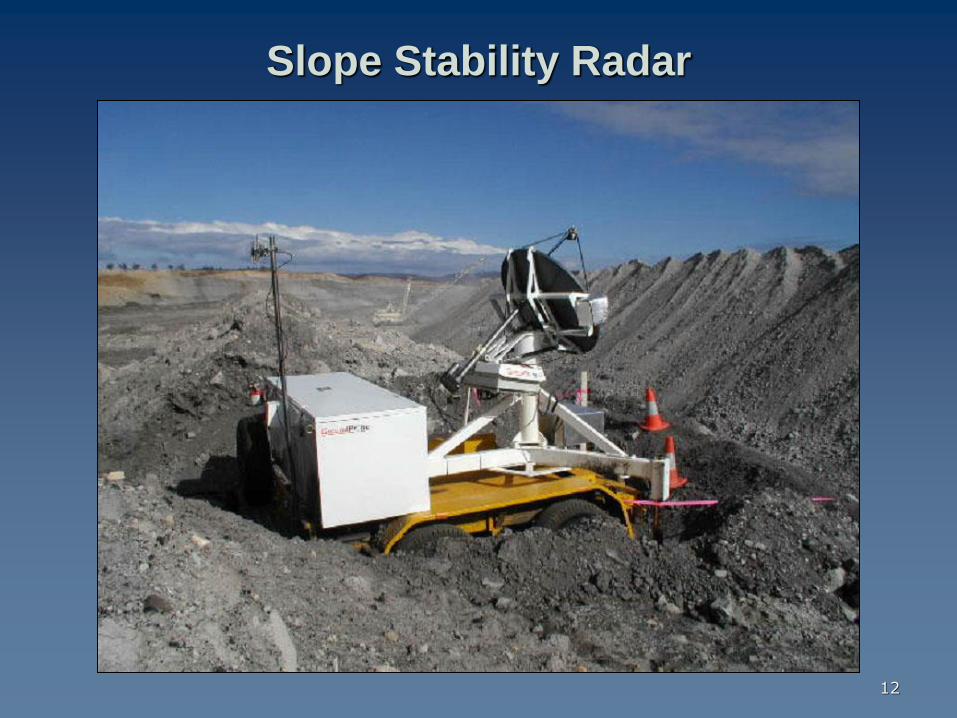
Slope Stability Radar
Slope Stability Radar (SSR)
• Sub-millimeter distance
range measurements
between antenna and
continuous points on
slope over a set scanned
area.
• Range up to 3 ½ km.
• Rapid “tactical”
deployment and setup.
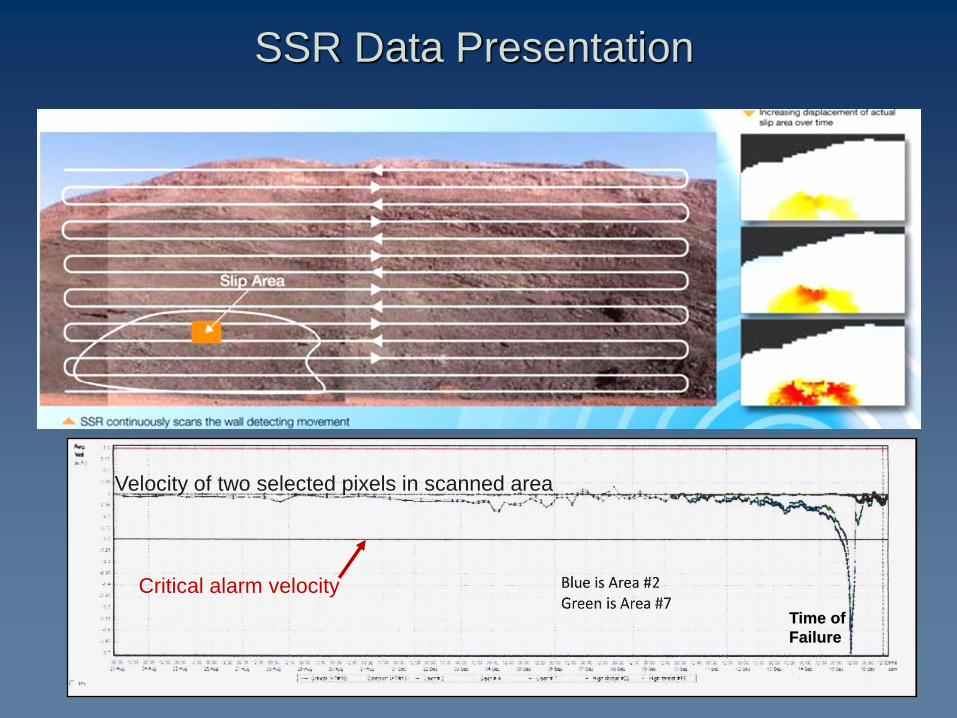
Time of
Failure
SSR Data Presentation
Velocity of two selected pixels in scanned area
Critical alarm velocity
15
LiDAR(Light Detection and Ranging)
• Uses speed of light to measure distance from instrument.
• Ground- or aerial-based surveys.
16
• High precision, geo-referenced, 3-D “point cloud” data
and imagery of rock faces.
‒ Examine rock faces from inaccessible perspectives
(drone-based systems).
‒ Obtain detailed geometry of cracks, fractures, joints,
and other discontinuities on the rock face.
‒ Point-cloud computer analysis software can plot
discontinuity data and determine potential rock slope
failure modes.
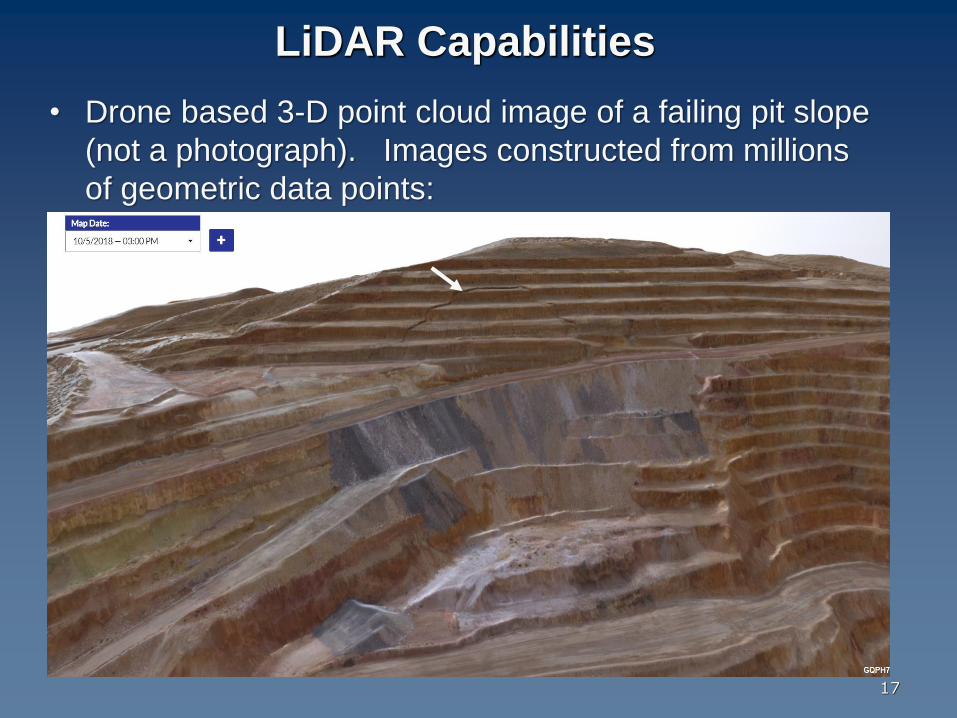
LiDAR Capabilities
17
• Drone based 3-D point cloud image of a failing pit slope
(not a photograph). Images constructed from millions
of geometric data points:
LiDAR Capabilities
18
• 3-D point cloud image of a rock face.
• Precise geometry of the discontinuities can be extracted
from the data.
LiDAR Capabilities
19
• LiDAR-generated data of rock face – point cloud and stereonet
plots of the discontinuity orientations…
LiDAR Capabilities
Manually gathered data
Automated LiDAR Data
20
InSAR(Interferometric Synthetic Aperture Radar)
Near-polar orbit
typically 500 km height
Coverage 82°N to 82°S
• Various satellites in operation since 1992.
• Datasets provide 1-2 mm resolution coverage of ground
movement for most of the Earth.
Satellite
21
InSAR
Large-area application - investigating subsidence after
underground coal mine pillar failure accident.
• Surface Deformation from USGS InSAR.
• Each “fringe” depicts 5 cm of subsidence that occurred between successive
satellite passes.
InSAR
23
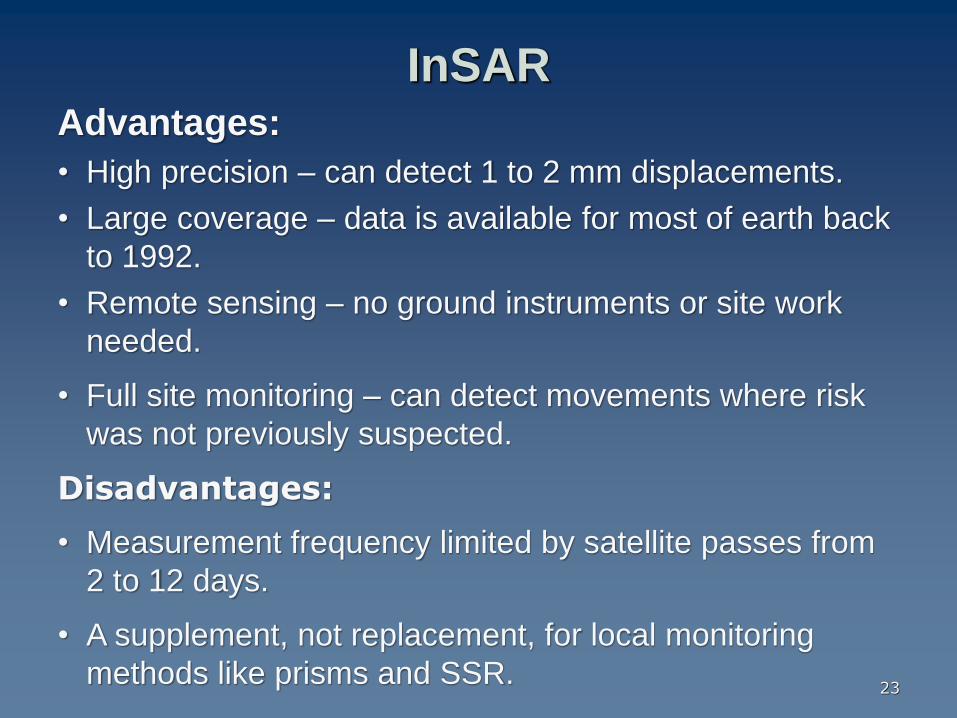
InSARAdvantages:
• High precision – can detect 1 to 2 mm displacements.
• Large coverage – data is available for most of earth back
to 1992.
• Remote sensing – no ground instruments or site work
needed.
• Full site monitoring – can detect movements where risk
was not previously suspected.
Disadvantages:
• Measurement frequency limited by satellite passes from
2 to 12 days.
• A supplement, not replacement, for local monitoring
methods like prisms and SSR.
Data Interpretation
24
Progressive movement to failure…
25
Predicting Time to Failure
Inverse velocity (1/v) often used in predictive models.
Fit trend line to data
(Quadratic in this case)
Predicted failure time
(i.e., velocity approaches
“infinity”)
26
Predicting Time to Failure
Inverse velocity (1/v) method – SSR data example
Predicted failure (intercept) at 2 Nov, 09:33
27
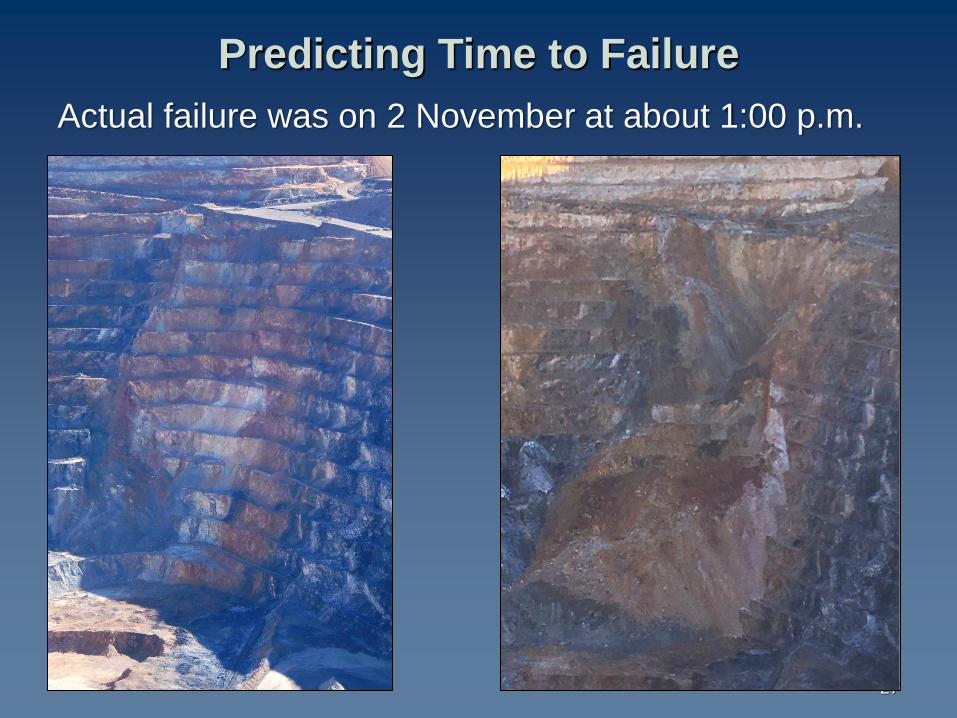
Predicting Time to Failure
Actual failure was on 2 November at about 1:00 p.m.