Water Research 38 (2004) 111–127
ARTICLE IN PRESS
*Correspond
510-642-7483.
E-mail addr
0043-1354/$ - se
doi:10.1016/j.w
Sludge accumulation, characteristics, and pathogeninactivation in four primary waste stabilization ponds in
central Mexico
Kara L. Nelsona,*, Blanca Jim!enez Cisnerosb, George Tchobanoglousc,Jeannie L. Darbyc
aDepartment of Civil and Environmental Engineering #1710, University of California, Berkeley, CA, 94720-1710, USAb Hydraulic and Environmental Engineering, Institute of Engineering, National Autonomous University of Mexico, CD Universitaria,
A.P. 70-472, Coyoacan 04510 Mexico, DFc Department of Civil and Environmental Engineering, 1 Shields Avenue, University of California, Davis, CA, 95616, USA
Received 8 May 2002; received in revised form 14 August 2003; accepted 8 September 2003
Abstract
To support the development of safe and feasible sludge management strategies, the accumulation rates of sludge and
its characteristics were studied in four primary wastewater stabilization ponds (WSPs) in central Mexico (three
facultative and one anaerobic). The accumulation rates and distribution of sludge were determined by measuring the
thickness of the sludge layer at 8–40 locations throughout each pond. The average, per capita sludge accumulation rates
ranged from 0.021 to 0.036 m3/person/yr. In the anaerobic pond the sludge distribution was uniform throughout the
pond, whereas in the three facultative ponds most of the sludge accumulated directly in front of the inlet. To measure
the horizontal and vertical variation in the sludge characteristics, sludge cores were collected from 3 to 7 locations in
three of the ponds. Each core was divided into 4 sub-samples in which various physical, chemical, and microbiological
parameters were measured. In addition, the inactivation of several pathogen indicator organisms was studied in a batch
of sludge for 7 months. Based on the microbiological results, it is concluded that reasonable estimates of the
inactivation of fecal coliform bacteria, fecal enterococci, F+ coliphage, somatic coliphage, and Ascaris eggs in WSP
sludge in central Mexico can be made using first-order rate constants of 0.1, 0.1, 0.01, 0.001, and 0.001 d�1, respectively.
From the observed changes in the concentrations of total solids and the volatile to fixed solids ratio, empirical equations
were developed to describe anaerobic degradation and compression, which are the two most important processes
affecting the volume of sludge after its deposition.
r 2003 Elsevier Ltd. All rights reserved.
Keywords: Waste stabilization pond; Wastewater stabilization pond; Sludge accumulation rate; Sludge distribution; Biosolids;
Pathogens
1. Introduction
Wastewater stabilization ponds (WSPs) are a simple,
low-cost, low-maintenance process for treating waste-
ing author. Tel.: +1-510-643-5023; fax: +1-
ess: [email protected] (K.L. Nelson).
e front matter r 2003 Elsevier Ltd. All rights reserve
atres.2003.09.013
water. A typical system consists of several constructed
ponds operating in series; larger systems often have two
or more series of ponds operating in parallel. Treatment
of the wastewater occurs as constituents are removed by
sedimentation or transformed by biological and chemi-
cal processes. In the bottom of the ponds, a sludge layer
forms due to the sedimentation of influent suspended
solids as well as algae and bacteria that grow in the
d.
ARTICLE IN PRESSK.L. Nelson et al. / Water Research 38 (2004) 111–127112
pond. Sludge accumulation is greatest in primary ponds
and can impact performance by altering the pond’s
hydraulics due to a decrease in the pond’s effective
volume and changes the shape of the bottom surface [1].
Therefore, periodic sludge removal is usually required
and the long-term sustainability of WSP systems is
dependent on the safe and effective management of their
sludge.
Despite the inevitable accumulation of sludge in
primary ponds, sludge management is rarely considered
as an integral part of pond design. One reason for the
lack of attention given to sludge is that little information
is available on the accumulation rates, the distribution
of sludge within the ponds, and the characteristics of the
sludge itself. The accumulation rate of sludge must be
known so that the frequency of sludge removal can be
determined and integrated into the pond design,
maintenance schedule, and budget. Currently, the most
common method for estimating sludge accumulation is
the empirically determined volumetric, per capita
accumulation rate [2–4]. However, the rates currently
recommended for design have not been widely validated,
and are believed to depend on temperature, among other
factors. Thus, more regional data are needed to
determine reasonable values for the per capita accumu-
lation rate until models based on pond characteristics
are fully developed [5–7].
In addition to knowing the rate of sludge accumula-
tion, it is necessary to know how the sludge is distributed
in a pond. The sludge distribution can have a significant
impact on the pond’s hydraulics (and consequently the
treatment efficiency), the frequency of sludge removal,
and the feasible options for sludge removal. The
distribution of sludge is primarily a function of the
pond configuration [8]. A better understanding of the
sludge distribution in ponds could lead to improvements
in design to achieve optimal distribution of the sludge.
More information is also needed on the characteristics
of the sludge itself. The sludge volume and character-
istics change with time due to anaerobic degradation,
compression, and pathogen inactivation; however, little
information has been published about the rates of these
processes and the typical characteristics of WSP sludge.
Data on the concentrations of pathogens in the sludge
layer are needed to estimate the risk that pathogens pose
upon removal of the sludge. Information on how the
sludge characteristics vary throughout the sludge layer is
also needed so that improved models of sludge
accumulation as well as sampling protocols for mon-
itoring programs can be developed.
The research reported herein was conducted in
Mexico, where WSPs are the most common type of
wastewater treatment and over 400 systems have been
built, most of them since 1980 [9]. To date, however, no
studies have been reported on the accumulation rates
and characteristics of sludge in Mexican ponds.
Furthermore, the removal of sludge has been under-
taken in only a few of the ponds, thus, information is
needed to support the development of a sludge manage-
ment plan and to prevent pond failures [10,11].
The goal of this research was to gather more
information on the sludge layer in WSPs to inform
improvements in pond design and support the develop-
ment of safe, effective sludge management practices. The
specific objectives were to:
1. Measure the accumulation rate and distribution of
sludge in four Mexican WSPs.
2. Evaluate the physical, chemical, and microbiological
characteristics of the sludge and their horizontal and
vertical variation within the sludge layer, including
characterization of compression, anaerobic degrada-
tion, and pathogen inactivation.
2. Experimental design and methods
Four primary WSPs located in the central highland
region of Mexico (B2500 m) were selected for this
research (Table 1). Pond depth and the thickness of the
sludge layer were measured in all ponds to determine the
sludge distribution and average accumulation rate.
Sludge cores were extracted from three of the ponds
(excluding San Jose de los Laureles); each core was
divided into four stratified sub-samples and various
physical, chemical, and microbiological parameters were
measured. In addition, a batch of sludge from one of the
ponds was stored in the laboratory for 7 months and the
concentration of pathogen indicator organisms was
measured periodically to gather more detailed data on
their rates of inactivation. The methods used to collect
field samples and the parameters measured are described
below.
2.1. Characteristics of field sites
The general characteristics of the anaerobic pond and
the three facultative ponds are presented in Table 1. The
pond in Texcoco treated wastewater from Mexico City,
whereas the other three ponds treated wastewater from
small communities. The degree of pretreatment varied
among the four pond systems. In both Mexicaltzingo
and San Jose de los Laureles, the wastewater passed
through a biodigester, in which some suspended solids
were removed by sedimentation, before entering into the
primary pond. In Texcoco, although the only formal
pretreatment was a bar screen and grit chamber, the
sewer canal that transported wastewater to the pond had
an insufficient slope to prevent settling, thus, significant
sedimentation of suspended solids occurred before the
wastewater was introduced to the primary pond. In
Xalostoc, the only pretreatment was a bar screen and
ARTICLE IN PRESS
Table 1
Characteristics of the four WSPs
Locationa Population Pond
type
Pretreatment Operation
period
(yr)
Qb,
Mgal/d
(L/s)
Surface
areab,
acres (ha)
Pond
depth,
ft (m)
Design
HRTc,
(d)
Average air temperature, �F (�C)d
Annual Coldest
month
Warmest
month
Mexicaltzingo, 7280 Primary Biodigester 5 0.34 0.14 8.9 2.5 54 49 58
Mexico anaerobic (15) (0.06) (2.72) (12.2) (9.4) (14.4)
San Jose de 800 Primary Biodigester 6 0.023 0.13 5.4 24 70 64 75
los Laureles, Facultative (1) (0.05) (1.64) (21.1) (19.1) (23.6)
Morelos
Texcoco, NAe Primary Settling in 10 2.15 6.0 5.1 10.6 60 55 65
Mexico Facultative sewer (94) (2.4) (1.56) (15.6) (12.9) (18.1)
Xalostoc, 11,000 Primary Grit 15 0.15 1.2 7.8 47 62 57 65
Tlaxcala Facultative chamber (6.4) (0.5) (2.39) (16.4) (13.9) (18.4)
aMunicipality, State.bFlow and area are only for the primary pond studied in this research (some systems had more than one primary pond operating in
parallel).cHRT=hydraulic residence time=Q/V, where V accounts for the wall slope and is therefore less than the volume calculated directly
from the values of surface area and pond depth shown in the table.dData are mean temperatures, 1951–1980, for the capital city of each state. Source: ‘‘Temperatura media mensual 1951–1980’’,
Servicio Meterol !ogico Nacional, Mexico.eNA=Not available. Because the wastewater treated in Texcoco is diverted from a large trunk sewer the population served is not
known.
K.L. Nelson et al. / Water Research 38 (2004) 111–127 113
grit chamber. At the time of sampling, all four ponds
had been in continuous operation for at least 5 years.
2.2. Measurement of pond depth and thickness of sludge
layer
Pond depth and sludge thickness were measured at
between 8 and 40 points in each pond with a sludge
measuring optical gauge (SMOG, Orenco Systems Inc.,
Sutherlin, OR, USA). The apparatus consisted of a
graduated pole with a detection unit at the end on which
a light source and light sensor were fixed 1 in apart. An
indicator light connected to the light source was on
when the detection unit was in the water column and
turned off when it entered into the sludge layer.
In San Jose and Xalostoc, a rectangular grid was
established around the perimeter of the ponds with
flagged stakes and each sampling point was located by
sighting off the flags. The Texcoco pond was too large to
locate the sampling points by visual sighting, so a
Global Positioning System (Garmin, Olathe, KS, USA)
was used. The sludge thickness data reported for the
Mexicaltzingo pond were obtained by another research
group using the white towel test [12].
Three-dimensional surface profiles of the sludge
distribution in each pond were created with a surface
mapping program (Surfer Version 7.00, Golden Soft-
ware, Inc., Golden, Co.). Grid files were generated from
each data set by the point kriging method using exact
interpolation (no smoothing). The bottom surface was
inferred from variations in the water depth. Surfer was
also used to calculate the total sludge and water volumes
for each pond by interpolating the sludge surface using
Simpson’s 3/8 rule and integrating. The volumes were
then corrected for irregular pond geometry (non-
rectangular) and for wall slope. Apparent sludge
accumulation rates (mm/yr) were calculated for each
pond by dividing the total sludge volume by the pond’s
bottom area and the number of years of operation.
2.3. Development of pneumatic apparatus for collecting
sludge cores
Sludge cores were collected from a rowboat at three to
seven locations in each pond, including near the
entrance, middle, and exit (Fig. 1). A sludge coring
apparatus was developed specifically for this research
because commercially available coring devices were
found to be inadequate. Typically, coring devices used
to sample lake, river, and ocean sediments have a
sediment catch that is forced open as the column is
pushed through the sediment. The pond sludge, how-
ever, was not dense enough to force open the sediment
catch without causing significant vertical disturbance of
the sludge layers. Also, such corers are primarily
designed to retain sediment and do not completely seal
at the bottom after the core is collected, allowing liquid
to drain out by gravity. Because the parameters
ARTICLE IN PRESS
(a)
(b)
(c)
(d)
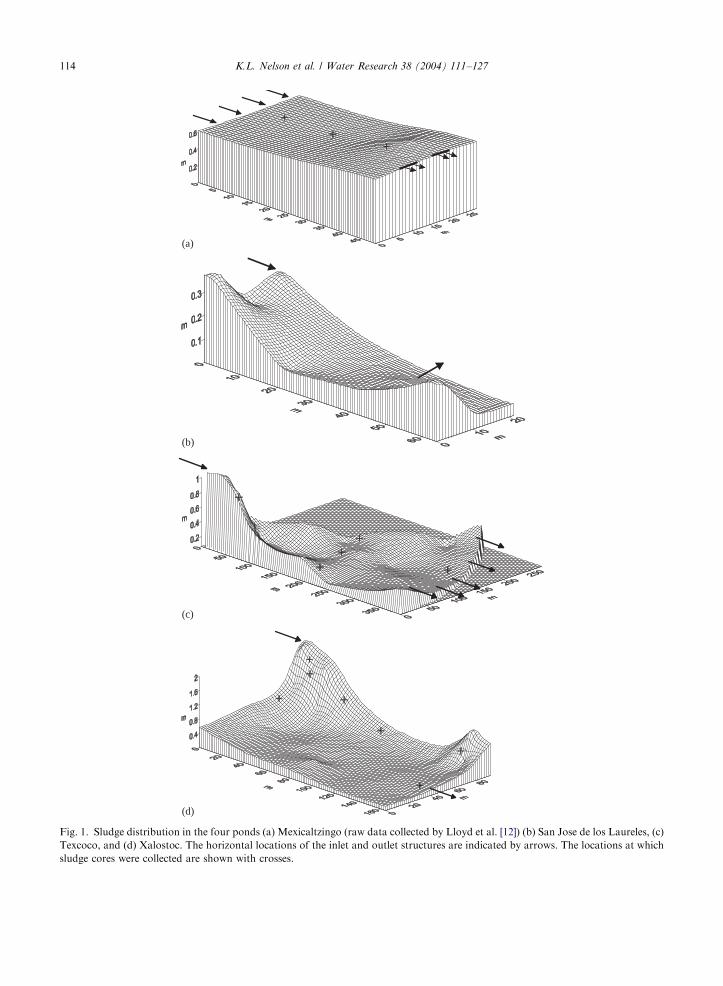
Fig. 1. Sludge distribution in the four ponds (a) Mexicaltzingo (raw data collected by Lloyd et al. [12]) (b) San Jose de los Laureles, (c)
Texcoco, and (d) Xalostoc. The horizontal locations of the inlet and outlet structures are indicated by arrows. The locations at which
sludge cores were collected are shown with crosses.
K.L. Nelson et al. / Water Research 38 (2004) 111–127114
ARTICLE IN PRESS
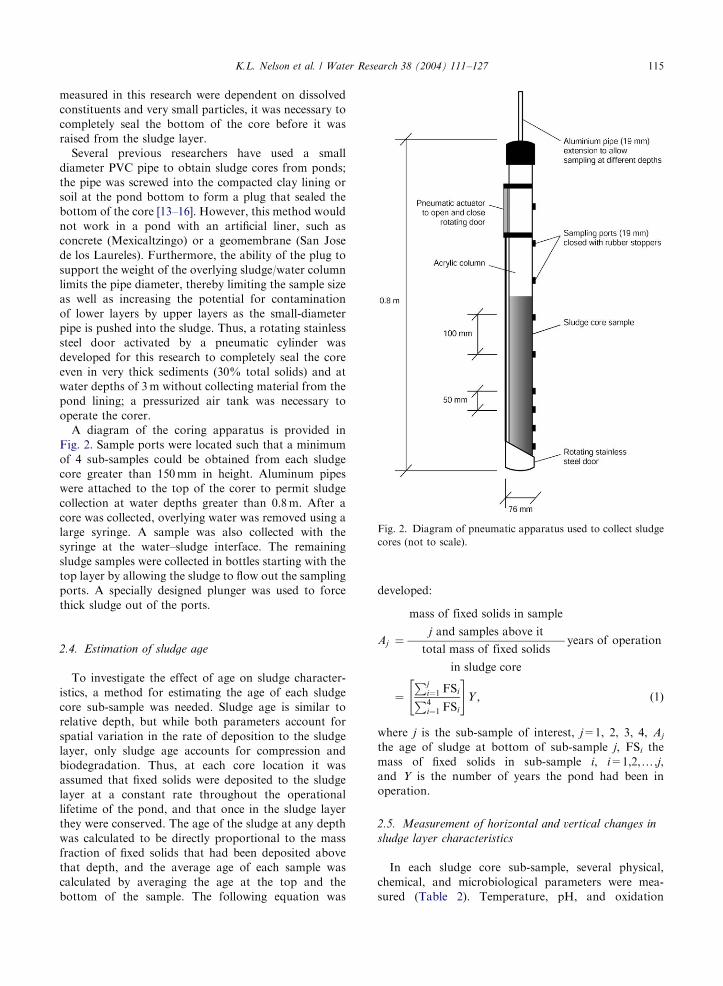
Fig. 2. Diagram of pneumatic apparatus used to collect sludge
cores (not to scale).
K.L. Nelson et al. / Water Research 38 (2004) 111–127 115
measured in this research were dependent on dissolved
constituents and very small particles, it was necessary to
completely seal the bottom of the core before it was
raised from the sludge layer.
Several previous researchers have used a small
diameter PVC pipe to obtain sludge cores from ponds;
the pipe was screwed into the compacted clay lining or
soil at the pond bottom to form a plug that sealed the
bottom of the core [13–16]. However, this method would
not work in a pond with an artificial liner, such as
concrete (Mexicaltzingo) or a geomembrane (San Jose
de los Laureles). Furthermore, the ability of the plug to
support the weight of the overlying sludge/water column
limits the pipe diameter, thereby limiting the sample size
as well as increasing the potential for contamination
of lower layers by upper layers as the small-diameter
pipe is pushed into the sludge. Thus, a rotating stainless
steel door activated by a pneumatic cylinder was
developed for this research to completely seal the core
even in very thick sediments (30% total solids) and at
water depths of 3 m without collecting material from the
pond lining; a pressurized air tank was necessary to
operate the corer.
A diagram of the coring apparatus is provided in
Fig. 2. Sample ports were located such that a minimum
of 4 sub-samples could be obtained from each sludge
core greater than 150 mm in height. Aluminum pipes
were attached to the top of the corer to permit sludge
collection at water depths greater than 0.8m. After a
core was collected, overlying water was removed using a
large syringe. A sample was also collected with the
syringe at the water–sludge interface. The remaining
sludge samples were collected in bottles starting with the
top layer by allowing the sludge to flow out the sampling
ports. A specially designed plunger was used to force
thick sludge out of the ports.
2.4. Estimation of sludge age
To investigate the effect of age on sludge character-
istics, a method for estimating the age of each sludge
core sub-sample was needed. Sludge age is similar to
relative depth, but while both parameters account for
spatial variation in the rate of deposition to the sludge
layer, only sludge age accounts for compression and
biodegradation. Thus, at each core location it was
assumed that fixed solids were deposited to the sludge
layer at a constant rate throughout the operational
lifetime of the pond, and that once in the sludge layer
they were conserved. The age of the sludge at any depth
was calculated to be directly proportional to the mass
fraction of fixed solids that had been deposited above
that depth, and the average age of each sample was
calculated by averaging the age at the top and the
bottom of the sample. The following equation was
developed:
Aj ¼
mass of fixed solids in sample
j and samples above it
total mass of fixed solids
in sludge core
years of operation
¼Pj
i¼1 FSiP4i¼1 FSi
" #Y ; ð1Þ
where j is the sub-sample of interest, j=1, 2, 3, 4, Aj
the age of sludge at bottom of sub-sample j, FSi the
mass of fixed solids in sub-sample i, i=1,2,y,j,
and Y is the number of years the pond had been in
operation.
2.5. Measurement of horizontal and vertical changes in
sludge layer characteristics
In each sludge core sub-sample, several physical,
chemical, and microbiological parameters were mea-
sured (Table 2). Temperature, pH, and oxidation
ARTICLE IN PRESS
Table 2
Description of the parameters measured and the methods used in the sub-samples from the sludge cores
Parameter Methoda Ponds sampled
Temperature Temperature probe Mexicaltzingo,
pH pH electrode Texcoco, and
Oxidation reduction potential (ORP) Platinum ORP electrode Xalostoc
Total solids (TS) Gravimetric (2540 Gb) ‘‘
Volatile solids (VS) ‘‘ ‘‘
Fixed solids (FS) ‘‘ ‘‘
VS/FS ‘‘ ‘‘
Helminth eggs US EPA, [17] ‘‘
Fecal coliform Multiple tube fermentation, direct method (9221 E.2) ‘‘
Fecal enterococci Spread plate (9215 C) with mEnterococcus agar (9230 C.2.c) Xalostoc only
Somatic coliphage Double agar layer [18], naldixic acid resistant E.coli CN 13 ‘‘
F+ coliphage Double agar layer [18], streptomycin/ampicillin—resistant E. coli Famp ‘‘
aNumbers in parenthesis refer to Standard Methods [19].bA 50-mL syringe with the tip cut off was used to measure the initial sample volume to allow measurement of the solids’
concentrations on a weight per volume (w/v) as well as a weight per weight (w/w) basis.
K.L. Nelson et al. / Water Research 38 (2004) 111–127116
reduction potential (ORP) were measured immediately
after extrusion from the core. Then, the samples were
transported in a cooler to the laboratory and stored at
4�C. Total, volatile, and fixed solids, as well as all
microbiological analyses, except helminth eggs, were
performed on well-homogenized samples within 24 h of
sample collection. Determination of helminth eggs was
performed within one week of sample collection in most
cases; no significant change in the viability of the eggs
was expected during this time because the eggs can
survive for years at low temperatures [20]. Care was
taken during enumeration of the helminth eggs to
minimize exposure to diethyl ether [21].
Fecal coliform bacteria and helminth eggs were
enumerated in all sludge core samples. In the Xalostoc
pond, three additional indicator organisms were mea-
sured—fecal enterococci, somatic coliphage, and F+
coliphage. For analysis of fecal coliform bacteria and
fecal enterococci, the first dilution consisted of blending
10 g of sample with 90 mL of buffered dilution water
(9050C 1a [19] at high speed for 1min. For enumeration
of somatic and F+ coliphages, the host bacterial strains
were E. coli CN13 (resistant to naldixic acid) and E. coli
Famp (resistant to streptomycin and ampicillin), respec-
tively (obtained from Dr. Mark Sobsey, Dept. of
Environmental Science and Engineering, University of
North Carolina). To prepare samples for coliphage
analysis, an initial elution was performed by vigorously
mixing 5 g of sample with 5mL of 0.1% Tween 80 for
1min in a 50-mL centrifuge tube. The sample was
left to sit for 10min and mixed again for 1min.Then,
5mL of chloroform was added, the sample was mixed
vigorously for 3min, and centrifuged for 20 min at
2000� g. Serial dilutions were prepared from the
supernatant.
2.6. Measurement of indicator organism inactivation in
batch test
Approximately 3 L of sludge was removed from the
surface of the sludge layer near the inlet of the Xalostoc
pond. The sludge was stored in the laboratory at
ambient temperature in a 4L container; the lid was
closed, but not sealed, to allow gas to escape.
Concentrations of fecal coliform bacteria, fecal enter-
ococci, somatic coliphage, and F+ coliphage were
measured periodically for 7 months. The enumeration
methods were the same as those used for the sludge
cores. Over the duration of the batch experiment, the
temperature in the sludge ranged from 11�C to 16�C,
which was similar to the range of temperatures
measured in the Xalostoc sludge layer.
3. Results and discussion
3.1. Sludge distribution and rate of accumulation
In all three facultative ponds, the distribution of
sludge was very uneven (Figs. 1b–d), whereas in the
anaerobic pond it was fairly uniform (Fig. 1a). In the
facultative ponds, the maximum sludge thickness
occurred near the single pond inlet; higher accumulation
also occurred in some of the corners. In the anaerobic
pond, the more even sludge distribution was attributed
to two factors. First, instead of one inlet the pond had
five, so the incoming solids were distributed over a larger
surface area. Second, the hydraulic residence time
(HRT) was much shorter (2 d compared with more than
11 d), thus, the overflow rate in the pond was much
ARTICLE IN PRESSK.L. Nelson et al. / Water Research 38 (2004) 111–127 117
higher and solids were carried further into the pond
before settling to the bottom.
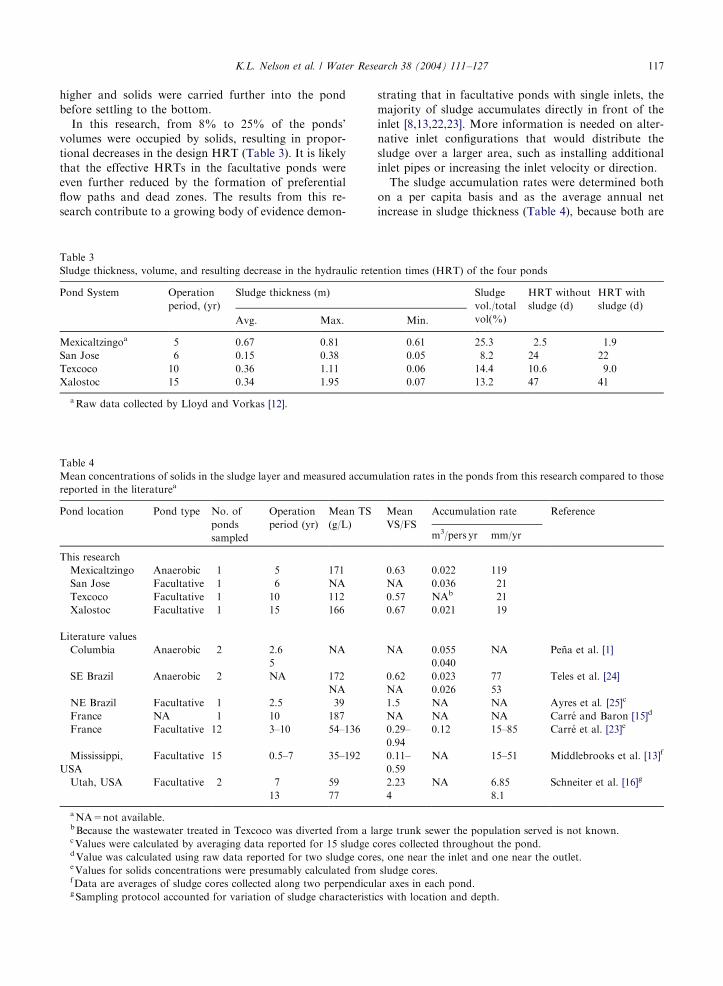
In this research, from 8% to 25% of the ponds’
volumes were occupied by solids, resulting in propor-
tional decreases in the design HRT (Table 3). It is likely
that the effective HRTs in the facultative ponds were
even further reduced by the formation of preferential
flow paths and dead zones. The results from this re-
search contribute to a growing body of evidence demon-
Table 3
Sludge thickness, volume, and resulting decrease in the hydraulic rete
Pond System Operation
period, (yr)
Sludge thickness (m)
Avg. Max.
Mexicaltzingoa 5 0.67 0.81
San Jose 6 0.15 0.38
Texcoco 10 0.36 1.11
Xalostoc 15 0.34 1.95
aRaw data collected by Lloyd and Vorkas [12].
Table 4
Mean concentrations of solids in the sludge layer and measured accum
reported in the literaturea
Pond location Pond type No. of
ponds
sampled
Operation
period (yr)
Mean TS
(g/L)
This research
Mexicaltzingo Anaerobic 1 5 171
San Jose Facultative 1 6 NA
Texcoco Facultative 1 10 112
Xalostoc Facultative 1 15 166
Literature values
Columbia Anaerobic 2 2.6 NA
5
SE Brazil Anaerobic 2 NA 172
NA
NE Brazil Facultative 1 2.5 39
France NA 1 10 187
France Facultative 12 3–10 54–136
Mississippi,
USA
Facultative 15 0.5–7 35–192
Utah, USA Facultative 2 7 59
13 77
aNA=not available.bBecause the wastewater treated in Texcoco was diverted from a lacValues were calculated by averaging data reported for 15 sludge cdValue was calculated using raw data reported for two sludge coreeValues for solids concentrations were presumably calculated fromfData are averages of sludge cores collected along two perpendicugSampling protocol accounted for variation of sludge characteristi
strating that in facultative ponds with single inlets, the
majority of sludge accumulates directly in front of the
inlet [8,13,22,23]. More information is needed on alter-
native inlet configurations that would distribute the
sludge over a larger area, such as installing additional
inlet pipes or increasing the inlet velocity or direction.
The sludge accumulation rates were determined both
on a per capita basis and as the average annual net
increase in sludge thickness (Table 4), because both are
ntion times (HRT) of the four ponds
Sludge
vol./total
vol(%)
HRT without
sludge (d)
HRT with
sludge (d)
Min.
0.61 25.3 2.5 1.9
0.05 8.2 24 22
0.06 14.4 10.6 9.0
0.07 13.2 47 41
ulation rates in the ponds from this research compared to those
Mean
VS/FS
Accumulation rate Reference
m3/pers yr mm/yr
0.63 0.022 119
NA 0.036 21
0.57 NAb 21
0.67 0.021 19
NA 0.055 NA Pena et al. [1]
0.040
0.62 0.023 77 Teles et al. [24]
NA 0.026 53
1.5 NA NA Ayres et al. [25]c
NA NA NA Carr!e and Baron [15]d
0.29–
0.94
0.12 15–85 Carr!e et al. [23]e
0.11–
0.59
NA 15–51 Middlebrooks et al. [13]f
2.23 NA 6.85 Schneiter et al. [16]g
4 8.1
rge trunk sewer the population served is not known.
ores collected throughout the pond.
s, one near the inlet and one near the outlet.
sludge cores.
lar axes in each pond.
cs with location and depth.
ARTICLE IN PRESS
0
0.2
0.4
0.6
0.8
1
0 0.2 0.4 0.6 0.8 1
MexicaltzingoTexcocoXalostoc
Rel
ativ
e de
pth
Relative age
Fig. 3. Relationship between relative depth in the sludge layer
and relative sludge age in the three ponds.
K.L. Nelson et al. / Water Research 38 (2004) 111–127118
used in design. The average, per capita accumulation
rates ranged from 0.021 to 0.036m3/person/yr in the
Mexican ponds; these rates are similar to values that
have been measured in Columbia and Brazil but are
significantly lower than rates measured in France. The
higher accumulation rates in France may be partly due
to colder temperatures, although this cannot be con-
firmed because the locations and temperatures of the
French ponds were not reported. Other factors affecting
the per capita sludge accumulation rate may include
sewer inputs by industry, stormwater, and infiltration.
Although published values determined from field data
are few, a value of 0.04 m3/person/yr is often recom-
mended for designing anaerobic ponds with average
temperatures above 20�C [2,3,26,27]. It is concluded
from the results of this research that 0.04m3/person/yr is
a reasonable estimate of the average rate of sludge
accumulation in both facultative and anaerobic ponds in
the central region of Mexico, even in regions with
average temperatures well below 20�C. Additional field
data on accumulation rates are needed from different
regions and pond types.
In contrast to the per capita rate of sludge accumula-
tion, the measured average annual increase in sludge
thickness varied widely, both in the ponds from this
research (19–119 mm/yr) and among values reported in
the literature (7–85mm/yr) (Table 4). This variation is
expected because the depth accumulation is strongly
affected by the pond loading rate and treatment
efficiency and is thus specific to each pond. For example,
although the per capita accumulation rates were similar
in the Mexicaltzingo and Xalostoc ponds, the thickness
of the sludge layer increased over five times faster in
Mexicaltzingo because the detention time was much
shorter.
3.2. Horizontal and vertical variation of sludge
characteristics
The horizontal variation of sludge characteristics was
studied by comparing the average values of each
parameter in sludge cores collected near the inlet,
middle, and outlet of each pond. For studying the
vertical variation, the appropriate independent variable
was either depth within the sludge layer or sludge age,
depending on the parameter. The total solids concentra-
tion was found to be dependent on the depth within the
sludge layer, whereas the remaining parameters were
either dependent on the sludge age or constant
throughout the sludge layer.
3.2.1. Estimation of sludge age
The relationship between depth in the sludge layer
and the estimated sludge age (Eq. (1)) is shown in Fig. 3.
To account for differences in the operation periods and
the thickness of the sludge layer, the normalized values
are plotted. If the sludge depth had increased by the
same amount each year, then the relationship would be a
straight line with a slope of one. However, as shown in
the figure, the newer sludge occupied more volume than
the older sludge. The figure can also be interpreted as
showing the increase in sludge depth with time; the slope
then represents the relative accumulation rate, which
decreases with time.
Potential sources of error in estimating the sludge age
include changes in the concentration of fixed solids in
the influent wastewater, production rate of algae and
bacteria, hydraulic flow pattern, sludge settling zones,
and resuspension or lateral movement of sludge over the
operational lifetime of the pond. Also, the production of
fixed solids through new cell growth in the sludge layer
was not accounted for. Historical data were not
available for any of the ponds, but according to
interviews with plant operators and municipal autho-
rities, no major changes occurred in any of the sewer
networks that fed the ponds since operation was
initiated, nor were there periods when the ponds were
non-operational.
3.2.2. Total solids concentration
The total solids (TS) concentration was found to be
correlated with depth in the sludge layer (R2=0.84),
with values increasing from around 3 g/L at the sludge/
water interface to over 300 g/L in the deepest sludge
(Fig. 4a). It is a significant finding that the compression
of sludge solids appeared similar throughout all three
ponds. Furthermore, no relationship was found between
TS and variables describing the qualitative character-
istics of the sludge, such as age or VS/FS ratio. The
resulting regression equation can be used to estimate the
ARTICLE IN PRESS
0
50
100
150
200
250
300
350
MexicaltzingoTexcocoXalostoc
TS
, g/L
TS, g/L = 417(Depth, m)0.57
0
5
10
15
20
25
0 0.1 0.2 0.3 0.4 0.5 0.6 0.7
Tem
pera
ture
, °C
Inlet Middle OutletDepth in sludge layer, m Location in pond
(a) (b)
(c) (d)
Fig. 4. Profiles of the total solids concentration (a and b) and temperature (c and d) as a function of depth in the sludge layer and
distance from the pond inlet. In (a), the data points represent individual sub-samples from the sludge cores, whereas average values are
reported in (b), (c), and (d).
K.L. Nelson et al. / Water Research 38 (2004) 111–127 119
solids concentration of the sludge if the thickness of the
sludge layer is known. This information is needed to
develop more accurate methods for estimating the rate
of sludge accumulation, because the volume (and
therefore depth) occupied by a given mass of sludge is
a function of the TS concentration (which is an
approximate measure of the sludge density). Knowing
the TS concentration may also help to determine the
most appropriate method of sludge removal.
In the facultative ponds, the concentration of total
solids (TS) decreased towards the pond outlet, whereas
the concentration in the anaerobic pond was similar
throughout (Fig. 4b). The higher TS concentration near
the inlet in the facultative ponds is primarily a reflection
of the greater thickness of the sludge layer, which causes
more compression, but may also be affected by a higher
fraction of higher density silts and sand that settle out
near the inlet. The mean TS concentrations in the ponds
from this research are reported in Table 4, and fall
within the upper limit of values that have been reported
in the literature. In general, the low TS values that have
been reported occurred in sludge with a high concentra-
tion of volatile solids (high VS/FS ratio).
3.2.3. Temperature
At the time the ponds were sampled, the temperature
was fairly constant throughout the sludge layer (Figs. 4c
and d), although it was usually significantly different
from the temperature in the overlying water layer and
the air temperature (not shown). Over the course of one
sampling day, the water temperature often varied more
than 5�C while the temperature of the sludge layer
remained constant. The average air temperatures during
the months that the ponds were sampled were 10.8�C,
14.8�C, and 18.3�C in the Mexicaltzingo, Texcoco, and
Xalostoc regions, respectively. There was much less
variation in the average temperatures in the sludge layer
of the ponds, which were 16.3�C, 16.7�C, and 17.9�C,
respectively. The buffering of the sludge temperature can
be explained because the rate of heat transfer depends
on the degree of mixing, which is expected to be lower in
the sludge than in the water or air. It is important to
point out that the similarity in average sludge tempera-
tures in the three ponds at the time of sampling was
coincidental, and does not indicate that the sludge
temperatures were similar at other times of the year. The
Xalostoc pond, for example, was sampled again 3
months after the initial sampling and the sludge
temperature had dropped to 14.3�C (the average air
temperature dropped to 14.1�C). More research is
needed on the fluctuations of temperature in the sludge
layer so that the implications on temperature-dependent
microbial processes, such as anaerobic degradation and
pathogen inactivation, can be defined.
ARTICLE IN PRESSK.L. Nelson et al. / Water Research 38 (2004) 111–127120
3.2.4. Anaerobic degradation (VS/FS, pH, and ORP)
The ratio of volatile to fixed solids (VS/FS) was used
as an approximate measure of the fraction of organic to
inorganic matter in the WSP sludge. The decrease in the
VS/FS ratio with sludge age was similar in all three
ponds, and the slope of the line was interpreted as the
rate of anaerobic degradation (Fig. 5a). The initial
degradation rate was several orders of magnitude
greater than the long-term degradation rate, parti-
cularly in cores with a high initial VS/FS ratio
(individual core data not shown). It is believed that the
decrease in degradation rate occurred as the rapid
degradation of easily hydrolyzable organic matter
was replaced by the continual, slow degradation of
recalcitrant organic matter that required considerable
0
0.25
0.5
0.75
1
1.25
MexicaltzingoTexcocoXalostoc
VS
/FS
5
6
7
8
9
pH
-200
-150
-100
-50
0
50
0 2 4 6 8 10 12 14
OR
P, m
V
Estimated sludge age, yrs
(a)
(c)
(e)
Fig. 5. Profiles of the volatile to fixed solids ratio (a and b), pH (c and
sludge age and distance from the pond inlet.
processing before it could be hydrolyzed and
degraded by anaerobic bacteria. This trend has been
identified previously, although not quantitatively
[15,28,29].
Within the first year, about 30% of the VS was
degraded in the facultative ponds and about 25% in the
anaerobic pond, on average, although these figures may
be underestimated because it was difficult to make an
accurate measure of the initial VS/FS ratio. Better
methods for collecting fresh sludge are needed so that
the decrease in VS during the first few weeks after
deposition can be quantified [29].
The long-term, first-order inactivation rate constants
(after the first year) were determined from the slope of
the linear regression fitted to the log-transformed VS/FS
Inlet Middle Outlet
Location in pond
(b)
(d)
(f)
d), and oxidation reduction potential (e and f) as a function of
ARTICLE IN PRESSK.L. Nelson et al. / Water Research 38 (2004) 111–127 121
data, discarding the initial measurement. The values
were 0.122, 0.061, and 0.042 yr�1 in the Mexicaltzingo,
Texcoco, and Xalostoc sludge, respectively. These values
are believed to be the first reported on the long-term
degradation rates in WSP sludge, and are useful for
estimating the reduction in sludge mass with long-term
storage in the pond. In all three ponds the VS/FS ratio
in the oldest sludge was approximately 0.5, suggesting
that some organic matter may not degrade for many
years, if ever.
In all of the ponds, the VS/FS ratio increased towards
the outlet (Fig. 5b). A possible explanation is that the
denser, inorganic solids settled closer to the inlet,
whereas the lighter, organic solids settled out near the
outlet (predominately bacteria and algae in the faculta-
tive ponds). A similar increase in the VS/FS ratio
towards the outlet was observed in a primary facultative
WSP in northeast Brazil [25]. The mean VS/FS ratio in
the ponds from this research is reported in Table 4; the
values are also compared to others reported in the
literature.
The pH was constant throughout the sludge layer in
all three ponds, with average values between 6.8 and 6.9
(Figs. 5c and d). The neutral pH suggests that
methanogenesis was occurring, otherwise a build-up of
fatty acids, the products of acidogenesis, would even-
tually overcome the buffer capacity of the sludge and
cause the pH to drop. The transport of fatty acids to the
overlying water column may also help to maintain stable
conditions in the sludge layer.
Although the neutral pH measured throughout the
sludge layer suggests that methanogenesis was occur-
ring, the oxidation reduction potentials (ORP) measured
in the sludge layer suggested the dominance of sulfate-
reducing reactions (Fig. 5e). However, ORP was
measured in the sludge samples after extrusion from
the sludge corer, thus, it is possible that the measured
values were higher than the actual values due to oxygen
exposure upon sampling. In addition, the 2-mm
platinum electrode may have been too large to detect
microsites in which methanogenesis occurred. In future
studies, it is suggested that ORP be measured directly in
the undisturbed sludge layer, with a smaller electrode.
The values measured in this research are higher than
those reported by Carr!e et al. [15] for pond sludge in
France, in which minimum values of –300 mV were
found. In both of the facultative ponds the ORP was
positive in the overlying water, as expected, and dropped
sharply at the surface of the sludge layer. In contrast, in
the anaerobic pond the ORP in the overlying water was
similar to the ORP at the surface of the sludge layer. No
significant change in oxidation reduction potential
(ORP) was observed in the facultative ponds from the
inlet to the outlet (Fig. 5f); no comparison could be
made in the anaerobic pond because measurements were
taken at only one location.
3.2.5. Helminth eggs
The concentration of total helminth eggs was constant
with sludge age in Xalostoc, but increased with age in
Mexicaltzingo and decreased in Texcoco (Fig. 6a).
Apparently, fewer eggs were deposited in the sludge
layer during recent years in Mexicaltzingo. In Texcoco,
on the other hand, the most likely explanation for the
observed trend is that eggs were physically destroyed in
the aging sludge because the percentage of total eggs
that were viable actually increased with sludge age,
whereas in the other two ponds it decreased (Fig. 6c).
One reason that eggs could have been destroyed in
Texcoco and not in the other two ponds is that the
Texcoco pond treated wastewater from Mexico City,
whereas the other two ponds treated wastewater from
small communities. Thus, compounds could have been
present in the Texcoco sludge, such as from industrial
discharges, that caused a destruction of the eggs; the
high salinity of the Texcoco wastewater may also have
affected the eggs.
The concentration of helminth eggs decreased
dramatically towards the outlet of the facultative
ponds, but was similar throughout the anaerobic pond
(Fig. 6b). This pattern reflects the settling conditions
in the ponds; the concentration of helminth eggs
follows approximately the distribution of sludge. The
percentage of viable helminth eggs also decreased
significantly towards the outlet in the facultative
ponds; the reported values are for the sub-samples
from the top of the cores (Fig. 6d). A similar pattern
was observed in a primary pond in northeast Brazil [30].
One reason for this trend could be that non-viable
eggs have a lower density than viable eggs and there-
fore take longer to settle out (the density was not
measured, however, in this research). Another reason
could be that older, inactivated eggs were resuspended
and a net movement of sludge toward the outlet
occurred.
More than 85% of the helminth eggs isolated from the
sludge were Ascaris sp.; the remaining eggs were
Trichuris, Hymenolepis, and Toxocara. sp. (Table 5).
The species distribution is a function of the prevalence
of infection in the community, as well as the settling
patterns in the pond. Only the inactivation rate of
Ascaris is considered here, because the eggs of Ascaris
were more resistant than those of Trichuris and
Toxocara (data not shown), and because the viability
of Hymenolepis could not be determined by the method
used. To measure the inactivation rate, it was assumed
that no transport of eggs occurred within the sludge
layer. A change in the concentration of viable Ascaris
eggs per gram fixed solids was chosen as the most
accurate measure of inactivation; basing the concentra-
tion on fixed rather than total solids eliminated any bias
introduced by degradation of the sludge. Although it
was expected that the inactivation rate varied with
ARTICLE IN PRESS
0
100
200
300
400
500
600
MexicaltzingoTexcocoXalostoc
Tot
al h
elm
inth
egg
s, #
/g F
S
0
20
40
60
80
100
Via
ble
helm
inth
egg
s, %
10-1
100
101
102
103
Via
ble
Asc
aris
egg
s, #
/g F
S
100
101
102
103
104
105
106
107
108
0 2 4 6 8 10 12 14
Fec
al c
olifo
rm b
acte
ria, M
PN
/g T
S
Estimated sludge age, yrs
Inlet Middle Outlet
Location in pond
(a) (b)
(c) (d)
(e) (f)
(g) (h)
Fig. 6. Profiles of the concentration of total helminth eggs (a and b), percentage of viable helminth eggs (c and d), concentration of
viable Ascaris eggs (e and f), and concentration of fecal coliform bacteria (g and h) as a function of sludge age and distance from the
pond inlet.
K.L. Nelson et al. / Water Research 38 (2004) 111–127122
location in the pond, with seasonal changes in tempera-
ture, and with the concentration of acids, ammonia, and
predatory microorganisms in the sludge layer [31], the
goal of this analysis was to determine a rough estimate
of the average inactivation rate constant throughout the
whole pond and over its entire lifetime.
ARTICLE IN PRESS
Table 5
Species composition (%) of helminth eggs in the sludge layer of
the three ponds
Pond Ascaris Trichuris Hymenolepis Toxocara
Mexicaltzingo 93.5 3.5 0.2 2.8
Texcoco 85.3 13 1.7 0.4
Xalostoc 87.4 2.2 9.8 0.6
Average 88.7 5.4 4.5 1.3
Table 6
First-order rate constants for the inactivation of Ascaris eggs
and indicator organisms. The values for the indicator organisms
were determined by two methods—sludge cores and a batch test
Organism k (d�1)
Sludge cores Batch test
Ascaris eggs
Mexicaltzingo 0.0009
Texcoco 0.0007
Xalostoc 0.0010
Indicator organisms (Xalostoc)
Somatic coliphage 0.0016 0.0074
F+coliphage 0.016 0.037
Fecal coliform 0.13 0.16
Fecal enterococci 0.26 0.20
K.L. Nelson et al. / Water Research 38 (2004) 111–127 123
The inactivation rate constants were determined
from the slope of the linear regression fitted to the
log-transformed concentration of viable Ascaris eggs
(Fig. 6e). The values for all three ponds were similar,
ranging from 0.0007 to 0.001 d�1 (Table 6). It is
concluded that a first-order rate constant of 0.001 d�1
is reasonable for estimating the average inactivation of
Ascaris eggs in the sludge layer of WSPs in central
Mexico. In a study reported separately, a similar mean
inactivation rate was measured in dialysis chambers
loaded with Ascaris eggs and stored in the Texcoco
sludge layer for 14 months [32]. These values are the first
known report of Ascaris egg inactivation rates in WSP
sludge.
3.2.6. Indicator organisms
In contrast to the helminth eggs (Fig. 6b), there was
no clear trend in the concentration of fecal coliform
bacteria (Fig. 6h) and the other indicator organisms
(data not shown) from the inlet to the outlet. However,
in all three ponds the concentration of fecal coliform
bacteria decreased with sludge age (Fig. 6g) and the
pattern was similar for somatic coliphage,1 F+coliph-
age, and fecal enterococci, although the rate of decrease
varied for the different organisms (Fig. 7a).
The inactivation rates of the four indicators were
determined from the sludge core data assuming first-
order kinetics based on the initial concentration of the
organisms at the sludge/water interface and the mean
concentration of organisms in each sludge core, because
these values were measured with a high-degree of
confidence. The relationship between the mean and
1At the time the experiment was initiated, beef extract was
not available for preparation of the phage eluent, so a solution
of 0.1% Tween 80 was used. At a later date, a comparison was
undertaken in which triplicate sludge samples were eluted using
either 0.1% Tween 80 or 3 g of beef extract in 0.1% Tween 80.
The concentrations of F+ and somatic phages were 40–50%
lower in the samples eluted with only Tween 80. Thus, the
concentrations of phages measured in this study are likely to be
at least 50% lower than the actual concentrations in the sludge.
However, it is believed that the underestimation of the actual
phage concentration did not have a significant effect on
calculation of the inactivation rates.
initial concentration is:
Cm ¼Co
R t1t0
e�kt dtR t1t0
dt¼
�Co=k e�kt1 � e�kto� �t1 � t0
; ð2Þ
where Cm is the mean (geometric) concentration of
organism measured in the entire sludge core, No./g FS,
Co the concentration of organism measured at the sludge
water interface, No./g FS, k the first-order inactivation
rate constant, d�1, t0 the age of sludge at top of core
(sludge/water interface), d, and t1 is the age of sludge at
bottom of core, d.
The concentration of indicator organisms in the batch
of sludge that was stored in the laboratory also
decreased with time (Fig. 7b). The inactivation rate
constants in the batch experiment were calculated by
fitting a straight line to the log-transformed concentra-
tions (No./g FS) of the four organisms, discarding
points in the tailing region. The constants calculated
from both the sludge cores and the batch experiment are
reported in Table 6. Based on the close agreement
between the two independent measures of inactivation, it
is concluded that values of 0.1, 0.01, and 0.001 d�1 are
conservative estimates of the first-order rate constants
for fecal coliform (and fecal enterococci), F+ coliphage,
and somatic coliphage, respectively, under the condi-
tions of this research.
Fecal coliform bacteria and fecal enterococci are
commonly used as indicators of enteric bacteria
inactivation, and F+ coliphage may be an adequate
indicator of enteric virus inactivation [33–36]. Thus, the
results from this study provide strong evidence that in
the sludge layer of WSPs in central Mexico, most enteric
bacterial pathogens are inactivated within several
months, whereas the inactivation of viral pathogens
may take several years.
ARTICLE IN PRESS
-5
-4
-3
-2
-1
0
0 2 4 6 8 10 12 14
Somatic coliphage
F+ coliphage
Fecal coliform bacteria
Fecal enterococci
Log
(C/C
o)Lo
g (C
/Co)
Estimated sludge age, yrs
1.3 x 10⁵
6.6 x 10³
1.8 x 10³
9.3 x 10²
0 1 2 3 4 5 6 7 8-5
-4
-3
-2
-1
0
Time, months
4.0 x 10⁵
1.9 x 10³
1.4 x 1031.3 x 102
(a)
(b)
Fig. 7. Relative concentrations of indicator organisms mea-
sured in the (a) sludge cores and (b) a batch test of sludge from
Xalostoc. The final concentrations (organisms/g TS) are also
reported.
K.L. Nelson et al. / Water Research 38 (2004) 111–127124
3.2.7. Contamination of sludge core samples
If Figs. 7a and b are compared, there is a clear
discrepancy between the concentrations of the four
indicator organisms remaining in the sludge cores and
those in the batch test (note the different time scales).
Based on the determined rate constants (Table 6), the
concentrations of the four indicator organisms measured
in the older sludge core sub-samples could not have been
due to surviving organisms; the most likely explanation
is that the older sludge was contaminated by the newer
sludge when the sub-samples were extruded from the
corer. Because the initial concentrations of organisms
were very high (106–107) and the inactivation rates rapid
compared to the age of the sludge, even a small degree of
contamination would have obscured the actual decrease
in concentration with sludge age. The method used to
calculate the inactivation rate in the sludge cores
(Eq. (2)), however, was not affected by the apparent
contamination because it was based on the mean
concentration of the entire sludge core.
In the case of helminth eggs, the apparent contamina-
tion would have had a minimal impact on the measured
concentrations because the relative change in concentra-
tion from the youngest to the oldest sludge was much
lower. Based on similar logic, it is reasoned that there
was no significant impact from contamination on the
remaining parameters measured in this research. It
should be emphasized, however, that when using sludge
cores, as with any field sampling method, the results
should be interpreted carefully.
3.2.8. Summary and implications for sludge management
The characteristics of the WSP sludge varied more in
the vertical than horizontal direction. In fact, in the
anaerobic pond there were no significant trends in the
horizontal direction, which is consistent with its even
distribution of sludge. Analogously, the parameters that
varied horizontally in the facultative ponds were those
that were a function of sedimentation (TS, VS/FS,
concentration and viability of helminth eggs), with the
denser constituents accumulating near the pond inlet
where the thickness of the sludge layer was greatest. In
all ponds, the sludge was transformed by compression,
anaerobic degradation, and inactivation of the micro-
organisms such that significant variation of the sludge
characteristics was observed in the vertical direction.
One implication of the observed horizontal and vertical
variations is that monitoring of the sludge layer cannot
be achieved by taking measurements in one location or
collecting grab samples. Rather, it is recommended that
a protocol similar to the one used in this research be
followed, in which sludge cores are collected from
several representative locations throughout the pond.
Within the first few months to 1 year in the sludge
layer, significant stabilization of the organic matter and
inactivation of helminth eggs and indicator organisms
occurred. Thus, a significant improvement in sludge
quality may be achieved if a pond is taken out of
operation for a period before the sludge is removed. This
option, however, requires that ponds are operated in
parallel such that the remaining ponds can accommo-
date 100% of the inflow. Although the rates are
expected to vary from region to region as a function
of temperature, if sludge is removed during normal pond
operation the recently deposited sludge will exert a
dominant influence on the sludge characteristics.
ARTICLE IN PRESS
Table 7
Meana and maximum concentrations of helminth eggs and indicator organisms in the sludge layers of the three ponds and maximum
values of helminth eggs and fecal coliform bacteria allowed by the USEPAa and Mexican governmentb in biosolids that are to be land
applied
Location Total
helminth
eggs,
eggs/g TS
Viable
helminth
eggs,
eggs/g TS
Somatic coliphage,
pfu/g TS
F+coliphage,
pfu/g TS
Fecal coliform
bacteria,
MPN/g
TS
Fecal enterococci,
cfu/g TS
Mean Max. Mean Max. Mean Max. Mean Max. Mean Max. Mean Max.
This research
Mexicaltzingo 129 184 25 55 1.3� 105 1.2� 107
Texcoco 49 273 25 169 5.7� 104 1.5� 107
Xalostoc 277 657 48 257 5.3� 105 4.2� 106 1.2� 104 1.3� 106 3.1� 104 4.4� 107 3.4� 103 7.9� 106
Regulationc
US EPA Class A 0.25d 1� 103
US EPA Class B No limite 1� 103
Mexico Class A 10 1� 103
Mexico Class B 35 2� 106
aGeometric mean for bacteria and virus, arithmetic mean for helminth eggs.bUSEPA [37].c INE [38]. Also stipulates a Salmonella concentration p3 and p300 MPN/g TS for Class A and B biosolids, respectively.dThe actual standard requires measurement of 4 g TS, such that the concentration is o1 viable egg/4 g TS.eNo regulations exist for the concentration of Somatic coliphage, F+coliphage, or Fecal enterococci.
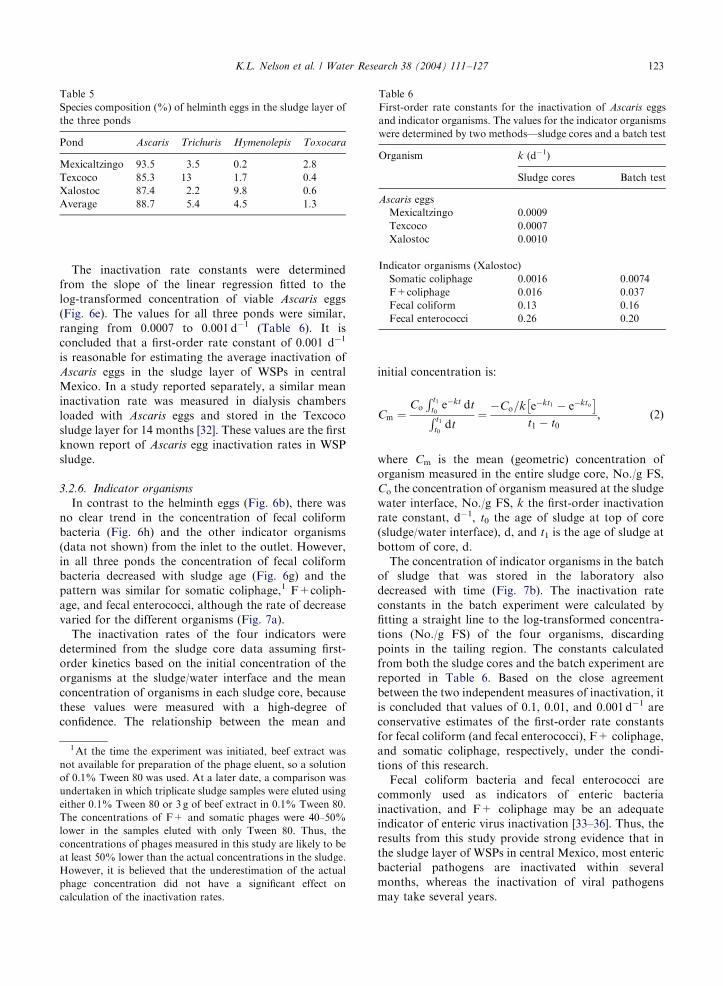
K.L. Nelson et al. / Water Research 38 (2004) 111–127 125
Depending on the sludge removal process, evaluating
the risk posed by the pathogens in the sludge may
require determination of both the maximum and
average concentrations of the pathogens and/or indica-
tor organisms. The concentrations of helminth eggs and
fecal coliform bacteria measured in this research
exceeded the values allowed by the US EPA for both
Class A and B biosolids and the Mexican government
for Class A biosolids. The average values in the
Mexicaltzingo and Texcoco sludge met the Mexican
requirements for Class B biosolids (Table 7).
4. Conclusions and recommendations
The results from this research on the characteristics of
WSP sludge and the rates of the most important
transformation processes in the sludge layer—compres-
sion, anaerobic degradation, and pathogen inactiva-
tion—can be used to evaluate sludge removal and
treatment options. Based on the estimated degradation
and inactivation rates, a significant improvement in
sludge quality could be achieved by taking a pond out of
operation for a period of time before removing the
sludge. Because most of the sludge characteristics
measured (TS, VS/FS, helminth eggs, indicator organ-
isms) varied significantly both horizontally and verti-
cally in the sludge layer of the facultative ponds, and
vertically in the anaerobic pond, future efforts to
characterize WSP sludge should include the collection
of core samples from representative locations through-
out the pond.The specific conclusions from this research
include:
1. Given the range in per capita sludge accumulation
rates from 0.021 to 0.036 m3/person/yr measured in
this research, a value of 0.04m3/person/yr is a
reasonable estimate of the rate of sludge accumula-
tion in both anaerobic and facultative ponds in the
central region of Mexico.
2. Although the per capita sludge accumulation rates
were similar in the facultative and anaerobic ponds,
the distribution of the sludge was dramatically
different. In the anaerobic pond with multiple inlets
and shorter HRT the sludge distribution was uniform
throughout the pond, whereas in the three facultative
ponds with single inlets and longer HRTs, most of
the sludge accumulated directly in front of the inlet.
3. The two main processes that affect the volume of the
sludge after it is deposited—compression and anae-
robic degradation—were similar in all three ponds. A
regression equation relating the total solids concen-
tration to the thickness of the sludge layer was
developed that can be used to evaluate different
processes for sludge removal. The rate of anaerobic
degradation decreased significantly after the first
year, after which the long-term, first-order inactiva-
tion rate constant ranged from 0.042 to 0.122 yr�1 in
the different ponds.
4. Using two independent methods (sludge cores and
batch experiment), the inactivation rates of four
indicator organisms were estimated. The results
ARTICLE IN PRESSK.L. Nelson et al. / Water Research 38 (2004) 111–127126
provide strong evidence that most bacterial patho-
gens are inactivated within several months in the
sludge layer, whereas the inactivation of viral
pathogens may take several years, depending on the
initial concentrations; the inactivation of Ascaris eggs
was even slower. Reasonable estimates of the
inactivation of fecal coliform bacteria, F+coliphage,
and Ascaris eggs in WSP sludge in central Mexico
can be made using first-order rate constants of 0.1,
0.01, and 0.001 d�1, respectively. The rates are
expected to be dependent on temperature, among
other factors, and may vary significantly outside this
region. In terms of the average concentrations of
helminth eggs and fecal coliform bacteria, the sludge
in the Mexicaltzingo and Texcoco ponds complied
with the Mexican standards for Class B biosolids, but
the average concentration of viable helminth eggs in
the Xalostoc sludge exceeded the value allowed for
reuse or disposal of biosolids.
Acknowledgements
The authors thank the Engineering Institute at the
National Autonomous University of Mexico, Mexico
City, for providing laboratory facilities, office space, and
institutional support for this research. In addition, we
thank Bill Sluis for designing and building the sludge
corer, Eric Van Dusen, Leopoldo Sanabria Olmos, and
Peter Nelson for their cheerful endurance collecting field
samples, German Salgado Vel!asquez, Catalina Maya
Rend !on, Elly Natty S!anchez Rodr!ıguez, and Adrianna
Romero Rosales for their dedicated laboratory help, and
Mark Sobsey for donating the coliphage host strains.
Financial support from the Fulbright Foundation and
the University of California Institute for Mexico and the
United States (UC MEXUS) was invaluable.
References
[1] Pena MR, Mara DD, Sanchez A. Dispersion studies in
anaerobic ponds: implications for design and operation.
Water Sci Technol 2000;42(10):273–82.
[2] Mara DD, Alabaster GP, Pearson HW, Mills SW. Waste
stabilization ponds: a design manual for eastern Africa.,
Lagoon Technology International and Overseas Develop-
ment Administration, Leeds, England, 1992.
[3] Mara D, Pearson H. Design manual for waste stabilization
ponds in Mediterranean countries. Lagoon Technology
International, Leeds, England, 1998.
[4] Oakley SM. Manual: Diseno, operaci !on y mantenimiento
para lagunas de estabilizaci !on en Centroam!erica (Manual:
Design, operation and maintenance for stabilization ponds
in Central America), AGISA/AIDIS, ERIS/USAC,
INFOM, UNICEF, OPS/OMS, CARE, Guatemala City,
Guatemala, 1998.
[5] Saqqar M, Pescod MB. Modelling sludge accumulation in
anaerobic wastewater stabilization ponds. Water Sci
Technol 1995;31(12):185–90.
[6] Nelson KL. Development of a mechanistic model of sludge
accumulation in primary wastewater stabilization ponds.
Proceedings of the 5th International Specialist Group
Conference on Waste Stabilization Ponds, Auckland, NZ,
2002.
[7] Papadopoulos A, Parisopoulos G, Papadopoulos F,
Karteris A. Sludge accumulation pattern in an anaerobic
pond under Mediterranean climatic conditions. Water Res
2003;37(3):634–44.
[8] Franci, R. Gerenciamento do lodo de lagoas de estabil-
izacao nao mecanizadas (Management of sludge from
non-mechanized stabilization ponds). Programa de Pes-
quisa em Saneamento Basico (PROSAB), Rio de Janeiro,
1999.
[9] Jim!enez B, Ramos J, Gonz!alez A, Mendoza H. Manual de
diseno de lagunas (Design manual for ponds), 2nd ed.
Mexico City: Comision Nacional de Agua; 1996, ISBN
968-36-5704-4.
[10] Escalante V, Moeller G, Rivas A. Pond evaluation and
upgrading in Mexico. Water Sci Technol 2000;42(10):
43–50.
[11] Oakley SM, Pocasangre A, Flores C, Monge J, Estrada M.
Waste stabilization pond use in Central America: the
experiences of el salvador, guatemala, honduras and
nicaragua. Water Sci Technol 2000;42(10):51–8.
[12] Lloyd B, Vorkas C. Technical report on the evaluation of
the Mexicaltzingo WSP system. Technical Report No. 5
Under DFID Research Contract No. R6871, Govt. of
the United Kingdom, Center for Environmental Health
Engineering, University of Surrey, England, Surrey,
England, 1999.
[13] Middlebrooks EJ, Panagiotou AJ, Williford HK. Sludge
accumulation in municipal sewage lagoons. Water Sewage
Works 1965;112(1):63–8.
[14] Parker CD, Skerry GP. Function of solids in anaerobic
lagoon treatment of wastewater. J Water Pollut Control
Federation 1968;40(2):192–204.
[15] Carr!e J, Baron D. Effects of maturation on the character-
istics of wastewater stabilization pond sludges. Water Sci
Technol 1987;19(12):169–75.
[16] Schneiter RW, Middlebrooks EJ, Sletten RS, Reed SC.
Sludges from cold region lagoons. Water Environ Res
1993;65(2):146–55.
[17] USEPA. Control of pathogens and vector attraction in
sewage sludge. EPA/625/R-92/013, US Environmental
Protection Agency, Washington, DC, 1992.
[18] Adams MH. Bacteriophages. New York: Interscience;
1959.
[19] Eaton AD, Clesceri LS, Greenberg AE. Standard methods
for the examination of water and wastewater. American
Public Health Association, American Water Works
Association, and Water Environment Federation, 1995.
[20] Feachem RG, Bradley DJ, Garelick H, Mara DD.
Sanitation and disease: health aspects of excreta and
wastewater management. New York: Wiley; 1983.
[21] Nelson KL, Darby JL. Inactivation of viable Ascaris eggs
by reagents during enumeration. Appl Environ Microbiol
2001;67(12):5453–9.
ARTICLE IN PRESSK.L. Nelson et al. / Water Research 38 (2004) 111–127 127
[22] Schneiter RW, Middlebrooks EJ, Sletten RS. Cold region
wastewater lagoon sludge accumulation. Water Res
1983;17:1201–6.
[23] Carr!e J, Laigre MP, Legeas M. Sludge removal from some
wastewater stabilization ponds. Water Sci Technol
1990;22(3–4):247.
[24] Teles CR, Costa ANd, Gon9calves R.F. Sludge production
in primary stabilization ponds and its use to forest species
cultivation in the southeast region of Brazil. Proceedings of
the Specialized Conference on Disposal and Utilization of
Sewage Sludge: Treatment Methods and Application
Modalities. International Association on Water Quality,
Athens, Greece, 1999.
[25] Ayres RM, Lee DL, Mara DD, Silva SA. The accumula-
tion, distribution and viability of human parasitic nema-
tode eggs in the sludge of a primary facultative waste
stabilization pond. Trans Roy Soc Trop Med Hyg 1993;87:
256–8.
[26] Gloyna EF.Waste stabilization ponds. World Health
Organization, Geneva, 1971.
[27] Arthur JP. Notes on the design, operation of waste
stabilization ponds in warm climates of developing
countries. World Bank Technical Paper No. 7, The World
Bank, Washington, DC, 1983.
[28] Bryant CWJ, Rich LG. Stabilization of organic carbon
and nitrogen in consolidating benthal deposits. Water Sci
Technol 1984;17:929–40.
[29] Iwema A, Carr!e J, Minot D. Sedimentation and digestion
on pond bottoms—an attempt to establish a short-term
material balance. Water Sci Technol 1987;19(12):153–9.
[30] Stott R, Ayres R, Lee D, Mara D. An experimental
evaluation of potential risks to human health from
parasitic nematodes in wastewaters treated in wastewater
stabilization ponds and used for crop irrigation. Research
Monograph No. 6, University of Leeds, Leeds, UK, 1994.
[31] Reimers RS, Bowman DD, Schafer PL, Tata P, Leftwich
B, Atique MM. Factors affecting lagoon storage disinfec-
tion of biosolids. WEF/AWWA/CWEA Joint Residual
and Biosolids Management Conference Biosolids 2001,
San Diego, CA, USA, 2001.
[32] Nelson KL, Darby JL. Determination of the inactivation
rate of Ascaris eggs in wastewater stabilization pond
sludge using dialysis chambers and sludge cores. Water
Environ Res 2002;74(4):362–9.
[33] IAWPRC, and Study Group on Health Related Water
Microbiology. Bacteriophages as model viruses in water
quality control. Water Res 1991;25(5):529–45.
[34] Woody MA, Cliver DO. Effects of temperature and host
cell growth phase on replication of F-specific RNA
coliphage Qb. Appl Environ Microbiol 1995;61(4):1520–6.
[35] Armon R, Kott Y. Bacteriophages as indicators of pollu-
tion. Crit Rev Environ Sci Technol 1996;26(4):299–335.
[36] Nasser A, Oman S. Quantitive assessment of the inactiva-
tion of pathogenic and indicator viruses in natural water
sources. Water Res 1999;33(7):1748–52.
[37] USEPA. 40 CFR Part 257. Standards for the use and
disposal of sewage sludge; final rules. Federal Reg
1993;58(32):9248.
[38] INE. Proyecto de Norma Oficial Mexicana NOM-004-
ECOL-2000. Proteccion ambiental. Lodos y biosolidos—
especificaciones y limites maximos permisibles de contam-
inantes para su aprovechamiento y disposicion final.
(Sludge and biosolids—specifications and maximum allow-
able concentrations of contaminants for their beneficial
reuse and final disposal), Instituto Nacional de Ecolog!ıa,
Mexico City, Mexico, 2000.