Page 1
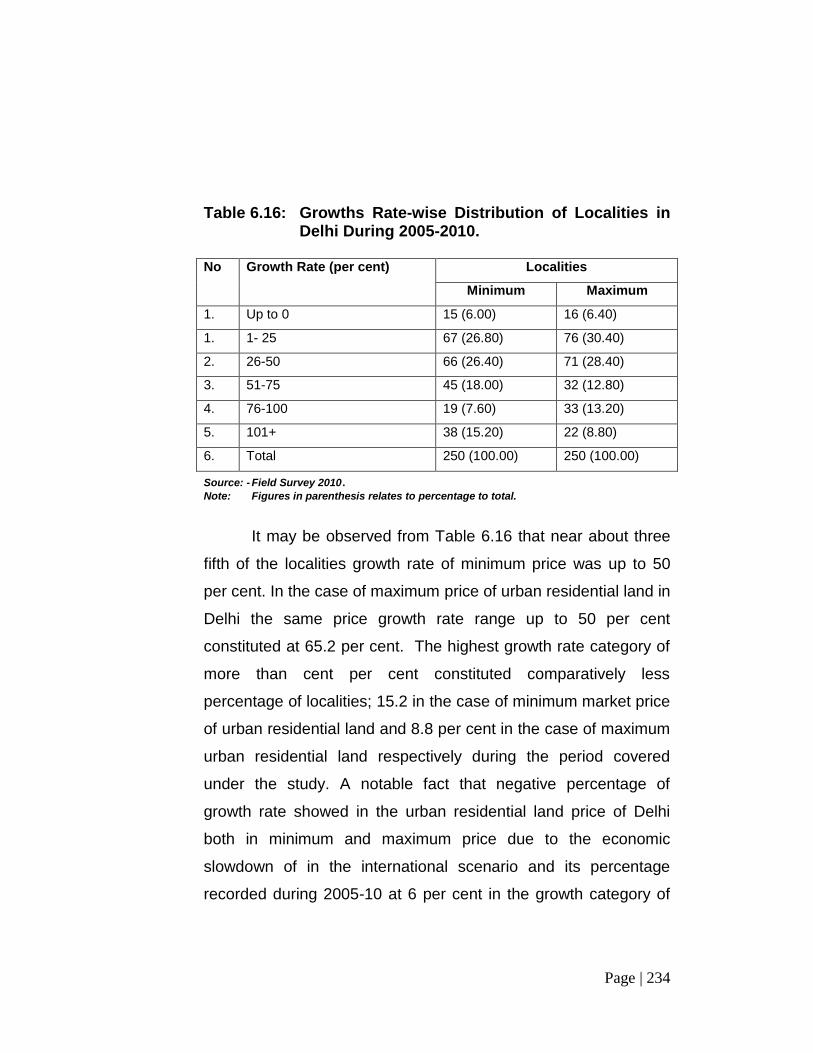
Page | 174
Slums and Urban Land Prices 6
Urbanization is, however, a development oriented sign of
economic prosperity in any country. The increased level of
urbanization is important for socio-economic development of the
people and is to be encouraged but we require more development
planning to do that. Due to the concentration of number of
industrial units and other service sector activities near the existing
cities, unplanned urbanization and unabated migration and
concentration of poor population from the depressed rural areas
to the urban settlements, numerous problems of complex nature
have emerged. It has created an imbalance situation in the urban
centers especially social and economic conditions. The migration
has strained infrastructure facilities in the cities to the breaking
point. The intermixing various land uses has created confusion
and chaotic conditions. There has been acute shortage of
housing in urban areas with the result that the cities face grim
situation with the fast increasing number of shanty dwellers,
squatters, pavement dwellers and slums in all the metropolitan
and other cities throughout the nation1.
Origin of Slums
Majority of the developed countries, developing countries
and less developed countries are facing this problem of slums
Page 2
Page | 175
and there is no panacea to eradicate the same from the surface of
the earth. Slums are universal in character and no country is able
to get rid of them. Unplanned urbanization with its attendant evils
of negating the fundamental purpose of human society- a secure,
rewarding and happy life- is no doubt a matter of great concern.
Infrastructure facilities like housing, safe drinking water supply,
transport, health care, educational institutions for children, parks,
etc,. have become woefully inadequate and will soon reach a
critical stage threatening the civilized existence itself. As per the
census of India 2001, more than one fourth of urban population
living in slums and squatters, settlements, the future can only be
one of still larger population living in such conditions if public
neglect continues. It is said every second there are two additional
mouths to feed. The overcrowding population, poverty, ignorance,
diseases, mal nutrition, etc, must be eliminated and the society
should seek improvement of living standards and quality of life of
the people.
In the present day world especially in developing countries,
the growth of slums is usually parallel to the growth of
urbanization. In India is no exception to urbanization. In India, one
important reason for the migration of the rural population to the
metropolitan cities, apart from the fact that urban areas offer
better job opportunities appears to be that the development of
rural areas has lagged far behind, with the result that the rural
Page 3
Page | 176
population is attracted to the amenities and entertainment
facilities which are available in the cities.
Housing has, without exception, failed to keep pace with
staggering rate of migration in to the cities and inevitable result
has been unplanned growth of the cities and the consequent
growth of slums. A recent assessment of slums growth as
obtained by the Census of India indicates that more than 25 per
cent of the population of the urban areas is living in slums.
India, a land of colorful contrasts, had a population of about
120 millions at the time of Ashoka (22BC) and the population
remained almost static till the time of Akabar i.e. upto 17th century
AD (during 1901 Census India’s population was 236 million)2. In a
span of one century the population of India increased to 1210
millions in 2011. Planned urbanization is a necessary component
of the infrastructure of economic development as towns provide,
inter alia, a variety of centralized services for the surrounding
area.
Factors Responsible for Creation of Slums
Various factors influence the creation of slums in most of
the developing countries of the world. Some of the major
contributory factors responsible for the growth of slums especially
in Delhi during the early periods can be summarized as follows;
Page 4
Page | 177
1. In the early phase of industrialization, there is large-
scale migration to the cities due to employment
opportunities and other community facilities and
advantages offered by the city, which are absent in
majority of the rural areas of developed countries of
the world.
2. The poverty which means an income level which is
inadequate to maintain a decent standards of living
as judged by the standards of the society and low
paying capacity of the migrants, force them to find
refuge either in low rental areas or to squat on the
unused land located near their work places.
3. There is a housing shortage in urban areas due to
low level of income among the economically weaker
sections of the society, underprivileged sections of
the society, etc,.
4. Proximity of their houses, close to the source of
employment for economic reasons especially due to
the low level of transportation cost.
Page 5
Page | 178
5. Due to the high and fast growth of migration
especially from all rural areas of Indian territory to
the urban centers mainly searching for livelihood,
there is great strain on the existing transport system
and there is absence of cheap and rapid transport,
existing roads are not good for smooth
transportation as per the latest scientific
development of the mechanized vehicles to the work
place.
6. There is often absence of comprehensive
development planning and if it is there, it may not
have taken in to consideration the existing socio
economic conditions and requirements of the ever
growing population belonging to the economically,
politically weaker sections of the society.
7. There is always inadequate and insufficient
municipal civic amenities which increase to the
problems of the slum squatters and cause many
other problems. In addition to the above mentioned
the available municipal civic facilities are not
properly maintained and not functioning at the
appropriate time.
Page 6
Page | 179
8. The high rents accompanied by the evil high rates of
commission (premium required to be paid to secure
possession) in Delhi, have encouraged occupiers or
owners even of average dwelling unit to part with
portion of their buildings. These sub divisions of
small dwelling units have further added to
overcrowding and congestion.
Home is the place where people in general carry out the
basic domestic and personal functions of family life. Physical and
mental health, working efficiently, emotional security and social
status are likely to be influenced by housing conditions. The
dwelling is the oldest branch of building, from man’s first crude
solutions of his most pressing problems, protection from the
elements, wild beasts and human enemies. Acquisition of suitable
home is though, vital to the modern family, but an average family
cannot do so merely on its own initiative. Thus, housing is of
direct significance to the community and the nation.
No country in the world, developed or developing or under
developed is able to provide cheap and adequate accommodation
to the man, which is very essential to eliminate the menace of
slums. However, it will be too simplistic to say that slums owe
their origin to the shortage of houses alone. They emerge,
continue and grow because of serious imbalances in the social
Page 7
Page | 180
and economic set up. To control slums, we have to check these
imbalances otherwise nothing substantial is likely to be achieved.
Like poverty, it may be that slums will always be with us,
however energetic the local authorities may become in eliminating
these. But it must not be forgotten that even the slum landlord of
fiction has rights and owner of the slum or today is often a small
man or woman depending on few rents for a livelihood just above
social security level.
Thus, slums are not a new phenomenon with the
developed or developing or under developed countries. They
have existed, are existing and will remain with us perhaps for
quite a long time. The slums are the result of forces, events and
deficiencies in our socio economic structure. Industrialization and
urbanization especially in the development of secondary and
tertiary sectors during the last three decades in India are equally
responsible for the creation of slums.
Definition of Slums
The term slum is used in a loose sense to designate areas
which are overcrowded dilapidated, faultily laid out and generally
lacking in essential civic services. Slums have been defined as
poverty areas, run-down, overcrowded, inhabited by persons who
are not acceptable in other areas, characterized by unsanitary
Page 8
Page | 181
surroundings, high death rate and high delinquency and crime
rate. As it is generally known, there is no exact definition of the
term slums available and even various writers on the subject differ
on its fundamentals. From the available sources, it can be seen
that a slum has got the characteristics like sub standard housing,
thickly populated squalid part of the city, and overcrowded
neighbourhood inhabited by the poorest people. The Webster
International Dictionary narrates slum as a thickly populated street
or alley, especially one marked by squalor, wretched living
conditions, or degradation of its inhabitants.
Slum problem is not only a problem of shelter; it is a
problem of health and hygiene. A number of widespread epidemic
diseases emanate from the slums. These slums are not only a
nuisance and danger to the slum dwellers but to the rest of the
population. A slum is usually understood to be an area of
overcrowded squalid, closely built and unhygienic housing. Urban
slums rose in great numbers during the growth of industrial cities
and towns in the 19th century.
Thus, slums it appears that they stand for the wretched
socio economic conditions of the city life of the people who are
living in the filthy blight areas. The combination of words of
SLUM appears to have unconsciously acquired the modified form
of existing conditions in the abbreviated form if we take S for
Page 9
Page | 182
Shell, L for Languishing, U for Urban and M for Masses. Thus
the word slum denotes Shell of Languishing Urban Masses.
This clearly narrates the natural condition prevalent in any slum
area of the nation irrespective of developed or developing or
under developed.
Characteristics of Slums
On the basis of observation from slums, we can outline its
major characteristics, which are given below:
1. Appearance:
This may be called a universal mark of the slum; its aspect
of neglect and disorder with respect to building, yards and streets.
The appearance is generally one of dilapidated and old structures
and a declining trend in respect of amenities.
2. Economic Status:
Generally, the people of the lowest income group inhabit a
slum; although there may be occasional buildings of equally run
down appearance inhabited by families that are not so poor.
However, in general, poor people inhabit the slum.
3. Over-crowding:
We may find that the cluster is overcrowded. Most of the
buildings / tenements are crowded with the people. If the slum is
retreating many buildings are unsafe for habitation, but there can
be overcrowding in the building occupied. Uninhabited spaces
are occupied by undesirable occupants and use it as junkyards.
Page 10
Page | 183
4. Population:
In a slum of a heterogeneous occupancy many of the
inhabitants are not welcome in other residential areas, or they
cannot afford to live elsewhere. Thus, it may be a refuge area of
the homeless, socially mal adjusted.
5. Health and Sanitation:
For understandable reasons when compared with
other area of residence, the slum is characterized by low
standards of sanitation. The slum is often most neglected by the
public services for sanitation. For variety of reasons it may also
be an area of high sickness and death rates.
6. Morals:
The slums may be an area of delinquency, crime but this is
more likely to be true of the socially disorganized slum. While
such a slum may not be the habitat of successful criminals, it may
be the habitat of marginal types or the hiding place of fugitive
criminals.
7. Way of Life:
Slums differ widely with respect to the social organization
of their inhabitants. They range from the slums in which the
inhabitants are strangers to one another and wish to be, to the
family slum in which there is wide acquaintance between
inhabitants.
Page 11
Page | 184
8. Social Isolation:
Every residential area within the modern city tends to be
socially isolated from others, partly by choice and partly by
location, the slum is especially so. It is the area of lowest
status inhabited by slum dwellers.
Thus, the overcrowding in the cities, extensive slums,
broken homes, the frustration and despair of poverty, unfavorable
conditions in home and neighborhood, large number of
immigrants, high rate of unemployment, low socio economic
status and physical deterioration are the general characteristics of
the cities and all these have combined to create the situation in
the cities, in which a new inducement for crime and delinquency
have risen11. The common factors contributing to the creation of
slums are manifold like, low wages and poverty preventing people
from paying for decent dwellings; invasion of incompatible
business and commerce in to residential areas leading to neglect
of dwellings, unplanned growth of cities, lack of maintenance and
enforcement of building codes of failure to prosecute for housing
code violations; leniency towards the owners of dilapidated
property in tax assessment, and low standards in remodelling old
dwellings social or other restrictions limiting the location or quality
of housing available to certain group; non adoption and non
enforcement of regulations with respect to satisfaction and safety
by municipal governments and finally human apathy towards
Page 12
Page | 185
menace of slums. Therefore, a slum is characterized by a place
where basic necessities of life i.e. proper shelter, employment,
health, sanitation, education facilities etc are absent. In north
India especially in Delhi slums are often called jhugis, which
usually consists of mud wall and thatched roof. In India majority
of the slum people exist in metro-cities.
Lack of sanitation and inadequate civic basic facilities in
the overcrowded slum areas in majority of our metropolitan cities
help the growth of flies, mosquitoes, bugs, pigs, mice, etc, which
cause scores of diseases such as cholera, typhoid, malaria,
tuberculosis, etc, to which infants and children are easy prey. In
the congested and overcrowded areas people are keeping
rubbing shoulders with each other causing mental tension, which
manifests in social tensions leading to riots and various other
communal problems3. We have been facing the problem of these
due to the existence of large level of slum people in our
metropolitan areas and are obeying and following the rules of high
rich and politically linked people in their surrounding areas4. The
urban population and slum population of India and Delhi during
the 2001 is presented in Table 6.1.
Page 13
Page | 186
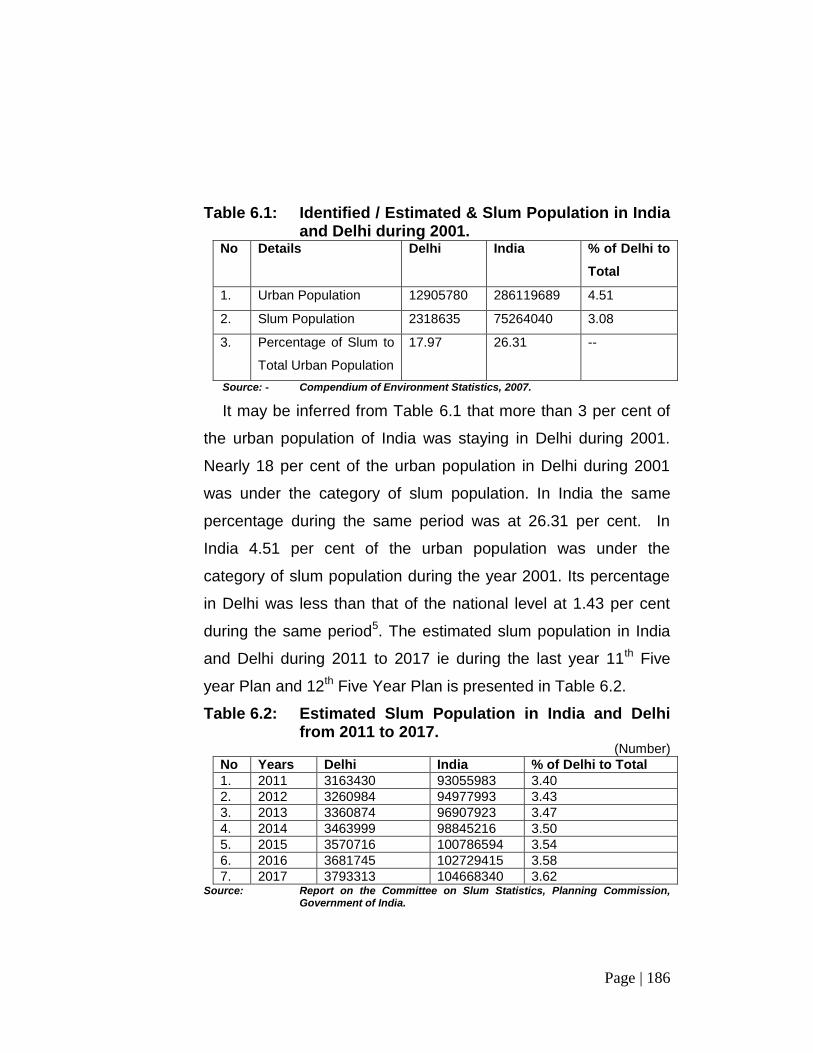
Table 6.1: Identified / Estimated & Slum Population in India and Delhi during 2001.
No Details Delhi India % of Delhi to
Total
1. Urban Population 12905780 286119689 4.51
2. Slum Population 2318635 75264040 3.08
3. Percentage of Slum to
Total Urban Population
17.97 26.31 --
Source: - Compendium of Environment Statistics, 2007.
It may be inferred from Table 6.1 that more than 3 per cent of
the urban population of India was staying in Delhi during 2001.
Nearly 18 per cent of the urban population in Delhi during 2001
was under the category of slum population. In India the same
percentage during the same period was at 26.31 per cent. In
India 4.51 per cent of the urban population was under the
category of slum population during the year 2001. Its percentage
in Delhi was less than that of the national level at 1.43 per cent
during the same period5. The estimated slum population in India
and Delhi during 2011 to 2017 ie during the last year 11th Five
year Plan and 12th Five Year Plan is presented in Table 6.2.
Table 6.2: Estimated Slum Population in India and Delhi from 2011 to 2017.
(Number)
No Years Delhi India % of Delhi to Total
1. 2011 3163430 93055983 3.40
2. 2012 3260984 94977993 3.43
3. 2013 3360874 96907923 3.47
4. 2014 3463999 98845216 3.50
5. 2015 3570716 100786594 3.54
6. 2016 3681745 102729415 3.58
7. 2017 3793313 104668340 3.62 Source: Report on the Committee on Slum Statistics, Planning Commission,
Government of India.
Page 14
Page | 187
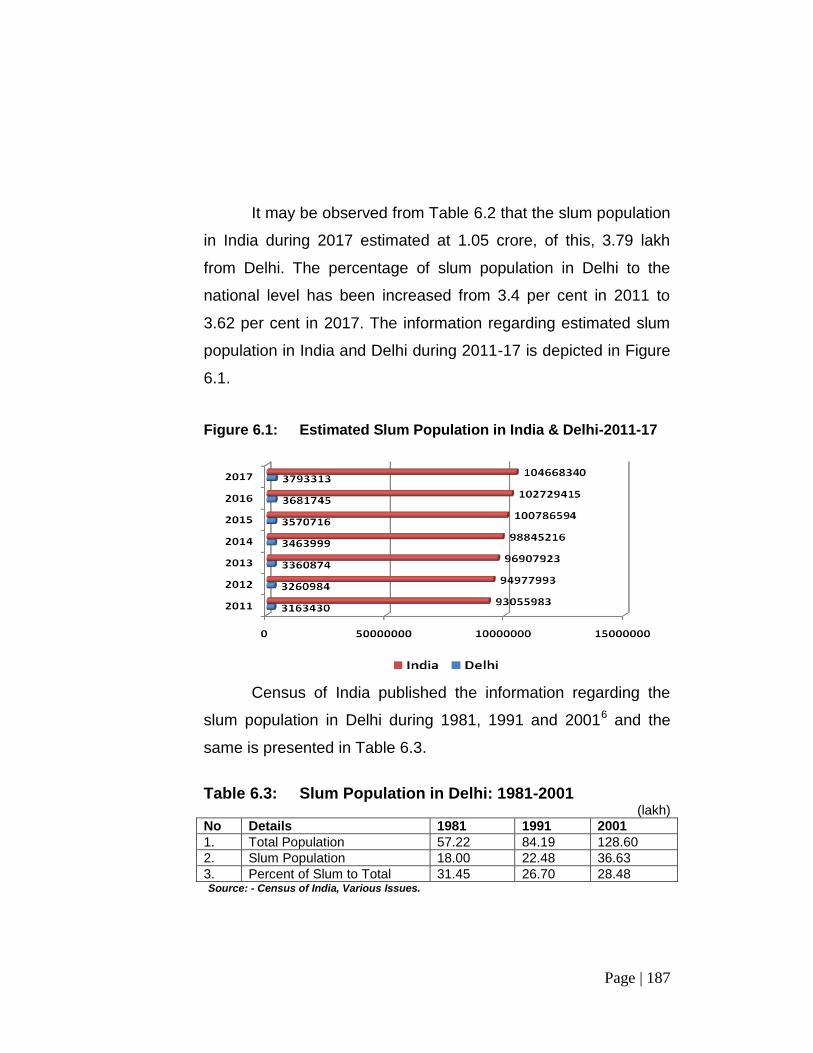
It may be observed from Table 6.2 that the slum population
in India during 2017 estimated at 1.05 crore, of this, 3.79 lakh
from Delhi. The percentage of slum population in Delhi to the
national level has been increased from 3.4 per cent in 2011 to
3.62 per cent in 2017. The information regarding estimated slum
population in India and Delhi during 2011-17 is depicted in Figure
6.1.
Figure 6.1: Estimated Slum Population in India & Delhi-2011-17
Census of India published the information regarding the
slum population in Delhi during 1981, 1991 and 20016 and the
same is presented in Table 6.3.
Table 6.3: Slum Population in Delhi: 1981-2001
(lakh)
No Details 1981 1991 2001
1. Total Population 57.22 84.19 128.60
2. Slum Population 18.00 22.48 36.63
3. Percent of Slum to Total 31.45 26.70 28.48 Source: - Census of India, Various Issues.
Page 15
Page | 188
It may be inferred from Table 6.3 that the slum population
in Delhi increased from 18 lakh in 1981 to 36.63 lakh in 2001
recorded an annual growth rate at 5.18 per cent. During the same
period the population growth rate outweighs the slum population
by 1.06 per cent per annum. Census of India also published the
information regarding zone-wise number slums in Delhi7 during
1991 and 2001 and the same is presented in Table 6.4.
Table 6.4: Zone-wise Distribution of Slums in Delhi:
1991&2001.
(Number)
No Zones 1991 2001
No % No %
1 East 123 13.24 212 16.29
2 Central 93 10.01 139 10.68
3. North 227 24.40 302 23.21
4. West 204 22.00 270 20.75
5. South 282 30.35 378 29.05
Total 929 100.00 1301 100.00 Source: - Census of India.
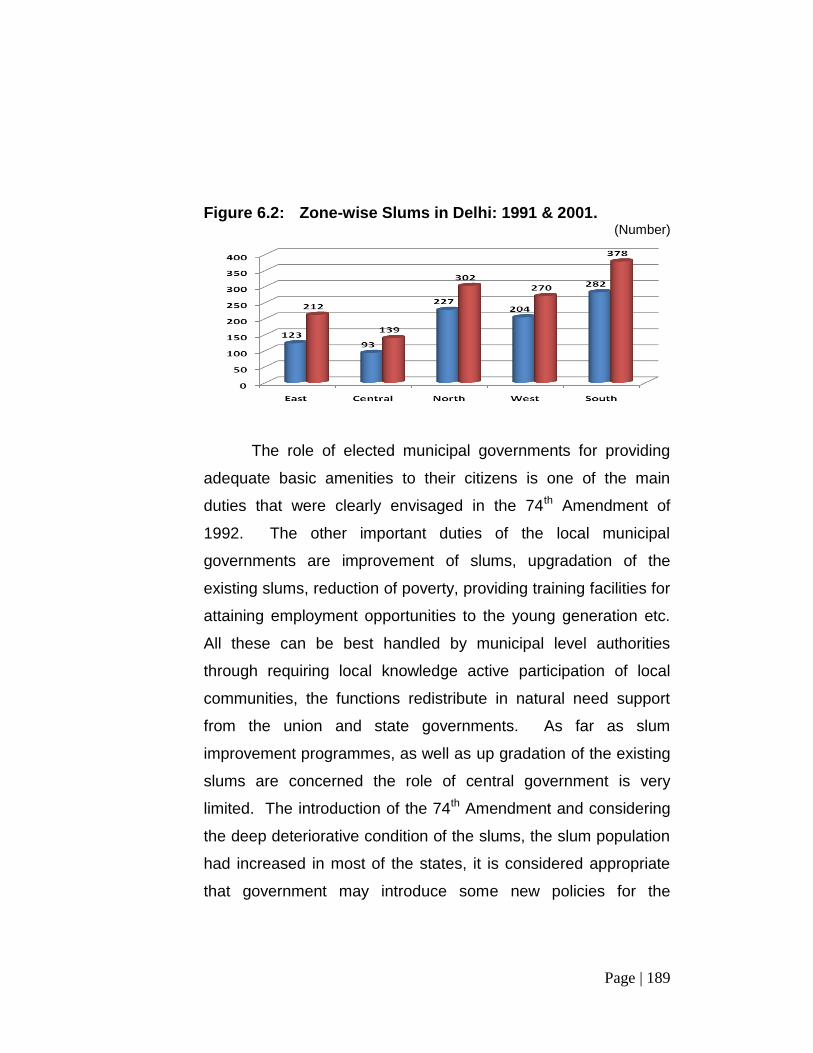
It may be inferred from Table 6.4 that the number of slums
in south zone was higher during 1991 & 2001. During the same
period number of slums in Delhi increased from 929 in 1991 to
1301 in 2001. The zone-wise number of slums in Delhi is depicted
in Figure 6.2.
Page 16
Page | 189
Figure 6.2: Zone-wise Slums in Delhi: 1991 & 2001. (Number)
The role of elected municipal governments for providing
adequate basic amenities to their citizens is one of the main
duties that were clearly envisaged in the 74th Amendment of
1992. The other important duties of the local municipal
governments are improvement of slums, upgradation of the
existing slums, reduction of poverty, providing training facilities for
attaining employment opportunities to the young generation etc.
All these can be best handled by municipal level authorities
through requiring local knowledge active participation of local
communities, the functions redistribute in natural need support
from the union and state governments. As far as slum
improvement programmes, as well as up gradation of the existing
slums are concerned the role of central government is very
limited. The introduction of the 74th Amendment and considering
the deep deteriorative condition of the slums, the slum population
had increased in most of the states, it is considered appropriate
that government may introduce some new policies for the
Page 17
Page | 190
development of slums. he main factors behind the high rate of
growth of slums in cities are low wage level, poverty, unplanned
city growth and its planning, lack of all basic facilities, lack of
maintenance of existing facilities at the appropriate time, misuse
of existing facilities by a limited group of persons etc. These in
turn will create number of problems such as environmental
problems, especially pollution in air and water, various social
disorders, unhygienic living conditions etc.
In 2008-09, 65th Round of National Sample Survey
Organization under the Ministry of Statistics and Programme
Implementation conducted a survey regarding urban slums in
Delhi. The survey estimated that the number of urban slums in
Delhi during 2008-09 was at 43908. The following table clearly
narrates the distribution of urban slums in Delhi during 2008-09.
Table 6.5: Distribution of Urban Slums by Area in Delhi:
2008-09 No Area (Hectare) No. of Slums Per cent
1 Less than 0.5 872 19.86
2. 0.5-1.0 1266 28.84
3. 1.0-2.0 2100 47.84
4. 2.0 or more 152 3.46
5. Total 4390 100.00 Source: - 65
th Round of National sample Survey, Ministry of Statistics and
Programme Implementation, Government of India2008-09.
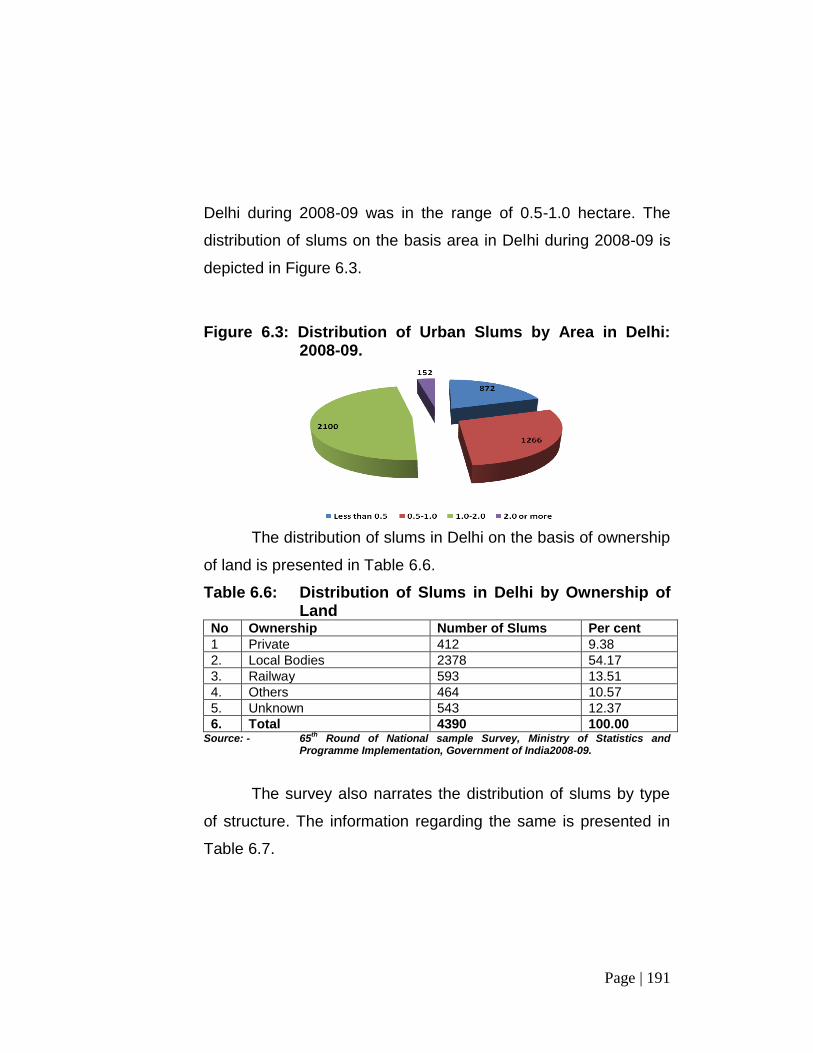
It may be observed from Table 6.5 that near about one half
of the total urban slums area was in between one and two
hectares. While more than 28 per cent of the urban slums area in
Page 18
Page | 191
Delhi during 2008-09 was in the range of 0.5-1.0 hectare. The
distribution of slums on the basis area in Delhi during 2008-09 is
depicted in Figure 6.3.
Figure 6.3: Distribution of Urban Slums by Area in Delhi:
2008-09.
The distribution of slums in Delhi on the basis of ownership
of land is presented in Table 6.6.
Table 6.6: Distribution of Slums in Delhi by Ownership of Land
No Ownership Number of Slums Per cent
1 Private 412 9.38
2. Local Bodies 2378 54.17
3. Railway 593 13.51
4. Others 464 10.57
5. Unknown 543 12.37
6. Total 4390 100.00 Source: - 65
th Round of National sample Survey, Ministry of Statistics and
Programme Implementation, Government of India2008-09.
The survey also narrates the distribution of slums by type
of structure. The information regarding the same is presented in
Table 6.7.
Page 19
Page | 192
Table 6.7: Distribution of Slums in Delhi by Type of Structure.
No Type of Structure Number of Slums Per cent
1 Pucca 2184 49.75
2. Semi Pucca 1834 41.78
3. Serviceable Kutcha 372 8.47
4 Total 4390 100.00 Source- 65
th Round of National sample Survey, Ministry of Statistics and
Programme Implementation, Government of India2008-09.
The survey also mentioned that the basic facilities in the
urban households covering, safe drinking water, latrine facility,
electricity, etc. the information regarding the basic amenities
available to the urban slums in Delhi during 2008-09 is presented
in Table 5.8.
Delhi is one of the fast growing urbanized states in the
Indian union. The concentration of economic activities especially
in service sector attract the people from different parts of the
nation to the urbanized areas for employment, livelihood etc.
Delhi Urban Shelter Improvement Board is earmarked for the
development of slums and its activities in Delhi.
Delhi Urban Shelter Improvement Board (DUSIB) has
come in existence under Delhi Urban Shelter Improvement Board
Act, 2010 which has been passed by the Legislative Assembly of
the National Capital Territory of Delhi on the 01st April, 2010 and
has come in force by the orders of Hon'ble Lt. Governor of Delhi
on 1st July, 2010.
Page 20
Page | 193
Table 6.8: Basic Amenities Available in Urban Slums of Delhi.
No Details Number of Slums Per cent
1. Safe Drinking Water
a. Tap 3847 87.63
b. Hand Pump/ Tube Well 391 8.91
c. Others 152 3.46
d. Total 4390 100.00
2.
Latrine Facility
a. Owned 344 7.84
i. Septic Tank 344 7.84
b. Shared 270 6.15
i. Septic Tank 121 2.76
ii. Pit 74 1.68
iii. Service 75 1.71
c. Public/ Community 2901 66.08
i. Septic Tank 2294 52.26
ii. Pit 32 0.73
iii. Service 575 13.10
d. No Latrine 875 19.93
e. Total 4390 100.00
3. Electricity
a. Street Light & Household Use 2093 47.68
b. Household Use only 1284 29.25
c. Street Light Only 866 19.73
d. No Electricity 147 3.35
e. Total 4390 100.00 Source: - 65
th Round of National sample Survey, Ministry of Statistics and
Programme Implementation, Government of India2008-09.
DUSIB is primarily responsible for the qualitative
improvement of slum settlements and providing various kinds of
services for slum dwellers in the city9. It also undertakes works
relating to provision of shelters to the urban poor / slum dwellers
under the policy for relocation of slum and JJ dwellers, including
the provisions of built up flats under exceptional circumstances,
when the properties / katras become dangerous / unfit for human
Page 21
Page | 194
habitation. The main thrust is to provide minimal civic
infrastructural facilities like toilets, bathrooms and Basti Vikas
Kendras (Community Centres) in JJ Clusters.
The broad activities of DUSIB are as follows;
Construction, Management and Maintenance of Night Shelters.
Construction of low cost Housing under EWS for Slum dwellers under Jawahar Lal Nehru National Urban Renewal Mission(JNNURM)
Relocation of squatters.
In-situ up-gradation.
Environmental Improvement in Urban Slums.
Construction of Pay and Use Jansuvidha (Toilet) Complexes.
Construction of Basti Vikas Kendras / Community Halls.
Structural Improvement and Rehabilitation of Katras.
Containing the size of Jhuggi Clusters and Development of Shishu Vatikas.
Study and Preparation of Perspective Plans for Delhi Slums
Government of Delhi started a Plan Scheme in 1997-98 for
providing minimum civic services i.e construction of road,
roadside drain and filling up of low lying area so as to maintain
hygienic conditions in slum areas. Government of NCT of Delhi
has established a special fund for development of unauthorized
colonies with an outlay of Rs. 2800 crore10 for the Eleventh Five
Year Plan Period (2007-12) to meet the expense on provision of
water supply, sewerage, roads, drains, sanitation, street lighting
and electrification etc,.
Page 22
Page | 195
Delhi Government has provided plan funds of Rs 185.00
crore during 2010-11 under this plan scheme and an amount of
Rs. 128.77 crore have been spent up to March 2011. These
colonies now proposed to be regularized and a Board for
Unauthorized Colonies has been constituted under the
chairmanship of Hon’ble Chief Minister of Delhi, which will advise
Government of NCT of Delhi on the process of regularization of
these unauthorized colonies. A total 1639 applications were
received and provisional regularization certificates have been
issued to 1218 unauthorized colonies in, 2008.
Government of India recently announced a new scheme
called Rajiv Awas Yojana (RAY)11 under JNNURM for the slum
dwellers and the urban poor people envisages a ‘Slum-free city’
through the active participation of States/Union Territories to
tackle the problem of slums in cities. An amount of Rs.9.78 crore
has been received from the Government of India. The main
objectives are;
Bringing existing slums within the formal system and
enabling them to avail of the same level of basic
amenities as the rest of the town.
Redressing the failures of the formal system that lie
behind the creation of slums and
Tackling the shortages of urban land and housing that
keep shelter out of reach of the urban poor and force
Page 23
Page | 196
them to resort to extra-legal solutions in a bid to retain
their sources of livelihood and employment.
Under this scheme States/Union Territories have to
undertake preparatory activities of conducting slum survey,
mapping of slums, developing slum information system,
undertaking community mobilization, preparation of Slum-free
City/State Slum-free Plans before seeking support under Rajiv
Awas Yojana. The Government of NCT of Delhi has already
submitted a detailed proposal to the Government of India for
under taking slum survey, mapping of slums, developing slum
information system, undertaking community mobilization etc.,
The inception of slums or jhuggi jhopri clusters started with
the development of cities. In Delhi the formation of slums
observed even before Independence. The main reason behind
the formation of slum clusters was due to various factors such as
flow of migrants from neighboring states for livelihood and
employment. The condition was manageable before 1970 and
most of slums were resettled. After 1970, the high pace of
development of Delhi and slow development in other cities in
northern India automatically speeding up the flow of migration of
Delhi with a massive increase in slum clusters.
Page 24
Page | 197
The exact number of JJ Clusters was enumerated in a
survey conducted by Government of Delhi in 199012. The survey
report mentioned that there were 929 slum clusters and around
2.59 lakh households in Delhi. Delhi Urban Shelter Improvement
Board estimated the number of jhuggi jhopri clusters and slum
population of Delhi. The same was mentioned that around 643
slum clusters with 4 lakh households having a population of 20
lakh in Delhi. The Census 2001 also indicated about 20 lakh
persons residing in JJ Clusters of Delhi.
The Sub Mission II of the Jawaharlal Nehru National Urban
Renewal Mission (JNNURM) involves Basic Services to the Urban
Poor (BSUP) including the integrated housing and slum
development programme. The basic objectives are;
Focused attention to integrated development of
Basic Services to the Urban Poor in cities covered
under the mission.
Provision of Basic Services to Urban Poor including
security of tenure at affordable prices, improved
housing, water supply, sanitation and ensuring
delivery through convergence of other already
existing universal services of the Government for
education, health and social security. Care will be
Page 25
Page | 198
taken to see that the urban poor are provided
housing near their place of occupation.
Secure effective linkages between asset creation
and asset management so that the Basic Services
to the Urban Poor created in the cities are not only
maintained efficiently but also become self-
sustaining over time.
Ensure adequate investment of funds to fulfil
deficiencies in the Basic Services to the urban poor.
Scale up delivery of civic amenities and provision of
utilities with emphasis on universal access to urban
poor.
Under Sub Mission-II Basic Services to the Urban Poor
(BSUIP) of JNNURM, Government of India has so far approved
15 Projects in Delhi (10 Projects of DSIIDC, 1 Project of DDA and
4 Projects of Slum Wing of MCD) with an estimated cost of
Rs.1814.51 crore. Till 31st March 2011, 13528 flats have been
completed and 35768 flats are under construction stage. The
Delhi Urban Shelter Improvement Board has been established
and nominated as nodal agency for the implementation of scheme
of relocation/rehabilitation of jhuggi jhopri clusters in Delhi like
improvement of environment, relocation and in-situ development
of slums in Delhi. The Board has allotted 85 flats to the eligible
slum dwellers of 2 JJ clusters.
Page 26
Page | 199
Policy on Slums
1. The slums located in congested unhygienic areas of the
urban areas wherein equitable distribution of space is
not feasible shall be cleared and tenement schemes put
up.
2. Wherever in-situ development is feasible, such slums
be identified and taken up for in-situ improvement for
the provision of basic facilities to make the areas
habitable.
3. Wherever neither tenement scheme nor in-situ
development is feasible, rehabilitation & resettlement in
tenements in nearby locations be followed.
The urban poor have become an inevitable concomitant of
the development path of many countries including India, have
chosen or have been forced to choose. The poor in urban areas
not only prop up the economy, but they also help the city
governments make services economical because the poor offer
their labour at a very nominal rate. Imagine the city without the
poor malnourished loader, the scavenger and the conservancy
labour. Economically speaking, the urban poor make the city
living affordable and less costly than it would be. But seldom do
the not so poor care to help them to make their living affordable.
In order to be more meaningful, objectives and goals must be
translated into day-to-day practice in conjunction with the people
Page 27
Page | 200
facing problems. That requires both dedication and sacrifice on
the part of city government and its staff and of the non-
governmental organizations, self help groups and volunteers and
whose support is so essential in any effort to reach the un-
reached.
Thus, slum clusters huge number of squatters deal in
collecting and trading of inflammable items, which may cause a
fire hazard thus affecting the safety of the inhabitants and
neighborhood population especially during summer period. The
area is prone to mishap during the monsoon season when the
storm water mixed with over flow of sewer may cause spread of
epidemic, pollution of water and spread of disease keeping in
view the slums squatters in question. It is quite apparent that the
in situ up gradation is not feasible at the existing sites due to their
high density and locational hazards. The only course left to the
land owning agency is to relocate them to safer areas with
adequate physical and social infrastructure.
The dominant discourse portrayed the slum population
mainly as a problem and not as a resource for environmental
management and city development. The concerns of the slum
dwellers, their poverty and livelihood problems were excluded
from the center stages of the discourse, except in political
rhetoric. Few government efforts reached the slum dwellers in a
Page 28
Page | 201
positive manner. Strategies for slum development were made to
correspond to a generalized image of the slums and their role in
the city development, while aspects of the slums, which did not
correspond to this stereotype image or other sub discourse, were
suppressed. The diversity and dynamics of the evolving slum
societies were underplayed and neglected.
If accepted that the stereotype and dominant image of
slum dwellers characterized in this chapter reflected the real
nature of local dynamics nor captured well the causes and effects
of urban environmental degradation, more empirical research
would be needed to understand who the slum dwellers really are,
what diversity of interests and capacity they possess, and how
they could become engaged in formulating alternative urban
strategies. Through recent public consultations organized by
some research institutions, NGOs in collaboration with the
government bodies, new empirical findings have been brought to
the attention of a variety of stakeholders, finding that provide a
more diverse, realistic and positive image of the slum dwellers.
Such changes in images are today increasingly reflected in
more positive attitude to slum rehabilitation. By the local
government accepting to take responsibility for slum upgrading,
more positive attitude are likely to emerge since the aim would
now be to build on whatever capacity the slum dwellers have and
Page 29
Page | 202
what the local resources are available. The new agenda for urban
politics, as promoted by civil society groups and critical
researchers, it is precisely to move issue of poverty
empowerment of slum dwellers and partnerships between city
government and the people to the center stage of urban politics –
and thereby create a new dominant discourse.
Public debate is essential for effective transformation of the
slums discourse and adoption of alternatives and more fruitful
perspective by the parties concerned. A combination of research,
advocacy and public reform might be needed to promote greater
pluralism in the discourse. Empirical research and along these
lines would require more than a simple analysis of the discourse –
understood as an analysis of the confrontation between
constructed ideas and images. It would require an understanding
of the variety of social and institutional stakeholders concerned,
their views, interest and influence, and specific outcome of their
interaction with each other and the government. It would require
a focus on historical events and processes, open public debate –
informed by empirical research - is a necessary condition for the
emergence of good government policies and practice based, less
on ideology constructed myths and more on empirical realities.
Page 30
Page | 203
Trends in Land Prices
Research on urban land price changes in developing
nations involves a variety of data from different sources.
Generally, there is a lack of uniformity in the data sources and as
such comparability of data from various sources is difficult. It is
observed that the availability of data from different sources
formed basis for a particular methodology applied in land price
research. Hence the need is to examine more closely the relative
utility of major data sources available for taking up research in
changing land price scenario. Exploratory analysis and diagnosis
of each data source facilitate to rule out or accept certain data
points in urban land price study. Without this, one takes a
common platform where one can globally compare the findings of
one study with others. This leads to assertions and wide scale
generalizations such as that land prices are increasing at a rapid
rate or sky rocketing. Anecdotal assertions based on isolated on
highly selective cases may not be corroborated once analyzed
empirically.
A meaningful analysis of the land registration information is
required immediately, especially at a time when international
agencies and multi-national agencies like United Nation’s
Development Programme (UNDP), World Bank, International
Monitory Fund and various other organizations show a
considerable concern to extend tools for land and housing market
Page 31
Page | 204
management in developing nations in the world. In view of the
above World Bank stresses the desirability of developing nations
considering land price information as surrogates for land prices in
order that governments can then recoup service provisions, host
by ploughing back a proportion of land price change. Here in
India, data questions the applicability of associating registered
land prices with notional land price13.
The main advantage of collecting land price information is
to have information about land price changes also that occur at a
city wide level rather than simply explaining prices for very recent
deviations at the outskirts of the city. Land price information is
available through out the city in most of the developing nations in
the world. It is an important data but the need is to analyse the
data in a comprehensive manner to explore its potential.
Nature of Land Price Information
In India the land price data are available at the Tehsil office
(land registration office) with a breakup to the level of colonies,
mohallas, (The term mohalla is normally used for old settlements
that are mainly located in older areas of the city.) and villages
located within the city limits. There are usually two main data
sources at the land registration office or tehsil office level that
provide the land price information. The first main source
comprises confidential records of what can be termed as first level
Page 32
Page | 205
data. These are unpublished and contain basic details of
individual property transactions that have taken place in the city
over a period of time. These records have information on each
type of property transaction, ie. house and land (plot) and are
used by the state and private individuals for completing property
searches in order to ascertain plot or house ownership. One must
be careful with these data sources because of listings of the
house and land transactions are unsorted in the records.
Moreover there are many types of registrations for land and
house transactions. Types of registrations recorded in the
confidential records at the first level are numerous. For example,
registrations include gift deed, partition deed, errata, cancellation
of sale deed, surrender deed, re-conveyance deed, mortgage,
return of mortgage, rent deed, receipt, assignment deed,
agreement deed, sale deed, etc. With these records, what should
concern the researcher is the data for the plot sale, which have
been registered as a sale deed or agreement. These are the only
types of registration under which land is actually sold. In this
respect the data reflect land transactions that include;
(i) Plot size,
(ii) Declared price of the plot (also known as registered
price or the consideration money)
(iii) Valuation price as assessed by the officials of the
revenue department,
Page 33
Page | 206
(iv) Date of presentation of registry papers in the land
registration office/ tehsil office (i.e. the date the
transaction occurs)
(v) The date of registration in the land registration /
tehsil office
(vi) Name of the seller and buyer and
(vii) Location of the Plot in the colony.
For research purposes, access to this first level of
information can be obtained easily in a reasonable time14.
The tehsil /land registration office in India also collects the
information confidentially at the so called second level. These
contain explanatory details of each property transaction as cited
in the confidential report of the earlier mentioned first level. The
second level records are extremely voluminous and are
unpublished. Keeping in mind the time limits of the research it
may not be wise to opt for a data collection from the second level
over the confidential records of the first level. In addition, access
to the confidential report of the second level is less assured.
When the purpose of collecting land price information is partly met
by the confidential report of the first level, there seems little
practical gain in investing huge amount of time with the
confidential records of the second level.
Page 34
Page | 207
The third data source consists of open / public records.
This information is unambiguously in the public domain. It is
published data sources and contains city wide estimated land
prices. The main purpose of this information is to minimize the
under valuation of landed property in the registration office / tehsil
office and to raise the revenues. The fixing of these prices at city
level is largely contingent upon changes in land and revenue
policies over a period of time. Since these policies vary from
state to state; comparability of the price with the rate prices
remaining in other state is not straight forward or more
complicated or difficult or impossible. The rate is the minimum
market price of land expressed in terms of Rupees per unit of
land. It is determined on the basis of a sub set of example land
prices as informed by the property developers, colonizers, open
market sale deed and rates of urban development and housing
authorities in the state sector. Even knowing that the actual
market prices are always higher than the prescribed rate, the
latter are city wide kept to the minimum level. The government
has taken the conscious decision to maintain minimum price in
order not to discourage land registration at the concerned office.
Thus, given priority to extend registration rather than technical
accuracy of the land price value. In this way, it is expected that
revenue will be maximized and not lost through the failure to
register land by selling plots on a Power of Attorney basis.
Power of Attorney includes any instruments (not chargeable with
Page 35
Page | 208
a fee under the law relating to court fees for the time being in
force) empowering a specified person to act for and in the name
of person executing it.
Limitations of Land Price Information
The Information of Land Price available from the
confidential records of the Land Registration Office / tehsil office
is rarely intact or complete for every year. It is generally
maintained in hand written basis that are often found by the
researchers to be in a damaged form or illegible condition. It
depends upon the use to which these books / register have been
put, and that is normally contingent upon the number and the
frequency of the transaction of property in a year. It is a general
practice for lawyers, individuals and property developers to
enquire about the basic information of the property before
conveyance.
It is unlikely that the valuation price of each plot will be
shown throughout the confidential records of the first level.
Therefore, the information on the Registrar’s assessment value as
noted in the registers may not always be available. However,
even if sufficient registers were available, the comparability of the
assessment values would be weak in two aspects. The first is that
valuation prices determined before the stipulation of the circle
rates might be inconsistent since these were decided by the Chief
Page 36
Page | 209
Registrar under the Indian Stamp Act Rules. Though the rules are
quite clear for the plot valuation, actual plot valuation in the land
registration office is often quite arbitrary and idiosyncratic. It may
be adjusted so as to provide benefits to all concerned- the valuer,
the appropriator and the buyer. Underassessment of prices in the
land registration office records is almost universal. It is likely to
occur whenever taxation on land transaction is stringent and
particularly where it is high. Underassessment is not common for
the transactions of the state institutions or state based money.
The second reason for a lack of comparability in the data
sources is the addition of one –off statutory reassessments.
These reassessments are rarely applied evenly across the city
and thus affect a small subset of plots in colonies. They do
however, account for significant difference in the circle rates
among colonies, as some include the additional assessments
while others do not. Without an intimate knowledge of the city and
significant amounts of cross checking, it is difficult to control for
plots that have been subject to this assessment.
The records of the first level do not show the proper
address of the seller or buyer of the plot sold. They tell us about
the plot number and the situation on two sides of the plot. Since
the address of the plot owner is not recorded in the first level, it is
hardly possible to cross check the land prices of one plot (as
Page 37
Page | 210
recorded in the first level) to the same plot through a household
survey. Of course, an address can be obtained from the second
level records, but one has to overcome two problems; first, get
access through the officials, and second, the enormous amount of
time required in reviewing these records. Another complication is
that in most cases the plot number does not correspond to the
present house number, ie. Subdivisions are made on different
numbers, and once house are built, the local authorities often
assigns different numbers to the individual houses.
Factors Influencing Land Prices
The following factors determine the land price of urban
area of any country. They are:
a. Locational Advantage: - Whether the particular
land is adjacent to the main road or other important
roads, near to the public utility places constructed by
the urban local bodies/ development authorities /
Municipal corporations at the government cost of the
public exchequer.
b. Land use:- The value of the land significantly
increases as the land use assigned to a piece of
land in the plan changes from low importance to a
higher importance like from public street or park and
open space to a institutional or commercial or
official, etc,. The land owners thus benefit or suffer
Page 38
Page | 211
from the somewhat artificially determined and
externally imposed factors by which they are bound
even without there will.
c. Amenities: - The cost of the land changes from the
provision of infrastructural facilities by the urban
local bodies/ urban developmental authorities or
other service providing agencies in terms of facilities
like road, transport, communication, water supply,
sanitation, electricity, power, etc,.
d. Inherent Value: - It is related to the buildability on
building potential of the land in an urban area.
e. Floor Area Ratio (FAR):- It is an important factor
determining the market value of any land. For
example, if the planning authority increases the
FAR, the market value of the land almost doubles; if
it is increased three times, the market value also
trebles and so on. The owners of the land have no
contribution, whatsoever, that would justify their
appropriating all the benefits arising from the
enhancement of FAR for them.
f. Speculation: - Generally it is called scarcity value.
Whenever the demand is higher than the supply,
speculation arises. The fast rate of growth of
population and the development in urban areas
leads to a migratory movement of the people from
Page 39
Page | 212
rural areas to the cities; the demand for serviced
land perpetually outstrips its supply leading to ever
rising price of land. Whenever there is a scarcity,
there is a speculation and therefore, it would not be
incorrect to conclude that urban land prices include
high degrees of speculative factor.
g. Black market: - There is no secret that black market
value of any piece of land is far more than its value
in the legal market, mainly for exemption of stamp
duty, income, wealth and other taxes. There is thus,
a significant black market component attached to
the market value of urban land, as specified in the
documents in the records of sale transaction.
h. Changes in Interest Rate: - Decline in the interest
rate in the formal banking system is also another
important factor for changes in the price of land. It is
an inverse relation, that is, decline in the interest
rate in the banking system leads to enhancement of
investment in real estates and which in turn
increases the price of land and vice-versa.
i. Recent Developments of Service Sector: - The rapid
growth of Information Technology (IT), Information
Technology Enabled Services (ITES), Business
process Outsourcing (BPO), Special Economic
Zones (SEZ)15, Industrial Parks (IP), Foreign Direct
Page 40
Page | 213
Investment (FDI) and other service industries
handled by the multinational companies require lot
of space in the urban area. These companies are
purchasing the land at a higher rate than the market
forces of demand and supply of land16. This in turn
leads to increase in the price of land.
Thus, number of factors influences the price of urban land
whether it is for residential or commercial or industrial use. In
order to understand the causes as well as providing land for
residential purposes or residence mainly to economically and
socially weaker sections of the society, the policy makers,
academicians, researchers, social scientists, etc, need to know
the average price of land in particular city or area. In this
connection, the Research Scholar has undertaken a study on the
basis of random sample survey, supported by series of
discussions and interactions with the officials at the centre,
Government of National Capital Territory of Delhi, New Delhi
Municipal Council, Municipal Corporation of Delhi, Delhi
Cantonment Board, researchers, academicians, non-
governmental organizations, self help groups, consultants,
property dealers/developers, real estate agents, etc,.
Page 41
Page | 214
The information mentioned in this thesis narrates both
maximum and minimum land prices with the prevailing market
trend. The maximum and minimum land prices have been culled
out on the basis of locational advantage mainly the accessibilities
of various infrastructure facilities and other disadvantages of the
particular locality. The market value of land in Delhi was collected
from the well known real estate agents, their associations and
property dealers with the active co-operation of the Government
of NCT of Delhi, Delhi Development Authority and the like. The
whole area of Delhi was categorized into five zones namely
Central, North, South, East and West zones respectively. The
information regarding study of urban residential land has been
collected from 250 localities spread over five different zones in the
city and in each zone fifty localities covered for the purpose. It
covers both the minimum and maximum land prices of residential
land for six years from 2005 to 2010.
The information regarding the urban residential land price
of Delhi was derived in the units of Rupees per square ft. The
average residential land price of Delhi during 2005-2010 is
presented in Table 6.9.
Page 42
Page | 215
Table 6.9: Market Price of Residential Land in Delhi 2005-2010.
No Years Land Price (Rs./Sq. Mtr)
Minimum Maximum Average
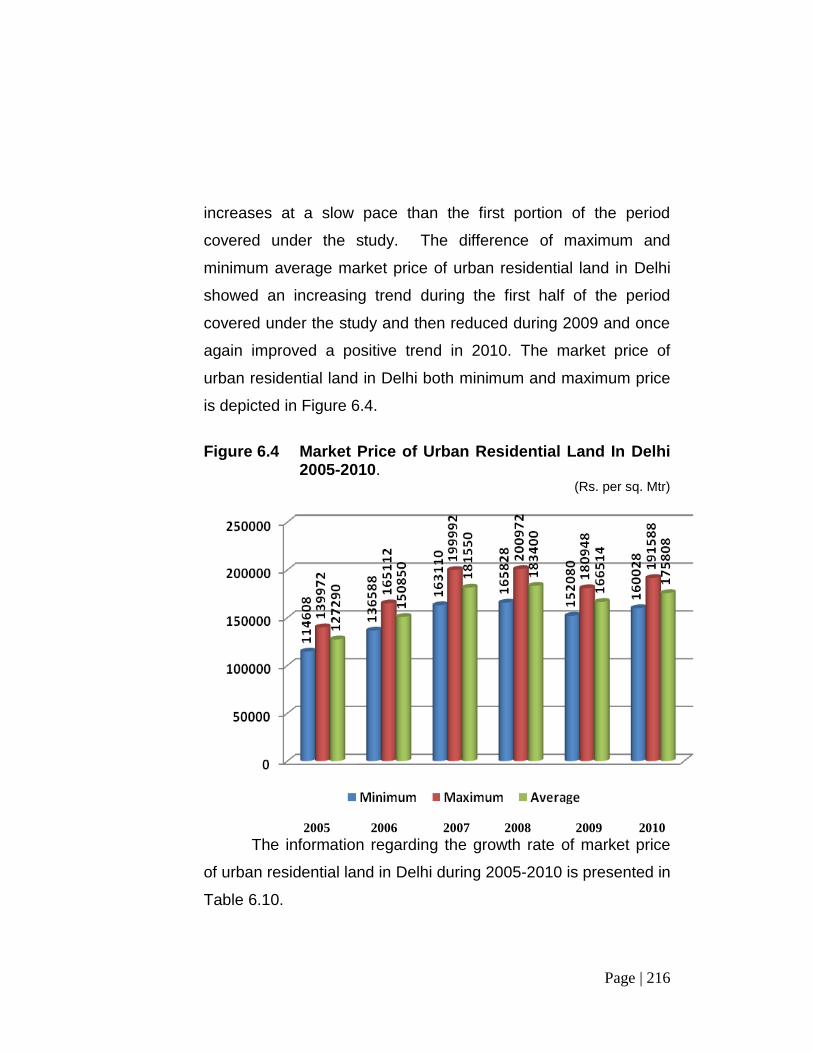
1 2005 114608 139972 127290
2 2006 136588 165112 150850
3 2007 163110 199992 181550
4 2008 165828 200972 183400
5 2009 152080 180948 166514
6 2010 160028 191588 175808
Source: - Field Survey 2010.
It may be observed from Table 6.9 that the average market
price of urban residential land increased from Rs. 127290 per sq.
mtr. in 2005 to Rs. 175808 per sq. mtr in 2010 recording an
annual growth rate of 6.35 per cent. During the same period the
minimum average market price of urban residential land
increased from Rs. 114608 per sq. mtr to Rs. 160028 per sq. mtr
recording an annual growth rate of 6.61 per cent. In the case of
the maximum average market price of residential land annual
growth rate is 6.15 per cent. The market price of urban residential
land in Delhi recorded highest during 2008. Due to economic
slowdown in the world economy, inflationary tendencies and
increase tendencies of prices of yellow metals in the world the
real estate prices showed a declining trend in during 2009. But
the timely intervention of Government and hopes for profit for
investing in real estate sector the prices of residential land
Page 43
Page | 216
increases at a slow pace than the first portion of the period
covered under the study. The difference of maximum and
minimum average market price of urban residential land in Delhi
showed an increasing trend during the first half of the period
covered under the study and then reduced during 2009 and once
again improved a positive trend in 2010. The market price of
urban residential land in Delhi both minimum and maximum price
is depicted in Figure 6.4.
Figure 6.4 Market Price of Urban Residential Land In Delhi
2005-2010. (Rs. per sq. Mtr)
2005 2006 2007 2008 2009 2010
The information regarding the growth rate of market price
of urban residential land in Delhi during 2005-2010 is presented in
Table 6.10.
Page 44
Page | 217
Table 6.10 Growth Rates of Market Price of Residential Land in Delhi.
No Years Growth Rates (Per Cent)
Minimum Maximum Average
1. 2005-06 19.18 17.96 18.51
2. 2006-07 19.42 21.13 20.35
3. 2007-08 1.67 0.50 1.02
4. 2008-09 -8.29 -9.96 -9.21
5. 2009-10 5.23 5.88 5.58
6. 2005-10 39.63 36.88 38.12
Source: - Field Survey 2010.
It may be observed from Table 6.10 that the growth rate of
average market price of residential land in Delhi during 2005-10
was recorded at 37.84 per cent. While the growth rate of average
maximum and minimum market price of residential land in Delhi
were at 36.88 per cent and 39.63 per cent respectively. In
minimum as well as maximum market price of urban residential
land in Delhi the growth in 2008-09 was lowest and recorded
negative growth as compared with the price of urban residential
land during the previous year covered under the study. Analysis
showed the growth of minimum market price of residential land
was the highest in 2006-07 but later on it increased at a lesser
rate and become negative in 2008-09 and once again increased
at a slow pace. Growth rate of maximum market price of
residential land in Delhi was the highest during 2006-07 which
witnessed reducing trend during the later period covered under
Page 45
Page | 218
the study including a negative growth during 2008-09. On an
average market price of residential land in Delhi showed an
increasing trend during 2005-2010; at an average growth rate of
6.35 per cent per annum.
The information regarding the growth of average market
price of urban residential land in Delhi including both minimum
and maximum prices during 2005-10 is depicted in Figure 6.5.
Figure 6.5: Growth of Urban Residential Land in Delhi during 2005-10
(Per Cent)
Page 46
Page | 219
Information regarding the market price of land is vital and is
one of the basic resources. Like any other resources, the
information on market price of land is also available in various
forms. Some people are in possession of it or have access to it
and others need it but do not have it. Those who have it can use
it, waste it, market it or else give it away. But it is useful and
hence its value will remain the same however much it is used; yet
it cannot be destroyed or corrupted. It can be transformed, yet it
remains with the transfer. It is indivisible, yet it can be
accumulated. It has tremendous importance both from the social
and cultural point of view but, on its own, it has been very material
use- its value is tangible only when the information on land prices
in the particular city is used for productive purposes like as a
module for policy formulation, valuation, implementation and
monitoring and evaluation of various policies introduced by the
government from time to time or we can say with other tangible
products. The policy makers, town planners, social scientists,
academicians and researchers dealt with the land price
information on various matters. Thus the information regarding
the land price is major information. There is a wide hierarchy of
needs for such information on land from the point of view of
sovereignty, defence, public safety, protecting the welfare of all
sections of the society.
.
Page 47
Page | 220
Table 6.11 Zone-wise Urban Residential Land Price in
Delhi: 2005-10.
(Rs. Per sq. Mtr)
No Years Central North South East West Total
1 2005
i. Min 238600 61400 153800 48140 71100 114608
ii. Max 278000 84100 182100 61460 94200 139972
iii. Av 258300 72250 167950 54800 82650 127290
2 2006
i. Min 271000 83500 183800 57840 86800 136588
ii. Max 311800 107700 218100 76060 111900 165112
iii. Av 291400 95600 200950 66950 99350 150850
3 2007
i. Min 317300 106100 214900 72140 105110 163110
ii. Max 365500 150600 251400 93360 139100 199992
iii. Av 341400 128350 233150 82750 122100 181550
4 2008
i. Min 319740 106900 225200 69400 107900 165828
ii. Max 370700 145200 261700 88460 138800 200972
iii. Av 345220 126050 243450 78930 123350 183400
5 2009
i. Min 292700 95100 210400 64700 97500 152080
ii. Max 335000 127400 242200 79540 120600 180948
iii. Av 313850 111250 226300 72120 109050 166514
6 2010
i. Min 313540 98220 215880 68700 103800 160028
ii. Max 365920 131860 247920 84540 127700 191588
iii. Av 339730 115040 231900 76620 115750 175808
Source: - Field Survey 2010.
Page 48
Page | 221
As already mentioned Delhi is divided into five zones for
the analysis of market value of land price in the city namely
central, north, east and west zones respectively. The information
regarding the market price of urban residential land in the above
mentioned zones in Delhi during the years 2005-10 is presented
in Table 6.11
It may be observed from Table 6.11 that the highest
average market price of urban residential land in Delhi during the
year 2010 was in Central Zone at Rs.339730 per Sq. Mtr. The
highest minimum and maximum market price of urban residential
land during 2010 was also observed in the same Central zone of
the city at Rs.313540 per sq. Mtr and Rs. 365920 per sq. mtr.
respectively. While the lowest average, minimum and maximum
market price of urban residential land in Delhi during the same
period covered under the study was observed in East Zone of
Delhi at Rs. 76620 per sq. mtr, Rs. 68700 per sq. mtr and
Rs.84540 per sq. mtr. respectively. The lowest and highest
average market price of urban residential land in Delhi during the
initial period covered under the study was also observed in
Central Zone and West Zone at Rs.258300 per sq. mtr and Rs.
54800 per sq. mtr. respectively. The minimum and maximum
market price of urban residential land in Central Zone during 2005
was observed at Rs.238600 per sq. mtr. and Rs. 278000 per sq.
Page 49
Page | 222
mtr. respectively. The minimum and maximum market price of
urban residential land in East Zone during 2005 was observed at
Rs.48140 per sq. mtr and Rs. 61460 per sq. mtr respectively. This
clearly indicates the fact that the development process, all other
basic facilities in East Zone was comparatively lesser and the
future scope for increasing the development activities in this zone
was gloomy. On the contrary the highest market price of urban
residential land in all the period covered under the study showed
highest in Central Zone of Delhi; which in turn implies that the
highest level of infrastructure facilities in the Indian Union. All the
basic facilities are available within in the Central Zone itself. In
addition this zone is the nerve of Indian system; occupies
residences or offices of India’s top political, economic,
representatives of foreign dignitaries, etc. While other zones of
Delhi are having high potential for the growth and development as
compared with other parts of India and the residential prices are
also showed the indicator for the speedy development in these
zones.
The information regarding zone-wise ie. Central, North,
South, East and West Zones growth rates of market price of
urban residential land in Delhi during 2005-b 10n is presented in
Table 6.12.
Page 50
Page | 223
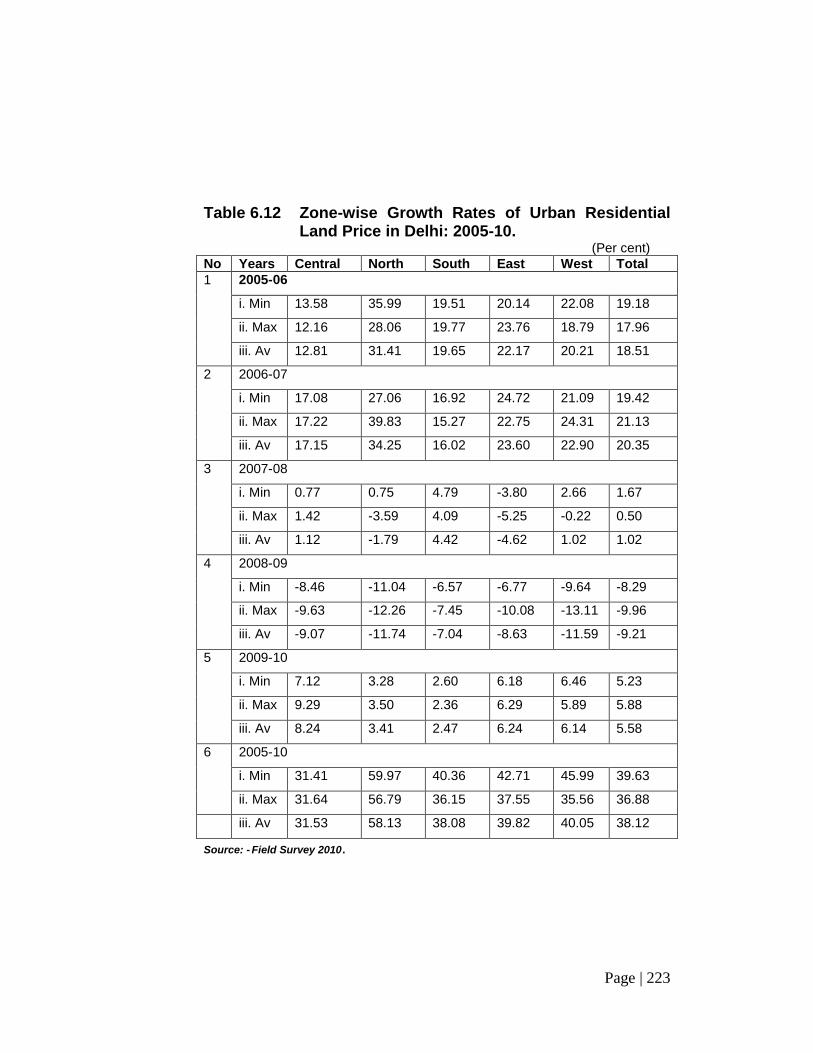
Table 6.12 Zone-wise Growth Rates of Urban Residential Land Price in Delhi: 2005-10.
(Per cent)
No Years Central North South East West Total
1 2005-06
i. Min 13.58 35.99 19.51 20.14 22.08 19.18
ii. Max 12.16 28.06 19.77 23.76 18.79 17.96
iii. Av 12.81 31.41 19.65 22.17 20.21 18.51
2 2006-07
i. Min 17.08 27.06 16.92 24.72 21.09 19.42
ii. Max 17.22 39.83 15.27 22.75 24.31 21.13
iii. Av 17.15 34.25 16.02 23.60 22.90 20.35
3 2007-08
i. Min 0.77 0.75 4.79 -3.80 2.66 1.67
ii. Max 1.42 -3.59 4.09 -5.25 -0.22 0.50
iii. Av 1.12 -1.79 4.42 -4.62 1.02 1.02
4 2008-09
i. Min -8.46 -11.04 -6.57 -6.77 -9.64 -8.29
ii. Max -9.63 -12.26 -7.45 -10.08 -13.11 -9.96
iii. Av -9.07 -11.74 -7.04 -8.63 -11.59 -9.21
5 2009-10
i. Min 7.12 3.28 2.60 6.18 6.46 5.23
ii. Max 9.29 3.50 2.36 6.29 5.89 5.88
iii. Av 8.24 3.41 2.47 6.24 6.14 5.58
6 2005-10
i. Min 31.41 59.97 40.36 42.71 45.99 39.63
ii. Max 31.64 56.79 36.15 37.55 35.56 36.88
iii. Av 31.53 58.13 38.08 39.82 40.05 38.12
Source: - Field Survey 2010.
Page 51
Page | 224
It may be observed from Table 6.12 that the highest growth
rates of market price of urban residential land in Delhi during the
period covered under the study was observed in north zone of
Delhi at 9.69 per cent per annum. The reason behind the fast
growth rates in this zone was due to various reasons such as fast
development during the last decade, opening up of metro
corridors, high level of infrastructure facilities, initiating various
developmental activities such as SEZs, industrial parks etc,.
While the lowest growth rates of market price of urban residential
land in Delhi during the period covered under the study was
observed in central zone at 5.26 per cent per annum. This zone
has already reached the saturated level and the availability of
land in this zone is rare. In addition the cost of land in central
zone of Delhi was comparatively higher than in all other zones in
Delhi and a good percentage of buyers compelled to purchase
the land from other zones. The second, third and fourth positions
of growth of market price of urban residential land in Delhi was
observed in west, east and south zones respectively at 6.68 per
cent, 6.64 per cent and 6.35 per cent per annum respectively
during the period covered under the study.
The highest average market price of urban residential land
in Delhi during the year 2010 was observed in CP Barakhamba
Road and Teen Murti of central zone of Delhi at Rs. 515000 per
sq. mtr. The highest minimum market price of urban residential
Page 52
Page | 225
land in Delhi during the same period was observed in CP
Barakhamba Road of Central Zone of Delhi at Rs. 500000 per Sq.
mtr and highest maximum urban residential land was observed in
Teen Murti of central Zone of Delhi at Rs. 540000 per Sq. mtr.
respectively. On the contrary, the lowest minimum, maximum and
average market price of urban residential land in Delhi during
2010 was recorded in Ghonda of east Zone of Delhi at Rs.18000
per sq. mtr, Rs.32000 per sq. mtr and Rs. 25000 per Sq. mtr
respectively. This clearly indicates the fact that there was a wide
gap of price of urban residential land both minimum and
maximum in Delhi during the period covered under the study. This
may be due to various reasons such as availability of various
infrastructure facilities, speculation of the people for future
development, introduction of metro corridors, state intervention
especially in the introduction of special economic zones, industrial
parks, export oriented units, institutes of high excellence, etc,.
In central zone of Delhi the highest maximum market price
of urban residential land was observed in Teen Murti area at Rs.
540000 per sq. mtr. during the year 2010 while the highest
minimum market price of urban residential land was observed in
CP Barakhamba Road at Rs. 500000 per sq. mtr. The lowest
minimum market price of urban residential land in central zone of
Delhi during 2010 recorded in Yamuna Bazar at Rs. 132000 per
sq. mtr. and lowest maximum market price of urban residential
Page 53
Page | 226
land in Delhi during the same period recorded at Rs. 180000 per
Sq. mtr. in three localities namely Mori Gate, Mandir Marg and
Yamuna Bazar respectively. The lowest average market price of
urban residential land in central zone of Delhi during 2010 was
observed in Yamuna Bazar at Rs. 165000 per sq. mtr.
In north zone of Delhi, the highest maximum market price
of urban residential land during the year 2010 was observed in
Ashok Vihar and Kamala Nagar at Rs. 205000 per sq. mtr and
lowest at Rs.45000 per sq. mtr. in Gandhi Vihar. The highest and
lowest minimum market prices at Rs. 155000 per sq. ft and Rs.
22000 per sq. mtr were observed in Ashok Vihar and Sant Nagar
Burari localities respectively. The highest difference between the
maximum and minimum market price of urban residential land in
northern zone of Delhi was observed in GTB Nagar locality and
lowest at Nirankari Colony during the same period covered under
the study.
In south zone of Delhi, the highest maximum, minimum
and average market price of urban residential land was observed
in Khan Market/ Lodi Colony during the year 2010 at Rs. 452000
per sq. mtr, Rs. 425000 per sq. mtr and Rs. 438500 per sq. mtr.
respectively. The lowest maximum, minimum and average market
price urban residential land in south zone of Delhi was recorded in
Methapur locality at Rs. 55000 per sq. mtr, Rs.45000 per sq.mtr.
Page 54
Page | 227
and Rs.50000 per sq. mtr. respectively during the same period
covered under the study. The highest difference between the
maximum and minimum market price of urban residential land in
this zone was observed in Vasant Vihar at Rs. 105000 per sq.
mtr. and lowest of Rs. 5000 per sq. mtr at Tara Apartment
respectively.
The highest maximum, minimum and average market price
of urban residential land in east zone of Delhi during the year
2010 was observed in Preet Vihat at Rs. 255000 per sq. mtr, Rs.
215000 per sq.mtr and Rs. 235000 per sq. mtr. respectively. On
the other hand the lowest minimum, maximum and average
market price of urban residential land was recorded at Rs. 18000
per sq. mtr, Rs. 32000 per sq.mtr. and Rs. 25000 per sq.mtr. in
Ghonda locality and this is lowest recorded market price of urban
residential land in entire Delhi. The difference between the
maximum and minimum market price of urban residential land
recorded highest in Karkardumma at Rs. 43000 per sq. mtr. and
lowest in three localities namely Pandav Nagar, Shasthri Nagar
and Wazirabd at Rs. 5000 per sq. mtr.
The information regarding the market price of urban
residential land both minimum and maximum price of 250
selected localities during 2005- 2010 is presented in Annexure 1.
The information regarding the price range-wise market price of
Page 55
Page | 228
urban residential land in Delhi during the year 2010 is presented
in Table 6.13.
Table 6.13: Price Range-wise Distribution of Localities in
Delhi during 2010. No Price Range(Rs. Per sq.mtr) No. of Localities
Minimum Maximum
1. Up to 74999 52 (20.80) 31 (12.40)
2. 75000-149999 98 (39.20) 86 (34.40)
3. 150000-224999 32 (12.80) 49 (19.60)
4. 225000-299999 29 (11.60) 26 (10.40)
5. 300000+ 39 (15.60) 58 (23.20)
Total 250 (100.00) 250(100.00)
Source: - Field Survey 2010. Note: Figures in parenthesis relate to percentage to total.
It may be observed from Table 6.13 that three fifth of the
localities, the minimum price was up to Rs. 149999 per sq. mtr.
during the last period covered under the study .ie. in 2010. While
the remaining three price range-wise classification, the highest
number of localities lies in the range of above Rs. 3 lakh per sq.
mtr. at 15.6 per cent. The other two ranges contribute 12.8 per
cent and 11.6 per cent of the price of localities. On the other hand
the maximum price, the highest percentage of localities land price
was in the Near about one fourth of the localities maximum
market price of urban residential land was in the highest price
range of Rs. 3 lakh per sq. mtr. or more. Like-wise the lowest
price range category had less number of localities in maximum
land price and this constituted on 12.40 per cent of the total
Page 56
Page | 229
localities covered under the study. The information regarding the
distribution of land price of Delhi on the basis of price-range
during 2010 is depicted in Figure 6.6
Figure 6.6: Price Range-wise Distribution of Localities in Delhi during 2010.
The information regarding the distribution of land price of
Delhi on the basis of price-range during 2005-2010 is presented
in Table 6.14.
Page 57
Page | 230
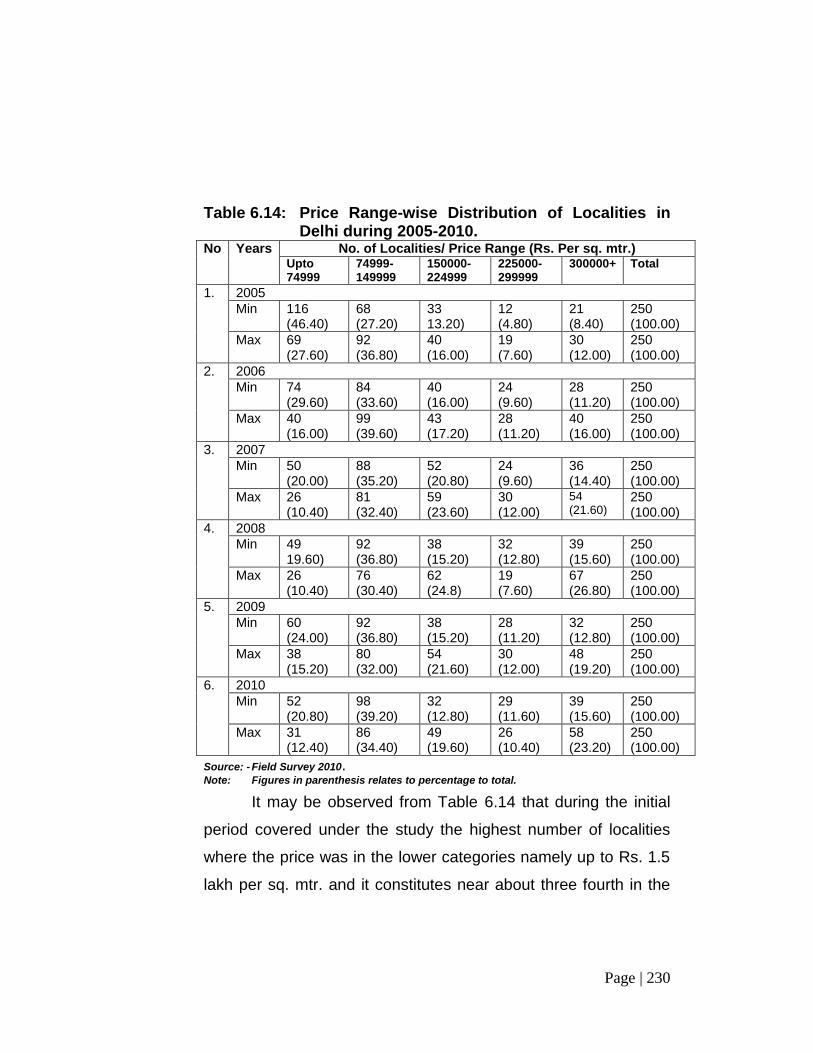
Table 6.14: Price Range-wise Distribution of Localities in Delhi during 2005-2010.
No Years No. of Localities/ Price Range (Rs. Per sq. mtr.) Upto 74999
74999-149999
150000- 224999
225000- 299999
300000+ Total
1. 2005
Min 116 (46.40)
68 (27.20)
33 13.20)
12 (4.80)
21 (8.40)
250 (100.00)
Max 69 (27.60)
92 (36.80)
40 (16.00)
19 (7.60)
30 (12.00)
250 (100.00)
2. 2006
Min 74 (29.60)
84 (33.60)
40 (16.00)
24 (9.60)
28 (11.20)
250 (100.00)
Max 40 (16.00)
99 (39.60)
43 (17.20)
28 (11.20)
40 (16.00)
250 (100.00)
3. 2007
Min 50 (20.00)
88 (35.20)
52 (20.80)
24 (9.60)
36 (14.40)
250 (100.00)
Max 26 (10.40)
81 (32.40)
59 (23.60)
30 (12.00)
54 (21.60)
250 (100.00)
4. 2008
Min 49 19.60)
92 (36.80)
38 (15.20)
32 (12.80)
39 (15.60)
250 (100.00)
Max 26 (10.40)
76 (30.40)
62 (24.8)
19 (7.60)
67 (26.80)
250 (100.00)
5. 2009
Min 60 (24.00)
92 (36.80)
38 (15.20)
28 (11.20)
32 (12.80)
250 (100.00)
Max 38 (15.20)
80 (32.00)
54 (21.60)
30 (12.00)
48 (19.20)
250 (100.00)
6. 2010
Min 52 (20.80)
98 (39.20)
32 (12.80)
29 (11.60)
39 (15.60)
250 (100.00)
Max 31 (12.40)
86 (34.40)
49 (19.60)
26 (10.40)
58 (23.20)
250 (100.00)
Source: - Field Survey 2010. Note: Figures in parenthesis relates to percentage to total.
It may be observed from Table 6.14 that during the initial
period covered under the study the highest number of localities
where the price was in the lower categories namely up to Rs. 1.5
lakh per sq. mtr. and it constitutes near about three fourth in the
Page 58
Page | 231
case of minimum market prices and near about two third in the
case of maximum market prices. As a general tendency, as time
passed the market price of land in Delhi has affected economic
slowdown of the international scenario the prices of land had also
affected a decreasing tendency and later part of the period
covered under study showed a recovery phase of the economy.
During the last year covered under the study the minimum prices
of localities below the rate of Rs. 1.5 lakh per sq. mtr. constituted
just one half of the total localities covered under the study. This
clearly indicates the positive relation of increase the prices of
residential land in Delhi. The same in the case of maximum prices
during the last period showed at 46.8 per cent. The information
regarding price range wise distribution of localities in Delhi during
2005-10 is depicted in Figure 6.7.
Figure 6.7: Price Range-wise Distribution of Localities in
Delhi 2005-2010
Page 59
Page | 232
Table 6.15: Zone-wise, Price Range-wise Distribution of Localities in Delhi during 2005-2010
No Years/ Zones
Number of Localities/ Price Range (Rs. Per sq. mtr.)
Upto 74999
74999-149999
150000- 224999
225000- 299999
300000+ Total
Min Max Min Max Min Max Min Max Min Max Min Max
1 2005
central - - 7 - 18 14 10 13 15 23 50 50
North 39 21 10 24 1 5 - - - - 50 50
South 5 4 23 14 14 19 2 6 6 7 50 50
East 42 35 8 15 - - - - - - 50 50
West 30 9 20 39 - 2 - - - - 50 50
Total 116 69 68 92 33 40 12 19 21 30 250 250
2 2006
central - - - - 13 6 17 13 20 31 50 50
North 21 10 22 30 7 9 - - - - 50 50
South 4 2 13 7 18 18 7 14 8 9 50 50
East 35 23 15 23 - 4 - - - - 50 50
West 14 5 34 39 2 6 - - - - 50 50
Total 74 70 84 99 40 43 24 28 28 40 250 250
3 2007
central - - - - 8 3 13 8 29 39 50 50
North 13 4 23 22 14 17 - 7 - - 50 50
South 2 1 8 7 22 14 11 14 7 14 50 50
East 30 20 15 24 5 5 - 1 - - 50 50
West 5 1 42 28 3 20 - - - 1 50 50
Total 50 26 88 81 52 59 24 30 36 54 250 250
4 2008
central - - - - 3 2 17 3 30 45 50 50
North 9 2 32 21 9 25 - 2 - - 50 50
South 2 1 7 6 18 11 14 12 9 20 50 50
East 34 22 10 21 6 6 - 1 - - 50 50
West 4 1 43 28 2 18 1 1 - 2 50 50
Total 49 26 92 76 38 62 32 19 39 67 250 250
5 2009
central - - 1 - 7 5 18 12 24 33 50 50
North 10 6 39 24 1 20 - - - - 50 50
South 2 1 8 7 22 14 10 16 8 12 50 50
East 37 25 9 16 4 8 - 1 - - 50 50
West 11 6 35 33 4 7 - 1 - 3 50 50
Total 60 38 92 80 38 54 28 30 32 48 250 250
6 2010
central - - 1 - 3 3 16 5 30 42 50 50
North 10 5 39 24 1 21 - - - - 50 50
South 2 1 9 7 18 10 12 19 9 13 50 50
East 33 23 12 18 5 8 - 1 - - 50 50
West 7 2 37 37 5 7 1 1 - 3 50 50
Total 52 31 98 86 32 49 29 26 39 58 250 250
Page 60
Page | 233
The zone-wise, price range wise distribution of localities in
both minimum and maximum market price of urban residential
land in Delhi during 2005-10 is presented in Table 6.15.
It may be observed from Table 6.15 that large number of
localities both in maximum and minimum land price of central and
a few of the south zones were recorded the highest price range.
While other zones in Delhi showed higher percentage of localities
in lowest and next higher price range category.
In order to understand the growth pattern of urban
residential land in Delhi both minimum and maximum price an
attempt has been made to analyze its growth during 2005-2010.
The information regarding the growth of market price of urban
residential land is divided in to six categories namely up to 0 per
cent, 1-25 per cent, 26-50 per cent, 51-75 per cent, 76-100 per
cent and 101 per cent and above respectively. This analysis will
help the policy makers to understand the growth pattern of land
price in Delhi during the period covered under the study and they
can implement various policies or strategies or programmes for
sorting out the problems. The information regarding the
percentage growth of market price of residential land in Delhi both
minimum and maximum during the period covered under the
study is presented in Table 6.16.
Page 61
Page | 234
Table 6.16: Growths Rate-wise Distribution of Localities in Delhi During 2005-2010.
No Growth Rate (per cent) Localities
Minimum Maximum
1. Up to 0 15 (6.00) 16 (6.40)
1. 1- 25 67 (26.80) 76 (30.40)
2. 26-50 66 (26.40) 71 (28.40)
3. 51-75 45 (18.00) 32 (12.80)
4. 76-100 19 (7.60) 33 (13.20)
5. 101+ 38 (15.20) 22 (8.80)
6. Total 250 (100.00) 250 (100.00)
Source: - Field Survey 2010. Note: Figures in parenthesis relates to percentage to total.
It may be observed from Table 6.16 that near about three
fifth of the localities growth rate of minimum price was up to 50
per cent. In the case of maximum price of urban residential land in
Delhi the same price growth rate range up to 50 per cent
constituted at 65.2 per cent. The highest growth rate category of
more than cent per cent constituted comparatively less
percentage of localities; 15.2 in the case of minimum market price
of urban residential land and 8.8 per cent in the case of maximum
urban residential land respectively during the period covered
under the study. A notable fact that negative percentage of
growth rate showed in the urban residential land price of Delhi
both in minimum and maximum price due to the economic
slowdown of in the international scenario and its percentage
recorded during 2005-10 at 6 per cent in the growth category of
Page 62
Page | 235
minimum land price and 6.4 per cent in maximum urban
residential land price respectively. The information regarding
growth rate-wise distribution of localities in Delhi during 2005-
2010 is depicted in Figure 68.
Figure 6.8: Growth Rate-wise Distribution of Localities in Delhi during 2005-2010.
The information regarding the zone-wise growth rate of
market price of urban residential land in Delhi during 2005-10 is
presented in Table 6.17.
Page 63
Page | 236
Table 6.17: Growths Rate-wise & Zone-wise Distribution of Localities in Delhi during 2005-10.
No Growth Rates (%)
Number of Localities
Central North South East West Total
1. Upto Zero
a. Minimum 7 (14.0)
2 (4.0)
2 (4.0)
2 (4.0)
2 (4.0)
15 (6.0)
b. Maximum 6 (12.0)
1 (2.0)
2 (4.0)
4 (8.0)
3 (6.0)
16 (6.4)
2. 1-25
a. Minimum 21 (42.0)
7 (14.0)
15 (30.0)
14 (28.0)
10 (20.0)
67 (26.8)
b. Maximum 17 (34.0)
10 (20.0)
18 (36.0)
11 (22.0)
20 (40.0)
76 (30.4)
3. 26-50
a. Minimum 8 (16.0)
6 (12.0)
15 (30.0)
18 (36.0)
19 (38.0)
66 (26.4)
b. Maximum 14 (28.0)
10 (20.0)
14 (28.0)
20 (40.0)
13 (26.0)
71 (28.4)
4. 51-75
a. Minimum 7 (14.0)
12 (24.0)
7 (14.0)
11 (22.0)
8 (16.0)
45 (18.0)
b. Maximum 1 (2.0)
12 (24.0)
7 (14.0)
5 (10.0)
7 (14.0)
32 (12.8)
5. 76-100
a. Minimum 4 (8.0)
7 (14.0)
- 1 (2.0)
7 (14.0)
19 (7.6)
b. Maximum 9 (18.0)
5 (10.0)
4 (8.0)
9 (18.0)
6 (12.0)
33 (13.2)
6. 101+
a. Minimum 3 (6.0)
16 (32.0)
11 (22.0)
4 (8.0)
4 (8.0)
38 (15.2)
b. Maximum 3 (6.0)
12 (24.0)
5 (10.0)
1 (2.0)
1 (2.0)
22 (8.80)
7. Total
a. Minimum 50 (100.0)
50 (100.0)
50 (100.0)
50 (100.0)
50 (100.0)
250 (100.0)
b. Maximum 50 (100.0)
50 (100.0)
50 (100.0)
50 (100.0)
50 (100.0)
250 (100.0)
Source: - Field Survey 2010. Note: Figures in parenthesis relates to percentage to total.
It may be observed from Table 6.17 that negative growth of
urban residential price in Delhi during the period covered under
Page 64
Page | 237
the study showed at about 6 per cent both in the minimum and
maximum residential land prices of Delhi. The negative growth
during the period covered under the study was due to economic
slowdown, higher interest rate of banks, less level of investment
of people in real estate sector, etc. then the later part of the period
covered under the study showed improvement in the economic
situation that changed the level of prices of urban residential land
in Delhi. This table also showed more than cent percentage
growth of urban residential land prices at 15.2 per cent of
localities in the minimum land price and 8.8 per cent localities in
maximum land price respectively. The pattern of growth in all
zones covered under the study showed a more or less same
character. The information regarding the zone-wise growth of
market price of land in Delhi during 2005-10 is depicted in Figure
6.9.
Figure 6.9: Zone-wise Growth Rate-wise Distribution of Localities in Delhi during 2005-10
Page 65
Page | 238
Table 6.18: Growths Rate-wise & Zone-wise Distribution of Localities in Delhi during 2005-06 to 2009-10 &2005-10.
No Year/ Zones
Number of Localities Upto 0 (%) 1-25 (%) 26-50 (%) 51-75 (%) 76-100 (%) 101 + (%)
Min Max Min Max Min Max Min Max Min Max Min Max
1 2005-06
a. Central 5 5 38 38 5 5 - 2 - - 2 -
b. North 1 2 22 21 15 19 8 5 2 3 2 -
c. South 3 2 25 26 16 18 6 4 - - - -
d. East 4 2 34 30 9 16 3 1 - - - 1
e. West 2 4 32 33 13 10 2 2 1 - - -
f. Total 15 15 151 148 58 68 19 14 3 4 4 1
2 2006-07
a. Central 5 1 33 41 10 6 1 2 1 - - -
b. North 8 2 24 22 8 12 3 4 4 4 3 6
c. South 1 1 38 44 9 2 2 1 - 2 - -
d. East 4 2 26 31 16 11 2 3 2 2 - 1
e. West 1 - 36 31 9 15 4 4 - - - -
f. Total 19 6 157 169 52 46 12 14 7 8 3 7
3 2007-08
a. Central 32 33 10 7 7 8 1 1 - 1 - -
b. North 24 27 19 16 7 5 - 2 - - - -
c. South 18 19 27 23 4 5 1 2 - 1 - -
d. East 37 40 11 7 1 3 1 - - - - -
e. West 25 32 22 14 3 4 - - - - - -
f. Total 136 151 89 67 22 25 3 5 - 2 - -
4 2008-09 a. Central 43 48 7 2 - - - - - - - -
b. North 47 47 2 3 1 - - - - - - -
c. South 45 47 5 3 - - - - - - - -
d. East 42 49 8 1 - - - - - - - -
e. West 44 48 6 2 - - - - - - - -
f. Total 221 239 28 11 1 - - - - - - -
5 2009-10
a. Central - 1 48 47 2 2 - - - - - -
b. North 5 3 45 47 - - - - - - - -
c. South 7 1 43 49 - - - - - - - -
d. East - 1 50 47 - 2 - - - - - -
e. West - - 40 42 9 7 1 1 - - - -
f. Total 12 6 226 232 11 11 1 1 - - - -
6 2005-10
a. Central 7 6 21 17 8 14 7 1 4 9 3 3
b. North 2 1 7 10 6 10 12 12 7 5 16 12
c. South 2 2 15 18 15 14 7 7 - 4 11 5
d. East 2 4 14 11 18 20 11 5 1 9 4 1
e. West 2 3 10 20 19 13 8 7 7 6 4 1
f. Total 15 16 67 76 66 71 45 32 19 33 38 22
Page 66
Page | 239
Growths Rate-wise & Zone-wise Distribution of Localities in
Delhi during 2005-06 to 2009-10 &2005-10 is presented in Table
5.18. It is evident from the table majority of localities land price of
urban residential land both in minimum and maximum during the
years 2007-08 and 2008-09 recorded negative growth as
compared to the previous year. Later part of the period showed a
recovery in the price of urban residential land both minimum and
maximum in Delhi.
In Delhi the highest growth of average land price during
2005-10 recorded at 176.36 per cent in Aruna vihar of the
northern zone. This locality has also recorded the highest growth
in minimum land price during the period covered under the study
at 188.90 per cent. The highest growth of maximum land price in
Delhi during 2005-10 recorded at 166.67 per cent in five localities
of different zones namely Delhi Gate in central zone, Aruna Vihar
in northern zone, Malviya Nagar in southern zone and Usmanpur
and Sonia Vihar of eastern zone respectively. The lowest
percentage of growth of average land price in Delhi during the
same period covered under the study was observed in Inderpuri
of the western zone of Delhi at -82.86 per cent. While the lowest
growth rate of minimum market price of urban residential land
recorded at Indra Nagar of northern zone of Delhi recorded at a
negative growth of 47.50 per cent. The lowest growth rate of
maximum market price urban residential land in Delhi during the
Page 67
Page | 240
period covered under the study was observed in Inderpuri of
western zone at -90 per cent.
In central zone of Delhi the highest growth in the average,
minimum and maximum market price of urban residential land
during 2005-10 was observed at Delhi Gate at 159.26 per cent,
150 per cent and 166.67 per cent respectively. On the other hand
the lowest growth of average market price of urban residential
land in central zone recorded at a negative growth of 9.21 per
cent in Chitra Gupta Road. This locality also recorded the lowest
growth of minimum market price of urban residential land at -
13.69 per cent during the same period. While the lowest growth
of maximum urban residential land recorded at a negative growth
of 5.26 per cent in Mandir Marg locality during the same period.
The same in Chitra Gupta Road recorded at -5.0 per cent.
Already mentioned earlier, the highest growth of average,
minimum and maximum market price of urban residential land
during 2005-10 in northern zone of Delhi recorded in Aruna Vihar
at 176.36 per cent, 188.90 per cent and 166.67 per cent
respectively; and it was the highest recorded growth in all the
zones of Delhi. The lowest growth of average, minimum and
maximum market price of urban residential land in the same zone
was recorded at Indra Nagar at -46.86 per cent, 47.50 per cent
Page 68
Page | 241
and -46.32 per cent during the same period covered under the
study.
The highest average, minimum and maximum price of
urban residential land in southern zone of Delhi during the period
covered under the study was observed in Malaviya Nagar. The
percentages are 152.94 per cent, 137.50 per cent and 166.67 per
cent respectively. The lowest growth of average and maximum
market price of urban residential land in southern zone of Delhi
during the same period was observed in Shivalik locality at -31.90
per cent and -86.52 per cent respectively. The percentage growth
of minimum market price of Shivalik locality during the same
period was recorded at 34.21 per cent. While the lowest negative
growth of minimum market price of urban residential land in
southern zone of Delhi was recorded at -1.92 per cent in Vasant
Vihar.
The highest percentage growth of average, minimum and
maximum market price of urban residential land in eastern zone
of Delhi during 2005-10 recorded in Usmanpur at 170 per cent,
175 per cent and 166.67 per cent respectively. The same growth
of maximum market price of urban residential land at 166.67 per
cent also recorded in Sonia Vihar during the same period covered
under the study. The lowest average, minimum and maximum
Page 69
Page | 242
market price recorded in Johripur at -21.67 per cent, -12.0 per
cent and -28.57 per cent respectively.
In western zone the highest average, minimum and
maximum market price of urban residential land during the period
covered under the study recorded in Raja Garden locality at
132.61 per cent, 138.46 per cent and 125.0 per cent respectively.
On the contrary, the lowest average and maximum growth of
market price of urban residential land in western zone of Delhi
recorded in Inderpuri locality at -82.86 per cent and -90.0 per
cent. While the same locality showed a positive growth of
minimum market price of urban residential land recorded at 10 per
cent during the same period covered the study. The lowest growth
of minimum market price of urban residential land western zone of
Delhi during the same period covered under the study was
observed a negative growth in Mohan Garden at -8.33 per cent.
The information regarding the zone-wise market price of
urban residential land in Delhi including the average, minimum
and maximum during 2005-10 is presented in Annexure 1a, 1b,
1c, 1d and 1e respectively. Like-wise the information regarding
zone-wise growth rate of market price of urban residential land in
Delhi minimum, maximum and average during 2005-2010 is
presented in Annexure. 2a, 2b, 2c, 2d and 2e respectively.
Page 70
Page | 243
Assuming the market value of urban residential land during
the year 2005 as 100, called index of land prices, the residential
land price index of both minimum and maximum of market price of
urban residential land in Delhi during 2005-2010 is presented in
Table 6.19.
Table 6.19: Residential Land Price Index of Delhi during
2006-10. (Base Year 2005= 100)
No Price Index 2006 2007 2008 2009 2010
1. Minimum 119.18 142.32 144.69 132.70 139.63
2. Maximum 117.61 142.88 143.58 129.27 136.88
3. Average 118.51 142.63 144.08 130.81 138.12
Source: - Field Survey 2010. It may be observed from Table 6.19 that minimum land
price indices were higher than the maximum land price indices
during the period covered under the study except in 2007. During
the year, 2007 the difference was negligibly less at 0.56. The
land price indices of Delhi shows that the growth rate in the initial
years covered under the study was comparatively higher, then
reduced and later period once again increased at a slow pace
than the initial period. Thus, the study clearly showed the fact
that the land price in Delhi had increased at a slower rate, is a
good indication for investors investing their money in real estate
business and property. The information regarding zone-wise
residential land price indices of Delhi during 2006-10 is presented
in Table 6.20.
Page 71
Page | 244
Table 6.20: Zone-wise Residential Land Price Index of Delhi During 2006-10.
(Base Year 2005= 100)
No Price Index /
Zones
2006 2007 2008 2009 2010
1. Central
a. Minimum 113.58 132.98 134.01 122.67 131.41
b. Maximum 112.16 112.16 131.47 120.50 131.63
c. Average 112.81 132.17 133.65 121.51 131.53
2. North
a. Minimum 135.99 172.80 174.50 154.86 159.97
b. Maximum 128.06 179.07 172.65 151.49 156.79
c. Average 132.32 177.65 174.46 153.98 159.22
3. South
a. Minimum 119.51 139.73 146.42 136.80 140.36
b. Maximum 120.21 138.06 143.71 133.00 136.15
c. Average 119.65 138.82 144.95 134.74 138.08
4. East
a. Minimum 120.15 149.85 144.16 134.40 142.71
b. Maximum 123.76 151.90 143.93 129.42 137.55
c. Average 122.17 151.00 144.03 131.61 139.82
5. West
a. Minimum 122.08 147.83 151.76 137.13 145.99
b. Maximum 118.79 147.66 147.34 128.03 135.56
c. Average 120.21 147.73 149.24 131.94 140.05
6.
Total
a. Minimum 119.18 142.32 144.69 132.70 139.63
b. Maximum 117.61 142.88 143.58 129.27 136.88
c. Average 118.51 142.63 144.08 130.81 138.12
Source: - Field Survey 2010.
Page 72
Page | 245
It may be observed from Table 6.20 that the land price
indices of Delhi north zone during the period covered under the
study were higher than the land price indices of all other zones.
The north zone of Delhi showed the fact that the land price
indices increased every year as compared with the previous year
except during the year 2008. The information regarding the land
price index of all localities covered under the study (zone-wise) is
presented in Annexure-3a, 3b, 3c, 3d and 3e respectively.
In order to understand the trends in land prices in Delhi an
attempt has been made and the technique of Least Square
Arithmetic Straight Line Trend17 has been used. This analysis is
useful for predicting the land prices in future if all the conditions
remain the same. For this, trend analysis has been made on
average, minimum and maximum market price of urban
residential land in Delhi during 2005-2010. Its details are
presented in Table 6.21, 6.22 and 6.23 (average, minimum and
maximum) respectively.
Y= a+bx
Where a= ∑Y∕ n, n means number of observations
b= ∑XY∕ ∑(X2)
x= means number of years for fitting trends.
a= 985412/6= 164235.33
b= 145716/ 17.50 = 8326.63
Page 73
Page | 246
Table 6.21: Trends in Average Market Price of Residential Land in Delhi
No Years X X2 Y XY
1. 2005 -2.5 6.25 127290 -318225
2. 2006 -1.5 2.25 150850 -226275
3. 2007 -0.5 0.25 181550 -90775
4. 2008 0.5 0.25 183400 91700
5. 2009 1.5 2.25 166514 249771
6. 2010 2.5 6.25 175808 439520
Total 0.00 17.50 985412 145716
Therefore, average market price of residential land in Delhi
during the year 2008 was around Rs. 168398.65 per sq. mtr. If all
the conditions remain the same average market price of urban
residential land in Delhi is increasing at Rs. 8326.63 per sq. mtr.
per annum during the period covered under the study. That
means it is expected that the average market price of urban
residential land in Delhi will reach Rs. 226685.06 per sq. mtr
during 2015. The information regarding the minimum market price
of residential land in Delhi is presented in Table. 6.22.
Table 6.22: Trends in Average Minimum Market Price of Residential Land in Delhi
No Years X X2 Y XY
1. 2005 -2.5 6.25 114508 -286270
2. 2006 -1.5 2.25 136588 -204882
3. 2007 -0.5 0.25 163110 -81555
4. 2008 0.5 0.25 165828 82914
5. 2009 1.5 2.25 152080 228120
6. 2010 2.5 6.25 160028 400070
Total 0.00 17.50 892142 138397
Page 74
Page | 247
Y= a+bx
a= 892142/6= 148690.33
b= 138397/17.50= 7908.4
Then average minimum price during the year 2008 was
around Rs. 152644.53 per sq. mtr. If all the conditions remain the
same the average minimum market price of urban residential land
in Delhi is increasing at Rs. 7908.4 per sq. mtr. per annum during
the period covered under the study. That means it is expected
that the average minimum market price of urban residential land
in Delhi will reach Rs. 208003.33 per sq. mtr. during 2015. The
information regarding the maximum market price of residential
land in Delhi is presented in Table. 6.23.
Table 6.23: Trends in Average Maximum Market Price of
Residential Land in Delhi. No Years X X
2 Y XY
1. 2005 -2.5 6.25 139972 -349930
2. 2006 -1.5 2.25 165112 -247668
3. 2007 -0.5 0.25 199912 -99956
4. 2008 0.5 0.25 200972 100846
5. 2009 1.5 2.25 180948 271422
6. 2010 2.5 6.25 191588 478970
Total 0.00 17.50 1078504 153684
Y= a+bx
a= 1078504/6= 179750.67
b= 153864/17.50= 8781.94
Page 75
Page | 248
Then average maximum price during 2008 was around Rs.
184141.64 per sq. mtr. If all the conditions remain the same the
average maximum market price of urban residential land in Delhi
is increasing at Rs. 8781.94 per sq. mtr. per annum during the
period covered under the study. That means it is expected that
the average maximum price of urban residential land in Delhi will
reach Rs. 245615.22 per sq. mtr. during 2015.
Comparison between Circle Rates & Market Price of Residential Land
One of the main sources of revenue of the state
government is through fixing the land price for the purpose of
stamp duties. In order to discourage the tax evasion it is
imperative that the price of the land for levy of stamp duty
purposes is arrived at considering all the factors mainly location
advantages, infrastructure accessibility by the concerned officials
like village, officials of the sub Registrar offices, patwaris , etc. A
general thinking is that market price of land was always higher
than that of the actual recorded or officially recorded price of land.
Officials of the concerned authorities especially land stamps and
duty officials in Land Revenue Department recorded the
prevailing market value of land take in to account all the possible
factors especially the accessibility of infrastructure facilities,
location etc. But the intensity of development of urban areas in
Delhi the circle rates fixed by the Government has always been a
Page 76
Page | 249
lesser one. Every time Government has enhanced the circle rates
at high rate. But actual prevailing market is always higher than the
circle rates.
In Delhi, officials of the concerned department classified
the circles into eight categories take in to account all possibilities
of advantage factors, physical infrastructure facilities, etc and they
have not classified maximum and minimum prices. The classified
circles are A,B,C,D,E,F,G and H respectively18. Commonly they
revised the existing circle rates once in a year. The information
regarding the circle rates in Delhi during 2011 and proposed
revised rate during November 2011 is presented in Table. 6.24.
Table 6.24: Existing Circle Rates and Proposed Circle Rates (November 2011) in Delhi.
(Rs. per Sq. ft)
No Circles Existing Proposed in November 2011
1. A 86000 215000
2. B 68200 136400
3. C 54600 109200
4. D 43600 87200
5. E 36800 47840
6. F 32220 38640
7. G 27400 31510
8. H 13800 15870
Source: Land Revenue Department, Government of NCT of Delhi.
Page 77
Page | 250
In order to find out the difference between the market price
as well as government recorded circle rates, the Research
Scholar have collected the information regarding the government
recorded circle rates of selected localities in Delhi from the Land
Revenue Department, Government of National Capital Territory of
Delhi. In this connection an attempt has been made to compare
the market price of land and the government recorded circle rates
of 33 localities of Delhi covering all circles. The information
regarding the difference between market price and government
recorded circle rates during the year 2011 is presented in Table
6.25.
Table 6.25: Comparison between the Average Market Price
& Government Circle Rates of Residential Land. (Rs. Sq. Mtr)
No Market Price Government Circle Rates Difference
1. 136924 49936 86988
Sources: - 1. Field Survey 2010. 2. Land Revenue Department, GNCTD.
It may be observed from Table 6.25 that the government
recorded price of land was lesser than the market price of land in
selected localities of Delhi. The government recorded circle rate
of Delhi was lesser than the actual prevailing market price of
urban residential land. The main reasons for higher market price
of urban residential land in Delhi due to the influence of real
estate development of private players, speculation among the
property developers, speculative nature of needy demand people
Page 78
Page | 251
that the rise in price of land in the near future and high fast
development as compared with other metros in India. The
present market price of urban residential land in Delhi was higher
than the circle rates by 1.74 times. So the government
intervention is very essential to enhance the circle rates, other-
wise it may leads to a loss in the public exchequer.
The highest difference between the market price of urban
residential land and circle rates of Delhi during the current year
was recorded in Chitaranjan Park (CR Park) at 505.87 per cent.
On the contrary the lowest difference between the market price of
urban residential land and circle rate during the same period was
recorded in Pandv Nagar at 131.91 per cent. The information
regarding the market price and government circle rates of land in
selected localities during the current year is presented in
Annexure 4.
Commercial Land Prices
In order to examine the realistic picture of urban land in
any area, the price of commercial land plays an important role for
assessing the land price in the city. Generally commercial areas
are located in the central business area of the city or core area,
which in turn leads to an exorbitant price of the commercial land.
These commercial areas have all types of accessibilities like
infrastructure facilities and others. In order to examine the
Page 79
Page | 252
commercial land prices in Delhi, the Research Scholar collected
the information regarding the commercial land prices in 50
selected localities. The information regarding the commercial land
prices in Delhi during 2005-2010 is presented in Table 6.26.
Table 6.26: Market Price of Commercial Land in Delhi During 2005-2010.
(Rs. per Sq Ft)
No Years Minimum Maximum Average
1. 2005 7550 8962 8266
2. 2006 8242 9738 8990
3. 2007 9630 11328 10479
4. 2008 11004 12904 11954
5. 2009 12500 14446 13473
6. 2010 13756 16088 14922
Source: - Field Survey 2010.
It may be observed from Table 6.26 that the commercial
land price in Delhi increased from Rs. 8266 per sq. ft in 2005 to
Rs. 14922 per sq. ft in 2010. During the same period the minimum
market price of commercial land in Delhi increased from Rs. 7550
per sq. ft to Rs.13756 per sq. ft. The difference between the
maximum and minimum market price of commercial land in Delhi
was also showed an increasing trend from Rs. 1412 in 2005 to
Rs. 2332 in 2010; the highest during 2010 and lowest in the initial
period of 2005. The average annual percentage growth of market
price of commercial land in Delhi was arrived at 13.42 per cent
Page 80
Page | 253
while the annual percentage growths of minimum and maximum
commercial land price were derived at 13.70 and 13.19 per cent
respectively. The commercial land price in Delhi during 2000-05 is
depicted in Figure 6.10.
Figure 6.10: Commercial Land Prices in Delhi 2005-10.
The information regarding the growth rate of commercial
land prices in Delhi during 2005-2010is presented in Table 6.27.
Table 6.27: Growth Rates of Market Price of Commercial Land in Delhi.
No Years Growth Rates (Per Cent)
Minimum Maximum Average
1. 2005-06 9.17 8.42 8.76
2. 2006-07 16.84 16.33 16.56
3. 2007-08 14.27 13.91 14.08
4. 2008-09 13.60 11.95 12.71
5. 2009-10 10.05 11.37 10.75
6. 2005-10 82.20 79.11 80.52
Source: - Field Survey 2010.
2005 2006 2007 2008 2009 2010
Page 81
Page | 254
It may be inferred from Table 6.27 that the lowest growth
rate of market price of commercial land in Delhi had been
observed during 2005-06 at 8.67 per cent and highest during
2007-08 at 16.56 per cent. The highest growth rate of market
price of commercial land in Delhi during initial during 2006-07
covered under the study was due to speculation but at later stage
it did not increase as such and reached slightly downward
direction. In general, the growth rate of maximum market price of
commercial land was slightly less than the minimum market price
of commercial land in Delhi 2005-2010. The information regarding
the growth rates of commercial land prices in Delhi is depicted in
Figure 6.11.
Figure 6.11: Growth Rates of Commercial Land Prices in
Delhi 2005-10. (per cent)
Page 82
Page | 255
The highest average, minimum and maximum market price
of commercial land in Delhi during 2010 was observed in Joshi
Road, karol Bagh at Rs. 40250 per sq. ft, Rs. 38000 per sq. ft and
Rs. 42500 per sq. ft respectively. On the other hand the lowest
average, minimum and maximum market price of commercial land
in Delhi during 2010 was observed Acharaya Niketan, Mayur
Vihar at Rs.1150 per sq. ft, Rs. 1100 per sq. ft and Rs. 1200 per
sq. ft respectively. The information regarding the market price
commercial land in Delhi including both minimum and maximum
prices during 2005-10 is presented in Annexure 5.
The highest growth rate of average, minimum and
maximum market price of commercial land prices in Delhi during
2005-10 was observed in Adarsh Nagar Shopping Complex at
47.73 per cent per annum, 41.67 per cent per annum and 52.78
per cent per annum respectively. On the other hand, lowest
growth was recorded in Acharaya Niketan, Mayur Vihar in
average, minimum and maximum commercial land prices during
2005-10. Only one locality in study showed this negative growth
of commercial land prices. The lowest recorded growth of
average, minimum and maximum commercial land prices at 77
per cent, 75.56 per cent and 78.18 per cent during the period
covered under the study. The main reason for lowest and
negative growth in the said locality means less chance of
commercial activities, majority of the commercial activities in the
Page 83
Page | 256
initial period covered under the study already shifted to other
nearby localities where the chance for commercial activities have
a good future. The information regarding the growth rate of
market price of commercial land prices in Delhi both minimum and
maximum during 2005-2010 is presented in Annexure 6.
Assuming the market value of commercial land during the
year 2005 as 100, called index of land prices, the commercial
land price index of both minimum and maximum of market price of
commercial land in Delhi during 2005-2010 is presented in Table
6.28 and the details regarding the same is presented in Annexure
7.
Table 6.28: Commercial Land Price Index of Delhi during
2006-10. (Base Year 2005= 100)
No Price Index 2006 2007 2008 2009 2010
1. Minimum 109.17 127.55 145.75 165.56 182.20
2. Maximum 108.42 126.12 143.67 160.83 179.11
3. Average 108.76 126.77 144.62 162.99 180.52
Source: - Field Survey 2010.
In order to understand the trends in commercial land prices
in Delhi an attempt has been made by using the technique of
Least Square Arithmetic Straight Line Trend. This analysis is
useful for predicting the commercial land prices for future if all
the conditions remain the same. For this, trend analysis has been
Page 84
Page | 257
made on average market price of commercial land in Delhi during
2005-2010. The detail is presented in Table 6.29.
Table 6.29: Trends in Average Market Price of Commercial
Land in Delhi No Years X X
2 Y XY
1. 2005 -2.5 6.25 8266 -20665.00
2. 2006 -1.5 2.25 8990 -13485.00
3. 2007 -0.5 0.25 10479 -5239.50
4. 2008 0.5 0.25 11954 5977.00
5. 2009 1.5 2.25 13473 20209.50
6. 2010 2.5 6.25 14922 37305.00
Total 0.00 17.50 68084 24102
Y= a+bx
Where a= ∑Y∕ n, n means number of observations
b= ∑XY∕ ∑(X2)
x= means number of years for fitting trends.
a= 68084/6 = 11347.33
b= 24102/ 17.50 = 1377.26
Therefore, average market price of commercial land in
Delhi during 2008 was around Rs. 12035.96 per sq. ft. If all the
conditions remain the same, average market price of urban
commercial land in Delhi is increasing at Rs. 1377.26 per sq. ft
per annum during the period covered under the study. That
means it is expected that the average market price of urban
Page 85
Page | 258
commercial land in Delhi will reach Rs. 21676.78 per sq. ft during
2015.
Industrial Land Prices
For assessing the real land price scenario of a city the
information regarding the land price of industrial area plays a vital
role. Development of cities is linked with the development of
industrial activities, physical conditions, work, employment
opportunities, etc,. Now majority of the heavy and large scale
industrial units are set up in the peripheral areas of the city, the
government also tries to resettle the age old traditional polluting
industrial units from the urban area primarily due to the health
related issues and with the development of new satellite towns
and various measures, government tries to reduce the size of
population especially in the case of mega cities. Majority of our
cities have faced multiple and serious problems like lack of all
kinds of basic facilities, lack of funds for providing the required
level of infrastructure facilities, etc. In Delhi, the Government of
National Capital Territory of Delhi tries to convince the dynamic
entrepreneurs, companies, internationally renowned institutions to
invest in selected industrial pockets where the required level of
infrastructure is available at the least cost19. In this connection the
Research Scholar collected the information regarding industrial
land prices in 40 selected localities of Delhi during the field visit.
Page 86
Page | 259
The information regarding industrial prices in selected localities of
Delhi during 2005-10 is presented in Table 6.30.
Table 6.30: Market Price of Industrial Land in Delhi During
2005-2010. (Rs. per Sq Mtr)
No Years Minimum Maximum Average
1. 2005 4630.00 5660.00 5145.00
2. 2006 5460.00 6587.50 6023.75
3. 2007 6167.50 7607.50 6887.50
4. 2008 6350.00 7815.00 7082.50
5. 2009 6655.00 8195.00 7425.00
6. 2010 7512.50 9312.50 8412.50
Source: - Field Survey 2010.
It may be observed from Table 6.30 that the market price
of industrial land in Delhi increased from Rs.5145 per sq. mtr in
2005 to Rs. 8412.50 per sq. mtr in 2010. The difference between
the minimum and maximum market price of industrial land in Delhi
increased from 1030 in 2005 to 1800 in 2010. This indicates the
fact that the market price of industrial land in Delhi increased at a
slowly positive level. The information regarding the growth rate of
industrial land market prices in Delhi during 2005-2010 is
presented in Table 6.31.
It may be inferred from Table 6.31 that the annual growth
rate of market price of industrial land in Delhi during the period
covered under the study was observed at 10.59 per cent. The
Page 87
Page | 260
annual growth rate of market price of maximum industrial land
was higher than minimum market price of industrial land in Delhi
during the same period which was observed at 0.38 per cent. The
growth rate market price of industrial land in Delhi during the initial
period covered under study showed highest at 17.08 per cent.
This is same in the case of minimum and maximum market prices
of industrial land in Delhi. During the middle period of the study,
the growth of market price of industrial land in Delhi showed a
reducing trend and recorded lowest during 2007-08 at 2.83 per
cent. This is due to the economic slowdown and the impact of
globalization, a good number of multinational companies showed
a retarded trend in investing especially in the set up of industrial
units. But in 2008-09 the recovery process starts and later period
showed the trend of positive growth.
Table 6.31: Growth Rates of Market Price of Industrial Land
in Delhi No Years Growth Rates (Per Cent)
Minimum Maximum Average
1. 2005-06 17.93 16.39 17.08
2. 2006-07 12.96 15.48 14.34
3. 2007-08 2.96 2.73 2.83
4. 2008-09 4.80 4.86 4.84
5. 2009-10 12.89 13.64 13.30
6. 2005-10 62.26 64.53 63.51
Source: - Field Survey 2010.
Page 88
Page | 261
The information regarding the growth rate of industrial land
prices in Delhi during 2000-2005 is depicted in Figure6.12.
Figure 6.12: Growth Rates of Industrial Land Prices in Delhi 2005-10
(Per cent)
The highest minimum maximum and average market price
of industrial land in Delhi during 2010 was observed in Nariana
Industrial Area at Rs. 15000 per sq.mtr Rs.20000 per sq. mtr and
Rs. 17500 per sq. mtr respectively. The lowest minimum,
maximum and average market price of industrial land in Delhi
during 2010 was recorded in Karwal Nagar at Rs. 1500 per sq.
mtr, Rs. 2500 per sq. mtr and Rs. 2000 per sq. mtr respectively.
The information regarding the market price of industrial land in
and around Delhi both minimum and maximum during 2000-2005
is presented in Annexure 8.
Page 89
Page | 262
The highest growth rate of market price of industrial land in
Delhi during 2005-10 was observed in Dr. Lohia Industrial Area at
243.75 per cent. The minimum and maximum market price of
industrial land in Delhi during the same period was also observed
in the same industrial locality at 316.67 per cent and 200 per cent
respectively. On the other hand the lowest growth of market price
industrial land in Delhi during the same period was observed in
Khyala Industrial Area at 33.33 per cent. This locality also showed
the lowest minimum and maximum market price of industrial land
at the same per cent. i.e. 33 per cent The information regarding
the percentage growth of market price of industrial land in Delhi
during 2005-2010 both minimum and maximum is presented in
Annexure. 9.
Assuming the market value of industrial land during the
year 2005 as 100, called index of land prices, the industrial land
price index of both minimum and maximum of market price of
industrial land in Delhi during 2005-2010 is presented in Table
6.32 and the details regarding the same is presented in Annexure
10.
Page 90
Page | 263
Table 6.32: Industrial Land Price Index of Delhi during 2006-10.
(Base Year 2005= 100)
No Price Index 2006 2007 2008 2009 2010
1. Minimum 117.93 133.21 137.15 143.74 162.26
2. Maximum 116.39 134.41 138.07 144.79 164.53
3. Average 117.08 133.87 137.66 144.31 163.51
Source: - Field Survey 2010.
In order to understand the trends in industrial land prices in
Delhi an attempt has been made by using the technique of Least
Square Arithmetic Straight Line Trend. This analysis is useful for
predicting the industrial land prices for future if all the conditions
remain the same. For this, trend analysis has been made on
average market price of industrial land in Delhi during 2005-2010.
The detail is presented in Table 6.33.
Table 6.33: Trends in Average Market Price of Industrial
Land in Delhi No Years X X
2 Y XY
1. 2005 -2.5 6.25 5145.00 -12862.50
2. 2006 -1.5 2.25 6023.75 -9035.63
3. 2007 -0.5 0.25 6887.50 -3443.75
4. 2008 0.5 0.25 7082.50 3541.21
5. 2009 1.5 2.25 7425.00 11137.50
6. 2010 2.5 6.25 8412.50 21031.25
Total 0.00 17.50 40976.50 10368.08
Y= a+bx
Where a= ∑Y∕ n, n means number of observations
Page 91
Page | 264
b= ∑XY∕ ∑(X2)
x= means number of years for fitting trends.
a= 40976.50/6 = 6829.42
b= 10368.08/ 17.50 = 592.46
Thus, average market price of industrial land in Delhi
during 2008 was around Rs. 7125.65 per sq. mtr. If all the
conditions remain the same, average market price of urban
industrial land in Delhi is increasing at Rs. 592.46 per sq mtr per
annum during the period covered under the study. That means it
is expected that the average market price of urban industrial land
in Delhi will reach at Rs. 11272.87 per sq. mtr during 2015.
Rental Scenario in Delhi Rental prices in cities are one of the main factors for
influencing the urban land prices in urban areas of the world.
There is a direct relationship between the rental prices and
residential land prices. Due to the development of industries,
mainly small and medium industries, urbanization, fast
development of tertiary sector especially in information technology
and information technology enabled services, various policies
introduced by the government from time to time like special
economic zones, tourism zones, education zones, industrial
growth centers, industrial parks, etc, income of the people in Delhi
increased which had multiplied effects and created a profit
hunting rental business among the landlords. Thus, landlords
having land at core area in the cities constructed houses and
Page 92
Page | 265
rented them at maximum rate and it became a steadily growing
business. The main reason behind the demand for rental housing
was the large scale of migration of educated and technically
qualified persons from other cities or rural areas, who are not
having enough money to afford the exorbitant cost of housing and
were compelled to stay in rental houses within the city20. A
general tendency is that the rental rate is increasing annually. In
order to know the rental rates in Delhi, information was collected
from 18 selected localities. The commercial rent rate is also
increasing in most of the areas. Due to the large demand of
commercial spaces especially due to the opening up of new
outlets of multinational companies in Delhi, the rent rate of
commercial areas increased at a speedy rate. For assessing the
rent rates in Delhi, the Research Scholar collected the information
regarding residential rent rates of sixty selected localities and fifty
localities commercial rent rates during 2007-2011. The
information regarding the rent rates of commercial and residential
purposes in Delhi both minimum and maximum during 2007-2011
is presented in Table 6.34.
It may be observed from Table 6.34 that the residential rent
rates in Delhi increased from Rs. 17.72 per sq. ft in 2007 to Rs.
28.95 per sq. ft in 2011 recorded an annual growth rate at 12.68
per cent. The percentage growth of minimum residential rent rates
in Delhi was higher than the maximum residential rent rates
during the period covered under the study and it increased at 2.67
Page 93
Page | 266
per cent per annum. The same period the commercial rent rates
in Delhi increased from Rs. 20.48 per sq. ft in 2007 to Rs. 35.65
per sq. ft in 2011. Like-wise the residential rent rates, the
percentage growth of minimum commercial rent rate was
outweighs the maximum commercial rent rates during the same
period covered under the study and the difference was worked
out at 3.58 per cent per annum.
Table 6.34: Rent Rates in Delhi During 2007-2011.
(Rs. per Sq ft) No Years/ Purpose Minimum Maximum Average
1. 2007
a. Residential 14.12 21.32 17.72
b. Commercial 17.24 23.72 20.48
2. 2008
a. Residential 17.38 25.07 21.23
b. Commercial 22.36 28.68 25.52
3. 2009
a. Residential 19.10 27.09 23.50
b. Commercial 24.94 31.58 28.26
4. 2010
a. Residential 21.32 30.63 25.98
b. Commercial 28.74 35.80 32.27
5. 2011
a. Residential 24.20 33.70 28.95
b. Commercial 31.80 39.50 35.65
Source: - Field Survey 2010.
Page 94
Page | 267
The information regarding the growth rates rent rates of
Delhi during 2007-11 is presented in Table 6.35.
Table 6.35: Growth Rates of Rent Rates in Delhi: 2007-2011. (Per cent)
No Years/ Purpose Minimum Maximum Average
1. 2007-08
a. Residential 23.14 17.59 19.80
b. Commercial 29.70 20.91 24.61
2. 2008-09
a. Residential 9.88 11.30 10.72
b. Commercial 10.34 10.11 10.21
3. 2009-10
a. Residential 11.61 9.80 10.53
b. Commercial 15.24 13.36 14.19
4. 2010-11
a. Residential 11.91 9.10 11.45
b. Commercial 10.65 10.34 10.47
5. 2007-2011
a. Residential 71.43 58.09 63.41
b. Commercial 84.45 66.53 74.07
Source: - Field Survey 2010.
It may be observed from Table 6.35 that that the growth
rates rent both commercial and residential during 2008-09 was
recorded lowest during the period covered under the study. This
is due to economic slowdown of the economy. After that some
recovery starts the growth rates of residential was showed higher
than the commercial rent rates in Delhi during the period covered
under the study.
During the year 2011 the highest residential rent was
observed at Aurangazeb Road at Rs. 88.50 per sq. ft. This locality
is also showed the highest maximum and minimum residential
Page 95
Page | 268
rent rates during the same period covered under the study at Rs.
81 per sq. ft and Rs. 96 per sq. ft respectively. The growth rates
of residential rent during the period covered under the study
showed highest in Barakhamba at 155.17 per cent. This locality
also recorded the maximum and minimum residential rent rate
growths at 140 per cent and 188.89 per cent respectively. On the
other hand the lowest growth recorded in Janpath at 35.50 per
cent; minimum at 47.62 per cent and maximum at 27.69 per cent
respectively during the period covered under the study. The
information regarding the residential rent rates of sixty selected
localities in Delhi during 2007-2011 both minimum and maximum
is presented in Annexure 11. The growth rates of residential rents
in these selected localities during the abovementioned period
covering minimum and maximum presented in Annexure 12.
In 2011 the highest market commercial rent in Delhi was
recorded in Nehruplace at Rs. 55 per Sq. ft. This locality also
showed the highest maximum and minimum commercial rent in
Delhi during the same period covered under the study at Rs. 60
per sq. ft and Rs. 50 per sq. ft respectively. While the lowest
commercial rent at Rs. 17.50 per sq. ft is recorded in four
localities in Delhi and they are Vikas Marg, Karkodama, Acharya
Niketan-Mayrur Vihar and Nirman Vihar respectively. These
localities also recorded the lowest minimum and maximum
commercial rent in Delhi during the period covered under study at
Page 96
Page | 269
Rs. 15 per sq. ft and Rs. 20 per sq. ft respectively. During 2007-
2011 the highest growth rate of commercial rent in Delhi recorded
at 128.57 per cent in New Rajender Nagar. This locality also
recorded the highest minimum and maximum growth rate of
commercial rent in Delhi during the period covered under the
study at 133.33 per cent and 125 per cent respectively. On the
contrary the lowest growth rate of commercial rent in Delhi during
2007-2011 recorded in Joshy Road- Karol Bagh at 28.57 per cent.
This locality also recorded the lowest minimum and maximum
growth rate of commercial rent in Delhi during the same period at
33.33 per cent and 25 per cent respectively. The information
regarding commercial rent rates of selected localities in Delhi
during 2007- 2011 including the minimum and maximum is
presented in Annexure 13. The growth rates of commercial rent in
Delhi during 2007 to 2011 covering both the minimum and
maximum commercial rent is presented in Annexure 14.
Market Price of Apartments
Population in India is increasing at annual rate of 1.76 per
cent as per 2011 census. The increasing population not only
needs jobs but also needs housing and other basic amenities.
With the inception of economic liberalization during 1990’s most
of the industries especially medium and small were set up in most
of the urban areas in the country. Hence large chunk of educated
and technically qualified population is migrating to these cities in
Page 97
Page | 270
search of employment thereby creating a demand for housing in
cities. This massive urban population will put great pressure on
agricultural land near the developing medium sized cities. Medium
and hi-rise buildings are coming up to cope up with rapid
urbanization. Land is scarce and need is to build hi-rise buildings
in greater number in these cities. Delhi is also facing the same
level of situation.
The advantage of constructing apartment system is that it
will be easier to provide network of services, transport, community
services, open space and other amenities21. Development of
construction technology has made vertical expansion in housing
more economically viable as a solution for the large chunk of
middle income households. The study examines the market price
of apartments in 50 localities spread over the city. The information
regarding the market price of apartments in Delhi during 2007-11
is presented in Table 6.36.
Table 6.36: Market Price of Apartments in Delhi 2007-11.
(Rs. per Sq ft)
No Years Minimum Maximum Average
1. 2007 4460 5670 5065
2. 2008 5424 6576 6000
3. 2009 6194 7386 6790
4. 2010 6440 7780 7110
5. 2011 7180 8810 7995
Source: - Field Survey 2010.
Page 98
Page | 271
It may be observed from Table 5.36 that the market price
of apartment in Delhi increased from Rs. 5065 per sq. ft in 2007 to
Rs. 7995 per sq. ft in 2011. During the same period the minimum
market price of flats in Delhi increased from Rs. 4460 per sq. ft in
2007 to Rs. 7180 per sq. ft in 2011. While maximum market price
of apartments during the same period increased from Rs. 5670
per sq. ft tot Rs. 8810 per sq. ft. During the year 2011 the highest
market price of apartments in Delhi was observed in Lajpat Nagar
at Rs. 17500 per sq. ft. The higher market rate of apartment in
this area due to various factors such as accessibility of various
infrastructure facilities, locational advantages, others factors. This
area also recorded the highest minimum and maximum market
price of apartments during the same period at Rs. 15000 per sq. ft
and Rs. 20000 per sq. ft. On the other hand, the lowest average,
minimum and maximum market price of apartment in Delhi during
the same period was observed in three localities namely Kalkaji,
Omvihar and Madhuvihar at Rs. 3250 per sq. ft, Rs. 3000 per sq.ft
and Rs. 3500 per sq. ft respectively. The information regarding
the market price of apartments in selected localities in Delhi
during 2007-2011 is presented in Annexure 15. The information
regarding the growth rate of market price of apartments in Delhi
during 2007-2011 is presented in Table 6.37.
Page 99
Page | 272
Table 6.37: Growth Rates of Market Price of Apartments in Delhi 2007-11.
(Per cent)
No Years Minimum Maximum Average
1. 2007-08 21.61 15.98 18.46
2. 2008-09 14.20 12.32 13.17
3. 2009-10 3.97 5.33 4.71
4. 2010-11 11.49 13.24 12.45
5. 2007-11 60.99 55.38 57.85
Source: - Field Survey 2010.
The annual growth rate of market price of apartment in
Delhi increased at 11.57 per cent during this period. The annual
growth rate of minimum apartment price was little bit higher than
the maximum market price of apartment by 1.12 per cent. The
lowest growth rate of market price of apartments during 2007-11
is recorded in 2009-10 at 4.71 per cent. The reason for lower
growth rate of market price of apartment during the period is due
to economic slowdown, less investment among the property
developers as well as needy households. After that the recovery
starts and reached a growth rate of market price apartment at
12.45 per cent in 2010-11. The highest growth rate of market
price of apartment in Delhi during 2007-2011was recorded in
Kalkaji at 160 per cent; 200 per cent for maximum and 133.33 per
cent for maximum. During the same period the lowest growth of
market price of apartments among the selected localities in Delhi
was observed in Janakpuri at 28.57 per cent. This area is already
Page 100
Page | 273
developed and further scope for the development especially in the
construction of flats is scarce. The information regarding the
growth rate of apartments among the selected localities in Delhi
during 2007 – 2011 is presented in Annexure 16.
Page 101
Page | 274
References:-
___________________________________ 1. H.R. Birdi, Slum Law and Urbanisation, PP32- 38, 1995.
2. Amitabh Kundu & S Moitra, Access of Urban Poor to Basic
Services, P-P,10-12, 1994.
3. O.P. Mathur, An Analysis in the Changing Perspectives of
Urban Development in India- Challenges for Urban
Development, NIPFP, Ministry of Finance, Government of
India.
4. Compendium on Environment Statistics, 2007, Ministry of
Statistics and Programme Implementation, Government of
India.
5. Report on the Committee on Slum Statistics, Planning
Commission, Government of India.2010.
6. Census of India, Various Issues, Ministry of Home Affairs,
Government of India.
7. Department of Urban Development, Government of
National capital territory of Delhi.
8. 65th Round of National sample Survey, Ministry of Statistics
and Programme Implementation, Government of India
2008-09.
9. Department of Urban Development, Government of
National Capital Territory of Delhi, 2010.
10. Plan Outlay Document, Government of National Capital
Territory of Delhi.
Page 102
Page | 275
11. Jawaharlal Nehru National Urban Renewal Mission,
Ministry of Urban Development, Government of India.
2010.
12. Economic Survey of Delhi 2007-08, Government of NCT of
Delhi.
13. Chennai Land Market Assessment, International Monetary
Fund, 2004,P.3
14. Urban Land Price Scenario, Kolkata, Town and Country
Planning Organisation, Ministry of Urban Development,
Government of India, 2007 .
15. Ministry of Commerce and Industry, Department of
Commerce, Government of India, 2008.
16. Ministry of Commerce and Industry, Department of
industrial Policy and Promotion, Government of India,
2008.
17. B. Gupta, Statistics for Economic Analysis, 1986, P.234.
18. Land and Revenue Department, Government of National
Capital Territory of Delhi, 2010.
19. Industrial Policy of Government of NCT of Delhi, Vision,
2020, P 14.
20. Rent Prices is spiraling in Delhi, Hindu News Paper, 12th
April 2011.
21. Urban Land Price Scenario, Lucknow, Town and Country
Planning Organisation, Ministry of Urban Development,
Government of India, 2004.