A. R. FARU Q I, R. A. CROSS and J. KEN DRICK-JON ES
MRC Laboratory of Molecular Biology, Hills Road, Cambridge CB2 2QH, UK
Summary
Small angle X-ray scattering (SAXS) is a potentially powerful method for obtaining structural information from biological molecules in solution. The use of this technique in the laboratory has hitherto been limited by the long exposures necessary to obtain patterns on photographic film. Multi-wire area detectors, due to their high efficiency and absence of noise, enable patterns to be collected much more rapidly, typically in 1-2 h for a typical protein using laboratory sources. This opens up the possibility of using the technique on a semi-routine basis for a wide variety of problems. We outline the use of SAXS to characterise a large conformational change of myosin.
X-ray scattering from a dilute, mono-disperse solution of particles is the sum of the intensities scattered by all the individual particles, i.e. the shape of the scattering curve relates to a single particle (a comprehensive treatment of the theory and practice of SAXS can be found in Glatter and Kratky, 1982). An important qualification in making such measurements is that the molecules should not have significant amounts of aggregation as the scattering shapes would then be ‘contaminated’ by a scattering contribution from the larger, i.e. wrong, shape. Many biological molecules in solution have been studied with this method to obtain a variety of structural parameters, discussed in greater detail below. The information is at low resolution compared to what can be obtained with protein crystallography, but it is possible to work in solution at near physiological pH and the tedious process of growing single crystals is not necessary. Scattering of X-rays takes place from the electron clouds in the atoms, and proteins have a higher electron density compared to the surrounding medium giving rise to an ‘excess’ of X-ray scattering which constitutes the signal. Electrons from different parts of the molecule act as secondary scatterers of the incident radiation; the interference between the different wavelets results in the characteristic scattering pattern.
function of a parameter, h2, where h is proportional to the scattering angle:
h = 4;rsm0/A, (1)where 28 is the scattering angle, and A is the wavelength of radiation used. Some authors use Q instead of h, especially in neutron scattering. Another useful parameter, s is defined as:
s = 2sin0/A. (2)Both h and s are independent of the wavelength used and have the dimensions of reciprocal angstrom (or nanometers). The radius of gyration is the root mean square distance of the electrons from the centre of gravity of the molecule and is a quantity which is very similar to the moment of inertia of the molecule. Two different shapes can, however, lead to the same radius of gyration, something one has to be aware of! Katoaka et al. (1989) have measured the conformational changes in calmodulin due to melittin binding in the presence and absence of calcium by measuring the radius of gyration of calmodulin and the calmodulin-mellitin complex. The surprising finding was that the radius of gyration decreased from 20.9A for calmodulin to 18.OA for the complex, but only in the presence of calcium. It is suggested that this reduction is due to a change from a ‘dumbbell’ configuration to a more globular form which is spatially less extended. In a similar study on another calcium binding protein, Troponin C, Hubbard et al. (1988) have found that the conformational change in Troponin C on binding calcium is too small to be measured. In terms of accuracy of measurement, one can say that, in general, if the protein is not too sensitive to radiation (and denatures) it is possible to measure radius of gyration of, say 30A to an accuracy of better than 0.5A in a reasonable time in the laboratory (a few hours, or a few minutes at a synchrotron). If the intensity of the direct beam is known, one can also obtain the molecular weight of the protein; alternatively, one can callibrate the intensity by using a protein of similar size and known molecular weight.
Radius o f gyration o f cross-sectionFor molecules which are much bigger in one direction, i.e. are rod-shaped, one can get another useful parameter, the radius of gyration of cross-section which, as the name implies, is a measure of the spatial extent of the crosssectional area and is independent of the length. In order to measure the radius of gyration of cross-section, one needs to measure the slope of the inner portion of the curve showing the relation between \n(Ih) and h2. As in the case discussed above, if the intensity of the direct beam can be measured then it is possible to calculate the mass per unit length of the ‘rod-like’ molecule. Sund et al. (1969) have used this method to study the aggregation o f beef liver
23
glutamate dedydrogenase between concentrations of 1-33 mg ml-1 when the molecular weight increases from 0.5 to 2.0x10®. They found that though the molecular weight increased by a large amount, the radius of gyration of cross-section stayed remarkably constant, suggesting linear aggregation along the long axis without altering the cross-section. In another example (Sperling and Tardieu, 1976), the mass per unit length of the ‘100A’ chromatin fibre was measured to find out the density of the nucleosome core particle along the fibre, in order to decide between two models. The transition of the 100A chromatin fibre to a 300A filament in response to salt changes has also been studied with this technique by Widom (1986) and by Greulich et al. (1987).
Time resolved studiesIt is possible to obtain a greatly increased flux of X-rays from synchrotron radiation making it possible to make time resolved measurements. In ordered systems like muscle, time resolutions of 1 millisecond were achieved some years back (reviewed by Huxley and Faruqi, 1983), but even in solution scattering, where the scattering signal is much weaker, about 100 millisecond time resolutions have been achieved and two examples are discussed below. The assembly and disassembly of microtubule protein caused by temperature changes was studied by Bordas et al. (1983) at the EMBL Outstation in Hamburg. Modelling the intermediate and final states, they were able to establish that microtubule nucleation started at 22 °C and elongation took place between 25-30 °C. The elongation was due mainly to the addition of tubulin subunits and not whole rings. Conversely, disassembly was induced by lowering the temperature and proceeded by removal of subunits. In a separate study on the kinetics of actin polymerisation, Matsudaira et al. (1987) demonstrated the absence of a rate-limiting nucleation step in the salt-induced assembly of actin filaments. Actin filaments were found to be approximately 300A long within about 10 s of initiation.
X-ray studies on myosinMyosin from smooth muscle, certain vertebrate muscle and some non-muscle cells exists in a ‘rolled-up’ configuration where the tail seems to be attached to the neck region and has a sedimentation coefficient of 10 S, compared to 6 S for the unfolded form. In the 10 S state the products of ATP cleavage are trapped by the folding and the enzymatic activity of myosin is greatly reduced; a transition to the 6 S state is probably essential before the monomers can be incorporated into filaments (Cross, 1988). Phosphorylation of the regulatory light chains allows actin activation and inhibits the transition to the 10 S form, biasing the equilibrium towards the unfolded form which can then be assembled into filaments.
We have measured the small angle scattering from both the 6S and the 10 S forms of myosin in the range 350-25A -1 with the aim of defining the scattering signatures and establishing significant differences, if such exist. As this work is still in progress, we are presenting only a small part of the data which has been analysed; data has been compared with modelling studies based on predicted scattering curves derived from ‘expected’ shapes o f the two conformations of myosin. Previous work by Mendelsohn and Wagner (1984) has centred on the shape of the S-l (myosin head) subunit and on single-headed myosin to find if there was a change in the structure of the S-l when not attached to the rod; no significant differences
could be detected. Gorrigos and Vachette (1989) have more recently measured the radius of gyration of S-l as 37A. However, to our knowledge, there has been no study on whole myosin monomers in either the unfolded or folded forms.
The small angle cameraThe small angle camera, consisting of a double focusing mirror arrangement, is set on a fine focus, rotating anode, X-ray generator operating at 2.4 kW; apart from the entrance slits before the first mirror, there are two sets of carefully machined and tantalum-lined slits which collimate the beam accurately and cut out stray radiation (discussed by Widom, 1986). The camera background is extremely low and in our measurements is not corrected for; however, when subtracting buffer scattering from the protein, it is automatically eliminated. The beam path subsequent to the first slit up to the detector is in vacuum except for the specimen which is in air. The ‘specimen to detector’ distance was set to 750 mm for the present set of experiments, which permits data to be recorded from about 350A_1 to about 25A-1. Due to the longer ‘source to mirror’ distance in the horizontal plane, the resolution is in fact better, but as we are circularly averaging the data the poorer resolution is applicable. The scattering pattern is recorded on a multiwire area detector (Faruqi, 1988), 100 mm by 100 mm, filled with a mixture of 90 % xenon and 10 % methane. The efficiency of the detector for 8 keV photons is about 80 % including absorption effects in the 1mm beryllium entrance window. The detector has two cathode planes with delay lines sandwiching an anode plane which only provides the event trigger pulse and pulse height information. Start and stop pulses from the cathode plane are converted to digital form in a time-to- digital converter and combined to form a 16 bit address which is used for incrementing a histogramming memory. The digital electronics, which is in CAMAC, is controlled by a HYTEC Crate Controller and connected to a DEC LSI 11/23 Plus computer which also has a fast data link to a VAX 8600 computer. During an experiment, data is accumulated in the histogramming memory and displayed on a colour monitor using a MATROX driver board along with a linear slice of data selected from the area. Data are transferred to the VAX 8600 on completion of the experiment, where the data is further analysed using a range of programs before being archived. Measurements on detector properties and demonstration of test patterns are given in Faruqi and Andrews (1989).
Data analysis and modelling studies As solution scattering data from molecules with random orientations is isotropic the area detector output data was circularly averaged and the buffer scattering subtracted to leave just the protein contribution. The ‘linear’ data was analysed using a modified version of OTOKO, a general analysis program developed at the EMBL, Hamburg (Koch and Bendall, 1981), to obtain the plots of intensity as a function of scattering angle and measurements of radius of gyration, radius of gyration of cross-section, etc. Comparison of myosin scattering data was made with ‘expected’ scattering curves calculated from model structures for the molecule using the program ATOMIN, a program developed for generating scattering curves from objects using the Debye equations (Bordas et al. 1983, with additions at Daresbury). For the purposes of modelling, myosin was represented by three basic units: a 20A diameter, 1500A long rod with two heads at one end whose
24 A. R. Faruqi et al.
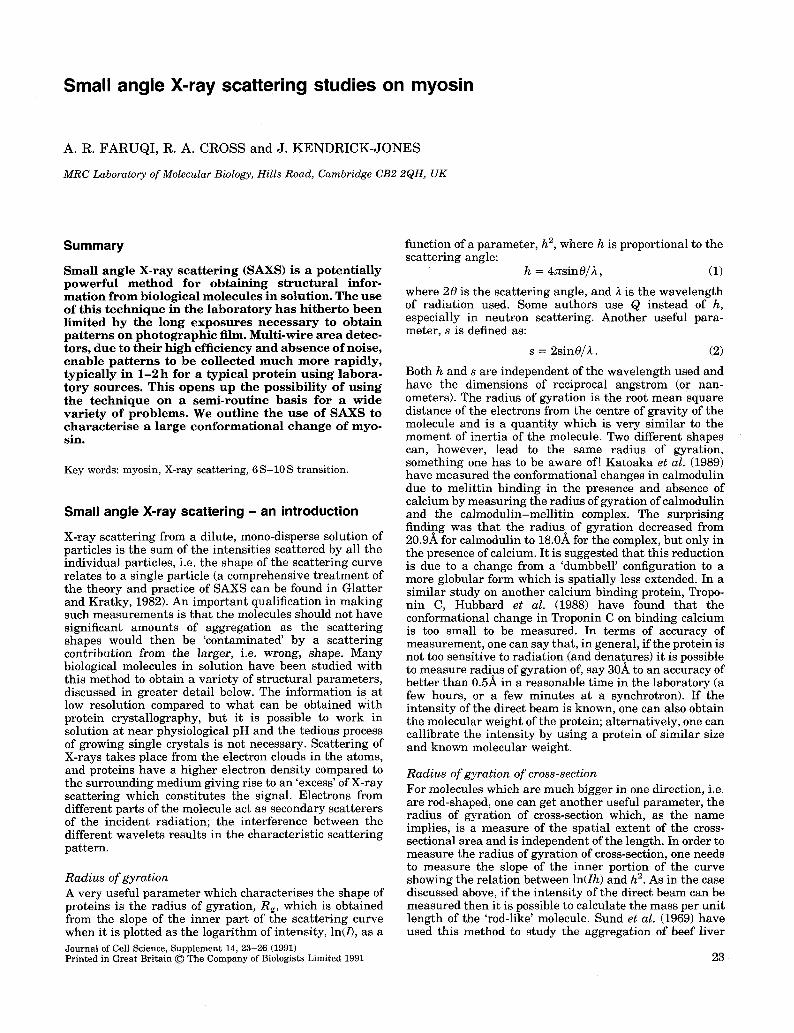
Fig. 1. Model structures composed of small spheres used in the construction of 6 S (A) and 10 S (B) conformations of the myosin molecule.
shape was taken from recent X-ray and electron microscopic data (Winkelman et al. 1985) and shown schematically in Fig. 1A. The maximum length of the head was just over 160A, with a distinct curved region near the thinner end of the head. The radius of gyration of the (model) head is approximately 36A, which is close to the experimentally measured values of 37A for rabbit S-l (Garrigos and Vachette, 1989). The rod was represented by spheres of 20A diameter and the head by 10A diameter spheres, which provides adequate resolution in comparison with the data. The ‘looped’ rod structure and the heads, representing a possible 10 S configuration, are shown in Fig. IB. The diameter of the rod is again 20A and it is 1500A long but, about 1000A from the tail end it is attached to the neck region, as observed by electron microscopy (Cross et al. 1986). In order to quantitate the ‘goodness of fit’ between calculated and measured scattering curves, the calculated curves were first normalised to the measured curves using the total scattered intensity in the region (taken between 250A 1 and 40A_1), followed by a calculation of a simple residual defined as:
Fx2 = weight* ((/obs - / caic )2 ) / N * / o b s , (3)
where w eight=l//QbS-
Results
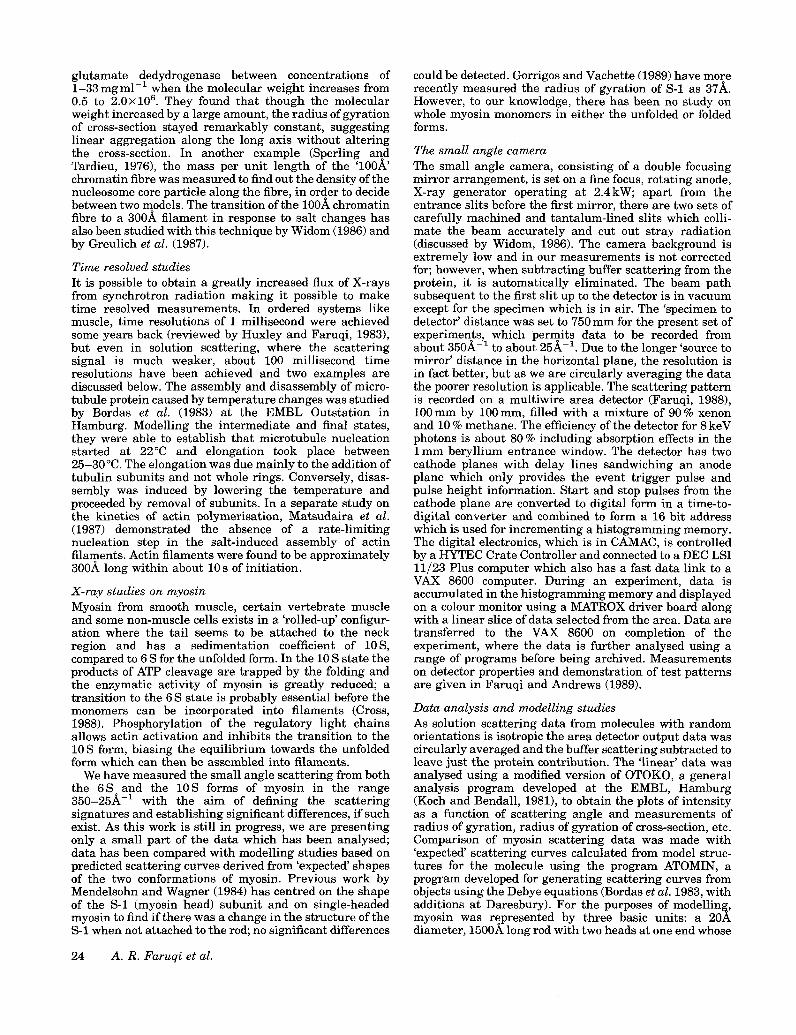
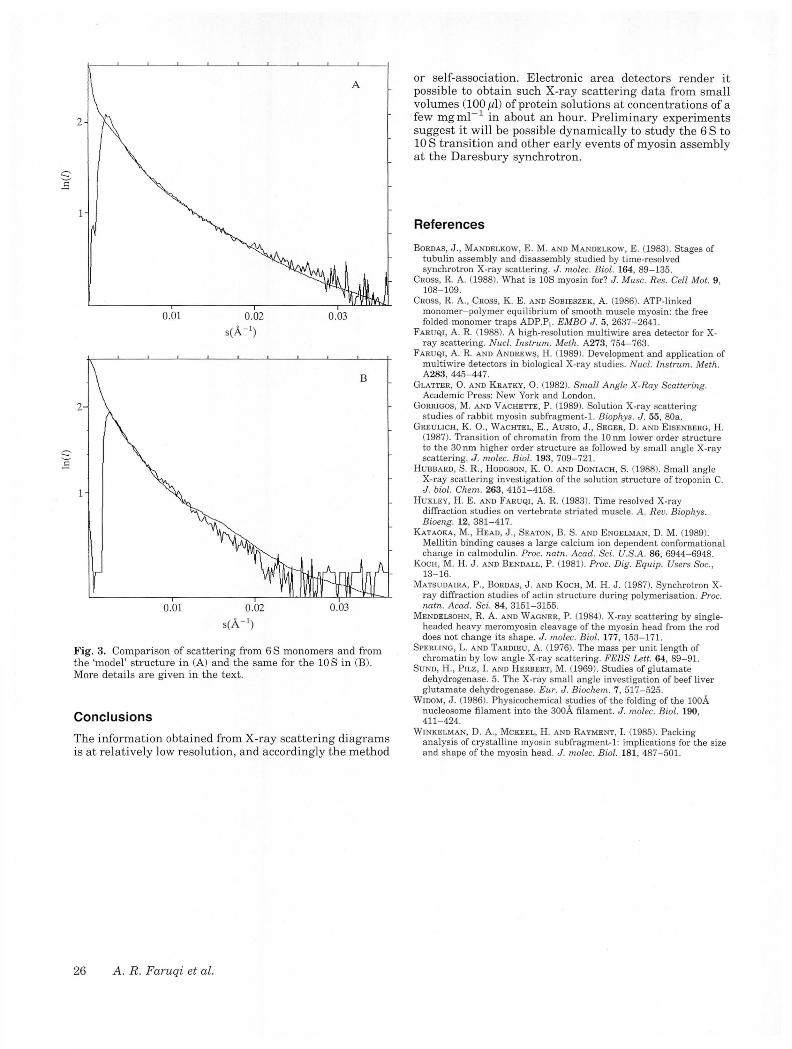
The scattering from myosin in both the 6 S and the 10 S forms is dominated by the two ‘heads’; the ‘rolled-up’ rod does increase the ‘compactness’ of the molecule however, as evidenced by plots of the radius of gyration of crosssection in Fig. 2, which also shows the most striking difference in the shape of scattering from the two forms. The ‘apparent’ radius of gyration of cross-section is about 17A for the 6S and 32A for the 10 S myosin in these preparations. The scattering from the 6S was measured with concentrations ranging from 2 mg ml“ 1 to 25 mg ml“ 1 and the 10S form betwen 2m gm l" to 8m gm l_1, the latter being the highest concentration feasible for the 10 S form for these experiments. The source of 6 S was smooth muscle from chicken gizzard and scallop muscle; all the 10 S was from smooth muscle. We present an example from 6 S and one from 10 S scattering to illustrate the general features of the scattering pattern and to obtain a ‘goodness-of-fit’ estimate with the proposed model. The 6 S scattering curve shown in Fig. 3A is from scallop muscle (see article by Ankrett et al. in this volume) from a 6h exposure and it is compared with the model curve in the same plot. A similar plot for the 10 S form is shown in Fig. 3B from a shorter exposure of 2 h. Again, the model curve is shown in the same plot. The model is derived from the structure described in the previous section. Clearly the 6S model is better than the 10 S model and we are
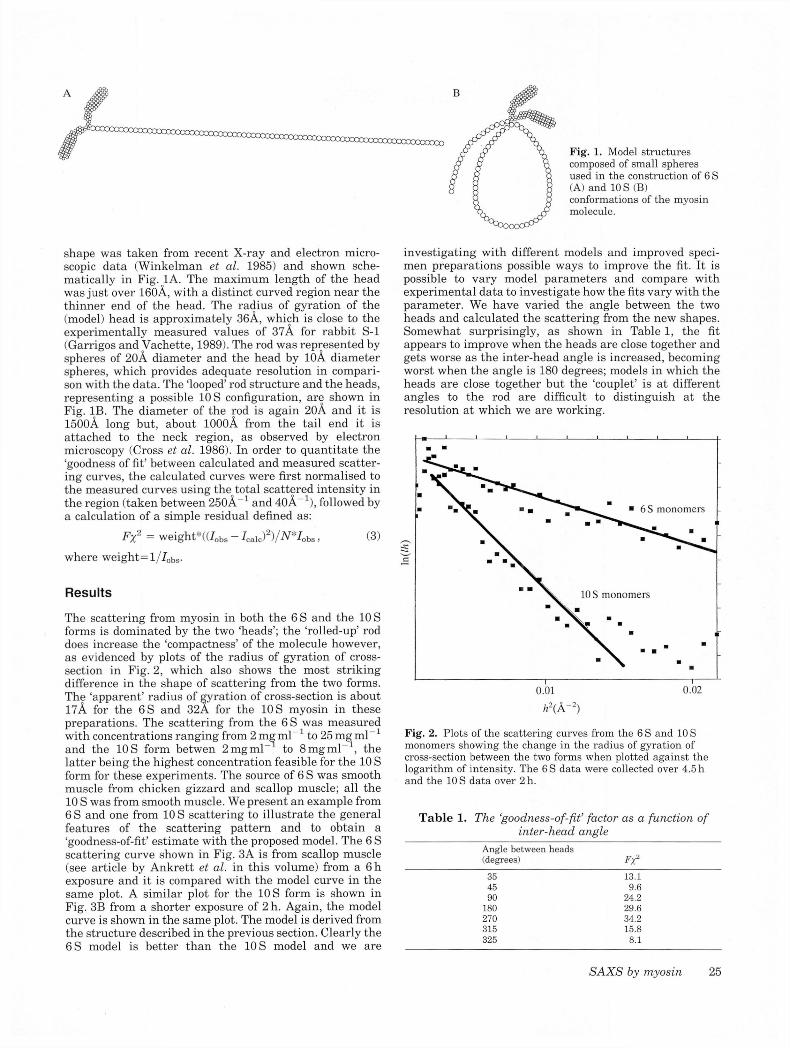
investigating with different models and improved specimen preparations possible ways to improve the fit. It is possible to vary model parameters and compare with experimental data to investigate how the fits vary with the parameter. We have varied the angle between the two heads and calculated the scattering from the new shapes. Somewhat surprisingly, as shown in Table 1, the fit appears to improve when the heads are close together and gets worse as the inter-head angle is increased, becoming worst when the angle is 180 degrees; models in which the heads are close together but the ‘couplet’ is at different angles to the rod are difficult to distinguish at the resolution at which we are working.
h 2( k - 2)
Fig. 2. Plots of the scattering curves from the 6 S and 10 S monomers showing the change in the radius of gyration of cross-section between the two forms when plotted against the logarithm of intensity. The 6 S data were collected over 4.5 h and the 10 S data over 2 h.
Table 1. The ‘goodness-of-fit’ factor as a function o f inter-head angle
Angle between heads (degrees) Fx2
35 13.145 9.690 24.2
180 29.6270 34.2315 15.8325 8.1
SAXS by myosin 25
S Î À - 1)
s(À ')
Fig. 3. Comparison of scattering from 6 S monomers and from the ‘model’ structure in (A) and the same for the 10 S in (B). More details are given in the text.
Conclusions
The information obtained from X-ray scattering diagrams is at relatively low resolution, and accordingly the method
or self-association. Electronic area detectors render it possible to obtain such X-ray scattering data from small volumes (100 f i l ) of protein solutions at concentrations of a few mg ml“ 1 in about an hour. Preliminary experiments suggest it will be possible dynamically to study the 6 S to 10 S transition and other early events of myosin assembly at the Daresbury synchrotron.
References
B o r d a s , J ., M a n d e l k o w , E. M . a n d M a n d e l k o w , E. (1983). Stages of tubulin assembly and disassembly studied by time-resolved synchrotron X-ray scattering. J. molec. Biol. 164, 89-135.
C r o s s , R. A. (1988). What is 10S myosin for? J. Muse. Res. Cell Mot. 9, 108-109.
C r o s s , R. A., C r o s s , K. E. a n d S o b i e s z e k , A. (1986). ATP-linked monomer-polymer equilibrium of smooth muscle myosin: the free folded monomer traps ADP.Pi. EMBO J. 5, 2637-2641.
F a r u q i , A. R. (1988). A high-resolution multiwire area detector for X- ray scattering. Nucl. Instrum. Meth. A273, 754-763.
F a r u q i , A . R. a n d A n d r e w s , H. (1989). Development and application of multiwire detectors in biological X-ray studies. Nucl. Instrum. Meth. A 2 8 3 , 4 4 5 - 4 4 7 .
G l a t t e r , O . AND K r a t k y , O . (1 9 8 2 ). Small Angle X-Ray Scattering. Academic Press: New York and London.
G o r r ig o s , M. a n d V a c h e t t e , P. (1989). Solution X-ray scattering studies of rabbit myosin subfragment-1. Biophys. J. 55, 80a.
G r e u l i c h , K. O., W a c h t e l , E ., A u s io , J., S e g e r , D. a n d E i s e n b e r g , H. (1987). Transition of chromatin from the 10 nm lower order structure to the 30 nm higher order structure as followed by small angle X-ray scattering. J. molec. Biol. 193, 709-721.
H u b b a r d , S. R., H o d g s o n , K. O. a n d D o n i a c h , S. (1988). Small angle X-ray scattering investigation of the solution structure o f troponin C. J. biol. Chem. 263, 4151-4158.
H u x l e y , H . E. a n d F a r u q i , A. R. (1983). Time resolved X-ray diffraction studies on vertebrate striated muscle. A. Rev. Biophys. Bioeng. 12, 381-417.
K a t a o k a , M., H e a d , J., S e a t o n , B. S. a n d E n g e l m a n , D. M. (1989). Mellitin binding causes a large calcium ion dependent conformational change in calmodulin. Proc. natn. Acad. Sci. U.S.A. 86, 6944-6948.
K o c h , M. H. J. a n d B e n d a l l , P. (1981). Proc. Dig. Equip. Users Soc., 13-16.
M a t s u d a i r a , P., B o r d a s , J. a n d K o c h , M . H. J. (1 9 8 7 ). Synchrotron X- ray diffraction studies o f actin structure during polymerisation. Proc. natn. Acad. Sci. 84, 3 1 5 1 - 3 1 5 5 .
M e n d e l s o h n , R. A. a n d W a g n e r , P. (1984). X-ray scattering by singleheaded heavy meromyosin cleavage of the myosin head from the rod does not change its shape. J. molec. Biol. 177, 153-171.
S p e r l i n g , L. a n d T a r d i e u , A. (1976). The mass per unit length of chromatin by low angle X-ray scattering. FEBS Lett. 64, 89-91.
S u n d , H ., P i l z , I. a n d H e r b e r t , M. (1969). Studies of glutamate dehydrogenase. 5. The X-ray small angle investigation of beef liver glutamate dehydrogenase. Eur. J. Biochem. 7, 517-525.
W id o m , J . (1986). Physicochemical studies of the folding of the 100A nucleosome filament into the 300A filament. J. molec. Biol. 190, 411-424.
W i n k e l m a n , D. A., M c k e e l , H. a n d R a y m e n t , I. (1985). Packing analysis of crystalline myosin subfragment-1: implications for the size and shape o f the myosin head. J. molec. Biol. 181, 487-501.