“Small business groups, bank financing and the great recession” Giulio Cainelli, Università degli studi di Padova Valentina Giannini, Università Politecnica delle Marche Enrico Guzzini, Centre for Entrepreneurship and Innovation Donato Iacobucci, Università Politecnica delle Marche 1
Transcript
“Small business groups, bank financing and the great recession”
Giulio Cainelli, Università degli studi di Padova
Valentina Giannini, Università Politecnica delle Marche
Enrico Guzzini, Centre for Entrepreneurship and Innovation
Donato Iacobucci, Università Politecnica delle Marche1
Contents
2
Aims Background Methodology Results Conclusions
Aim of the paper
• The main aim of this paper is to analyse the presence andintensity of bank financial constraints in companiesbelonging to business groups compared to stand-alonecompanies.
• We consider the period 2010-2012 when the financial crisisand the subsequent recession determined a situation ofsevere credit crunch.
• Our focus is on bank financing since it represents the mainexternal source of finance for Italian companies.
3
Aims Background Methodology Results Conclusions
Background
• Previous studies demonstrated that business groups allowaffiliated firms to have an easier access to bank financingcompared to standalone companies (Belenzon, Berkovitz, &Rios, 2013; Iacobucci, 2012; Lee, Park, & Shin, 2009;Samphantharak, 2003).
• Moreover, business groups create an internal capital marketsthat may help controlled companies in case of financialproblems (Fan, Wong, & Zhang, 2005).
• Firms belonging to groups may not only benefit from internalresources but also from the superior ability to raise externalfinancing given the implicit guarantee resulting from groupaffiliation (Gopalan, Nanda, & Seru, 2007).
• Up to now, the literature focused on the internal capital marketrather than latter aspect.
4
Aims Background Methodology Results Conclusions
Background
5
Aims Background Methodology Results Conclusions
• The paper investigates the relationship between these twomechanisms (i.e. internal capital market versus external financing)and whether in collecting external resources the centralization atthe head of the group prevails on the financing of controlledcompanies (decentralization).
• If decentralization is prevalent we expect that controlledcompanies in business groups received a higher amount of bankloans than standalone companies(affiliation effect).
• On the contrary, if centralization in the acquisition on externalfinancing is prevalent, banks prefer financing the head of a groupfor the implicit guarantee deriving from the diversification ofcontrolled companies (portfolio effect). In this case, controlledcompanies will benefit from the internal financing provided by thehead.
Research Hypotheses
6
Aims Background Methodology Results Conclusions
During the financial crisis and the subsequent recession period weexpect to verify the following hypothesis:
• H1: During the financial crisis, firms belonging to businessgroups are expected to show an easier access to bank financing.
Moreover, we investigate which of the two effects, the affiliation orthe portfolio effect, is prevalent.
For this aim, we test the following alternative hypotheses:
• H2a: If the portfolio effect is prevalent, we expect that heads ofgroups are more likely to raise bank financing than affiliatedfirms;
• H2b: If the affiliation effect is prevalent, there should be nodifference in raising bank financing between heads andcontrolled firms.
Data
7
Aims Background Methodology Results Conclusions
• This paper uses a novel dataset of Italian business groups,developed by using ownership information about joint stockcompanies drawn from the AIDA database. This databaseprovides financial and economic information for manufacturingfirms, belonging or not to business groups, for the period 2008-2012.
• Data refer to 155,841 Italian manufacturing joint stockcompanies. Of the latter 28,167 are group firms. This allows us toidentify the map of Italian business groups with at least one oftheir firms in the manufacturing sector.
Data
8
Aims Background Methodology Results Conclusions
• Table 1. List of variables
Variable Description
Bank loans Index of external financing: ratio between bank loans on the total assets
Infra-GroupIndex of internal financing: ratio between the sum of debts towards
controlled and controlling companies and the total assets
GroupDummy variable used to discriminate whether the firm belongs to a group
(1) or not (0)
Head Dummy variable used to discriminate heads of groups from affiliated firms
Age Firm's age at year 2012
Cash-flow Ratio between the sum of net profit and amortization on total assets
Sector Dummies for industry sectors (22 manufacturing sectors)
DistrictDummy variable used to discriminate whether the firm belongs to an
industrial district (1) or not (0)
Firm size Logarithm of the employees of the firm (year 2008)
Methodology
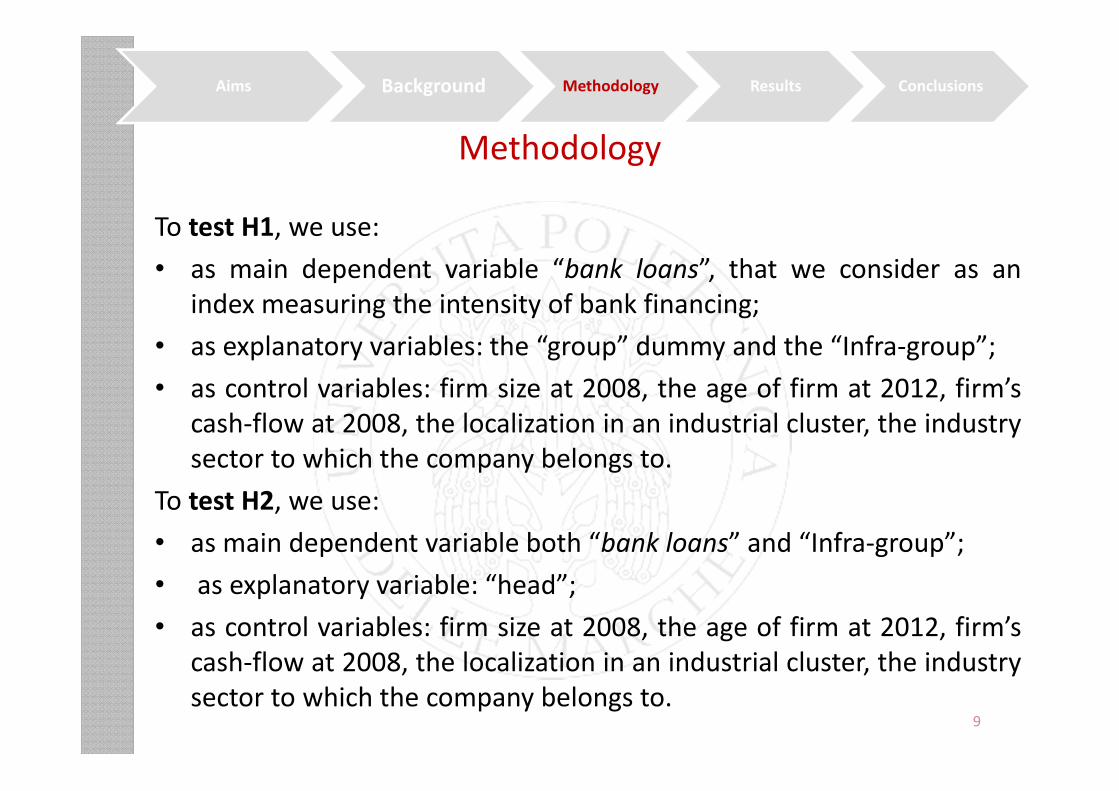
To test H1, we use:
• as main dependent variable “bank loans”, that we consider as anindex measuring the intensity of bank financing;
• as explanatory variables: the “group” dummy and the “Infra-group”;
• as control variables: firm size at 2008, the age of firm at 2012, firm’scash-flow at 2008, the localization in an industrial cluster, the industrysector to which the company belongs to.
To test H2, we use:
• as main dependent variable both “bank loans” and “Infra-group”;
• as explanatory variable: “head”;
• as control variables: firm size at 2008, the age of firm at 2012, firm’scash-flow at 2008, the localization in an industrial cluster, the industrysector to which the company belongs to.
9
Aims Background Methodology Results Conclusions
Methodology
• Specifically, we use a Heckman two-step estimation in order tocontrol for the possible presence of two distinct mechanisms atwork: the first one (selection equation) for the decision to access tobank financing; the second one (outcome equation) to decide theamount of such debt.
• More precisely, in the first step we estimate a Probit model(selection equation) for the probability to raise a bank loan.
• In the second step, we estimate an OLS model for the variable Bankloan only for those firms exhibiting positive values of this variable.
10
Aims Background Methodology Results Conclusions
Empirical results
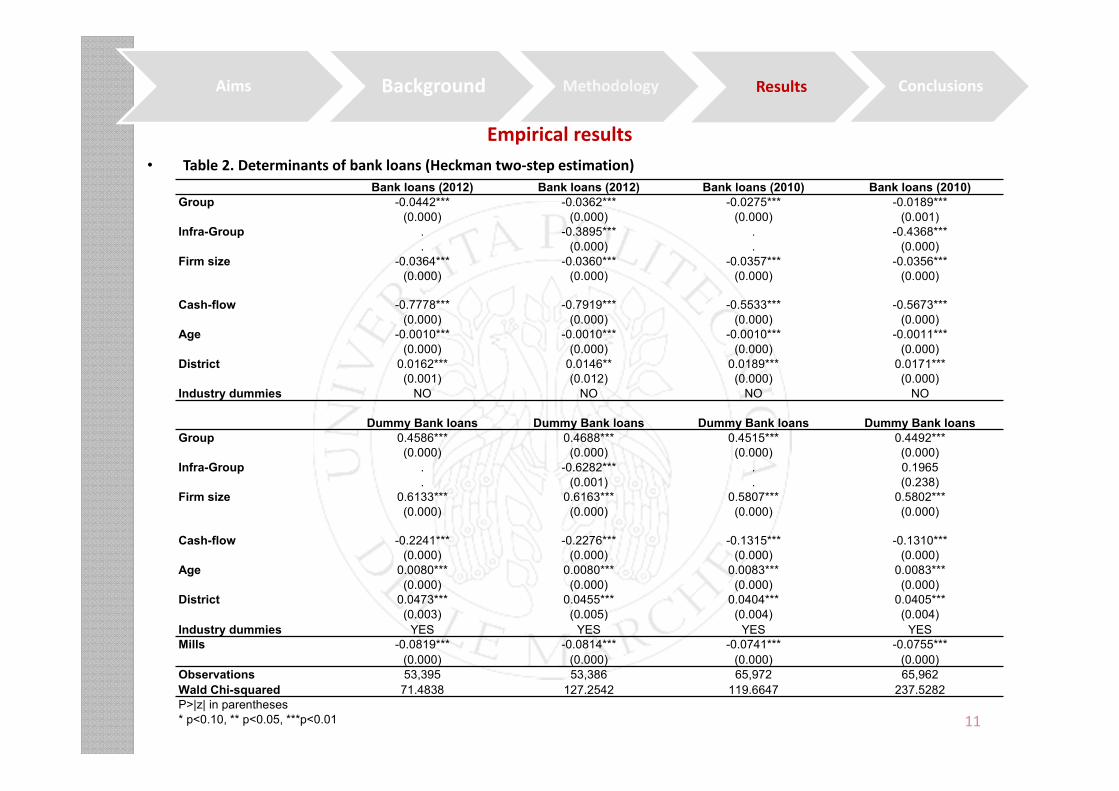
• Table 2. Determinants of bank loans (Heckman two-step estimation)
11
Aims Background Methodology Results Conclusions
Bank loans (2012) Bank loans (2012) Bank loans (2010) Bank loans (2010)Group -0.0442*** -0.0362*** -0.0275*** -0.0189***
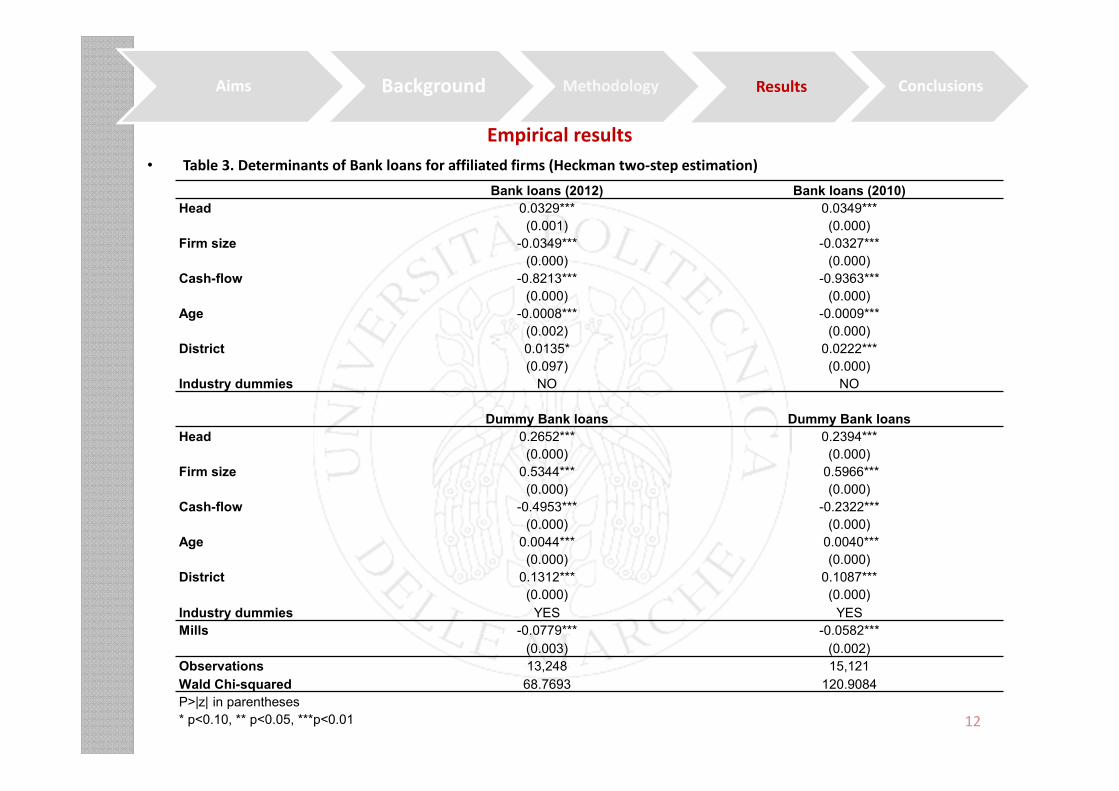
• Table 3. Determinants of Bank loans for affiliated firms (Heckman two-step estimation)
12
Aims Background Methodology Results Conclusions
Bank loans (2012) Bank loans (2010)
Head 0.0329*** 0.0349***
(0.001) (0.000)
Firm size -0.0349*** -0.0327***
(0.000) (0.000)
Cash-flow -0.8213*** -0.9363***
(0.000) (0.000)
Age -0.0008*** -0.0009***
(0.002) (0.000)
District 0.0135* 0.0222***
(0.097) (0.000)
Industry dummies NO NO
Dummy Bank loans Dummy Bank loans
Head 0.2652*** 0.2394***
(0.000) (0.000)
Firm size 0.5344*** 0.5966***
(0.000) (0.000)
Cash-flow -0.4953*** -0.2322***
(0.000) (0.000)
Age 0.0044*** 0.0040***
(0.000) (0.000)
District 0.1312*** 0.1087***
(0.000) (0.000)
Industry dummies YES YES
Mills -0.0779*** -0.0582***
(0.003) (0.002)
Observations 13,248 15,121
Wald Chi-squared 68.7693 120.9084
P>|z| in parentheses
* p<0.10, ** p<0.05, ***p<0.01
Empirical results
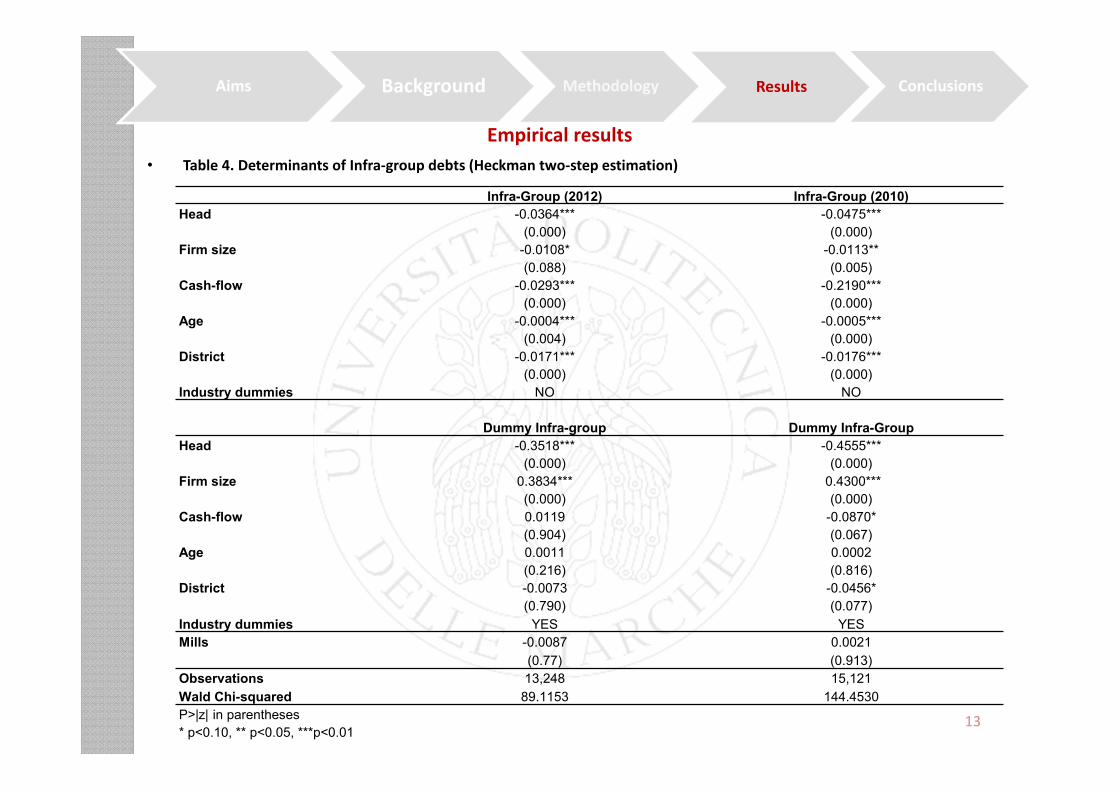
• Table 4. Determinants of Infra-group debts (Heckman two-step estimation)
13
Aims Background Methodology Results Conclusions
Infra-Group (2012) Infra-Group (2010)
Head -0.0364*** -0.0475***
(0.000) (0.000)
Firm size -0.0108* -0.0113**
(0.088) (0.005)
Cash-flow -0.0293*** -0.2190***
(0.000) (0.000)
Age -0.0004*** -0.0005***
(0.004) (0.000)
District -0.0171*** -0.0176***
(0.000) (0.000)
Industry dummies NO NO
Dummy Infra-group Dummy Infra-Group
Head -0.3518*** -0.4555***
(0.000) (0.000)
Firm size 0.3834*** 0.4300***
(0.000) (0.000)
Cash-flow 0.0119 -0.0870*
(0.904) (0.067)
Age 0.0011 0.0002
(0.216) (0.816)
District -0.0073 -0.0456*
(0.790) (0.077)
Industry dummies YES YES
Mills -0.0087 0.0021
(0.77) (0.913)
Observations 13,248 15,121
Wald Chi-squared 89.1153 144.4530
P>|z| in parentheses
* p<0.10, ** p<0.05, ***p<0.01
Conclusions
14
Aims Background Methodology Results Conclusions
• The main aim of this paper is to analyse the presence andintensity of bank financial constraints in companies belonging tobusiness groups compared to standalone companies during aperiod of credit crunch.
• Specifically, this period appears interesting to be investigatedbecause it is characterized by the financial crisis of 2008-2009and by the consequent credit crunch.
• In Italy the situation of credit rationing has continued for severalyears after the international financial crisis.
Conclusions
15
Aims Background Methodology Results Conclusions
The main results may be summarized in the following way:
• The affiliation to a business group facilitates affiliated firms inthe access to bank financing. In this sense, belonging to abusiness group is a complement to bank financing (Hypothesis1). At the same time, however, belonging to a business groupreduces the amount of bank financing: in this sense, theaffiliation to a business group is a substitute to bank financing.
• The presence of the internal capital market (Infra-Group) is asubstitute both for the decision to access bank financing and forthe decision about the amount of such financing.
• Finally, when considering centralization versus decentralization inraising bank financing in business groups, the portfolio effectprevails on the affiliation effect. This means that, in general,business groups provide further financial benefits to affiliatedfirms besides the internal capital market (Hypothesis 2).
Conclusions
16
Aims Background Methodology Results Conclusions
• At the end, we note that our results are overall verified both inthe immediate aftermath for the international financial crisis (i.e.2009-2010) and in the following years characterized by theItalian recession (i.e. 2011-2012).