i SMALL RESERVOIR NON-POINT SOURCE POLLUTION IDENTIFICATION AND WATER QUALITY MONITORING FOR DOMESTIC, LIVESTOCK AND IRRIGATION USE IN MZINGWANE CATCHMENT (ZIMBABWE) By CHIPO MASONA A thesis submitted in partial fulfilment of the requirements of the degree of Master of Science in Soil and Environmental Management Department of Soil Science and Agricultural Engineering Faculty of Agriculture University of Zimbabwe July 2007
Transcript
i
SMALL RESERVOIR NON-POINT SOURCE POLLUTION IDENTIFICATION AND WATER QUALITY MONITORING FOR DOMESTIC, LIVESTOCK AND IRRIGATION USE IN
MZINGWANE CATCHMENT (ZIMBABWE)
By
CHIPO MASONA
A thesis submitted in partial fulfilment of the requirements of the degree of Master of Science in Soil and Environmental Management
Department of Soil Science and Agricultural Engineering
Faculty of Agriculture University of Zimbabwe
July 2007
ii
ABSTRACT
The use of soil amendments (manure and fertilizers), livestock production and small scale industries has led to increased concern on their environmental impacts, particularly on water quality. The main objective of this study was to assess the spatial and temporal water quality variation in small reservoirs as a function of usage, and to identify non point source pollution of the reservoirs’ watersheds. A study was carried out in Mzingwane subcatchment for eight months to determine the biological (total coliforms, faecal streptococci and faecal coliforms) and physico-chemical (pH, hardness, electrical conductivity, nitrate and chloride) water quality parameters of three small reservoirs (Avoca, Bova and Sifinini) and one medium sized reservoir Siwaze, for comparison. The study included non point source pollution identification of the respective four watersheds and a consumers’ water quality perception survey (taste, colour, soap consumption, frothing when boiling and smell).
The 10mg/l WHO (1984) guideline for nitrate in drinking water was exceeded in March and April for all four reservoirs but the water was within this guideline for the rest of the study months. pH ranged between 6.18 to 10.45 and was generally within the FAO irrigation guidelines of 6.5 to 8.5. Electrical conductivity ranged from 37 to 320.67µS/cm, which was within the FAO irrigation water guideline of 700µS/cm and within the derived WHO drinking water guideline of 1380 µS/cm. Total coliform count ranged from 12 to 1100+ counts /100 ml, streptococii ranged from 0 to 427 counts/100 ml. Most faecal coliform counts were above the WHO drinking water guideline of 0 counts/100ml and the DWAF (1996a) 10/100ml counts for total coliforms. There was a negative Pearsons’ correlation coefficient between rainfall and total coliform counts and between rainfall and faecal streptococci (r = -0.11552 and r = -0.04388) respectively. For all the water quality perceptions the majority of the respondents indicated that water quality was satisfactory during the wet season, 80.2%, 66.5%, 75.8 and 92.9% for colour, taste, smell and soap consumption respectively. Most of the respondents indicated that they use animal manure (75.1%) as soil amendments and only 21.1 % and 5.9% use Compound D and ammonium nitrate fertilizers respectively. Non-point source pollutants calculated as pollutant loading ranged from 13.5 mg/s to 117.3 mg/s for hardness, 2.9 mg/s to 96.7 mg/s for chloride and 95 to 132 mg/s for EC. The conclusion reached was that water quality in all the reservoirs is not suitable for drinking purposes but can be used for laundry, livestock watering and irrigation purposes. It was also concluded that non point source pollution, originating from homesteads and farming fields affects water quality in small reservoirs and pollution varies depending on the watershed area, and the activities within a specific watershed. It was recommended that the villagers should boil the water or use sodium hypochlorite (Jik) to purify the water before drinking. It was also recommended that further water quality studies including sediments and ground water should be carried out to confirm this conclusion.
iii
DECLARATION
I CHIPO MASONA hereby declare that this thesis is my own composition. I generated
the results presented except where clearly and specifically acknowledged at the Department of Soil Science and Agricultural Engineering, Biological Science Department
at the University of Zimbabwe and the Institute of Mining and Research.
Date: _______________________________________
Signed: _____________________________________
CHIPO MASONA
iv
DEDICATION
To my husband Tonderai Jamu, and my family as a whole.
v
ACKNOWLEDGEMENTS
I would like to thank my supervisor Dr. A. Senzanje for guiding, assisting and
understanding me throughout the whole project.
Muchaneta Munamati, my sister in this thesis, thanks for giving me pressure, then I
thought you were just being difficult, but in the end I realised you were doing it for my
own good. Thanks sis.
To the very first MSc (2005-2007) group in the Department of Soil Science and
Chitiga, Gabriel Soropa and Josiah Mukutiri) I say, thank you for being with me through
thick and thin. These two years were the best university years that I have ever had, may
The Almighty Bless You in abundance.
My project mates, Geoffrey Mamba, Sifiso Ncube, Roick Chikati and Ngonidzashe
Mufute, not forgetting Mr E. Chitopo for being with me in the field, your assistance is
gratefully appreciated. Thank you guys.
Mr Ncube and his family who were available every time, thank you for all the field
assistance, as well as the two enumerators, Zibonele Mahlangu and Thabo Nkomo. My
gratitude goes to Mr Tshuma of Denje who constantly supplied us with imibhida. The
Avoca community for making this project what it is, thank you.
T.J., Love, I will rather say my thanks to you for everything in person. My greatest thanks go to the Small Reservoir Project (SRP) within the Challenge Program
TABLE OF CONTENTS................................................................................................vi LIST OF TABLES .........................................................................................................ix
LIST OF FIGURES ........................................................................................................x
LIST OF APPENDICES ................................................................................................xi ABBREVIATIONS AND GLOSSARY..........................................................................xii CHAPTER ONE .............................................................................................................1
1.2 GENERAL OBJECTIVE ......................................................................... 4 1.3 SPECIFIC OBJECTIVES........................................................................ 4 1.4 HYPOTHESES ....................................................................................... 4 1.5 THESIS STRUCTURE ............................................................................ 5
CHAPTER TWO ............................................................................................................6
2.0 LITERATURE REVIEW ...........................................................................................6
2.1 BACKGROUND: SMALL DAMS IN ZIMBABWE .................................. 6 2.2 PHYSICAL WATER QUALITY PARAMETERS...................................... 7
Temperature ..............................................................................................................7 pH..............................................................................................................................7 Electrical Conductivity (EC).....................................................................................8
2.3 CHEMICAL WATER QUALITY PARAMETERS .................................... 8 Nitrate .......................................................................................................................8 Hardness....................................................................................................................9 Chlorides ...................................................................................................................9
2.4 BIOLOGICAL WATER QUALITY PARAMETERS ................................. 9 Faecal Contamination ...............................................................................................9
2.5 DRINKING WATER .............................................................................. 10 2.6 WATER QUALITY PERCEPTIONS...................................................... 11 2.7 WATER QUALITY MANAGEMENT POLICIES .................................... 11 2.8 NON-POINT SOURCE POLLUTION IDENTIFICATION....................... 12 2.9 EMERGING ISSUES................................................................................. 12
VILLAGERS’ WATER QUALITY PERCEPTIONS (COLOUR, SMELL, TASTE, SOAP CONSUMPTION AND FROTHING WHEN BOILING) OF SMALL RESERVOIRS IN MZINGWANE CATCHMENT........................................................................... 29 5.1 INTRODUCTION .................................................................................. 29 5.2 MATERIALS AND METHODS.............................................................. 29 5.3 RESULTS ............................................................................................. 30
5.3.1 PROFILE OF THE RESPONDENTS ................................................................30 5.3.2 WATER QUALITY PERCEPTIONS ...........................................................30 5.3.3 ANIMAL MANURE AND FERTILIZER USE.............................................32 5.3.4 RESERVOIR WATER USES .......................................................................33
Avoca ......................................................................................................................33 Bova ........................................................................................................................35 Sifinini.....................................................................................................................36 Siwaze .....................................................................................................................36
5.3.5 WATER AVAILABILITY IN RESERVOIRS........................................................38 5.4 DISCUSSION .......................................................................................... 39 5.5 CONCLUSION.......................................................................................... 41
CHAPTER SIX .............................................................................................................42
viii
NON POINT SOURCE POLLUTION IDENTIFICATION AND POLLUTION LOADING IN AVOCA GROWTH POINT, MZINGWANE CATCHMENT. .....................................42
6.1 INTRODUCTION .................................................................................. 42 6.2 MATERIALS AND METHODS.............................................................. 42
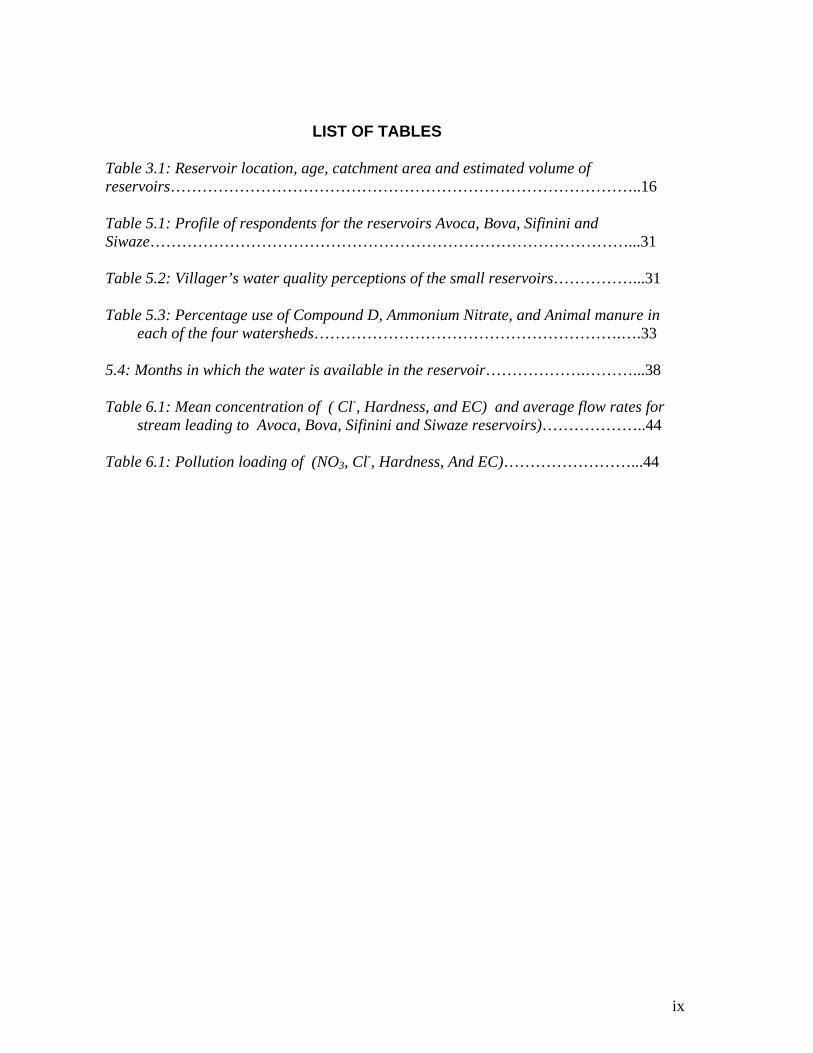
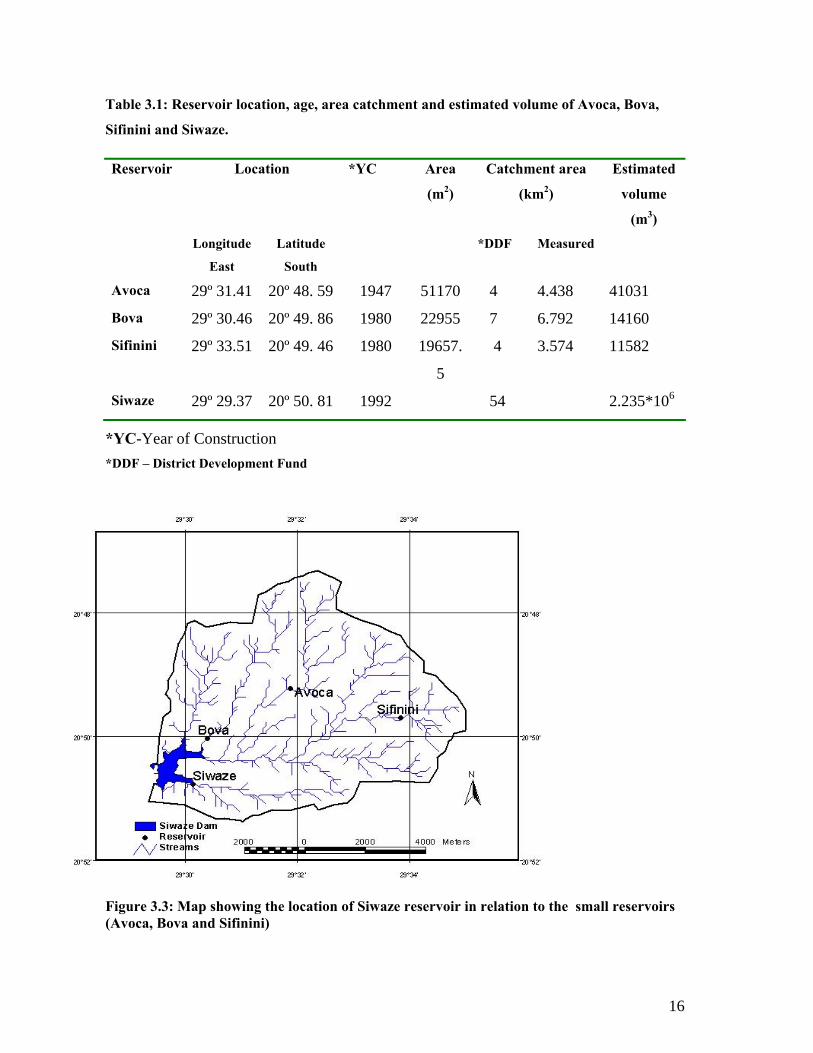
Table 3.1: Reservoir location, age, catchment area and estimated volume of reservoirs……………………………………………………………………………..16 Table 5.1: Profile of respondents for the reservoirs Avoca, Bova, Sifinini and Siwaze………………………………………………………………………………...31 Table 5.2: Villager’s water quality perceptions of the small reservoirs……………...31 Table 5.3: Percentage use of Compound D, Ammonium Nitrate, and Animal manure in
each of the four watersheds………………………………………………….….33 5.4: Months in which the water is available in the reservoir……………….………...38 Table 6.1: Mean concentration of ( Cl-, Hardness, and EC) and average flow rates for
stream leading to Avoca, Bova, Sifinini and Siwaze reservoirs)………………..44 Table 6.1: Pollution loading of (NO3, Cl-, Hardness, And EC)……………………...44
x
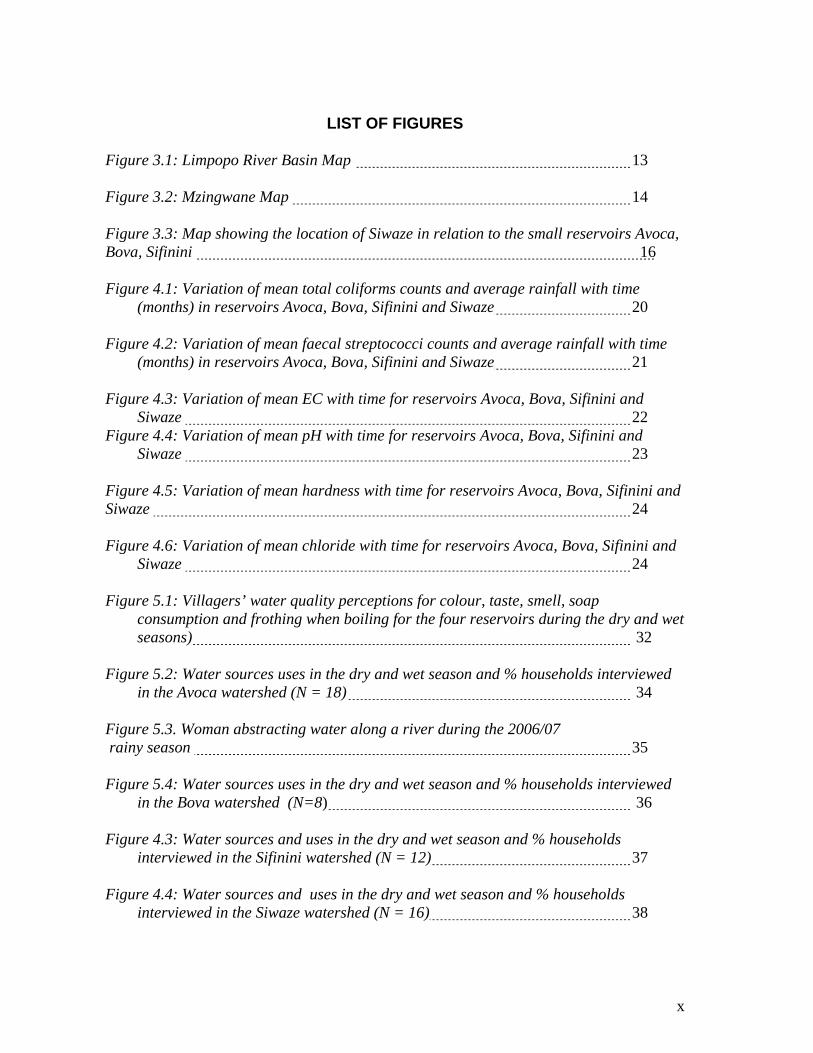
LIST OF FIGURES
Figure 3.1: Limpopo River Basin Map 13 Figure 3.2: Mzingwane Map 14 Figure 3.3: Map showing the location of Siwaze in relation to the small reservoirs Avoca, Bova, Sifinini 16 Figure 4.1: Variation of mean total coliforms counts and average rainfall with time
(months) in reservoirs Avoca, Bova, Sifinini and Siwaze 20 Figure 4.2: Variation of mean faecal streptococci counts and average rainfall with time
(months) in reservoirs Avoca, Bova, Sifinini and Siwaze 21 Figure 4.3: Variation of mean EC with time for reservoirs Avoca, Bova, Sifinini and
Siwaze 22 Figure 4.4: Variation of mean pH with time for reservoirs Avoca, Bova, Sifinini and
Siwaze 23 Figure 4.5: Variation of mean hardness with time for reservoirs Avoca, Bova, Sifinini and Siwaze 24 Figure 4.6: Variation of mean chloride with time for reservoirs Avoca, Bova, Sifinini and
Siwaze 24 Figure 5.1: Villagers’ water quality perceptions for colour, taste, smell, soap
consumption and frothing when boiling for the four reservoirs during the dry and wet seasons) 32
Figure 5.2: Water sources uses in the dry and wet season and % households interviewed
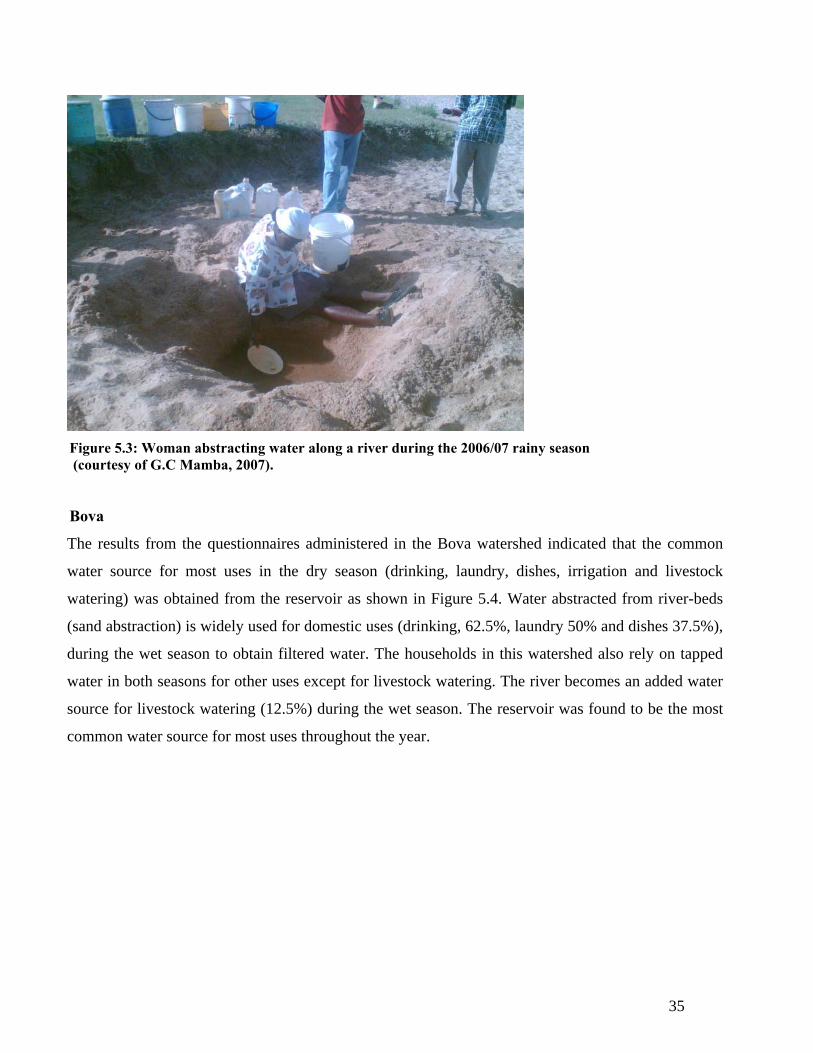
in the Avoca watershed (N = 18) 34 Figure 5.3. Woman abstracting water along a river during the 2006/07 rainy season 35 Figure 5.4: Water sources uses in the dry and wet season and % households interviewed
in the Bova watershed (N=8) 36 Figure 4.3: Water sources and uses in the dry and wet season and % households
interviewed in the Sifinini watershed (N = 12) 37 Figure 4.4: Water sources and uses in the dry and wet season and % households
interviewed in the Siwaze watershed (N = 16) 38
xi
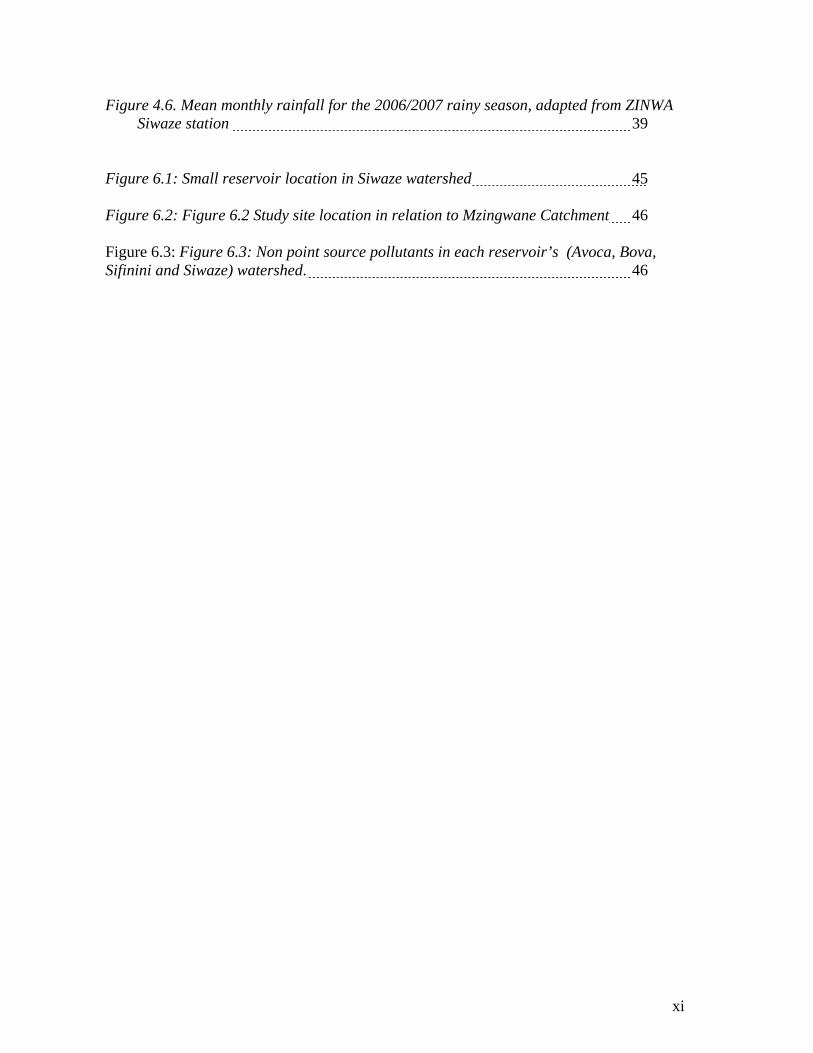
Figure 4.6. Mean monthly rainfall for the 2006/2007 rainy season, adapted from ZINWA Siwaze station 39
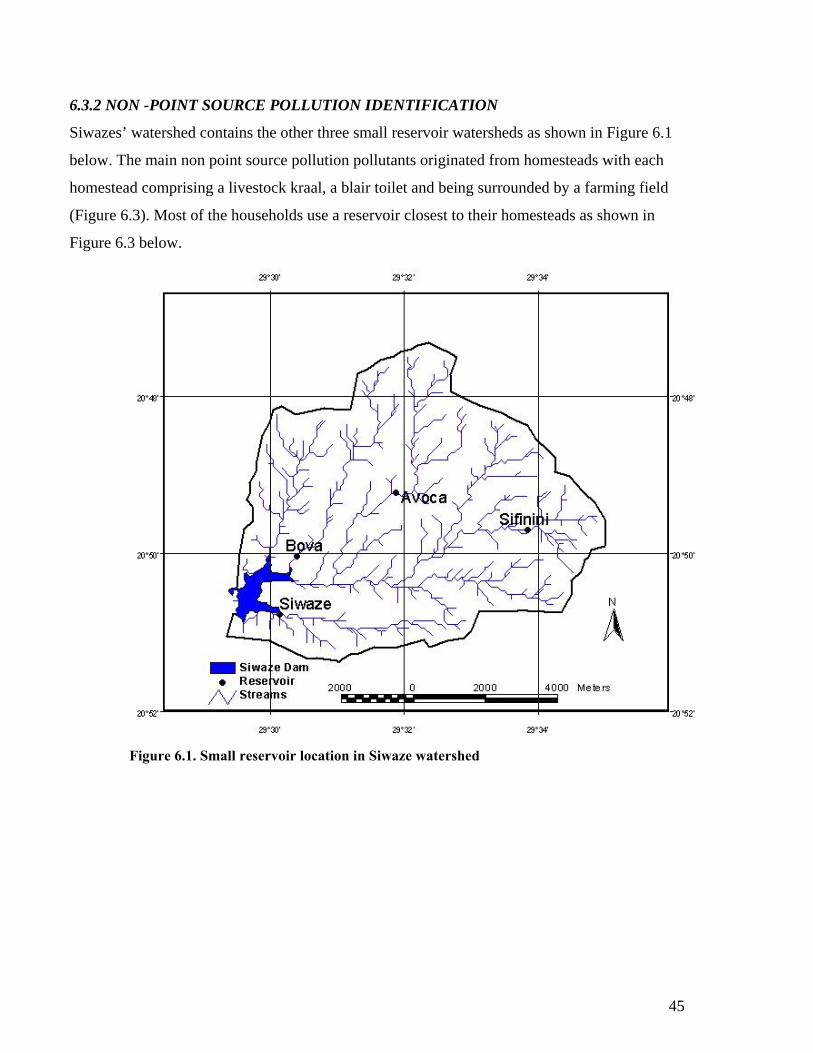
Figure 6.1: Small reservoir location in Siwaze watershed 45 Figure 6.2: Figure 6.2 Study site location in relation to Mzingwane Catchment 46 Figure 6.3: Figure 6.3: Non point source pollutants in each reservoir’s (Avoca, Bova, Sifinini and Siwaze) watershed. 46
xi
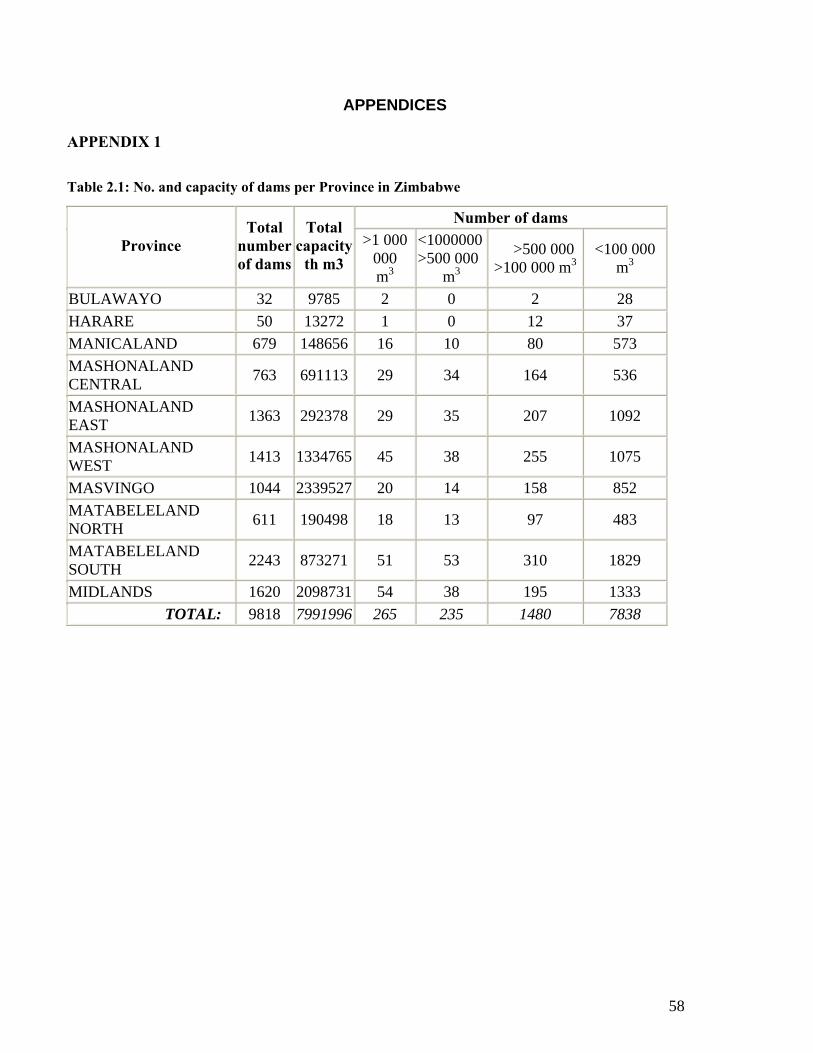
LIST OF APPENDICES APPENDIX 1 Number and capacity of dams per province in Zimbabwe 54
APPENDIX 2 Effects of chloride on the health of livestock (DWAF, 1996) 55
APPENDIX 3 Questionnaire to investigate the villagers’ water quality perception 56
BMP Best Management Practices DWAF Department of Water Affairs and Forestry (Republic of South Africa) FAO Food and Agricultural Organisation IPC Integrated Pollution Control ICM Integrated Catchment Management ICOLD International Commission on Large Dams MDG Millennium Development Goals NPS Non-point source SAZ Standards Association of Zimbabwe WHO World Health Organisation
1
CHAPTER ONE
1.0 INTRODUCTION
Water is a vital resource to support all forms of life on earth. Unfortunately, it is not evenly distributed
over the world by season or location. Some parts of the world are prone to drought, making water a
scarce and precious commodity, while in other parts of the world it appears in raging torrents causing
floods and loss of life and property. Due to the scarcity of clean water, financial constraints and the
variability of the water sources, rural communities resort to using untreated water directly from the
water sources such as rivers, reservoirs and boreholes (Pirages, 2005). This poses environmental and
health hazards to the concerned communities. There is therefore need for temporal and spatial water
quality analysis and monitoring of the major rural water sources.
Water quality of surface or ground water is defined as a function of either or both natural influences
and human activities. The natural influences that determine water quality are weathering of bedrock
minerals, atmospheric processes of evapotranspiration and the deposition of dust and salt by wind,
natural leaching of organic matter and nutrients from soil, hydrological factors that lead to runoff, and
biological processes within the aquatic environment that can alter the physical and chemical
composition of water (GEMS/Water Program, 2006). Generally water has multiple uses and as such
water quality requirements and consumer perceptions differ for different water uses, such as domestic
or agriculture, therefore water quality should be determined according to different uses. Water quality
requirement for a particular use plays an important role in the management of water resources and in
turn forms an integral part of water quality management (Parsons and Tredoux, 1995).
Reservoirs are usually constructed for several purposes. According to ICOLD (1998), 48% of the
world reservoirs are for irrigation, and 20% for hydropower generation. The rest are mainly for flood
control, domestic and industrial water supply, and recreation. Of the small reservoirs in Southern
Africa (excluding South Africa), 86% are found in Zimbabwe, which constitutes only about 6.8% of
the geographic area in the region (Sugunan, 1997). An initial analysis of the reservoirs in Zimbabwe
indicated that about 60% of them are less than 1 million m3 (Chimowa and Nugent, 1993). These
small reservoirs were mainly developed in the former large scale commercial farms and communal
areas, each sector constituting 61% and 39% of the total number of small reservoirs respectively. It is
however estimated that there are approximately 1 000 small reservoirs in the semi arid Limpopo River
2
Basin (Sawunyama, 2005). The importance of these reservoirs lies mainly in their multiple uses,
which include domestic use, livestock watering, small-scale irrigation, fishing and brick making.
Small reservoirs also provide the surrounding communities with the Cypress spp, reeds that they use
for thatching (Rusere, 2005).
Despite the multiple uses of small reservoirs and their abundance, there has been an urban bias
regarding water quality studies in Zimbabwe, which is unfortunate given that about 60% of the
country’s population lives in rural areas (FEWS NET, 2004). Water quality in small reservoirs can be
contaminated or polluted through different activities, such as small rural industries for instance brick
making, and through runoff and through flow from agricultural lands, pastures and blair toilets. The
pollution or contamination can be direct (point source pollution) where the source of pollution is
known, or indirect (non point source), where the source of pollution is diverse and diffuse. Hussein et
al., (2000) found direct contamination from agricultural chemical contamination of water sources in
Seke, Zimbabwe. Indirect contamination through discharge from dip tanks into nearby water bodies
has been reported (Mandizha, 1995), which raises the potential danger posed to aquatic ecosystems,
livestock and the people using the water. It is essential to identify non- point source pollution as it
results in the estimation of all the possible pollutant sources in the reservoirs and aids in the water
quality management of these reservoirs.
1.1 JUSTIFICATION
In water scarce arid and semi arid regions, small reservoirs serve as a drinking water, irrigation and
livestock-watering source. Global estimates suggest that nearly 1.5 billion people lack safe drinking
water and that at least 5 million deaths per year can be attributed to waterborne diseases (Scheelbeek,
2005). The ability to properly track progress toward minimizing impacts on reservoir water quality
and improving access of humans to safe water depends on the availability of baseline data that
document trends both spatially and temporally. Therefore continuous monitoring of reservoir water
quality is necessary to reduce negative impacts on human health, irrigation and livestock quality.
In the arid and semi-arid regions, livestock commonly use poor or marginal quality drinking water for
several months of the year. These supplies originate from small reservoirs, canals and streams. The
small reservoirs in Zimbabwe’s Matabeleland South province were constructed mainly for mitigation
of drought effects and are mainly used for livestock watering (Chimowa and Nugent,1993) . Poor
3
water quality for livestock watering normally results in reduced water and feed consumption,
physiological upset or even death in livestock. The reduced water and feed consumption is usually
caused by a water imbalance rather than related to any specific ion. Water quality parameters that
affect the palatability of water for livestock include total dissolved solids (TDS), nitrates, pH and
microorganisms (Bolyes, undated). These parameters may occur naturally in water or are as a result of
human influence.
The water quality requirements for irrigated agriculture unlike that for domestic and livestock use
depend mainly on physical and chemical parameters such as TDS (total amounts as well as the type of
the salts), calcium, sodium chloride and boron. Irrigation water quality or suitability for use therefore
depends on the potential severity of problems that can be expected to develop during long-term use.
These problems depend on soil type, climatic condition of the area and crops grown. As a result,
suitability of water for irrigation use is determined by the conditions of use which affect the
accumulation of the water constituents and which may restrict crop yield. The soil problems most
commonly encountered and used as a basis to evaluate water quality are those related to salinity, water
infiltration rate and toxicity. For example salts in soil or water reduce water availability to the crop to
such an extent that yield is affected (FAO, 2003).
The urban bias in terms of water quality studies in Zimbabwe has resulted in the rural communities to
rely more on their perceptions of water quality for uses such as domestic uses. Consumer water
quality perceptions give an indication of the baseline information on the water quality from one
season to another. However, these perceptions are based on human senses, for example taste and
smell, which are themselves subjective as they are dependant on an individual senses. In order to
determine the suitability of the water source for a particular use (domestic, irrigation and livestock),
there is need to integrate these consumer perceptions with laboratory water quality analysis. Hoko
(2005), in a study in Gokwe, recommended that studies linking the water quality both measured and
perceived should be carried out to find the effect of geology and pollution on rural water quality.
Water quality in small reservoirs is therefore an important aspect of water resources management in
arid and semi arid regions. It is a key catalyst for development and conservation because it determines
the spatial and temporal dynamics of aquatic organisms and drives various water uses (Mwaura,
2000). Determining water quality of small reservoirs aids in integrated pollution control (IP
C) and integrated catchment management (ICM) because small reservoirs water sources depend on
4
catchment runoff. Water quality management therefore contributes both directly and indirectly to
achieving the targets set out in the Millennium Development Goals (MDG’s), specifically MDG target
goal 7, “To ensure environmental sustainability”.
1.2 GENERAL OBJECTIVE
To assess the spatial and temporal water quality variation in small reservoirs as a function of usage,
and to identify non-point source pollution of the reservoirs’ watersheds.
1.3 SPECIFIC OBJECTIVES
The specific objectives were:
1. To determine the suitability of small reservoir water quality for domestic, irrigation and livestock
use, by analysing selected physico-chemical parameters (chloride, nitrate, water hardness, pH,
temperature, and electrical conductivity).
2. To determine biological water quality of small reservoirs based on the presence of selected
pathogenic organisms (total coliforms, streptococci and faecal coliforms).
3. To determine villagers’ water quality perceptions (taste, odour, soap consumption and colour),
using structured interviews.
4. To identify non-point source pollution in the small reservoirs (Avoca, Sifinini, Siwaze and Bova)
watersheds.
1.4 HYPOTHESES
1. There is spatial (in relation to watersheds) and temporal (seasonality) variation of water quality of
small reservoirs.
2. Water in small reservoirs is not suitable for small-scale livestock watering, irrigation and domestic
use according to World Health organisation (WHO), Food and Agricultural Organisation (FAO)
and Department of Water Affairs and Forestry (DWAF) standards.
3. There is correlation between analysed laboratory water quality parameters and the community
water quality perceptions
4. Non point source pollution significantly affects water quality in small reservoirs.
5
1.5 THESIS STRUCTURE
The first chapter gives an introduction and justification of the thesis. Literature on water quality in
small reservoirs is reviewed in Chapter 2. Chapter 3 presents an outline of the general materials and
methods of the project. The laboratory water quality is discussed in chapter 4. Chapter 5 is the
consumer water quality perceptions results and discussion. This chapter includes the agricultural and
reservoir information in the watersheds. Non point source pollution identification and pollution
loading into the watersheds is explained and discussed in chapter 6. The final chapter, chapter 7
discusses the whole thesis giving detail on the major findings and recommendations for further study.
This chapter also includes the conclusion.
6
CHAPTER TWO
2.0 LITERATURE REVIEW
2.1 BACKGROUND: SMALL DAMS IN ZIMBABWE
Small reservoirs like other reservoirs are storage structures used to store and capture runoff water;
however categorization of a reservoir as being large or small varies widely across the world. In
Zimbabwe small reservoirs are defined as storing less than 1 million cubic metres of water and have
less than 8 metres height (Kabell, 1986). Small reservoirs impound, partial and temporal precipitation
from a given watershed (the land area that is drained by a particular river, stream or creek), which is
then used for multiple purposes, such as, irrigation, livestock watering, brick making, domestic use
and recreation (Sugunan, 1997; Keller et al., undated).
The multiple uses of small reservoirs make them very important for the improvement of livelihoods of
the rural society (Stevenson, 2000). Livelihoods can be defined as the means people use to support
themselves, to survive, and to prosper. Livelihoods can also be viewed as an outcome of how and why
people organize to transform the environment to meet their needs through technology, labour, power,
knowledge, and social relations (Wim van der Hoeck, 2001). Livelihoods are therefore shaped by the
broader economic and political systems within which they operate. Water is the essential element in
rural livelihoods because of the food security and income options it generates in rainfed and irrigated
crop production, industry, domestic use, livestock and recreation. Safe water and sanitation also
influence the health of the community through potable water supply, safe food preparation, hygiene
and improved nutrition. (Wim van der Hoeck, 2001).
In the early 1990s, Zimbabwe experienced severe droughts and the semi arid Matabeleland South
Province was greatly affected. The droughts resulted in the development of more reservoirs in
Zimbabwe. The main objectives of developing small reservoirs in Zimbabwe were to mitigate the
drought effects by providing sources of water for domestic uses, creation of new irrigated areas and
recharge groundwater (Chimowa and Nugent, 1993). About 10% of rainfall is lost as runoff in semi-
arid areas of Zimbabwe. This runoff is sufficient to fill small to medium reservoirs in which rural
7
communities depend on in most years except the years when there is little or no runoff (Mugabe et al.,
2004). Matabeleland South, which is a province concentrating mainly on livestock rearing, had a very high
density of dams in 1993 (23% of the national total (9818), but these represented only 11% of the total
water capacity of Zimbabwe’s dams (Table 2.1) because most of the dams in this area are relatively
small and are built mainly for livestock watering (Chimowa and Nugent, 1993).
2.2 PHYSICAL WATER QUALITY PARAMETERS
Temperature
Temperature may be the most important single factor affecting the occurrence and behaviour of the
life and chemicals in surface water. It affects practically every physical factor that is of concern in
water quality management in that it alters the density, viscosity, vapour pressure and surface tension
of water. It also affects the rate of biological and chemical reactions (Ellis, et al., 1989). Some water
quality parameters, such as electrical conductivity and dissolved oxygen vary in concentration with
temperature. For example an increase in temperature accelerates the process by which aerobic
microorganisms decompose organic material in the water, which, in turn, increases the demand for
oxygen. As temperature rises the amount of oxygen that the water can hold decreases although the rate
at which atmospheric oxygen is able to re-dissolve into de-oxygenated water increases (Ellis, et al.,
1989).
pH
pH is an unstable important variable in water quality assessment as it influences many biological and
chemical processes within a water body (Chapman, 1996). At a given temperature, pH indicates the
intensity of the acidic or basic character of a solution and is controlled by the dissolved chemical
compounds and biochemical processes in a solution. The general state of a reservoir can be estimated
by pH (Tilman et al., 1982). Water pH in reservoirs range from 5 to 10 but it can fluctuate upwards or
downwards as a result of changes in photosynthetic activity (Moehl and Davies, 1998). Factors such
as the taste of water, its chlorinating efficiency and the solubility of metal ions are influenced by pH.
For example at low pH water may have a sour taste, while at high pH the water may have a soapy
taste (Kempster and van Vliet, 1991). Small changes in pH often causes large changes in the
8
concentration of available metallic complexes and can lead to significant increases in the availability
and toxicity of most metals (DWAF, 1996c).
Electrical Conductivity (EC)
The electrical conductivity (specific conductance) of water is an expression of its capacity to conduct
a current and is related to the concentration of free ions such as Ca2+, Mg2+, NO-3, Fe2+, Na+and AL3+
and to water temperature (Goldman and Horne, 1983). The type of bedrock and soil in the watershed
affects conductivity. It is also affected by human influences, for example, the use inorganic fertilizers
results in agricultural runoff high in phosphate and nitrate. Conductivity provides a convenient
estimate of the Ca2+ and Mg2+ content and thus the quality of water. If the levels of Ca, Mg and
chlorides, as a group or alone, are too high in soils, they result in reduced crop growth. The effect of
high EC in the soils is similar to drought-stressed effects; due to this an osmotic gradient on salty soils
is formed. Water uptake by plant roots is increasingly restricted as the concentration of soil salts
increases. Conductivity measurement is expressed in microsiemens per centimetre (µS/cm) at 25
degrees Celsius. Conductivity measures can be converted to total dissolved (TDS) values by
multiplying EC by a factor that varies with the type of water. A suggested range is 0.55-0.9 for this
factor (Sawyer et al., 1994).
2.3 CHEMICAL WATER QUALITY PARAMETERS
Nitrate
The nitrate ion is the common form of combined nitrogen found in natural waters. Natural sources of
nitrate to surface waters include igneous rocks, land drainage and plant and animal debris. In rural and
suburban areas, the use of inorganic nitrate fertilizers is a major source. When influenced by human
activities, surface water can have nitrate concentration up to 5 mg l-1 NO3-N but often less than 1 mg
l-1 NO3-N. However the World Health Organisation (WHO) recommended limit for NO3- in drinking
water is 50 mgl-1 (Chapman, 1996). The determination of nitrate in surface water gives a general
indication of the nutrient status and the level of organic pollution. Nitrate does not cause direct toxic
effects, but in the reduced form, nitrite it is 10-15 times more toxic than nitrate. Nitrate oxidises
haemoglobin to methaemoglobin, which unlike haemoglobin cannot transport oxygen in body tissues.
Suffocation due to a lack of oxygen in the tissues then occurs. This condition normally occurs in
babies and is called the methaemoglobinemia, blue baby syndrome (DWAF, 1996b).
9
Hardness
The term "hardness" is an indication of the presence of usually calcium and magnesium carbonates
that reduce the lathering of soaps (Chapman, 1996). Water hardness gives a reflection of the geology
of the geology area. At times it gives a measure of the influence of human activity in the area, for
example acid mine drainage as water hardness also includes Fe 2+. However hardness is more of a
reflection of the amount of Ca and Mg entering the reservoir through the weathering of rocks such as
limestone (Kreger, 2004). Approximately 22% of the earth’s fresh water is ground water, and as it
flows through soil originating from limestone rocks, it picks up minerals Ca and Mg carbonates.
(National Consumer Water Quality Survey, 1997).
Chlorides
Effects of chloride on human health may occur at very high levels above 1 200mg/l by disturbance of
the electrolyte balance and nausea. Infants are susceptible and fatalities due to dehydration may occur
(DWAF, 1996a). High levels of chloride in water may render it unpalatable for most livestock.
Poultry, pigs and sheep are more susceptible to excess chloride as indicated by Table 2.2 in
appendices.
2.4 BIOLOGICAL WATER QUALITY PARAMETERS
Faecal Contamination
A high health risk is associated with the consumption of drinking water that is contaminated with
bacteria and parasites from human and animal excreta. This is a major cause of diarrhea. Worldwide
diarrhea hits 1.5 billion people per year and kills five million, mainly children under five (Scheelbeek,
2005). The main pathogens are E.coli bacteria and Cryptosporidium and Giardia parasites.
Indicator organisms
General coliforms, E. Coli, and Enterococcus bacteria are the "indicator" organisms generally
measured to assess microbiological quality of water. However, these are only used to indicate the
presence of pathogenic microorganisms and are themselves not harmful. It is difficult and expensive
to detect some of the pathogenic microorganisms and it is therefore common practice to use microbial
indicators as an indicator of recent faecal pollution and the potential risk of infectious diseases from
the water (WRC, 1998). Indicator microbes are generally selected for the following reasons:
10
They are initially abundant in the sampling material (water, soil) to be assayed.
A relatively rapid, accurate, and cost effective analytical method for enumerating the indicator
organisms exists or can be readily developed.
A reasonably strong correlation exists between the presence/absence of the indicator and a
particular pathogen or group of pathogens. The strength of the correlation will determine the
effectiveness and accuracy of the indicator as a measure of pathogen occurrence.
General coliforms indicate that the water has come in contact with plant or animal life. General
coliforms are universally present. They are of little concern at low levels, except to indicate the
effectiveness of disinfection. At very high levels they indicate there is what amounts to a lot of
compost in the water, which could easily include pathogens (Oasis design, 1997).
Faecal coliforms are a collection of relatively harmless micro-organisms that live in large numbers in
the intestines of humans and other warm-blooded animals where they aid in the digestion of food.
Escherichia coli bacteria normally inhabit the intestines of all animals and humans, but a minority of
the strains may cause human illnesses with severe cramping (abdominal pain) and diarrhoea,
especially in young children and elderly (Scheelbeek, 2005). Faecal coliforms are used to indicate the
presence of bacterial pathogens such as Salmonella spp., Shigella spp. and Vibrio Cholerae. These
organisms can be transmitted via the faecal/oral route by contaminated or poorly treated drinking
water and may cause disease such as gastroenteritis, salmonellosis, dysentery, cholera and typhoid
fever (DWAF, 1996a).
2.5 DRINKING WATER
Water that is directly ingested by human beings, without any treatment requires the highest water
quality standards (Scheelbeek, 2005). Illnesses that can occur by drinking contaminated water are very
diverse, but most of the times symptoms like diarrhoea and vomiting occur. At any given time, about
half the population in the developing world is suffering from one of these diseases associated with
water supply and sanitation. About 400 children below the age of five die per hour in the developing
world from waterborne diarrhoeal diseases (Gadgil, 1998). Due to the scarcity of clean water, financial
constraints and the variability of the water sources, rural communities in Avoca resort to using
untreated water directly from small reservoirs. This results in increased incidences of water borne
11
diseases, therefore there is need to analyse water quality in these water sources to reduce the risk of
these water borne diseases.
2.6 WATER QUALITY PERCEPTIONS
Water quality perceptions of a water body are best obtained through the participation of primary
stakeholders. Water quality perceptions provide background water quality of the water body and
include perceptions such as colour, smell/odour, taste frothing when boiling and soap consumption.
The perceived colour of water determines the depth to which light is transmitted. The colour can be
measured as true or apparent colour. Natural minerals such as ferric hydroxide and organic substances
such as humic acids results in true colour of the water while apparent colour is caused by coloured
particulates and the refraction and reflection of light on suspended particulates. Therefore polluted
water tends to have a strong apparent colour.
Water odour or smell is usually the result of labile volatile organic compounds and may be produced
by aquatic plants or decaying matter. The smell/odour of water can be measured I terms of the greatest
dilution of a sample, or the number of times a sample of water has to be halved with odour free water
that yields the least definitely perceived odour.
2.7 WATER QUALITY MANAGEMENT POLICIES
Untreated or insufficient treated industrial and municipal wastewater, inappropriate agricultural
practices and poor quality mining and industrial effluent constitute the main causes of water pollution
in southern Africa (Moyo and Mtetwa 2000). However the main causes of surface and ground water
pollution in rural areas in Zimbabwe are poor quality mining and inappropriate agricultural practices.
The main tools of water quality management that should be incorporated include, receiving water
quality objectives, effluent discharge standards, planning tools, best management practices and whole
effluent toxicity approaches and biomonitoring. Though only a few of these tools are applicable in a
rural setup such as Avoca Growth Point where there are no large scale industrial and mining activities,
management of rural water supplies in Zimbabwe is not formally written down into a policy document
and the government is responsible for development, operation and maintenance of the water supplies.
Effective water quality management policies require the cooperation of the government, industries and
12
the general public. Where these policies are not implemented at a national level, other international
water quality guidelines such as the WHO, DWAF and FAO are used.
2.8 NON-POINT SOURCE POLLUTION IDENTIFICATION
The main sources of reservoir pollution originate mainly from point sources (direct discharges into the
water bodies) and diffuse sources (chemicals, bacteria and nutrients from runoff). The area of land
that drains into a stream or reservoir is called a watershed and this watershed influences the non-point
source (NPS) pollution of a water body (Naranjo, undated). The most common NPS pollutants are
soils (sediment) and nutrients picked up by runoff as it flows over watersheds to surface waters. These
pollutants may come from agricultural land and other open spaces, urban areas, construction sites,
roads and parking lots. Organic wastes and fertilizers can introduce nutrients such as nitrogen and
phosphorus, into runoff. When polluted runoff enters reservoirs, nutrients can cause algal blooms and
dense weed growth that disrupt the balance of aquatic ecosystems. The algal blooms result in oxygen
depletion, which can cause odour and taste problems. However, in semi arid rural areas where the
main form of agriculture is livestock rearing, the main source of NPS is organic matter (manure)
including pathogens (bacteria and viruses). In order to produce a complete pollution load assessment,
information on the extent of the watershed basin, type of population (urban or rural), land use, climate
(rainfall), vegetation, soil types is required.
2.9 EMERGING ISSUES
There is an urban bias to water treatment and water quality studies in Zimbabwe, though the majority
of Zimbabweans live in the rural areas (60 %) and rely mainly on open water sources such as open
wells, rivers and reservoirs. Coupled with this, water quality regulations in Zimbabwe are mainly
centred on urban areas; rural communities therefore end up using untreated water for livestock
watering irrigation and domestic uses, increasing health risks and decreasing rural livelihoods. There
is need therefore for continuous water quality monitoring in Zimbabwean rural sources.
13
CHAPTER THREE
3.0 GENERAL MATERIALS AND METHODS
3.1 STUDY AREA
3.1.1 LIMPOPO RIVER BASIN
The Limpopo River basin comprises portions of four countries (Botswana, Mozambique, South Africa
and Zimbabwe). The basin is located between 19.5° and 26.5° South latitude and between 25.5° and
34.5° East longitude. The basin has a total area of approximately 282,000 km2 (Moyce et al., 2006).
Figure 3.1: Limpopo River Basin Map (Adapted from Mwenge, 2004)
14
3.1.2 MZINGWANE CATCHMENT
The Mzingwane catchment (Fig 3.2), forms part of the Limpopo River and is divided into four sub
of water quality erodes the availability of water for humans and ecosystems, increasing financial costs
for human use and decreasing species diversity and abundance of resident communities.
The objective of this chapter was to evaluate the physico-chemical parameters (chloride, nitrate, water
hardness pH, and electrical conductivity) in small reservoirs in Avoca Growth Point, with respect to
domestic, livestock and irrigation use. The study intended to determine if the water quality parameters
were within the set standards for domestic use, small scale irrigation and livestock use according to
WHO, FAO and DWAF respectively. This chapter also determines the presence of microbial
organisms (total coliforms, faecal coliforms and faecal streptococci) in the reservoirs using biological
water quality measures. These water quality parameters were selected because, while nitrate is
important for livestock and human health, total coliforms, EC, calcium and magnesium are regarded
as four of the five determinants for most developmental studies (Hoko, 2005). The chapter intends to
integrate the findings in the previous water quality perceptions chapter with the analysed laboratory
water quality parameters.
18
4.2 MATERIALS AND METHODS
4.2.1 SAMPLE COLLECTION Water samples were collected from three small reservoirs namely Bova, Sifinini and Avoca, and
compared with Siwaze; a medium sized reservoir. The samples were collected during an eight-month
period (March, April, May, July, August, October December 2006 and February 2007). The samples
were collected at points were the communities collect water for domestic and irrigation uses and
livestock watering using the grab sampling method, which does not require the classification of the
water into temperature and nutrient zones. 500 ml sterilised containers were used to collect samples
for biological analysis and 300 ml containers were used to collect samples for physico-chemical
parameters. Three replicates were collected for each of the following parameters, NO-3, hardness, EC,
Cl-, temperature, pH and bacterial coliforms (total coliforms, faecal coliforms and faecal streptococci)
for each of the four reservoirs. After collection, the samples were placed in a cooler box with ice while
being transported to the laboratory for analysis.
4.2.2 ANALYSIS OF PHYSICO- CHEMICAL WATER QUALITY PARAMETER
Temperature was determined in the field using laboratory thermometer and pH was determined in the
laboratory at the University of Zimbabwe using a 3510-pH meter model. Electrical conductivity and
TDS were determined using an EcoScan Con5 conductivity meter. TDS of the water samples was
estimated by multiplying the temperature normalised electrical conductivity by 0.55-0.9 (Sawyer et
al., 1994), which is the widely accepted range. The average of this range (0.725) was used to calculate
TDS. The following equation was used:
TDS (in mg/L or ppm) = 0.725x EC25 (in micromhos/cm) eqn4.1
Chloride determination (Mohr method) A filtered water sample (10 ml) was pipetted into a 250ml Erlenmeyer flask and diluted by adding
65ml of distilled water. Potassium chromate 0.25M (1 ml) was added into the flask, and the solution
was titrated with a 0.075M standard of silver nitrate (AgN03) and the end point was indicated by the
presence of a persistent red-brown colour. The same procedure was carried out with a blank solution
19
and the Cl- concentration was determined by subtracting the volume of AgN03, for the blank from the
average used for the sample (Clesceri et al., 1989).
Nitrates
Nitrate and ammonia (NH4+) was determined by pipetting 5 ml of sample into a flask, 5 granules of
NaOH and a pinch of Devarda’s alloy was added to the solution. The solution was distilled into a vile
containing 5 ml of 0.02 M HCl. About 38 ml of distillate was collected and 1 ml of 6% EDTA was
added to the distillate. Sodium Nitroprusside (4 ml) and 2 ml of buffer solution was then added and
mixed thoroughly. Colour was allowed to develop for 1 hr and the N03- and (NH4
+) determined on a
UV spectrophotometer at 667nm. The N03- was determined from prepared standards. The (NH4
+) was
determined using the above procedure and the N03- value was obtained by subtracting the (NH4
+) from
the N03- + (NH4
+) value.
Total hardness
Total hardness was determined by pipetting the water sample (50 ml) into a conical flask. Sodium
hydroxide solution (2 ml) was added to the water solution using a dispenser. Approximately 0.2g of
Murexide/ NaCl indicator was then added. The resultant mixture was titrated with 0.01 EDTA mixing
continuously until the colour changed from pink to purple. The volume of EDTA used was then used
to calculate the calcium and the calcium hardness (Basset et al., 1978: Van Loon, 1982).
4.2.3 MICROBIOLOGICAL ANALYSES
Faecal coliform, total coliforms, and faecal streptococci counts were performed using the 3-tube
MacConkey Method, Most Probable Number (MPN) (Oblinger and Koburger, 1975). The MPN
method uses a test tube full of media with a smaller inverted test tube inside which captures carbon
dioxide gas released from the growth of coliform bacteria. A series of dilutions and replicates are set
up, and those producing gas in 24 hrs at 35 0C are counted. A statistical analysis was used to
determine the most probable number of bacteria cells present.
20
4.3 RESULTS
4.3.1 BIOLOGICAL PARAMETERS
Bacterial Coliforms
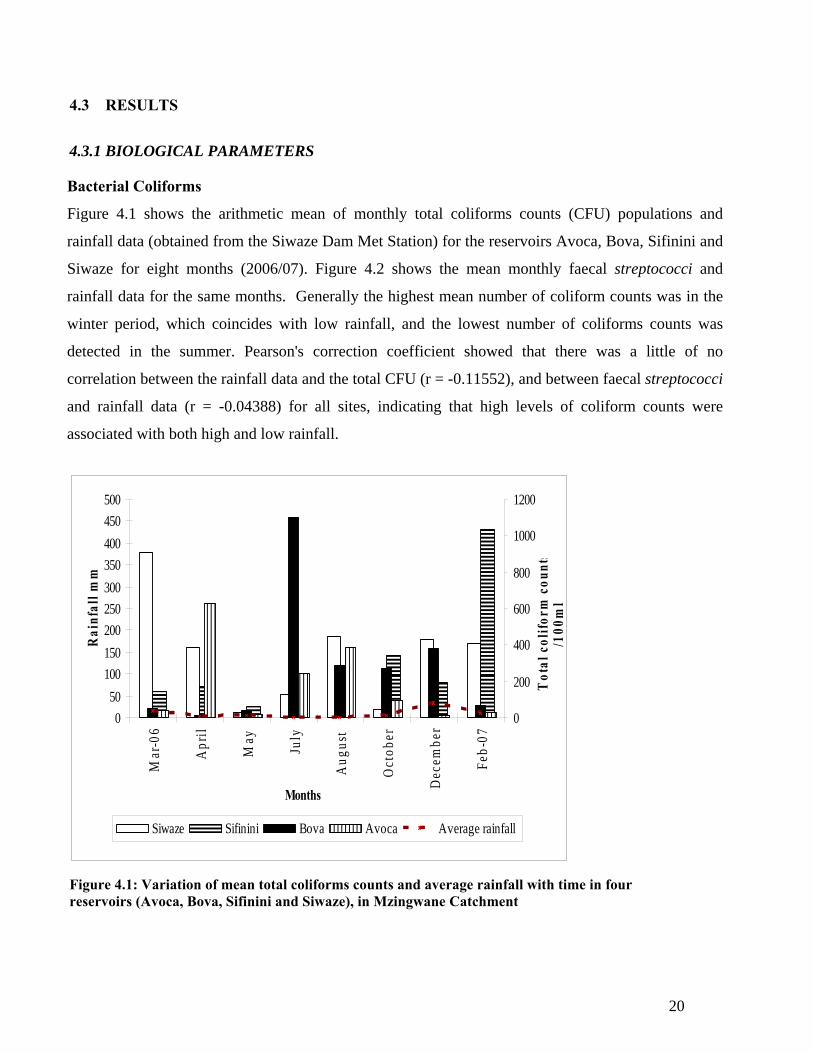
Figure 4.1 shows the arithmetic mean of monthly total coliforms counts (CFU) populations and
rainfall data (obtained from the Siwaze Dam Met Station) for the reservoirs Avoca, Bova, Sifinini and
Siwaze for eight months (2006/07). Figure 4.2 shows the mean monthly faecal streptococci and
rainfall data for the same months. Generally the highest mean number of coliform counts was in the
winter period, which coincides with low rainfall, and the lowest number of coliforms counts was
detected in the summer. Pearson's correction coefficient showed that there was a little of no
correlation between the rainfall data and the total CFU (r = -0.11552), and between faecal streptococci
and rainfall data (r = -0.04388) for all sites, indicating that high levels of coliform counts were
associated with both high and low rainfall.
050
100150200250300350400450500
Mar
-06
Apr
il
May
July
Aug
ust
Oct
ober
Dec
embe
r
Feb-
07
Months
Rai
nfal
l mm
0
200
400
600
800
1000
1200
Tot
al c
olifo
rm c
ount
s/1
00m
l
Siwaze Sifinini Bova Avoca Average rainfall
Figure 4.1: Variation of mean total coliforms counts and average rainfall with time in four reservoirs (Avoca, Bova, Sifinini and Siwaze), in Mzingwane Catchment
21
0
100
200300
400
500M
ar-0
6
Apr
il
May
July
Aug
ust
Oct
ober
Dec
embe
r
Feb-
07
Months
Rai
nfal
l mm
-20
30
80130
180
230
feac
al st
rept
ococ
cico
unts
/100
ml
Bova Avoca Sifinini Siwaze Average rainfall
Figure 4.2: Variation of mean faecal streptococci counts and average rainfall with time in four reservoirs (Avoca, Bova, Sifinini and Siwaze), Mzingwane Catchment.
4.3.2 PHYSICO-CHEMICAL PARAMETERS EC
Electrical conductivity (EC) values for the reservoirs were generally low with Bova ranging from 125
µS/cm in March to 320.67 µS/cm in October, 140.5 µS/cm in March to 309 µS/cm in October for
Avoca, 200 µS/cm in May to 409.5 µS/cm in October for Sifinini and 161.1 µS/cm in March to 258
µS/cm in October for Siwaze. These EC values for all reservoirs were below the FAO (1985)
irrigation guidelines of 700 µS/cm (Figure 5.3). There is no restriction to use water with EC values
less than 700 µS/cm, for irrigation purposes. Mwarura (2006) detected EC values ranging from 37
µS/cm to 101 µS/cm in small plateau reservoirs in Kenya, which are low compared to those obtained
in this study.
22
Figure 4.3: Variation of mean EC with time (months) for reservoirs Avoca, Bova, Sifinini and Siwaze.
pH
The pH values for all reservoirs were generally in the range of 6.7 to 10.45 (Figure 4.4), with Bova
reaching the highest pH (10.45) in the month of April, the pH values obtained in this study were
generally higher than those obtained from a similar study in Kenya (Mwarura, 2006) which ranged
from 6.9 to 7.9. The higher pH recorded in the months of March and April 2006 was probably due to
higher organic matter and suspended solids after the high rains which fell in December and January
2005.
There was a significant difference between the interaction of months and reservoirs (p = 0.008).
Therefore the pH levels in the reservoirs differ with months and between the reservoirs. The
difference in pH with months and between the reservoirs may be caused by the fact that these
reservoirs lie within different watersheds, with different areas, which may differ in both point source
and non- point source pollution sources.
01 0 02 0 03 0 04 0 05 0 06 0 07 0 08 0 0
Mar
-06
Apr
il
May
July
Aug
ust
Oct
ober
Dec
embe
r
Feb-
07
M o n t h
Mea
n EC
uS/
cm
B o v a A v o c a S if in in i S iw a z e
F A O i r r i g a t i o n g u i d e l i n e
L s d = 1 8 . 2 2t i m e * s i t e s
23
Figure 4 .4: Variation of mean pH with time (months) for reservoirs Avoca, Bova, Sifinini and Siwaze.
Hardness
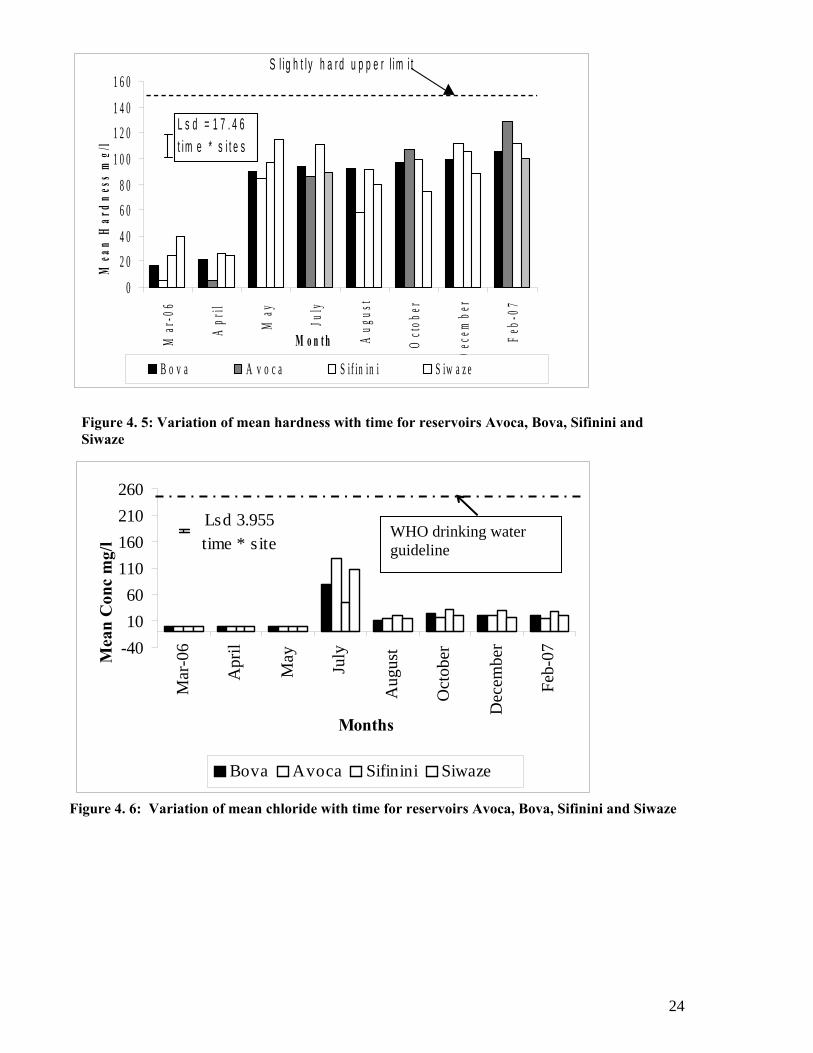
Water hardness in all the reservoirs was in the range of 5.33 mgl-1 to 114.67 mgl-1 (Figure 4.5), with
the highest value recorded in the month of February 2007 in the Avoca reservoir. This range was
within the WHO (2003) drinking water guideline of 500mg/l (as calcium carbonate), which is mainly
based on taste and household use considerations, however no health-based guideline value for
hardness has been established. With the consideration of water hardness only the water in the
reservoirs does not interfere with its drinking water uses.
Chloride
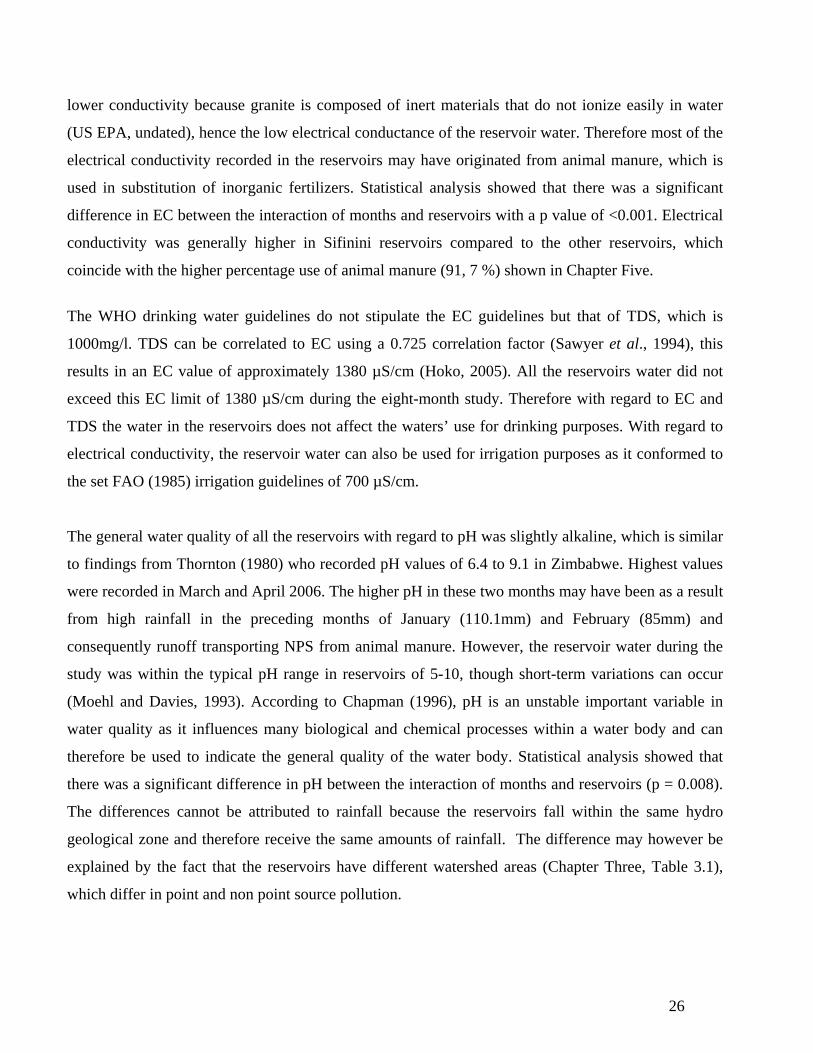
Chloride values for all the reservoirs ranged from 0.06mg l-1 to 106 mg l-1 with highest values being
recorded in the month of July 2006 as shown in Figure 4.6. The levels increased from the summer to
the winter because minerals in reservoirs tend to be concentrated by evaporation and altered by
chemical and biological interactions in the reservoirs, when there is minimal dilution from runoff and
rainfall. There was a significant difference between the interaction of months and reservoirs (p =
0.001). Therefore the chloride levels in the reservoirs differ with months and between the reservoirs.
0
5
1 0
1 5
Mar
ch
Apr
il
May
July
Aug
ust
Oct
ober
Dec
embe
r
Febr
uary
M o n t h
pH
0
2 0
4 0
6 0
8 0
1 0 0
1 2 0
Rai
nfal
l mm
B o v a A v o c a S if in in iS iw a z e A v e r a g e r a in f a ll
L s d 0 . 4 t im e * s i t e s
F A O i r i g a t i o n g u i d e l i n e
24
Figure 4. 5: Variation of mean hardness with time for reservoirs Avoca, Bova, Sifinini and Siwaze
Figure 4. 6: Variation of mean chloride with time for reservoirs Avoca, Bova, Sifinini and Siwaze
02 04 06 08 0
1 0 01 2 01 4 01 6 0
Mar
-06
Apr
il
May
July
Aug
ust
Oct
ober
Dec
embe
r
Feb-
07
M o n t h
Mea
n H
ardn
ess
mg/
l
B o v a A v o c a S if in in i S iw a z e
S l i g h t l y h a r d u p p e r l i m i t
L s d = 1 7 . 4 6 t i m e * s i t e s
Lsd 3.955 time * s ite
-401060
110160210260
Mar
-06
Apr
il
May
July
Aug
ust
Oct
ober
Dec
embe
r
Feb-
07
Months
Mea
n C
onc
mg/
l
Bova Avoca Sifinini Siwaze
WHO drinking water guideline
25
4.3 DISCUSSION
The negative correlation between total coliforms and rainfall (r = -0.11552), and between faecal
streptococci and rainfall data (r = -0.04388) indicated that there was little or no association between
rainfall and coliform counts (- 0.3 to + 0.3). High levels of coliform counts were associated with both
high and low rainfall amounts. The results obtained by (Bezuidenhout et al., 2002) in the Mhlathuze
river in South Africa showed a positive correlation between rainfall and total coliform counts (r =
0.646). This is however expected because according to Mau Pope (1999), faecal coliform
concentrations are typically much greater in streams during runoff conditions because of non-point-
source pollution from the watershed. These contributions can originate from deposition of faecal
material by livestock and wildlife or from the use of manure as a soil amendment. However, the
contributions of streams to reservoirs in terms of faecal coliforms is minimal due to the fact that
watersheds tend to have a filtering mechanism and also because bacteria transported into the reservoir
by tributary streams are subject to die off and decrease in population because of predation by other
organisms.
During the winter season, livestock in the watersheds have limited watering sources and rely mainly
on the reservoirs for drinking water. This results in an increase in total faecal coliform contamination
from the livestock intestines into the reservoirs. In Zimbabwe the 2006/07 rainy season has been
declared a drought year, therefore there was minimal rainfall to contribute to faecal contamination of
reservoirs through runoff, except for flush floods, hence the changing concentration of total coliforms
during the summer and wet season.
The WHO irrigation guideline for total coliforms is 1000 counts per 100ml, and that for faecal
coliforms is 100 counts per 100ml. The total coliform counts in the reservoirs were generally within
these ranges, therefore with regard to total coliform counts, the reservoirs may be used for irrigation
purposes. However the water in the reservoirs is not suitable for drinking purposes because according
to WHO (2002), water that is intended for drinking purposes, should not have any detectable
thermotolerant coliforms in 100 ml sample.
Electrical conductivity mainly gives an indication of the following ions, Ca2+, Mg2+, NO-
3, Fe2+, and
Na+and AL3+. The villagers in Avoca growth point use minimal inorganic fertilizers, as shown in
Chapter Four, section 4.3.2, and the bedrock is of granitic origin (DRSS, 1979) which tends to have a
26
lower conductivity because granite is composed of inert materials that do not ionize easily in water
(US EPA, undated), hence the low electrical conductance of the reservoir water. Therefore most of the
electrical conductivity recorded in the reservoirs may have originated from animal manure, which is
used in substitution of inorganic fertilizers. Statistical analysis showed that there was a significant
difference in EC between the interaction of months and reservoirs with a p value of <0.001. Electrical
conductivity was generally higher in Sifinini reservoirs compared to the other reservoirs, which
coincide with the higher percentage use of animal manure (91, 7 %) shown in Chapter Five.
The WHO drinking water guidelines do not stipulate the EC guidelines but that of TDS, which is
1000mg/l. TDS can be correlated to EC using a 0.725 correlation factor (Sawyer et al., 1994), this
results in an EC value of approximately 1380 µS/cm (Hoko, 2005). All the reservoirs water did not
exceed this EC limit of 1380 µS/cm during the eight-month study. Therefore with regard to EC and
TDS the water in the reservoirs does not affect the waters’ use for drinking purposes. With regard to
electrical conductivity, the reservoir water can also be used for irrigation purposes as it conformed to
the set FAO (1985) irrigation guidelines of 700 µS/cm.
The general water quality of all the reservoirs with regard to pH was slightly alkaline, which is similar
to findings from Thornton (1980) who recorded pH values of 6.4 to 9.1 in Zimbabwe. Highest values
were recorded in March and April 2006. The higher pH in these two months may have been as a result
from high rainfall in the preceding months of January (110.1mm) and February (85mm) and
consequently runoff transporting NPS from animal manure. However, the reservoir water during the
study was within the typical pH range in reservoirs of 5-10, though short-term variations can occur
(Moehl and Davies, 1993). According to Chapman (1996), pH is an unstable important variable in
water quality as it influences many biological and chemical processes within a water body and can
therefore be used to indicate the general quality of the water body. Statistical analysis showed that
there was a significant difference in pH between the interaction of months and reservoirs (p = 0.008).
The differences cannot be attributed to rainfall because the reservoirs fall within the same hydro
geological zone and therefore receive the same amounts of rainfall. The difference may however be
explained by the fact that the reservoirs have different watershed areas (Chapter Three, Table 3.1),
which differ in point and non point source pollution.
27
The Department of Water Affairs and Forestry does not stipulate a pH guideline for livestock.
However, according to Bagley et al., (1997) the preferred pH for dairy animals is 6.0 to 8.0 and for
other livestock is 5.5 to 8.3. This pH ranges were only exceeded in March and April 2006, which
recorded pH values as high as 10.45. Highly alkaline waters may cause digestive upsets, diarrhoea,
poor feed conversion and reduced water/feed intake.
World Health Organisation (1993) pH aesthetic drinking water guideline is < 8 and the DWAF
(1996a) target water quality range for pH in water for domestic use is 6 – 9. Generally the pH in the
reservoirs fell within these ranges, therefore the pH of the reservoirs may be considered not to be
affecting the reservoirs’ use for domestic use.
Chloride is a common constituent in water and because of its highly solubility tends to accumulate in
nature. It is found only as chloride in the form of sodium, potassium, calcium and magnesium
chloride. It can only be removed from water by electrolysis (DWAF, 1996a). Effects of chloride on
human health may occur at very high levels above 1 200mg/l by disturbance of the electrolyte balance
and nausea. The levels recorded in all the reservoirs were lower than this range. However, according
to the WHO guidelines (2003), there is no health-based guideline value proposed for chloride in
drinking water, but chloride in excess of 250mg/l can give rise to detectable brackish salty taste in
water. Infants are susceptible and fatalities due to dehydration may occur (DWAF, 1996a).
The effect of high levels of chloride (1500mg/l) in water for livestock use is unpalatability. The
common livestock in Avoca is mainly cattle, donkeys and goats. Poultry, pigs and sheep are more
susceptible to excess chloride as indicated in Appendix 2. The DWAF guidelines are based on the
toxicological and palatability effects of chloride in water used for livestock (DWAF, 1996b). The
chloride values obtained during the study period, where within the DWAF (1996b), livestock
standards and therefore when considering chloride alone, the water in the reservoirs can be used for
livestock watering. The water quality in all the four reservoirs was also within the FAO (1999)
chloride irrigation guideline of 250mg/l, and therefore with regard to this parameter alone the water
can be used for surface irrigation.
28
4.4 CONCLUSION
The water in all the reservoirs was found not to be suitable for drinking purposes according to the
WHO drinking water guidelines. However the water was found to be suitable for irrigation and
livestock use according to the FAO and DWAF guidelines respectively.
The water in all the reservoirs can be used for irrigation purposes throughout the year as it conformed
to the set FAO (1985) irrigation guidelines for EC (700 µS/cm), and generally within the pH irrigation
guidelines of 6.5 to 8.5 except for the first two study months. The water in all the reservoirs was also
within the chloride irrigation water guidelines of 250 mg/l with chloride values in the reservoirs
ranging from 0.06 mg l-1 to 106 mg l-1. The water in the reservoir can also be used for livestock
watering purposes as the water quality conformed to a pH guideline of 5.5 to 8.3 and to the DWAF
chloride guideline for 1500 mg/l.
However, although the reservoir water was within the WHO, pH, EC and chloride drinking water
guideline, it did not conform to the same standard guideline for total coliforms. Therefore cannot be
used for drinking purposes, as water that is ingested by humans without treatment requires the highest
water quality standards to reduce incidences of illnesses such as cholera, salmonella spp and
dysentery.
Therefore the hypotheses that water in small reservoirs is not suitable for small irrigation, domestic
use and livestock watering according to the FAO, WHO and DWAF standards respectively, could not
be accepted when considering irrigation and livestock watering, but it was accepted when considering
drinking water use.
29
CHAPTER FIVE
VILLAGERS’ WATER QUALITY PERCEPTIONS (Colour, Smell, Taste, Soap Consumption and Frothing when Boiling) OF SMALL RESERVOIRS IN MZINGWANE
CATCHMENT.
5.1 INTRODUCTION
Water quality of surface or ground water is defined as a function of either or both natural influences
and human activities. The natural influences that determine water quality are weathering of bedrock
minerals, atmospheric processes of evapotranspiration and the deposition of dust and salt by wind,
natural leaching of organic matter and nutrients from soil, hydrological factors that lead to runoff, and
biological processes within the aquatic environment that can alter the physical and chemical
composition of water (GEMS/Water Program, 2006). Water quality is important not only to protect
public health but water provides ecosystem habitats, is used for irrigation, livestock watering and
contributes to recreation and tourism. Water quality requirements and consumer perceptions therefore
differ for different water uses, such as domestic or agriculture, therefore water quality should be
determined according to different uses. Water quality requirement for a particular use plays an
important role in the management of water resources and in turn forms an integral part of water
quality management (Parsons and Tredoux, 1995).
The objective of this chapter was to determine the villagers’ water quality perceptions (colour, soap
consumption, taste, frothing when boiling and smell) in the Avoca community through questionnaires.
The selected perceptions relate to human senses of smell, taste and sight and can be linked to the
selected physico-chemical parameters in Chapter Four. This chapter is a follow up study to the socio-
economic study done in the same area by Sithole (2005). The target group of this study chapter was
the communities that use the reservoirs for multiple uses. Communities within a reservoir watershed
were interviewed for their water quality perceptions of the respective reservoir.
5.2 MATERIALS AND METHODS
A structured questionnaire (Appendix 3) with fill in the blank and binary type (for example yes/no) of
questions intended to obtain information on consumer water quality perceptions (colour, taste, soap
30
consumption and frothing when boiling) of the villagers’ was administered in the Avoca, Bova,
Sifinini and Siwaze watersheds in Avoca growth point, Filabusi. A total of 54 households were
interviewed, 18, 8, 12 and 16 households for Avoca, Bova, Sifinini and Siwaze watersheds
respectively in February 2007. The survey was conducted with the assistance of two enumerators, for
translation purposes, as the people in the study area are Ndebele speaking. The questionnaire also
generated information on the time in which water is abundant in the reservoirs, farming information
and water management aspects.
5.3 RESULTS
5.3.1 PROFILE OF THE RESPONDENTS
Stakeholder participation has been identified as key aspect in enhancing the sustainability of
water supply facilities throughout the world (Vhevha and Manzungu, 2007). The respondents in
all the reservoirs constituted of individuals within households who were above the age of 20
years and constituted both males and females (Table 5.1). The highest percentage of
respondents was generally in the 20 -35 and the 66 – 85 age groups. This age limit was selected
because it was considered that people above this age group were cable of answering the
questions in the questionnaire.
5.3.2 WATER QUALITY PERCEPTIONS The majority of the respondents in all the four watersheds Avoca (89.5 %) as shown in Figure 4.1,
Bova (62.5%), Sifinini (75 %) and Siwaze (93.8 %) indicated that the water in the reservoirs had a
satisfactory colour during the wet season with responses such as clear, muddy, green and brown
given. The majority of the respondents Avoca (94, 7 %), Bova (87, 5 %) and Siwaze (87.5 %) except
for Sifinini (33.3 %) did not have a problem with the smell of the reservoir water during the wet
season as well. Generally the respondents did not have a problem with the water quality indicators
during the wet season as opposed to the dry season, as shown in Table 4.1. The highest soap
consumption was perceived in the dry season in Avoca and Bova watersheds (Table 4.1). Water in all
the reservoirs frothed more while boiling in the dry season than in the wet season, with responses such
as green, brown and muddy froth given.
31
Table 5.1 Profile of respondents for the reservoirs Avoca, Bova, Sifinini and Siwaze (N=54)
Age Group Reservoir Frequency Percentage
20 - 35 Avoca 6 31.2
Bova 2 25
Sifinini 3 24.9
Siwaze 2 12.5
36 -45 Avoca 0 0
Bova 2 25
Sifinini 2 16.6
Siwaze 4 25
46 -55 Avoca 3 15.9
Bova 2 25
Sifinini 0 0
Siwaze 2 12.5
56 -65 Avoca 3 15.9
Bova 0 0
Sifinini 3 24.9
Siwaze 5 37.5
66 -85 Avoca 5 26.5
Bova 2 25
Sifinini 4 33.2
Siwaze 3 18.75
Table 5.2: Villager’s water quality perceptions of the small reservoirs (Avoca, Bova, Sifinini and Siwaze)
*Respondents could not comment for that particular perception DS: Dry and WS: Wet season
RESERVOIR WATER QUALITY PERCEPTION (% SATISFACTORY) (N=54)
Borehole Open well SiwazeSand water mining River TapRoof water harvesting Other
Figure 5.6 Water uses in the dry and wet season and % households interviewed in the Siwaze watershed (N = 16).
5.3.5 WATER AVAILABILITY IN RESERVOIRS Water availability in all the reservoirs, was found to be generally between November (or October if
the rains come early) and March/ April as shown in Table 5.4. Zimbabwe experiences a single annul
rainy season of five months (November to March) as shown in figure 5.7, which corresponds to the
period of water availability in the reservoirs. Table 5.4: Months in which the water is available in the four reservoirs (Avoca, Bova, Sifinini and Siwaze)
* The coloured section of the table indicates the period of water availability in the reservoirs.
ReservoirJan Feb Mar Apr May Jun Jul Aug Sept Oct Nov Dec
AvocaBovaSifininiSiwaze
Month
39
0.020.040.060.080.0
100.0120.0140.0160.0
Nov Dec Jan Feb Mar Apr May Jun Jul Aug Sep
Month
Mea
n m
onth
ly r
ainf
all m
m
2006/07 2005/06
Figure 5.7: Mean monthly rainfall for the 2006/2007 rainy seasons, (ZINWA Siwaze station).
5.4 DISCUSSION
The perceived colour (muddy, green and brown) of small reservoir water in both seasons may be
attributed to dissolved organic material and inorganic substances such as manganese, aluminium, iron,
copper and total dissolved solids. Although most of the respondents complained of highly coloured
water in the dry season, the consumption of this water will not necessarily affect health; however, this
is dependant on the concentrations and types of elements responsible for the colour in the water.
Colour is a subjective parameter since it is influenced by an individual’s eyesight. While taste and
smell/odour originates generally from inorganic substances (chlorides, copper, pH, sulphate and
manganese) present in concentrations much higher than those of organic substances (EPA, 1992).
However, when the water is perceived to have an odour/smell it also relates to a higher than normal
biological activity. The odour/smell of water is a simple test for the suitability of drinking water, since
the human sense of smell is far more sensitive to low concentrations of substances than human taste.
Organic matter also contributes to taste and smell, the major cause in water being metabolites
produced by algae and actinomyctes (EPA, 1992). Taste and smell/odour are also subjective to the
individual being interviewed.
40
Land application of animal manure has its own benefits, such as an increase in soil physical and
chemical properties. However, according to Risse et al (undated), land application of animal manure
results in potential surface water pollution, associated with runoff. Pollutants of concern include
organic materials (which contribute to reservoir colour and smell), nutrients and pathogenic
microorganisms (Risse et al., undated). Nutrients such as nitrogen and phosphorus are the most
common pollutants associated with animal waste. Several studies have documented that watersheds
concentrating on animal agriculture tend to have higher nutrient levels in their drainage systems,
which end up in reservoirs (Risse et al., undated).
Despite the fact that water in small reservoirs maybe potentially polluted, these water sources have
multiple uses which include livestock watering, domestic uses, irrigation, fishing, brick making and
recreation purposes (Rusere, 2005). The three small reservoirs under study served as a water source
for various uses both in the dry and wet season, but mainly in the dry season because of the reduced
availability of other water sources. However the interviews conducted on water quality perceptions
indicated that the water quality was unsatisfactory during the dry season, when it is in demand the
most. Small reservoirs have limited storage capacity, therefore they respond rapidly to precipitation
runoff, often refilling rapidly at the start of the rainy season (Keller et al., 2000). The high mean
maximum daily temperatures in the Limpopo River Basin vary from about 30-340C in summer to 22-
260C in the winter. These high temperatures result in high evaporation rates, which range from 1600
mm/yr to more than 2600 mm/yr (FAO and UNCTAD, 2003). Small reservoirs have high surface area
to volume ratio and this result in significant evaporation loss, hence the reduced water abundance in
the dry season. Losses due to evaporation from these reservoirs can be as high as 50% of their
impoundments in the arid and semi arid regions (Gleick 1993 and Sakthivadivel et al., 1997).
Small reservoirs improve human livelihoods and reduce poverty due to their multiple-purpose use,
which increase household incomes. There are, for instance, some 1500 multi-purpose small reservoirs
in Burkina Faso and these provide small-scale food and livestock production (Williams and Carriger,
2006). Most villagers tend to use a water source closer to their homesteads, and livestock tend to be
watered from a watering source close to where they graze, such that villagers who do not have a
borehole close to their homesteads, sand abstract drinking water from rivers close to their homesteads.
Water abstraction from sand was a common practice during the time of the survey (2006/2007) rainy
season (Figure 4.6) because there was below average rainfall, such that the farming season was
41
declared a drought season (Met Department, 2007). The highest rainfall for the season was recorded
during the month of November 2006 (148.7 mm).
5.5 CONCLUSION
Villagers’ water quality perceptions of the reservoirs differed depending on the season (dry or
wet), with most of the respondents being satisfied with the studied water quality perceptions
during the wet season. The perceived smell and soap consumption of the reservoir water proved
to be the most important water quality perceptions as they generally had higher percentages of
satisfaction in the wet season for most of the reservoirs.
Agricultural inputs are a continuous challenge especially for communal farmers in Zimbabwe such
that people in the semi arid Mzingwane Catchment for example those in the Avoca watershed use on
average as little as 6.6kg/ha N and depend mainly on animal manure for soil amendments. The animal
manure contributes to non-point source pollution in the form of agricultural runoff and to some of the
perceptions, taste and smell.
There is therefore a correlation between analysed laboratory water quality parameters and the
community water quality perceptions. Generally the water quality was perceived to be unsatisfactory
during the dry season, which can be linked to the analysed laboratory parameters, which recorded
higher concentrations of most parameters in the dry than the wet season.
42
CHAPTER SIX
NON POINT SOURCE POLLUTION IDENTIFICATION AND POLLUTION LOADING IN AVOCA GROWTH POINT, MZINGWANE CATCHMENT.
6.1 INTRODUCTION
Population growth results in an increasing demand for land and water resources. Over exploitation of
these resources through agricultural activities leads to environmental degradation including pollution
of streams and reservoirs. Non- point source agricultural pollution is one of the major factors in
polluting surface waters in agricultural areas (Dayawansa, 1997). The non-point agricultural pollutants
are organic and inorganic materials including sediments, plant nutrients, pesticides and animal wastes
entering surface and ground waters form non-specific or undefined sources in sufficient quantities to
contribute to the problem of pollution.
Pollution loading is a term used to indicate the amount of a pollutant entering or within a water
resource. Pollution loading differs with concentration in terms of how the amount of pollutant in the
water is expressed, and the time frame over which the pollutant is generated or released into the water
resource. Loading is the total amount of a pollutant generated from a specific area of land, or received
by a water resource, during a fixed period of time. Therefore pollution loading provides information
about the land area producing the pollutant, the time over which the pollutant enters the water
resource and the total amount of pollutant delivered (Leeds et al., 1992).
Non point source pollution loading and identification results in the estimation of all the possible
pollutant sources in the reservoirs and aids in the water quality management of reservoirs. The
objective of this chapter was to identify and estimate non-point source pollution loading in the
reservoirs Avoca, Sifinini, Siwaze and Bova watersheds.
6.2 MATERIALS AND METHODS
6.2.1 POLLUTION LOADING
The pollution loading (PL) of the following pollutants (NO-
3, hardness, EC, Cl-, pH) in each stream
that drains into each of the reservoirs (Bova, Avoca, Sifinini and Siwaze) was determined using the
Table 6.1: Mean concentration of ( Cl-, Hardness, and EC) and average flow rates for stream leading to Avoca, Bova, Sifinini and Siwaze reservoirs in October 2006.
Table 6.2: Pollution loading of (NO3, Cl-, Hardness, And EC) for Avoca, Bova, Sifinini and Siwaze Reservoirs.
Siwazes’ watershed contains the other three small reservoir watersheds as shown in Figure 6.1
below. The main non point source pollution pollutants originated from homesteads with each
homestead comprising a livestock kraal, a blair toilet and being surrounded by a farming field
(Figure 6.3). Most of the households use a reservoir closest to their homesteads as shown in
Figure 6.3 below.
Figure 6.1. Small reservoir location in Siwaze watershed
46
Figure 6.2: Study site location in relation to Mzingwane Catchment
Figure 6.3: Non point source pollutants in each reservoir’s (Avoca, Bova, Sifinini and
Siwaze) watershed.
47
6.4 DISCUSSION
The results from the questionnaires administered indicated that there is minimal use of both
Compound D and Ammonium Nitrate fertilizers in all the watersheds as shown in Chapter 4, Table
4.2 above. On average the application rate of Compound D fertilizer in the Avoca watershed is at least
26.6 kg/ha, which translates to 6.6 kg/ha of N (nitrate) and K (potassium) and 13.28 kg/ha of P
(phosphorus). The respondents in the Bova watershed indicated that they use 12.5 kg/ha N and K and
25 kg/ha of P. The other two reservoirs, Sifinini and Siwaze indicated that they do not use any
fertilizer for soil amendment and they rely mainly on land application of animal manure. The
application rate of nitrate-N in sandy soils is 100-120 kgN/ha (Seed Co, 2001). The minimal use
fertilizer explains the low nitrate loading. However the low nitrate levels recorded is expected because
nitrate levels in natural waters seldom exceed a daily load of 0.1mg/l according to Chapman (1992).
The low specific conductance for all the streams that lead to respective reservoirs (5.316 mg/l to 57.75
mg/l) indicates low mineral salt and metal concentration. Low mineral salts translate to low levels of
calcium and magnesium carbonate hardness (Ntengwe, 2005). The bedrock in Avoca is of granitic
origin (DRSS, 1979), which tends to have a lower conductivity because granite is composed of inert
materials that do not ionize easily in water (US EPA, undated), hence the low electrical conductance
and hardness of the water in the streams that feed the four reservoirs. Therefore most of the electrical
conductivity recorded in the reservoirs may have originated from animal manure, which is used in
substitution of inorganic fertilizers.
Most non-point source pollutants originated from homestead, which are surrounded by farming fields,
and from the blair toilets and livestock kraals within each homestead. Bova includes a business centre
and livestock selling pens, which also contribute to non point source pollution. Homesteads utilizing
the Avoca reservoir contribute non point source pollutants to the Bova reservoir. Siwaze (medium
sized) recorded the highest pollutant loading compared to the other reservoirs, because it has a larger
watershed, which includes the other three watersheds.
48
6.5 CONCLUSION
Pollutant loading ranged from 13.5 mg/s to 117.3 mg/s for hardness, 2.9 mg/s to 96.7mg/s for chloride
and 95 mg/s to 132 mg/s for electrical conductivity. Therefore non point source pollution, originating
from homesteads and farming fields affects water quality in small reservoirs. Siwaze had a higher
pollutant load compared to the other three reservoirs as it has a larger watershed indicating that non
point source pollution varies depending on the watershed area, and the activities within a specific
watershed.
49
CHAPTER SEVEN
GENERAL DISCUSSION CONCLUSION AND RECOMMENDATIONS 7.1 GENERAL DISCUSSION Despite the uncertainties regarding the nutrient availability of animal manure, rural communities in
Avoca depend highly on animal manure for soil amendment with percentage usages in watersheds
being as high as 77.8 %, 62.5 %, 91.7 % and 68.7 % for Avoca, Bova, Sifinini and Siwaze watersheds
respectively. Animal manure is a source of plant nutrients such as N, P, K, however these plant
nutrients are not readily available in manure as they are in inorganic fertilizers. The availability of
animal manure nutrients is highly dependant on the time of application as well as the application rate.
Uncertainties regarding these two factors results in nutrients loss through leaching and surface runoff,
which results in surface and ground water pollution (Risse, undated). Reservoir pollution from animal
manure results in the colour, smell/odour and taste of the reservoir water reported by the respondents.
The respondents in all the watersheds under study indicated that they use minimal inorganic fertilizers
with application rates as low as 26.6 kg/ha, which relates to 6.6 kg/ha of N (nitrate) and K (potassium)
and 13.28 kg/ha of P (phosphorus) in the Avoca watershed.
The main source of bacterial coliforms in the semi arid reservoirs in Mzingwane subcatchment is from
livestock, agricultural runoff and through flow from blair toilets and livestock kraals. The factors that
influence bacterial growth and abundance in water bodies include light, salinity, rainfall, predation,
available nutrients and environmental pollutants (Pernthaler et al., 1998; Lobitz et al., 2000; Solo-
Gabriele et al., 2000). The negative correlation between total coliforms and rainfall (r = -0.11552),
and between faecal streptococci and rainfall data (r = -0.04388) indicated that there was little or no
association between rainfall and coliform counts (- 0.3 to + 0.3). High levels of coliform counts were
associated with both high and low rainfall amounts. The results obtained in this study are contrary to
those obtained in other studies, Bezuidenhount et al., (2002) found a positive correlation between
rainfall and bacterial coliforms in the Mhalathuze river in South Africa. However the negative
correlation obtained in this study can be explained by the fact that small reservoirs serve primarily as
livestock watering source. During the winter season, livestock in the watersheds have limited watering
sources and rely mainly on the reservoirs for drinking water, during the same time the small reservoirs
have reduced water abundance, this therefore results in increased concentration of bacterial coliforms
during the dry season. The other explanation is that the contributions of streams to reservoirs in terms
50
of faecal coliforms is minimal due to the fact that catchments and watersheds tend to have a filtering
mechanism and also because bacteria transported into the reservoir by tributary streams are subject to
die off and decrease in population because of predation by other organisms.
Based on the WHO guidelines for drinking water, the water in the reservoirs was within stipulated
guidelines for parameters such as Cl-, TDS/EC, and pH. However the reservoir water was not within
the WHO total coliform counts of 0 counts/100 ml, therefore the reservoir water is not suitable for
direct domestic use and may pose a health risk to the villagers concerned. The water can however be
used for irrigation purposes as it was within the FAO (1985) irrigation guidelines for EC (700 µS/cm),
Cl- (250 mg/l) and generally within the pH irrigation guidelines of 6.5 to 8.5 except for the first two
study months.
The Department of Water Affairs and Forestry does not stipulate livestock guidelines for pH and total
coliforms. However using the same livestock guidelines for chloride, which is 1500 mg/l, and the pH
guidelines according Bagley et al., (1997) the water in the reservoirs can be used for livestock
watering throughout the year. The reservoirs’ water was relatively of low salinity, and water recording
less than 1000mg/l TDS (1380 uS/cm EC) does not present any health problems to livestock and
poultry and thus can be used for livestock watering.
Most non-point source pollutants originated from homestead which are surrounded by farming fields
and from the blair toilets and livestock kraals within each homestead. Bova includes a business centre
and livestock selling pens, which also contribute to non- point source pollution. Siwaze (medium
sized) recorded the highest pollutant loading compared to the other reservoirs, because it has a larger
watershed, which includes the other three watersheds.
Small reservoirs are a major source of livelihood in the semi arid area of Avoca. Livelihoods include
market gardening, irrigation, and livestock rearing and to some extent selling bricks and fish, all of
which would not be possible without water from the reservoirs (Sithole, 2005), most of which require
water of substantial quality. Water quality is thus closely linked to water use and to the state of
economic development
51
7.2 CONCLUSION
The water in all the reservoirs was found not to be suitable for drinking purposes according to the
WHO drinking water guidelines, but was found to be suitable for irrigation and livestock use
according to the FAO and DWAF guidelines respectively. The hypothesis that water in small
reservoirs is not suitable for small irrigation, domestic use and livestock watering according to the
FAO, WHO and DWAF standards respectively could not be accepted when considering irrigation and
livestock watering. However the same hypothesis was accepted when considering the use of the
reservoir water for drinking purposes.
Villagers’ water quality perceptions of the reservoirs differed depending on the season (dry or wet),
with most of the respondents being satisfied with the studied water quality perceptions during the wet
season. The perceived smell and soap consumption of the reservoir water proved to be the most
important water quality perceptions as they generally had higher percentages of satisfaction in the wet
season for most of the reservoirs. There was a correlation between analysed laboratory water quality
parameters and the community water quality perceptions. Generally the water quality was perceived to
be unsatisfactory during the dry season, which can be linked to the analysed laboratory parameters,
which recorded higher concentrations of most parameters in the dry than the wet season.
Non point source pollution, originating from homesteads and farming fields affects water quality in
small reservoirs. Siwaze had a higher pollutant load compared to the other three reservoirs as it has a
larger watershed indicating that non point source pollution varies depending on the watershed area,
and the activities within a specific watershed.
7.3 RECOMMENDATIONS The 2006/2007 farming season which coincided with the study period was declared a drought year.
Therefore further water quality studies should be carried out in non-drought years to give a true
reflection of the reservoir water quality.
Relatively cheap methods of water purification/treatment such as boiling, and the use of dilute sodium
hypochlorite (Chlorination) should be used before the water is used for drinking purposes to reduce
52
water related diseases. Chlorination is effective for the following, reduction of bacteria and most
viruses, residual protection against contamination, available in Zimbabwe as the common Jik, easy to
use and is of low cost; however chlorination has potential objections by users because of taste and
odour problems.
In order to have an integrated watershed and water quality management, there is need for ground
water quality, sediment quality and non point source pollution modelling studies to complement the
surface water quality studies since water is a continuum. According to Hunt et al., (1999), the amount
of ions carried by ground water through seepage is typically much higher than surface water and could
have a profound effect on water quality. Small reservoirs have low water abundance in the dry season;
this problem however is exacerbated by the fact that the reservoirs are highly silted. Reservoirs’
sediments are a sink of nutrients, therefore mechanical de-sedimentation of the reservoirs could be
inevitable in order to maintain a good water supply in the rural areas. Non point source pollution
modeling results in the estimation of the pollutants that may be a threat to surface water bodies.
Although this could be an expensive venture it could greatly improve water quality by removing
nutrients from their sinks.
53
REFERENCES
Ashton, P.J., Love, D., Mahachi, H., Dirks, P., (2001). An overview of the impact of mining and minerals processing operations on water resources and water quality in the Zambezi, Limpopo and Olifants Catchments in Southern Africa. CSIR report to the Minerals, Mining and Sustainable Development Project, Southern Africa. Pretoria: CSIR. Bagley, C.V., Kotuby-Amachor, J., and Farrell-Poe, K., (1997). Analysis of water quality for livestock, Animal health fact sheet, Utah Bassett, J., Denny, R.C., Jeffery, G.H., and Mendham, J., (1978). Vogel’s Textbook of Quantitative Inorganic Analyses (4th edn.) Longman Group Limited, London. Bezuidenhout, C., Lin, J., Mthembu, N., Biyela, P.T., and Basson, A.K., (2001). The Mhlathuze River Catchment: Bacterial contamination and antibiotic resistance patterns of the isolates. In: CA Brebbia (ed.) Water Pollution VI. Modelling, Measuring and Prediction. Wessex Press, UK. Chapman, D., (1992). Water quality assessment: A guideline to the use of biota, sediments and water in environment monitoring. UNESCO/WHO/UNEP,E&FN Spon, London.
Chapman, D., (1996). Water Quality Assessments (2nd edn) E and FN, Spon. London. Chimowa, M., and Nugent, C., (1993). A fisheries GIS for Zimbabwe: An initial analysis of the numbers, distribution and size of dams. FAO/UNDPZIM/88/021 Clesceri, L.S., Greenberg, A.E., and Trussel, R.R., (1989). Standard methods for examination of water and wastewater. Dayawansa, N.D.K., (1997). Identification of non-point source pollution risk using GIS Remote Sensing, Sri Lanka Department of Research and Specialist Services, (DR&SS)., (1979). Provisional Soil map of Zimbabwe- Pedology and Soil Survey Chemistry and Soil Research Institute Harare. DWAF., (1996a). South African Water Quality Guidelines: Aquatic Systems. DWAF., (1996b) . South African Water Quality Guidelines: Domestic Use. Volume 1; Government Printer: Pretoria.
DWAF., (1996). South African Water Quality Guidelines, Domestic Water Use (2nd edn.), Pretoria.
DWAF., (1996c). South African Water Quality Guidelines: Livestock Watering Volume 5; Government Printer: Pretoria.Volume 4; Government Printer: Pretoria.
54
Ellis, K. V., Warn, A., and White. G., (1989). Surface water pollution and its control, Macmillan Press ltd pg 211-250) FAO, UNCTAD., (2003). Drought impact mitigation and prevention in the Limpopo River Basin, FAO Corporate Document Repository. Agriculture Department. FEWS NET., (2004). The Famine Early Warning System. Zimbabwe Monthly update Gadgil, A., (1998). Drinking water in developing countries. Annual review of energy and environment. GEMS/ Water Program., (2006). World Health Organisation. Gleick, P., (1993). Water in crisis: A guide to the world's fresh water resources. Oxford, England: Oxford University Press. Goldman, C.R., and Horne, A.J., (1983). Limnology. McGraw-Hill, Tokyo. Gray N.F., (1994). Drinking Water Quality, Problems and Solutions. John Wiley and Sons Ltd, England. Hoko, Z., (2005). An assessment of drinking water quality in rural districts in Zimbabwe: the case of Gokwe South, Nkayi, Lupane and Mwenezi Districts. Physics and Chemistry of the Earth 30, 859-866.
Hunt, R.J., Walker, J.F. & D.P. Krabbenhoft (1999). Characterizing hydrology and the importance of groundwater discharge in natural and constructed wetlands. Wetlands 19(2):458-472.
Hussein, J., Motsi K., Vincent, L., Gwenzi, W., and Verbeek, K., (2000). Water Quality in some intensive land use systems part 1 Seke dambo. Paper presented at the UZ/ZIMWESI seminar, Smallholder irrigation at crossroads: a dialogue on the future prospects of smallholder irrigation in Zimbabwe, Held at the Holiday Inn Harare 18-20 July 2000. ICOLD (International Commission on Large Dams). (1998). Position paper on dams and environment, at http://genepi.louis-jean.com/cigb/chartean.html . International Commission on Large Dams.
Juracek, K.E., and Ziegler, A.C., (2006). Effects of nonagricultural human activity on sediment quality—a comparison of trace element concentrations in eight small reservoirs, in Proceedings of the Eighth Federal Interagency Sedimentation Conference, April 2-6, 2006, Reno, Nevada: Subcommittee on Sedimentation, CD-ROM, 8 p.
Kabell, T., (1986). Assessment of Design flood hydrographs. The Zimbabwe Engineer, Vol. 24 (1).
55
Keller, A., Sakthivadivel, R., and Seckler D., (Undated). Water scarcity and the role in development. http://www.cigiar.org/pubs/Pub039/RR039.htm Kempster, P.L., and van Vliet, H.R., (1991); Water Quality Fitness for Domestic Water Use: Draft Internal Report. Hydrological Research Institute, DWAF, Pretoria.
Kreger, C., (2004). Exploring the Environment. Water quality assessment : Chemical hardness. http://www.cotf.edu/ete/modules/waterq3/WQassess3c.html Leeds, R., Brown, L.C., and Watermeier, N.L., (1992). Non-point source pollution: Primer AEX-465- 93. Ohio State University, Extension fact sheet. Food, Agricultural and Biological Engineering. Mandizha, N., (1995). Determination of levels of amitraz in three rivers close to amitraz based cattle dips and adsorption study of amitraz in river sediments` Masters of Science in analytical chemistry thesis (Department of Chemistry, UZ of Zimbabwe). Mau, D.P., and Pope, L.M., (1999). Occurrence of fecal coliform bacteria in the Cheney Reservoir watershed, south-central Kansas, 1997-99: U.S. Geological Survey Fact Sheet 170-99, p4 Moehl, J.F. and Davies, W.D., (1993). Fishery intensificationin small water bodies. A review for North America. FAO Fisheries Technical Paper No. 333, Rome. Moyo, N., and Mtetwa, S., (2002). Water quality management and pollution control. In Defining and Mainstreaming environmental sustainability in water resources managemnt in Southern Africa. A SADCTechnical Report to inform and guide water resources policy and investments. Moyce, W., Mangeya, P., Owen, R., and Love, D., (2006). Alluvial aquifers in the Mzingwane catchment: Their distribution, properties, current usage and potential exapansion (uncorrected proof). Physics and Chemistry of the Earth. 1210. Mugabe, F.T., Hodnett, M.G., and Senzanje, A., (2004). Opportunities for increasing productive water use from dam water: A case study from semi-arid Zimbabwe. Agricultural Water Management 62 (2003) 149-163. Mwaura, F., (2000). Some aspects of water characteristics in small shallow tropical man-made reservoirs in Kenya. African journal of science and technology (AJST) Science and Engineering Series Vol. 7 no.1 pages 82-96 Naranjo, E,. (undated). A GIS based non-point pollution simulation model National Consumer Water Quality Survey., (1997). Opinion Research Corporation International, Princeton, New Jersey.
Ntengwe, F.W., (2006). Pollutant loads and water quality in streams of heavy populated and industrilised towns. Physics and Chemistry of the Earth 31(2006) 832-839.
56
Oblinger, J.L., Koburger, J.A., (1975). Understanding and teaching the Most Probable Number Technique. J. Milk Food Technol. 38 (9):540 Oasis Design., (1997-2006). Faecal Coliform Bacteria Count:What they really mean about water quality. http/www.oasisdesign.net/water/quality/coliforms.htm. Parsons, R., and Tredoux, G., (1995). Monitoring Groundwater Quality in South Africa: Development of Strategy. Water SA, 21(2), p113-116. Pernthaler, J., Glöckner., F.O., Unterholzner, S., Alfreider, A., Psenner, R., A and Amann, R., (1998). Seasonal com, munity and population dynamics of pelagic bacteria and archaea in a high mountain lake. Appl. and Environ. Microbiol. 64 (11) 4299 – 4306. Pirages, D., (2005). From resource scarcity to ecological security. Exploring new limits to growth. Risse, L. M., Cabrera,M. L., Franzluebbers,A.J., . Gaskin, J.W., Gilley, J., Killorn, Radcliffe, D.E., Tollner, W.E., and Zhang, H., (undated). Land application of manure for beneficial reuse. Rusere, S., (2005). An assessment of the multiple uses of small dams, water usage and productivity in the Limpopo Basin. University of Zimbabwe.
Sawunyama, T., (2005). Estimation of small reservoir storage capacities in Limpopo river basin using Geographical Information Systems (GIS) and remotely sensed surface areas: A case of Mzingwane Catchment, University of Zimbabwe. Sawyer, C.N., McCarty, P.L., and Parkin, G.F., (1994). Chemistry for Environmental Enginering, fourth ed. McGraw-HillInc., Singapore. Scheelbeek, P., (2005). Two containers a day; the search for proper water sources in Eastern Ethiopia MSc-thesis report, Water Quality and Sanitation in the Lege Dini Watershed Area, Ethiopia A pilot study to the Multiple Use System Approach of the International Water Management Institute.
Sithole, P., (2005). A socio economic study on small reservoir use, management and institutional issues in the Avoca communal lands, Insiza District, Gwanda Limpopo Basin, Zimbabwe. AREX Head Office.
Stevenson, K., (2000). The Role of Small Dams in Improving Rural Livelihoods in Semi-Arid Areas. Care Stakeholder Workshop 29-31 August 2000, Masvingo Harare. Sugunan, V., (1997). Fisheries Management of small water bodies in seven countries in Africa and Asia. FAO Fisheries Ciculars-C933. Thornton, J.A., (1980). A Comparison of the Summer Phosphorus Loadings to Three Zimbabwean Water- Supply Reservoirs of Varying Trophic States. Water SA 6(4) 163-170.
57
Tilman, D., Kilham, S.S. and P. Kilham (1982). Phytoplankton community ecology: The role of limiting nutrients. Ann. Rev. Ecol. Syst. 13:349-372.
USA Environmental Protection Agency (EPA) (1999). 25 Years of the Safe Drinking Water Act: History and Trends (816-R-99 007). Zululand Observer, RSA, May 28, 2001 USA Environmental Protection Agency (EPA) (1992). 810/K-92 001 1992-Secondary drinking water regulations: Guidance for nuisance chemicals. USA Environmental Protection Agency (EPA) (undated). Monitoring and assessing water quality . 5.9 conductivity.
Van Loon J.C., (1982). Chemical Analysis of Inorganic Constituent of Water. CRC Press. Vhevha, I., and Manzungu E., (2007). Characterisation of stakehold participation and sustainability of rural water supply borehole facilities in Zimbawe: a case study of Guruve District. In Manzungu, E (2007)/ Towards a new creed: Governanceand livelihoods in Southern Africa Weaver Press. Harare
WHO., (1984). Guidelines for Drinking Water Quality. World Health Organization, Geneva, Switzerland.
WHO., (1996). Guidelines for Drinking Water Quality second ed.Health Criteria and Other Supporting Information, vol. 2 WHO, WHO Geneva Switzerland. WHO., (2003). Chloride in drinking water. Background document for preparation of WHO Guidelines for drinking-water quality. Geneva, World Health Organization (WHO/SDE/WSH/03.04/3). WHO., (2003). Hardness in drinking-water. Background document for preparation of WHO Guidelines for drinking-water quality. Geneva, World Health Organization (WHO/SDE/WSH/03.04/6). Wim van der HoecK. (2001). Water and Rural Livelihoods
WRC., (1998). A strategic plan for the Department of Water Affairs and Forestry to facilitate the implementation of catchment management in South Africa. Water Research Commission, Pretoria ZSG (Zimbabwe Surveyor General)., (1997). Natural Regions and Provisional Farming Areas Map. ZSG, Harare, Zimbabwe. ZSG (Zimbabwe Surveyor General),. (1998). Land Classification Map of Zimbabwe, 2nd Edition. ZSG, Harare, Zimbabwe.
58
APPENDICES
APPENDIX 1
Table 2.1: No. and capacity of dams per Province in Zimbabwe
Table 2.2: Effects of Chloride on the Health of Livestock (DWAF, 1996b)
○○○ Target Water Quality Range. No adverse effects ○○• Adverse chronic effects such as decreased feed and water intake and a decline in productivity may occur, but are unlikely. Averse effects that do not occur will most likely be temporary and normal production should continue once stocks are adapted. ○•• Adverse chronic effects such as decreased feed and water intake, weight loss and a decline in productivity may occur, but will most likely be temporary and normal production should continue once stock are adapted. ••• Averse chronic (as above), and acute effects such as osmotic disturbance, hypertension, dehydration, renal damage and salt poisoning may occur. May be tolerated for shorter exposure time depending on site-specific factors and adaptation. Stock may subsist under certain conditions, but production will in all likelihood declines.
Effects
Chloride
Range
(mg/l)
Sheep Cattle Dairy cattle,
pregnant
and
lactating
cattle
Ruminants Monogastrics Poultry
0-1500 ○○○ ○○○ ○○○ ○○○ ○○○ ○○○
1500-
2000
○○○ ○○○ ○○○ ○○○ ○○• ○○•
2000-
3000
○○○ ○○○ ○○○ ○○○ ○•• •••
3000-
4000
○○• ○○• ○○• ••• ••• •••
4000-
5000
○•• ○•• ○•• ••• ••• •••
5000-
6000
○•• ••• ••• ••• ••• •••
> 6000 ••• ••• ••• ••• ••• •••
60
APPENDIX 3
Villagers’ Water Quality Perception Survey
SMALL RESERVOIRS PROJECT (SRP) AVOCA GROWTH POINT The aim of the survey is to obtain villagers’ water quality perceptive of the reservoirs being studied,
which will be correlated to the analysed water quality results.
Interviewer
Ward
Respondent Characteristics/Demographic data
Name
Age
Sex 1.Male 2.Female
Marital Status 1.Single 2.Married 3.Divorced 4.Widowed
No of people in
household
5(b) No. under 5 years
Position in household
A: WATER USE
1. What time of the year is water abundant in the reservoir (specify in months)_____________
2. Where do you normally get your water from (Dry season(D), and the Wet season (W)
61
3. How close is the water source to your homestead in the wet season for the following uses?
Drinking______________________________________
Laundry_______________________________________
Dishes________________________________________
Livestock watering_______________________________
Irrigation_______________________________________
4. How close is the water source to your homestead in the dry season for the following uses?
Drinking______________________________________
Laundry_______________________________________
Dishes________________________________________
Livestock watering_______________________________
Irrigation_______________________________________
Drinking laundry Dishes
Livestock
watering Irrigation
D W D W D W D W D W
Borehole
Open Well
River
Small reservoir and
name
Other (specify)
62
B: SMALL RESERVOIR WATER USE PERCEPTIONS
1. During the wet season what is the water quality in small reservoirs like?
colour taste soap consumption Frothing when boilingBovaAvocaSifininiSiwaze
Name of reservoir Water Quality Perceptions
2. During the dry season what is the water quality in the following small reservoirs like?
colour taste soap consumption Frothing when boilingBovaAvocaSifininiSiwaze
Name of reservoir Water Quality Perceptions
C: WATER MANAGEMENT ASPECTS
1. Are there any rules and regulations regarding water quality in the reservoirs?
Yes No
2. If yes name them______________________________________________ _____________________________________________________ _____________________________________________________ ______________________________________________________ 3. Are there any conflicts related to the water quality of these reservoirs
Yes No
4. If yes, who resolves them explain______________________________ ____________________________________________________________________
63
5. Who is responsible for resolving the water quality conflicts?_______________________________________________________
APPENDIX 4 Analysis of Variance (ANOVA) tables. Variate: Chloride
Source of variation d.f.(m.v.) s.s. m.s. v.r. F pr. Dam 3 459.001 153.000 26.08 <.001 Month 7 73384.252 10483.465 1786.94 <.001 DamxMonth 21 12180.954 580.045 98.87 <.001 Residual 61(3) 357.869 5.867 Total 92(3) 86234.438 Standard errors of differences of means
Table Dam Month Dam Month rep. 24 12 3 d.f. 61 61 61 s.e.d. 0.699 0.989 1.978 Least significant differences of means (5% level) Table Dam Month Dam x Month
Source of variation d.f.(m.v.) s.s. m.s. v.r. F pr. Dam 3 87530.5 29176.8 233.92 <.001 Month 7 248545.8 35506.5 284.67 <.001 Dam x Month 21 51915.4 2472.2 19.82 <.001 Residual 63(1) 7857.9 124.7 Total 94(1) 364621.3 Standard errors of differences of means
Table Dam Month Dam x Month
rep. 24 12 3 d.f. 63 63 63 s.e.d. 3.22 4.56 9.12
66
Least significant differences of means (5% level) Table Dam Month Dam x Month
rep. 24 12 3 d.f. 63 63 63 l.s.d. 6.44 9.11 18.22
Variate: Hardness
Source of variation d.f.(m.v.) s.s. m.s. v.r. F pr. Dam 3 1216.2 405.4 3.54 0.020 Month 7 110606.2 15800.9 137.96 <.001 Dam x Month 21 10312.8 491.1 4.29 <.001 Residual 63(1) 7215.4 114.5 Total 94(1) 128881.6 Standard errors of differences of means
Table Dam Month Dam x Month rep. 24 12 3 d.f. 63 63 63 s.e.d. 3.09 4.37 8.74
Least significant differences of means (5% level) Table Dam Month Dam x Month
Source of variation d.f.(m.v.) s.s. m.s. v.r. F pr. Dam 3 4.1192 1.3731 5.90 0.001 Month 7 53.5753 7.6536 32.90 <.001 Dam x Month 21 10.8501 0.5167 2.22 0.008 Residual 63(1) 14.6573 0.2327 Total 94(1) 82.5937
67
Standard errors of means
Table Dam Month Dam x Month
rep. 24 12 3 d.f. 63 63 63 e.s.e. 0.0985 0.1392 0.2785 Least significant differences of means (5% level) Table Dam Month Dam x Month