Small-scale photovoltaic-powered reverse osmosis plant without batteries: Design and simulation Douglas B. Riffel a* , Paulo C.M. Carvalho b a Federal University of Sergipe, Mechanical Engineering, Av. Marechal Rondon S/N - UFS, 49100-000 Aracaju-SE, Brazil, email: [email protected]b Federal University of Cear´a, Department of Electrical Engineering, P.O. Box 6001, 60455-760, Fortaleza-CE, Brazil, email: [email protected]Received 21 September 2006; accepted 22 July 2008 Abstract A small-scale photovoltaic (PV) powered reverse osmosis (RO) plant is designed to operate at variable flow/ pressure conditions for stand-alone applications in equatorial areas to desalinate brackish water. Two operation strategies for a PV array of 165 Wp (3 modules of 55 Wp) are simulated and compared: Plant 1 uses two modules for the RO pump and one module for the well pumping; Plant 2 uses the three modules for both applications. A DC–DC buck converter with maximum power point tracking (MPPT) was developed especially for Plant 2. Results show that Plant 2 has a better performance, such as: increase of 60% in the daily permeate production and of 32% in the daily operation period, 1.57 kWh.m 3 of average specific energy consumption and a PV power-permeate daily production rate of 0.64 Wp.L 1 for a feed water with 800 mg.L 1 of total dissolved solid. Keywords: Photovoltaic system; Reverse osmosis; Brackish water desalination 1. Introduction The drinking water and electricity supply remain an unresolved issue for many populations around the world. According to UNESCO [1], until half this century water shortage will reach from 2 until 7 billion of people from more than 40 countries. In the semi-arid northeast region of Brazil, where this research takes place, over 6 million people do not have access to electricity and face exactly these circumstances. This region has an irregular rainfall distribution; most part of the rainfall (approximately 85% of the pre- cipitation) occurs within the short rainy season (January–May) and mainly in the coastal area, leading to the characterization of part of the region as the drought polygon [2]. Furthermore, approximately 75% of the groundwater has total dissolved solids (TDS) concentration higher than 500 mg.L 1 , which means that this water is inadequate for human consumption [3]. Desalination of brackish and seawater is one of the alternatives for ensuring a supply of drinking water in the dry period. Therefore, the process *Corresponding author. 0011-9164/09/$– See front matter Ó 2009 Published by Elsevier B.V. doi:10.1016/j.desal.2008.07.019 Desalination 247 (2009) 378–389
Transcript
Small-scale photovoltaic-powered reverse osmosis plantwithout batteries: Design and simulation
Douglas B. Riffela*, Paulo C.M. Carvalhob
aFederal University of Sergipe, Mechanical Engineering, Av. Marechal Rondon S/N - UFS,49100-000 Aracaju-SE, Brazil, email: [email protected]
bFederal University of Ceara, Department of Electrical Engineering, P.O. Box 6001, 60455-760,Fortaleza-CE, Brazil, email: [email protected]
Received 21 September 2006; accepted 22 July 2008
Abstract
A small-scale photovoltaic (PV) powered reverse osmosis (RO) plant is designed to operate at variable flow/pressure conditions for stand-alone applications in equatorial areas to desalinate brackish water. Two operationstrategies for a PV array of 165 Wp (3 modules of 55 Wp) are simulated and compared: Plant 1 uses two modulesfor the RO pump and one module for the well pumping; Plant 2 uses the three modules for both applications. ADC–DC buck converter with maximum power point tracking (MPPT) was developed especially for Plant 2.Results show that Plant 2 has a better performance, such as: increase of 60% in the daily permeate productionand of 32% in the daily operation period, 1.57 kWh.m�3 of average specific energy consumption and a PVpower-permeate daily production rate of 0.64 Wp.L�1 for a feed water with 800 mg.L�1 of total dissolved solid.
Keywords: Photovoltaic system; Reverse osmosis; Brackish water desalination
1. Introduction
The drinking water and electricity supplyremain an unresolved issue for many populationsaround the world. According to UNESCO [1],until half this century water shortage will reachfrom 2 until 7 billion of people from more than40 countries. In the semi-arid northeast regionof Brazil, where this research takes place, over6 million people do not have access to electricityand face exactly these circumstances. This region
has an irregular rainfall distribution; most partof the rainfall (approximately 85% of the pre-cipitation) occurs within the short rainy season(January–May) and mainly in the coastal area,leading to the characterization of part of theregion as the drought polygon [2]. Furthermore,approximately 75% of the groundwater has totaldissolved solids (TDS) concentration higherthan 500 mg.L�1, which means that this wateris inadequate for human consumption [3].
Desalination of brackish and seawater is one ofthe alternatives for ensuring a supply of drinkingwater in the dry period. Therefore, the process*Corresponding author.
0011-9164/09/$– See front matter � 2009 Published by Elsevier B.V.doi:10.1016/j.desal.2008.07.019
Desalination 247 (2009) 378–389
of reverse osmosis (RO) has become a reasonabletechnical option in recent years. The reasons forthis trend are the low specific energy consumptionof this process and the considerable progressmade in membrane technology. Moreover, photo-voltaic (PV) technology is a feasible option forregions without electric power grid, as the ruralcommunities in the Brazil’s Northeast, wherethe average temperature is around 278C and thesolar potential of about 2000 kWh.m�2 per yearis available. However, the worldwide number ofinstallations that combine these two technologies(PV + RO) remain very small. Pilot installationsshow that a water treatment through this combina-tion is technically feasible and, nowadays, forstand-alone and small-scale applications a photo-voltaic powered reverse osmosis (PV-RO) plantcan be also economically viable. An additionalmotivation is the natural occurrence of solar/hydro seasonal complementarity in this regionvalid for drinking water stored in big reservoirsand electricity produced by the hydropowerplants, the main energy source in Brazil.
A pioneer project in Brazil with a PV-ROplant with batteries and some experiences gath-ered worldwide were published in a previouspaper [4]. This project had a specific energyconsumption (energy required to produce onecubic meter of drinking water) of 3.03kWh.m�3, a recovery ratio of 27% (relationbetween permeate flow and feed water flow)and a drinking water cost of US$ 12.76 perm3. The batteries were used as power condition-ing and to keep the PV generator voltage at aconstant level. Furthermore, the batteries storethe energy, allowing the RO pump to be startedwith a small or even no solar irradiance. Onedrawback is that the battery efficiency may belower than 80% due to self-discharge whenthe ambient temperature is high. This may off-set the benefit gained at low irradiance. Theyalso require regular maintenance and have ashorter operational life than the rest of thepumping system.
Some experiences gathered worldwide withPV-RO plants without batteries were described inthe literature [5–8]. The nonexistence of batteriesdecreases the maintenance needs, a fundamentalaspect in projects for remote areas. However, dueto the intermittent PV power supply, variable pres-sure and flow conditions are expected, influencingthe RO membrane performance.
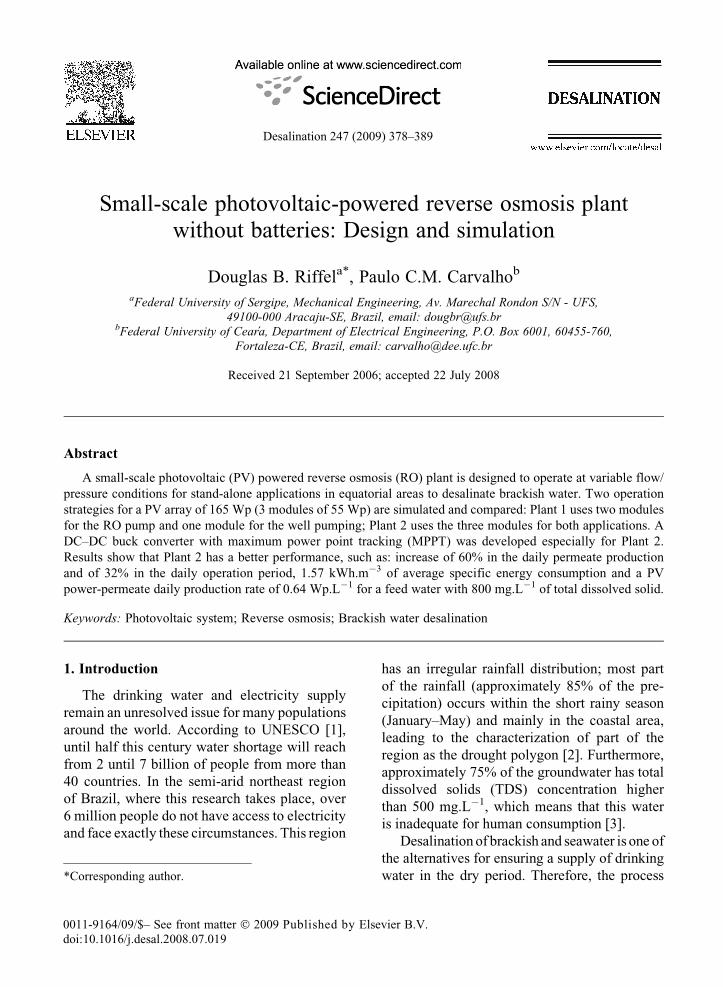
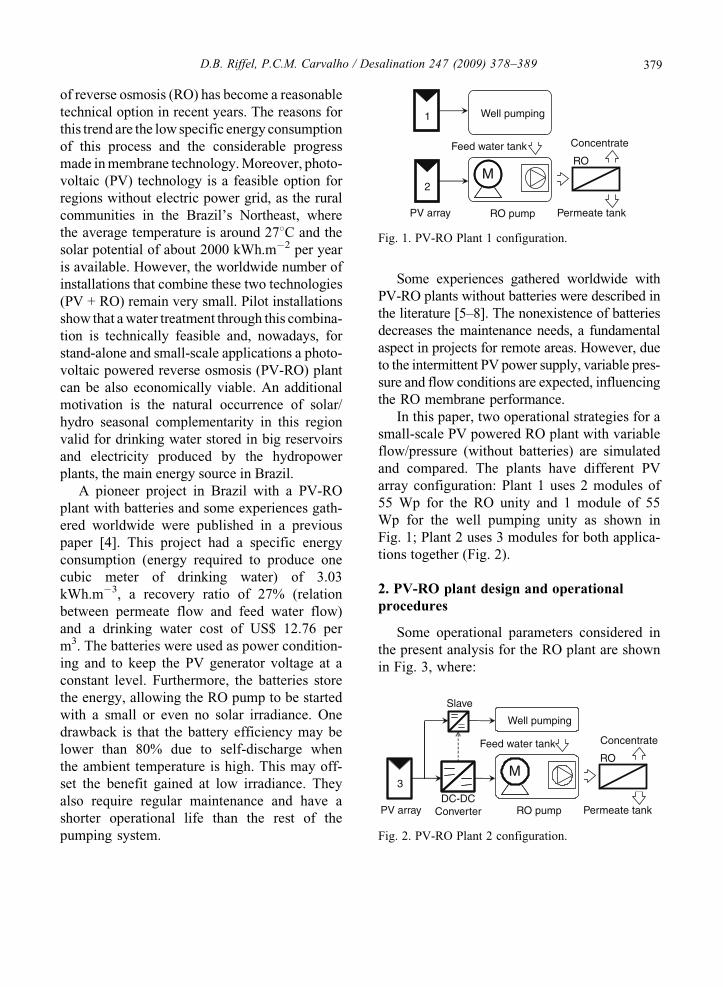
In this paper, two operational strategies for asmall-scale PV powered RO plant with variableflow/pressure (without batteries) are simulatedand compared. The plants have different PVarray configuration: Plant 1 uses 2 modules of55 Wp for the RO unity and 1 module of 55Wp for the well pumping unity as shown inFig. 1; Plant 2 uses 3 modules for both applica-tions together (Fig. 2).
2. PV-RO plant design and operationalprocedures
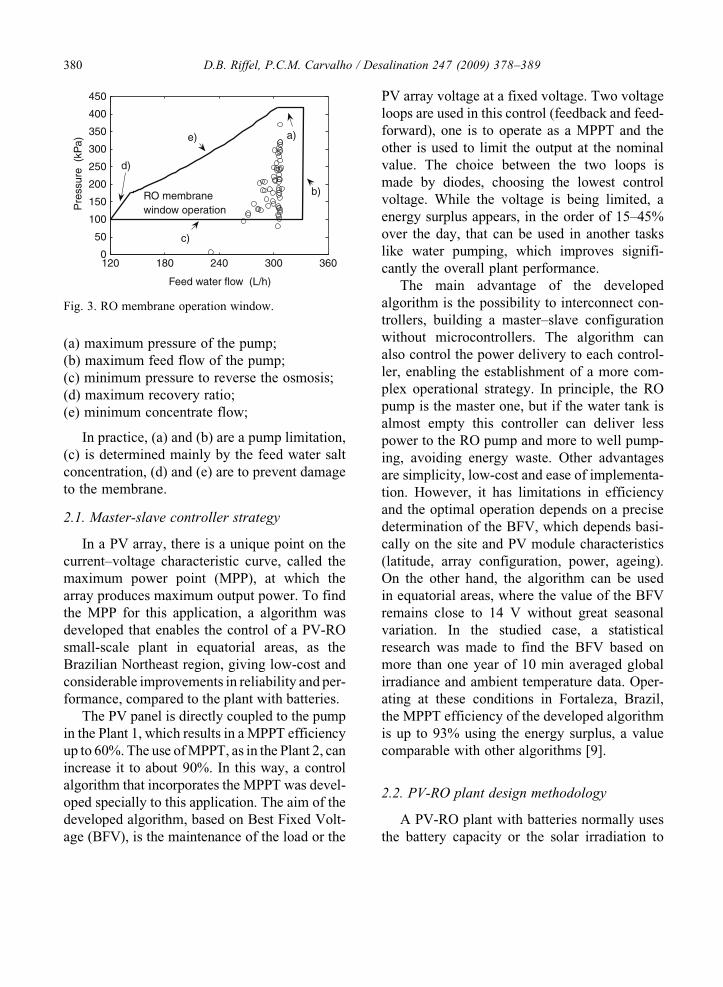
Some operational parameters considered inthe present analysis for the RO plant are shownin Fig. 3, where:
(a) maximum pressure of the pump;(b) maximum feed flow of the pump;(c) minimum pressure to reverse the osmosis;(d) maximum recovery ratio;(e) minimum concentrate flow;
In practice, (a) and (b) are a pump limitation,(c) is determined mainly by the feed water saltconcentration, (d) and (e) are to prevent damageto the membrane.
2.1. Master-slave controller strategy
In a PV array, there is a unique point on thecurrent–voltage characteristic curve, called themaximum power point (MPP), at which thearray produces maximum output power. To findthe MPP for this application, a algorithm wasdeveloped that enables the control of a PV-ROsmall-scale plant in equatorial areas, as theBrazilian Northeast region, giving low-cost andconsiderable improvements in reliability and per-formance, compared to the plant with batteries.
The PV panel is directly coupled to the pumpin the Plant 1, which results in a MPPT efficiencyup to 60%. The use of MPPT, as in the Plant 2, canincrease it to about 90%. In this way, a controlalgorithm that incorporates the MPPT was devel-oped specially to this application. The aim of thedeveloped algorithm, based on Best Fixed Volt-age (BFV), is the maintenance of the load or the
PV array voltage at a fixed voltage. Two voltageloops are used in this control (feedback and feed-forward), one is to operate as a MPPT and theother is used to limit the output at the nominalvalue. The choice between the two loops ismade by diodes, choosing the lowest controlvoltage. While the voltage is being limited, aenergy surplus appears, in the order of 15–45%over the day, that can be used in another taskslike water pumping, which improves signifi-cantly the overall plant performance.
The main advantage of the developedalgorithm is the possibility to interconnect con-trollers, building a master–slave configurationwithout microcontrollers. The algorithm canalso control the power delivery to each control-ler, enabling the establishment of a more com-plex operational strategy. In principle, the ROpump is the master one, but if the water tank isalmost empty this controller can deliver lesspower to the RO pump and more to well pump-ing, avoiding energy waste. Other advantagesare simplicity, low-cost and ease of implementa-tion. However, it has limitations in efficiencyand the optimal operation depends on a precisedetermination of the BFV, which depends basi-cally on the site and PV module characteristics(latitude, array configuration, power, ageing).On the other hand, the algorithm can be usedin equatorial areas, where the value of the BFVremains close to 14 V without great seasonalvariation. In the studied case, a statisticalresearch was made to find the BFV based onmore than one year of 10 min averaged globalirradiance and ambient temperature data. Oper-ating at these conditions in Fortaleza, Brazil,the MPPT efficiency of the developed algorithmis up to 93% using the energy surplus, a valuecomparable with other algorithms [9].
2.2. PV-RO plant design methodology
A PV-RO plant with batteries normally usesthe battery capacity or the solar irradiation to
define the operation strategies [10, 11]. Oncebatteries are removed, the solar irradiance influ-ences directly the load torque and, consequently,the permeate production. One current parameterto determine the pumped water volume along acertain period of time is the critical irradiancelevel, which is the minimum irradiance neces-sary to start the operation of the pumping sys-tem. In this way, to design the plant in suchintermittent meteorological conditions, somedesign criteria were established: monthly solarirradiance histogram, maximum continuousperiod over a critical irradiance level and themonthly accumulated time of continuous peri-ods over a critical irradiance level.
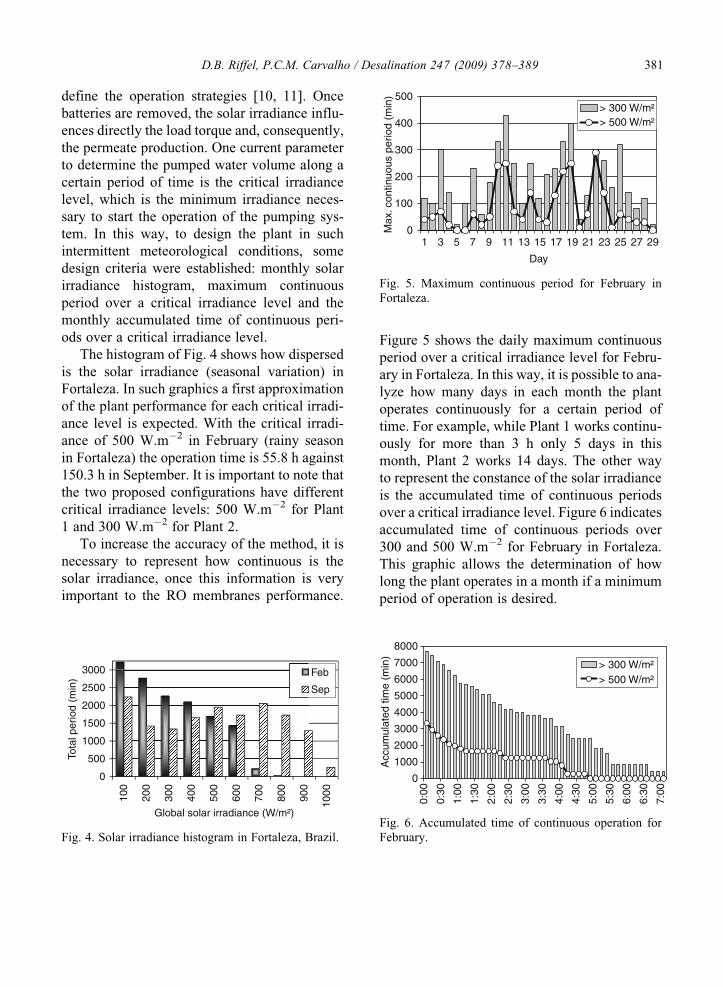
The histogram of Fig. 4 shows how dispersedis the solar irradiance (seasonal variation) inFortaleza. In such graphics a first approximationof the plant performance for each critical irradi-ance level is expected. With the critical irradi-ance of 500 W.m�2 in February (rainy seasonin Fortaleza) the operation time is 55.8 h against150.3 h in September. It is important to note thatthe two proposed configurations have differentcritical irradiance levels: 500 W.m�2 for Plant1 and 300 W.m�2 for Plant 2.
To increase the accuracy of the method, it isnecessary to represent how continuous is thesolar irradiance, once this information is veryimportant to the RO membranes performance.
Figure 5 shows the daily maximum continuousperiod over a critical irradiance level for Febru-ary in Fortaleza. In this way, it is possible to ana-lyze how many days in each month the plantoperates continuously for a certain period oftime. For example, while Plant 1 works continu-ously for more than 3 h only 5 days in thismonth, Plant 2 works 14 days. The other wayto represent the constance of the solar irradianceis the accumulated time of continuous periodsover a critical irradiance level. Figure 6 indicatesaccumulated time of continuous periods over300 and 500 W.m�2 for February in Fortaleza.This graphic allows the determination of howlong the plant operates in a month if a minimumperiod of operation is desired.
0
500
1000
1500
2000
2500
3000
100
200
300
400
500
600
700
800
900
1000
Global solar irradiance (W/m²)
Tota
l per
iod
(min
)
Feb
Sep
Fig. 4. Solar irradiance histogram in Fortaleza, Brazil.
0
100
200
300
400
500
111 3 5 7 9 13 15 17 19 21 23 25 27 29
Day
Max
. con
tinuo
us p
erio
d (m
in)
> 300 W/m²> 500 W/m²
Fig. 5. Maximum continuous period for February inFortaleza.
0:00
0:30
1:00
1:30
2:00
2:30
3:00
3:30
4:00
4:30
5:00
5:30
6:00
6:30
7:00
0
1000
2000
3000
4000
5000
6000
7000
8000
Acc
umul
ated
tim
e (m
in)
> 300 W/m²> 500 W/m²
Fig. 6. Accumulated time of continuous operation forFebruary.
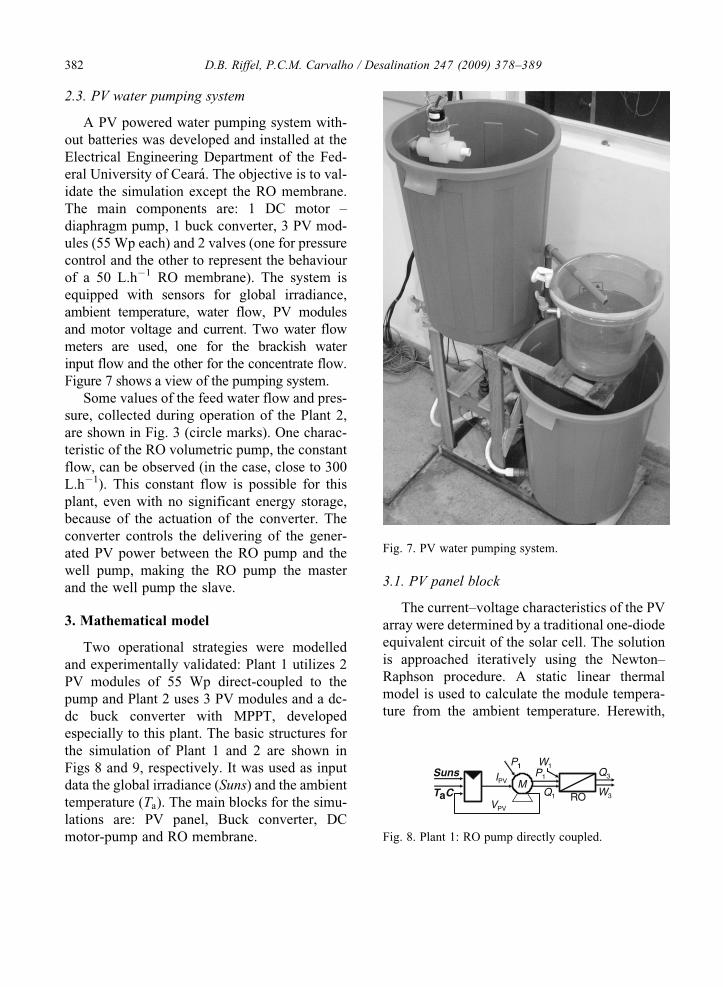
A PV powered water pumping system with-out batteries was developed and installed at theElectrical Engineering Department of the Fed-eral University of Ceara. The objective is to val-idate the simulation except the RO membrane.The main components are: 1 DC motor –diaphragm pump, 1 buck converter, 3 PV mod-ules (55 Wp each) and 2 valves (one for pressurecontrol and the other to represent the behaviourof a 50 L.h�1 RO membrane). The system isequipped with sensors for global irradiance,ambient temperature, water flow, PV modulesand motor voltage and current. Two water flowmeters are used, one for the brackish waterinput flow and the other for the concentrate flow.Figure 7 shows a view of the pumping system.
Some values of the feed water flow and pres-sure, collected during operation of the Plant 2,are shown in Fig. 3 (circle marks). One charac-teristic of the RO volumetric pump, the constantflow, can be observed (in the case, close to 300L.h�1). This constant flow is possible for thisplant, even with no significant energy storage,because of the actuation of the converter. Theconverter controls the delivering of the gener-ated PV power between the RO pump and thewell pump, making the RO pump the masterand the well pump the slave.
3. Mathematical model
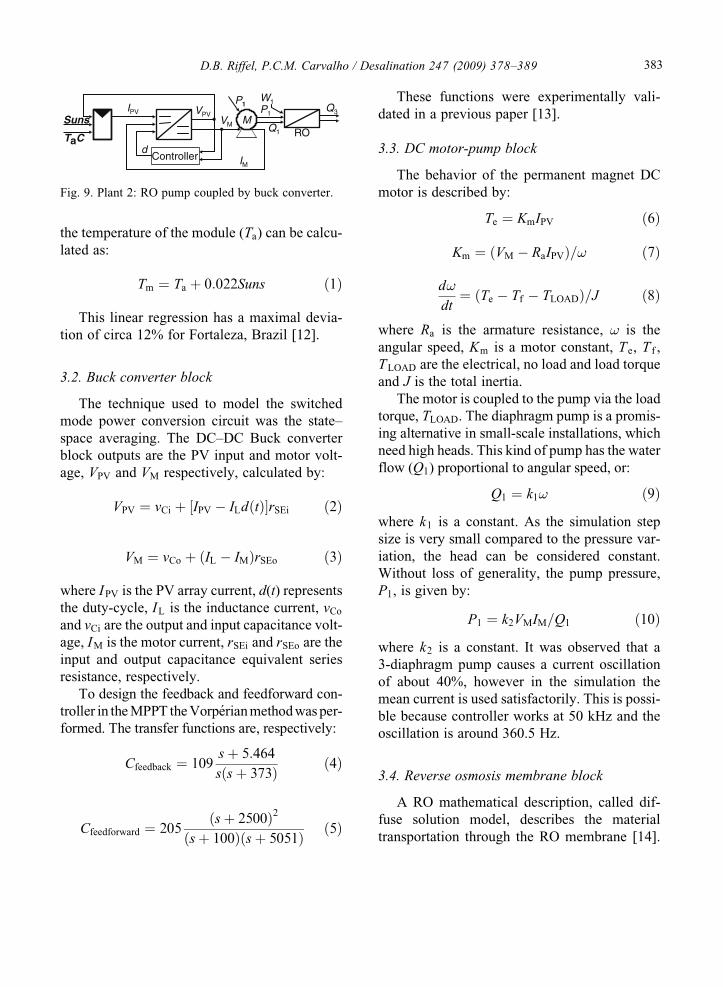
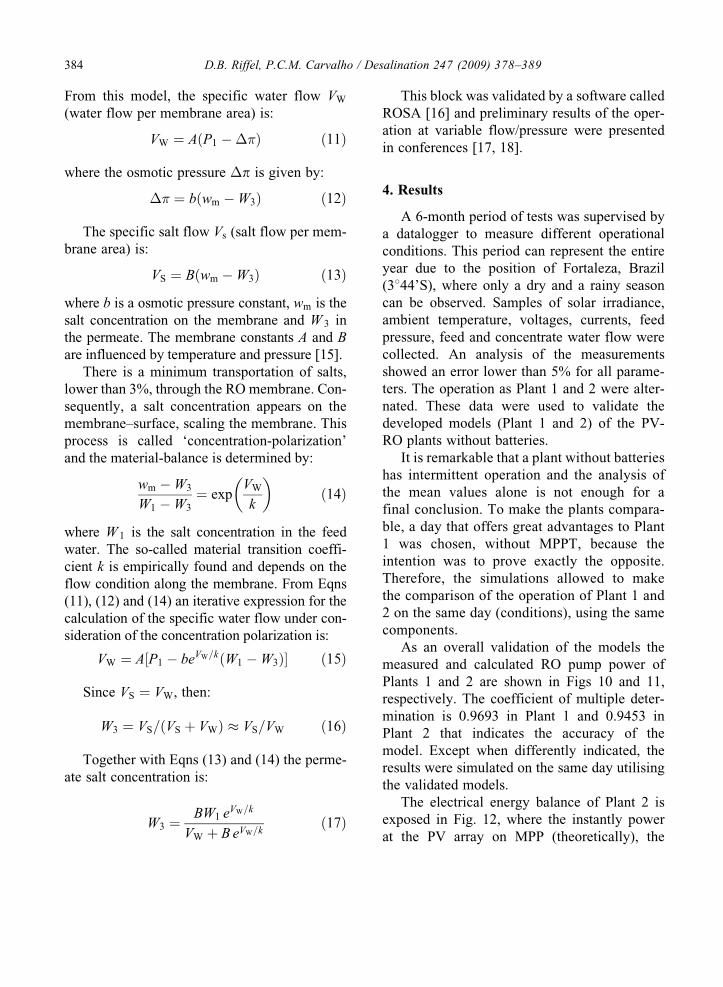
Two operational strategies were modelledand experimentally validated: Plant 1 utilizes 2PV modules of 55 Wp direct-coupled to thepump and Plant 2 uses 3 PV modules and a dc-dc buck converter with MPPT, developedespecially to this plant. The basic structures forthe simulation of Plant 1 and 2 are shown inFigs 8 and 9, respectively. It was used as inputdata the global irradiance (Suns) and the ambienttemperature (Ta). The main blocks for the simu-lations are: PV panel, Buck converter, DCmotor-pump and RO membrane.
3.1. PV panel block
The current–voltage characteristics of the PVarray were determined by a traditional one-diodeequivalent circuit of the solar cell. The solutionis approached iteratively using the Newton–Raphson procedure. A static linear thermalmodel is used to calculate the module tempera-ture from the ambient temperature. Herewith,
the temperature of the module (Ta) can be calcu-lated as:
Tm ¼ Ta þ 0:022Suns ð1Þ
This linear regression has a maximal devia-tion of circa 12% for Fortaleza, Brazil [12].
3.2. Buck converter block
The technique used to model the switchedmode power conversion circuit was the state–space averaging. The DC–DC Buck converterblock outputs are the PV input and motor volt-age, VPV and VM respectively, calculated by:
VPV ¼ vCi þ IPV � ILdðtÞ½ �rSEi ð2Þ
VM ¼ vCo þ IL � IMð ÞrSEo ð3Þ
where IPV is the PV array current, d(t) representsthe duty-cycle, IL is the inductance current, vCo
and vCi are the output and input capacitance volt-age, IM is the motor current, rSEi and rSEo are theinput and output capacitance equivalent seriesresistance, respectively.
To design the feedback and feedforward con-troller in the MPPT the Vorperian method was per-formed. The transfer functions are, respectively:
Cfeedback ¼ 109s þ 5:464
sðs þ 373Þ ð4Þ
Cfeedforward ¼ 205ðs þ 2500Þ2
ðs þ 100Þðs þ 5051Þ ð5Þ
These functions were experimentally vali-dated in a previous paper [13].
3.3. DC motor-pump block
The behavior of the permanent magnet DCmotor is described by:
Te ¼ KmIPV ð6Þ
Km ¼ VM � RaIPVð Þ=! ð7Þ
d!
dt¼ ðTe � Tf � TLOADÞ=J ð8Þ
where Ra is the armature resistance, ! is theangular speed, Km is a motor constant, T e, T f ,TLOAD are the electrical, no load and load torqueand J is the total inertia.
The motor is coupled to the pump via the loadtorque, TLOAD. The diaphragm pump is a promis-ing alternative in small-scale installations, whichneed high heads. This kind of pump has the waterflow (Q1) proportional to angular speed, or:
Q1 ¼ k1! ð9Þwhere k1 is a constant. As the simulation stepsize is very small compared to the pressure var-iation, the head can be considered constant.Without loss of generality, the pump pressure,P1, is given by:
P1 ¼ k2VMIM=Q1 ð10Þwhere k2 is a constant. It was observed that a3-diaphragm pump causes a current oscillationof about 40%, however in the simulation themean current is used satisfactorily. This is possi-ble because controller works at 50 kHz and theoscillation is around 360.5 Hz.
3.4. Reverse osmosis membrane block
A RO mathematical description, called dif-fuse solution model, describes the materialtransportation through the RO membrane [14].
d
SunsVPV
M
Controller IM
VM
IPV
TaCQ1
P1Q3
P1
RO
W1
Fig. 9. Plant 2: RO pump coupled by buck converter.
The specific salt flow Vs (salt flow per mem-brane area) is:
VS ¼ Bðwm � W3Þ ð13Þwhere b is a osmotic pressure constant, wm is thesalt concentration on the membrane and W 3 inthe permeate. The membrane constants A and Bare influenced by temperature and pressure [15].
There is a minimum transportation of salts,lower than 3%, through the RO membrane. Con-sequently, a salt concentration appears on themembrane–surface, scaling the membrane. Thisprocess is called ‘concentration-polarization’and the material-balance is determined by:
wm � W3
W1 � W3¼ exp
VW
k
� �ð14Þ
where W 1 is the salt concentration in the feedwater. The so-called material transition coeffi-cient k is empirically found and depends on theflow condition along the membrane. From Eqns(11), (12) and (14) an iterative expression for thecalculation of the specific water flow under con-sideration of the concentration polarization is:
VW ¼ A½P1 � beVW=kðW1 � W3Þ� ð15Þ
Since VS ¼ VW, then:
W3 ¼ VS=ðVS þ VWÞ � VS=VW ð16Þ
Together with Eqns (13) and (14) the perme-ate salt concentration is:
W3 ¼ BW1 eVW=k
VW þ B eVW=kð17Þ
This block was validated by a software calledROSA [16] and preliminary results of the oper-ation at variable flow/pressure were presentedin conferences [17, 18].
4. Results
A 6-month period of tests was supervised bya datalogger to measure different operationalconditions. This period can represent the entireyear due to the position of Fortaleza, Brazil(3844’S), where only a dry and a rainy seasoncan be observed. Samples of solar irradiance,ambient temperature, voltages, currents, feedpressure, feed and concentrate water flow werecollected. An analysis of the measurementsshowed an error lower than 5% for all parame-ters. The operation as Plant 1 and 2 were alter-nated. These data were used to validate thedeveloped models (Plant 1 and 2) of the PV-RO plants without batteries.
It is remarkable that a plant without batterieshas intermittent operation and the analysis ofthe mean values alone is not enough for afinal conclusion. To make the plants compara-ble, a day that offers great advantages to Plant1 was chosen, without MPPT, because theintention was to prove exactly the opposite.Therefore, the simulations allowed to makethe comparison of the operation of Plant 1 and2 on the same day (conditions), using the samecomponents.
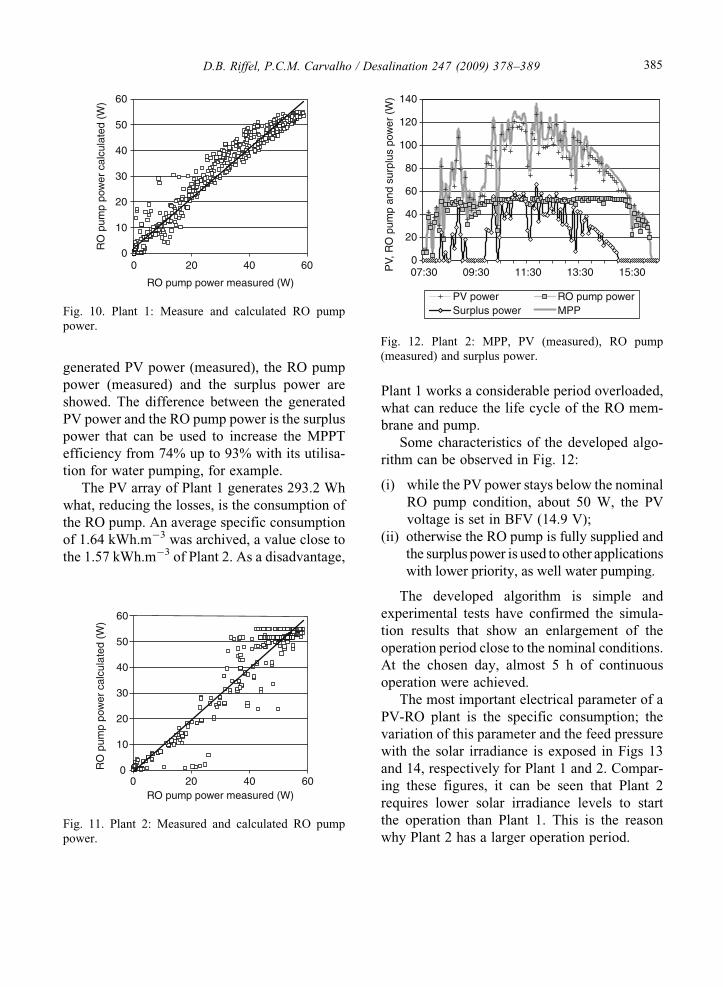
As an overall validation of the models themeasured and calculated RO pump power ofPlants 1 and 2 are shown in Figs 10 and 11,respectively. The coefficient of multiple deter-mination is 0.9693 in Plant 1 and 0.9453 inPlant 2 that indicates the accuracy of themodel. Except when differently indicated, theresults were simulated on the same day utilisingthe validated models.
The electrical energy balance of Plant 2 isexposed in Fig. 12, where the instantly powerat the PV array on MPP (theoretically), the
generated PV power (measured), the RO pumppower (measured) and the surplus power areshowed. The difference between the generatedPV power and the RO pump power is the surpluspower that can be used to increase the MPPTefficiency from 74% up to 93% with its utilisa-tion for water pumping, for example.
The PV array of Plant 1 generates 293.2 Whwhat, reducing the losses, is the consumption ofthe RO pump. An average specific consumptionof 1.64 kWh.m�3 was archived, a value close tothe 1.57 kWh.m�3 of Plant 2. As a disadvantage,
Plant 1 works a considerable period overloaded,what can reduce the life cycle of the RO mem-brane and pump.
Some characteristics of the developed algo-rithm can be observed in Fig. 12:
(i) while the PV power stays below the nominalRO pump condition, about 50 W, the PVvoltage is set in BFV (14.9 V);
(ii) otherwise the RO pump is fully supplied andthe surplus power is used to other applicationswith lower priority, as well water pumping.
The developed algorithm is simple andexperimental tests have confirmed the simula-tion results that show an enlargement of theoperation period close to the nominal conditions.At the chosen day, almost 5 h of continuousoperation were achieved.
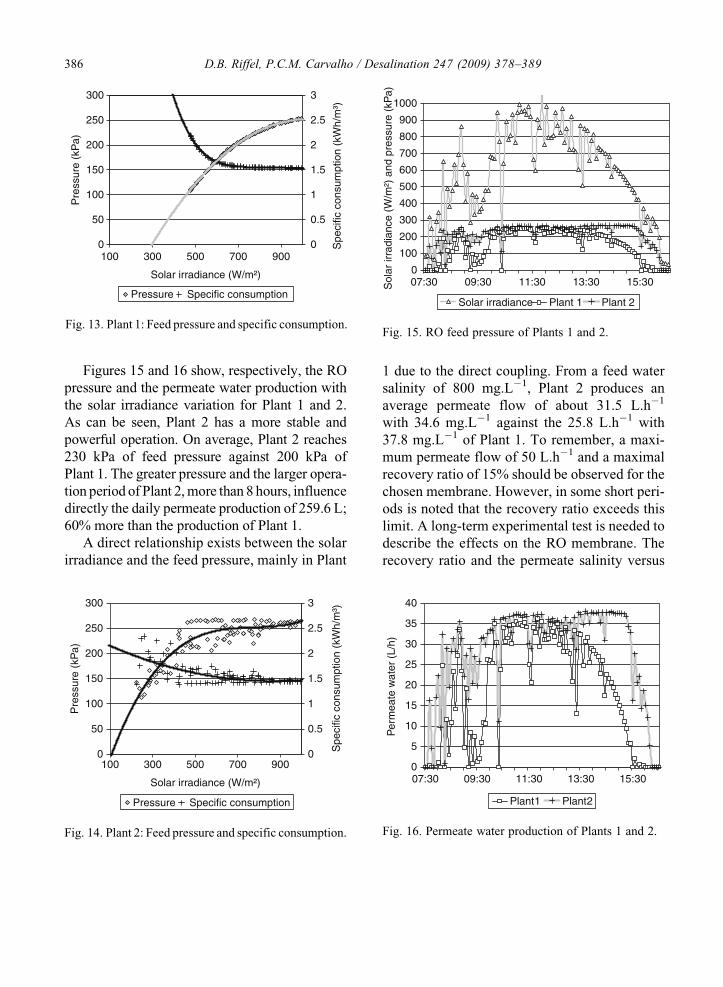
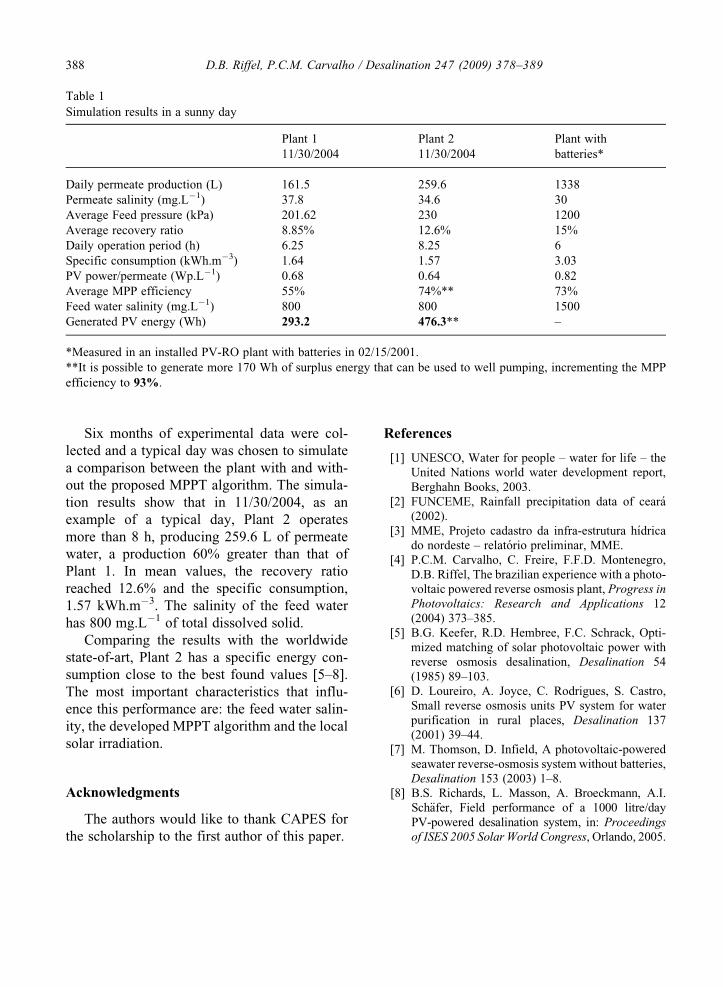
The most important electrical parameter of aPV-RO plant is the specific consumption; thevariation of this parameter and the feed pressurewith the solar irradiance is exposed in Figs 13and 14, respectively for Plant 1 and 2. Compar-ing these figures, it can be seen that Plant 2requires lower solar irradiance levels to startthe operation than Plant 1. This is the reasonwhy Plant 2 has a larger operation period.
00 20 40 60
10
20
30
40
50
60
RO pump power measured (W)
RO
pum
p po
wer
cal
cula
ted
(W)
Fig. 10. Plant 1: Measure and calculated RO pumppower.
0
10
20
30
40
50
60
0 20 40 60RO pump power measured (W)
RO
pum
p po
wer
cal
cula
ted
(W)
Fig. 11. Plant 2: Measured and calculated RO pumppower.
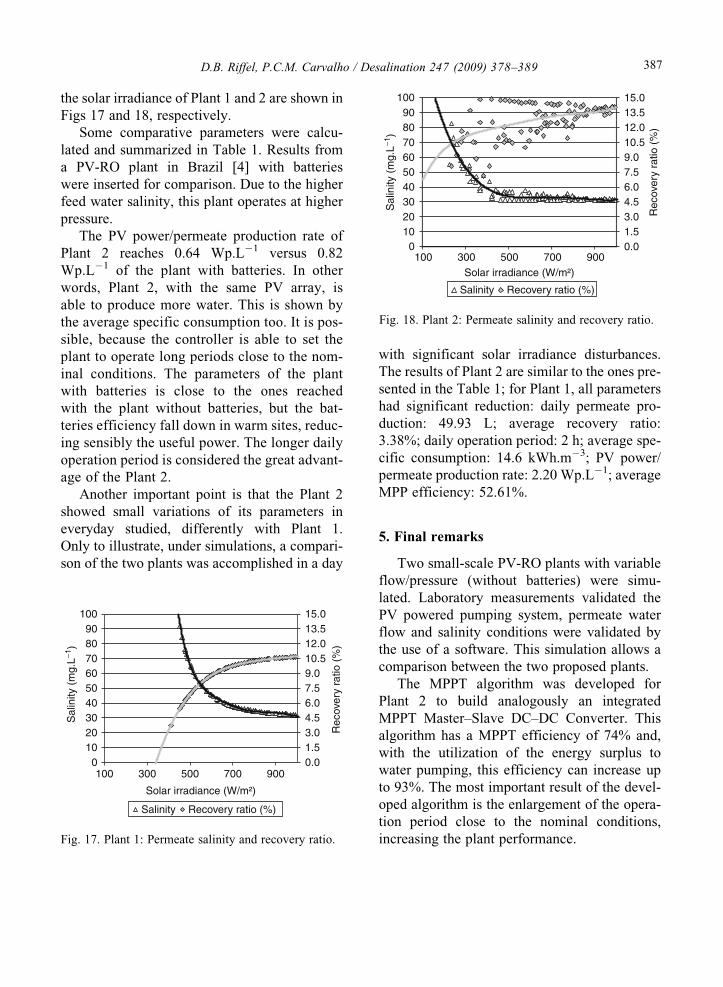
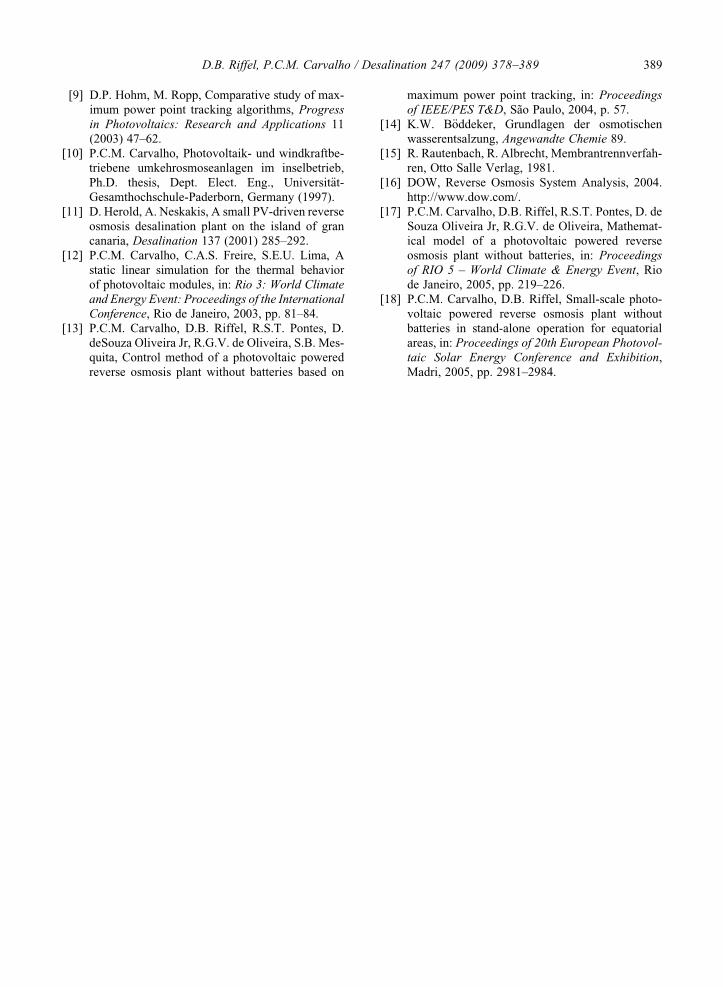
Figures 15 and 16 show, respectively, the ROpressure and the permeate water production withthe solar irradiance variation for Plant 1 and 2.As can be seen, Plant 2 has a more stable andpowerful operation. On average, Plant 2 reaches230 kPa of feed pressure against 200 kPa ofPlant 1. The greater pressure and the larger opera-tion period of Plant 2, more than 8 hours, influencedirectly the daily permeate production of 259.6 L;60% more than the production of Plant 1.
A direct relationship exists between the solarirradiance and the feed pressure, mainly in Plant
1 due to the direct coupling. From a feed watersalinity of 800 mg.L�1, Plant 2 produces anaverage permeate flow of about 31.5 L.h�1
with 34.6 mg.L�1 against the 25.8 L.h�1 with37.8 mg.L�1 of Plant 1. To remember, a maxi-mum permeate flow of 50 L.h�1 and a maximalrecovery ratio of 15% should be observed for thechosen membrane. However, in some short peri-ods is noted that the recovery ratio exceeds thislimit. A long-term experimental test is needed todescribe the effects on the RO membrane. Therecovery ratio and the permeate salinity versus
0
50
100
150
200
250
300
100 300 500 700 900
Solar irradiance (W/m²)
Pre
ssur
e (k
Pa)
0
0.5
1
1.5
2
2.5
3
Spe
cific
con
sum
ptio
n (k
Wh/
m³)
Pressure Specific consumption
Fig. 13. Plant 1: Feed pressure and specific consumption.
0
50
100
150
200
250
300
Pre
ssur
e (k
Pa)
0
0.5
1
1.5
2
2.5
3
Spe
cific
con
sum
ptio
n (k
Wh/
m³)
100 300 500 700 900
Solar irradiance (W/m²)
Pressure Specific consumption
Fig. 14. Plant 2: Feed pressure and specific consumption.
0
100
200
300
400
500
600
700
800
900
1000
07:30 09:30 11:30 13:30 15:30
Solar irradiance Plant 1 Plant 2
Sol
ar ir
radi
ance
(W
/m²)
and
pre
ssur
e (k
Pa)
Fig. 15. RO feed pressure of Plants 1 and 2.
0
5
10
15
20
25
30
35
40
07:30 09:30 11:30 13:30 15:30
Plant 1 Plant 2
Per
mea
te w
ater
(L/
h)
Fig. 16. Permeate water production of Plants 1 and 2.
the solar irradiance of Plant 1 and 2 are shown inFigs 17 and 18, respectively.
Some comparative parameters were calcu-lated and summarized in Table 1. Results froma PV-RO plant in Brazil [4] with batterieswere inserted for comparison. Due to the higherfeed water salinity, this plant operates at higherpressure.
The PV power/permeate production rate ofPlant 2 reaches 0.64 Wp.L�1 versus 0.82Wp.L�1 of the plant with batteries. In otherwords, Plant 2, with the same PV array, isable to produce more water. This is shown bythe average specific consumption too. It is pos-sible, because the controller is able to set theplant to operate long periods close to the nom-inal conditions. The parameters of the plantwith batteries is close to the ones reachedwith the plant without batteries, but the bat-teries efficiency fall down in warm sites, reduc-ing sensibly the useful power. The longer dailyoperation period is considered the great advant-age of the Plant 2.
Another important point is that the Plant 2showed small variations of its parameters ineveryday studied, differently with Plant 1.Only to illustrate, under simulations, a compari-son of the two plants was accomplished in a day
with significant solar irradiance disturbances.The results of Plant 2 are similar to the ones pre-sented in the Table 1; for Plant 1, all parametershad significant reduction: daily permeate pro-duction: 49.93 L; average recovery ratio:3.38%; daily operation period: 2 h; average spe-cific consumption: 14.6 kWh.m�3; PV power/permeate production rate: 2.20 Wp.L�1; averageMPP efficiency: 52.61%.
5. Final remarks
Two small-scale PV-RO plants with variableflow/pressure (without batteries) were simu-lated. Laboratory measurements validated thePV powered pumping system, permeate waterflow and salinity conditions were validated bythe use of a software. This simulation allows acomparison between the two proposed plants.
The MPPT algorithm was developed forPlant 2 to build analogously an integratedMPPT Master–Slave DC–DC Converter. Thisalgorithm has a MPPT efficiency of 74% and,with the utilization of the energy surplus towater pumping, this efficiency can increase upto 93%. The most important result of the devel-oped algorithm is the enlargement of the opera-tion period close to the nominal conditions,increasing the plant performance.
0102030405060708090
100
100 300 500 700 900
Solar irradiance (W/m²)
Sal
inity
(m
g.L−1
)
0.01.53.04.56.07.59.010.512.013.515.0
Rec
over
y ra
tio (
%)
Salinity Recovery ratio (%)
Fig. 18. Plant 2: Permeate salinity and recovery ratio.
0102030405060708090
100
100 300 500 700 900
Solar irradiance (W/m²)
Sal
inity
(m
g.L−1
)
0.01.53.04.56.07.59.010.512.013.515.0
Rec
over
y ra
tio (
%)
Salinity Recovery ratio (%)
Fig. 17. Plant 1: Permeate salinity and recovery ratio.
Six months of experimental data were col-lected and a typical day was chosen to simulatea comparison between the plant with and with-out the proposed MPPT algorithm. The simula-tion results show that in 11/30/2004, as anexample of a typical day, Plant 2 operatesmore than 8 h, producing 259.6 L of permeatewater, a production 60% greater than that ofPlant 1. In mean values, the recovery ratioreached 12.6% and the specific consumption,1.57 kWh.m�3. The salinity of the feed waterhas 800 mg.L�1 of total dissolved solid.
Comparing the results with the worldwidestate-of-art, Plant 2 has a specific energy con-sumption close to the best found values [5–8].The most important characteristics that influ-ence this performance are: the feed water salin-ity, the developed MPPT algorithm and the localsolar irradiation.
Acknowledgments
The authors would like to thank CAPES forthe scholarship to the first author of this paper.
References
[1] UNESCO, Water for people – water for life – theUnited Nations world water development report,Berghahn Books, 2003.
[2] FUNCEME, Rainfall precipitation data of ceara(2002).
[3] MME, Projeto cadastro da infra-estrutura hıdricado nordeste – relatorio preliminar, MME.
[4] P.C.M. Carvalho, C. Freire, F.F.D. Montenegro,D.B. Riffel, The brazilian experience with a photo-voltaic powered reverse osmosis plant, Progress inPhotovoltaics: Research and Applications 12(2004) 373–385.
[5] B.G. Keefer, R.D. Hembree, F.C. Schrack, Opti-mized matching of solar photovoltaic power withreverse osmosis desalination, Desalination 54(1985) 89–103.
[6] D. Loureiro, A. Joyce, C. Rodrigues, S. Castro,Small reverse osmosis units PV system for waterpurification in rural places, Desalination 137(2001) 39–44.
[7] M. Thomson, D. Infield, A photovoltaic-poweredseawater reverse-osmosis system without batteries,Desalination 153 (2003) 1–8.
[8] B.S. Richards, L. Masson, A. Broeckmann, A.I.Sch€afer, Field performance of a 1000 litre/dayPV-powered desalination system, in: Proceedingsof ISES 2005 Solar World Congress, Orlando, 2005.
*Measured in an installed PV-RO plant with batteries in 02/15/2001.**It is possible to generate more 170 Wh of surplus energy that can be used to well pumping, incrementing the MPPefficiency to 93%.
[9] D.P. Hohm, M. Ropp, Comparative study of max-imum power point tracking algorithms, Progressin Photovoltaics: Research and Applications 11(2003) 47–62.
[10] P.C.M. Carvalho, Photovoltaik- und windkraftbe-triebene umkehrosmoseanlagen im inselbetrieb,Ph.D. thesis, Dept. Elect. Eng., Universit€at-Gesamthochschule-Paderborn, Germany (1997).
[11] D. Herold, A. Neskakis, A small PV-driven reverseosmosis desalination plant on the island of grancanaria, Desalination 137 (2001) 285–292.
[12] P.C.M. Carvalho, C.A.S. Freire, S.E.U. Lima, Astatic linear simulation for the thermal behaviorof photovoltaic modules, in: Rio 3: World Climateand Energy Event: Proceedings of the InternationalConference, Rio de Janeiro, 2003, pp. 81–84.
[13] P.C.M. Carvalho, D.B. Riffel, R.S.T. Pontes, D.deSouza Oliveira Jr, R.G.V. de Oliveira, S.B. Mes-quita, Control method of a photovoltaic poweredreverse osmosis plant without batteries based on
maximum power point tracking, in: Proceedingsof IEEE/PES T&D, Sao Paulo, 2004, p. 57.
[14] K.W. B€oddeker, Grundlagen der osmotischenwasserentsalzung, Angewandte Chemie 89.
[15] R. Rautenbach, R. Albrecht, Membrantrennverfah-ren, Otto Salle Verlag, 1981.
[16] DOW, Reverse Osmosis System Analysis, 2004.http://www.dow.com/.
[17] P.C.M. Carvalho, D.B. Riffel, R.S.T. Pontes, D. deSouza Oliveira Jr, R.G.V. de Oliveira, Mathemat-ical model of a photovoltaic powered reverseosmosis plant without batteries, in: Proceedingsof RIO 5 – World Climate & Energy Event, Riode Janeiro, 2005, pp. 219–226.
[18] P.C.M. Carvalho, D.B. Riffel, Small-scale photo-voltaic powered reverse osmosis plant withoutbatteries in stand-alone operation for equatorialareas, in: Proceedings of 20th European Photovol-taic Solar Energy Conference and Exhibition,Madri, 2005, pp. 2981–2984.