Forthcoming: World Development Small States, Small Problems? Income, Growth, and Volatility in Small States William Easterly The World Bank 1818 H Street, NW, Room MC3-337 Washington, DC 20433 (202) 473-8965; fax (202) 522-3518 [email protected]Aart Kraay The World Bank 1818 H Street, NW, Room MC3-359 Washington, DC 20433 (202) 473-5756; fax (202) 522-3518 [email protected]September 1999 Summary: Small states have attracted a large amount of research. In this paper we test whether small states are any different from other states in terms of their income, growth, and volatility outcomes. We find that, controlling for location, small states have higher per capita GDP than other states. This income advantage is largely due to a productivity advantage, constituting evidence against the idea that small states suffer from an inability to exploit increasing returns to scale. Small states also do not have different per capita growth rates than other states. Small states do have greater volatility of annual growth rates, which is in part due to their greater volatility of terms of trade shocks. This terms of trade-based volatility is in turn due to small states’ greater openness. However, their greater openness on balance has a positive net payoff for growth. The one differential policy measure that might be relevant for small states is to further open up to international capital markets in order to better diversify risk, but the benefits of even that are still unresolved in the literature. We conclude that small states are no different from large states, and so should receive the same policy advice that large states do. Keywords: The Caribbean, Pacific Islands, Growth, Volatility, Trade, Small States _______________________________________________________________________ The views expressed here are the authors’ and do not reflect those of the World Bank, its Executive Directors, or the countries they represent. We would like to thank two anonymous referees, Edgardo Favaro, and seminar participants (especially our discussant Byron Blake) in the Joint Commonwealth Secretariat/World Bank Task Force Conference on Small States in St. Lucia in February 1999 for useful discussions.
Transcript
Forthcoming: World Development
Small States, Small Problems? Income, Growth, and Volatility in Small States
William Easterly The World Bank
1818 H Street, NW, Room MC3-337 Washington, DC 20433
Summary: Small states have attracted a large amount of research. In this paper we test whether small states are any different from other states in terms of their income, growth, and volatility outcomes. We find that, controlling for location, small states have higher per capita GDP than other states. This income advantage is largely due to a productivity advantage, constituting evidence against the idea that small states suffer from an inability to exploit increasing returns to scale. Small states also do not have different per capita growth rates than other states. Small states do have greater volatility of annual growth rates, which is in part due to their greater volatility of terms of trade shocks. This terms of trade-based volatility is in turn due to small states’ greater openness. However, their greater openness on balance has a positive net payoff for growth. The one differential policy measure that might be relevant for small states is to further open up to international capital markets in order to better diversify risk, but the benefits of even that are still unresolved in the literature. We conclude that small states are no different from large states, and so should receive the same policy advice that large states do. Keywords: The Caribbean, Pacific Islands, Growth, Volatility, Trade, Small States _______________________________________________________________________ The views expressed here are the authors’ and do not reflect those of the World Bank, its Executive Directors, or the countries they represent. We would like to thank two anonymous referees, Edgardo Favaro, and seminar participants (especially our discussant Byron Blake) in the Joint Commonwealth Secretariat/World Bank Task Force Conference on Small States in St. Lucia in February 1999 for useful discussions.
2
“Smallness is neither a necessary nor sufficient condition for slow economic development” T.N. Srinivasan (1986)
“Economic storm clouds are gathering over paradise and the outlook is undeniably gloomy.”
A.J. Dolman (1985)
Do small states suffer from their smallness? There are good theoretical reasons to believe
that they do. The provision of public services may be subject to indivisibilities that lead to
increasing returns to scale (Alesina and Spolaore (1997)), especially fiscal institutions (Easterly
and Rebelo (1993)) and defense (Kuznets (1960), Harden (1985)). Many theories of economic
growth suggest increasing returns to scale in the private economy as well (Romer (1986), Barro
and Sala-i-Martin (1995), Aghion and Howitt (1998)), which may be difficult to realize in small
states. Small economies may also be at a disadvantage because their size prevents them from
diversifying into a wide range of activities, making them more vulnerable to terms of trade shocks
than large states (Commonwealth Secretariat (1998), Briguglio (1995), Armstrong and Read
(1998)). Many small states suffer from poor location in that they are remote and/or landlocked,
and many are located in regions prone to hurricanes and volcanic activity (Srinivasan (1986)).
Public officials in small states may be much more likely to be subjected to conflicting pressures
(Farrugia (1993)), and it may be difficult to recruit a high-quality civil service given the limited
pool of candidates in small states (Streeten (1993)). The trend towards trade multilateralism may
put small states at a disadvantage because they presently benefit from many bilateral trade
concessions (Armstrong and Read (1998)).
These potential difficulties facing small states have not been lost on policymakers or
academics. Numerous conferences and seminars on the special difficulties of small states have
been convened over the past forty years (Robinson (1960), Benedict (1967), Dobozi et. al. (1982),
Commonwealth Consultative Group (1985, 1997), Small States Financial Forum (1987,1988),
Kaminarides et. al. (1989)). International organizations such as the United Nations have
commissioned studies on the problems confronting small states for many years (United Nations
3
(1971), Doumenge (1983), UNCTAD (1997)) and the United Nations has formally recognized the
special difficulties of small states in a resolution to that effect (Briguglio (1995)). Titles of papers
on small states (see our bibliography) frequently feature ominous terms and phrases such as
“Problems”, “Vulnerability”, “Small is Dangerous”, and even (twice) “Paradise Lost”.
In this paper, we look for empirical evidence of alleged disadvantages of size by
examining small states with population 1 million or less. If small size is a disadvantage, then
these states must suffer with a vengeance. In particular, we would expect that small states must on
average be less developed and grow less rapidly than larger states. We test this hypothesis using a
large cross-country dataset including many small states. In light of the grim predictions of
theory, the picture of small states which emerges from this analysis is somewhat surprising. After
controlling for a range of factors, we find that small states have on average higher income and
productivity levels than large states, and grow no more slowly than large states. Per capita GDP
growth rates are more volatile in small states, due to their much greater exposure to international
trade and fluctuations in their terms of trade. However, any growth disadvantages of this greater
volatility are more than outweighed by the growth benefits of trade openness reaped by small
states by virtue of their necessarily-large trade volumes. Finally, small states are well-positioned
to take advantage of opportunities for international risk sharing, since the correlation of economic
fluctuations in small states with the world business cycle is surprisingly low.
These results contribute evidence in support of the growing view in the literature that
small size might not be a disadvantage after all. Kuznets (1960) notes that small states also have
advantages: primarily that many are lucky to have good natural resources and have a small and
more cohesive populations which allows them to adapt better to change. Srinivasan (1986) and
Streeten (1993) argue without systematic empirical evidence that small may also be beautiful.
Using a sample of 48 countries Millner and Westaway (1993) fail to find evidence that the effect
of a number of growth determinants varies with country size. Armstrong et. al. (1998) uses cross-
sectional regressions covering a large number of small states and independent regions to argue
4
that population size does not significantly affect growth, controlling for initial income and
regional effects.
The remainder of this paper proceeds as follows. In the next section we document that
small states are richer and have higher productivity levels than large states. In the following
section we observe that small states suffer no obvious growth rate disadvantage, and attribute this
to a number of offsetting advantages and disadvantages of small states. In Section 3 we
document that although terms of trade volatility contributes significantly to the greater volatility
of growth in small states, this is not the whole story -- a significant small state effect on volatility
remains after we control for terms of trade variability. In Section 4 we note that small states are
relatively well-positioned to take advantage of opportunities to diversify away their special risks
since they currently are not particularly financially open and the shocks they receive are relatively
uncorrelated with those experienced by the rest of the world. Section 5 offers concluding
remarks.
1. Small states and per capita income levels
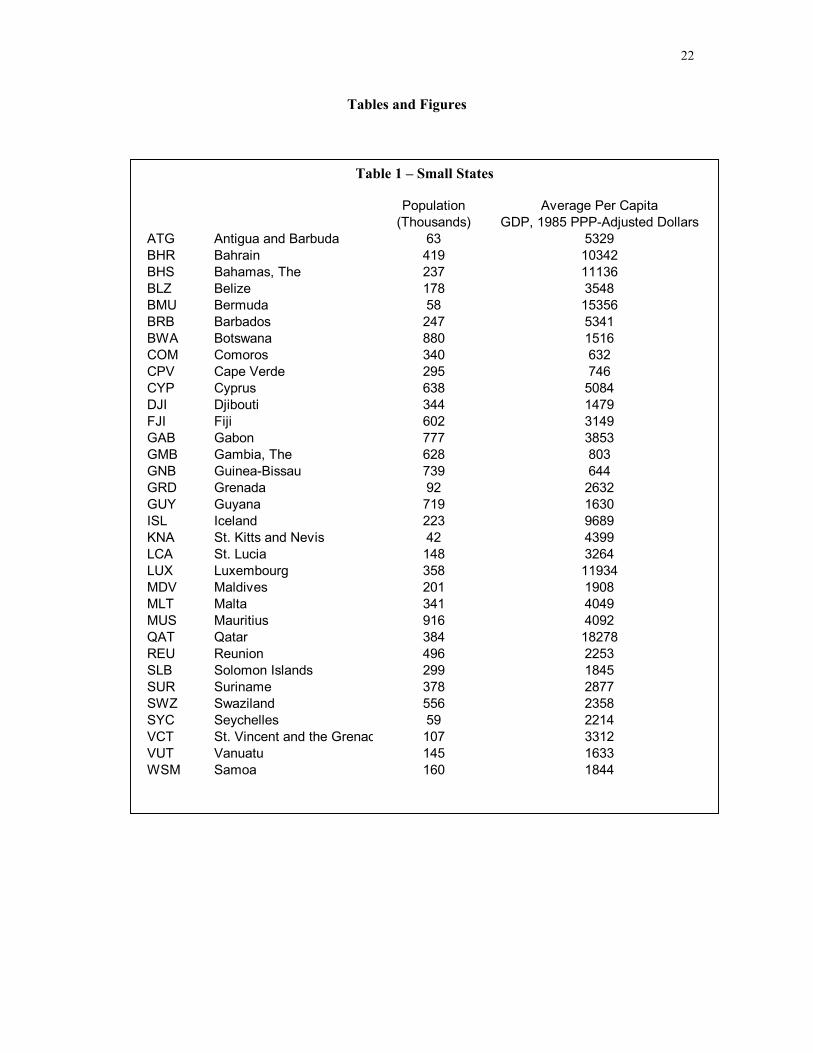
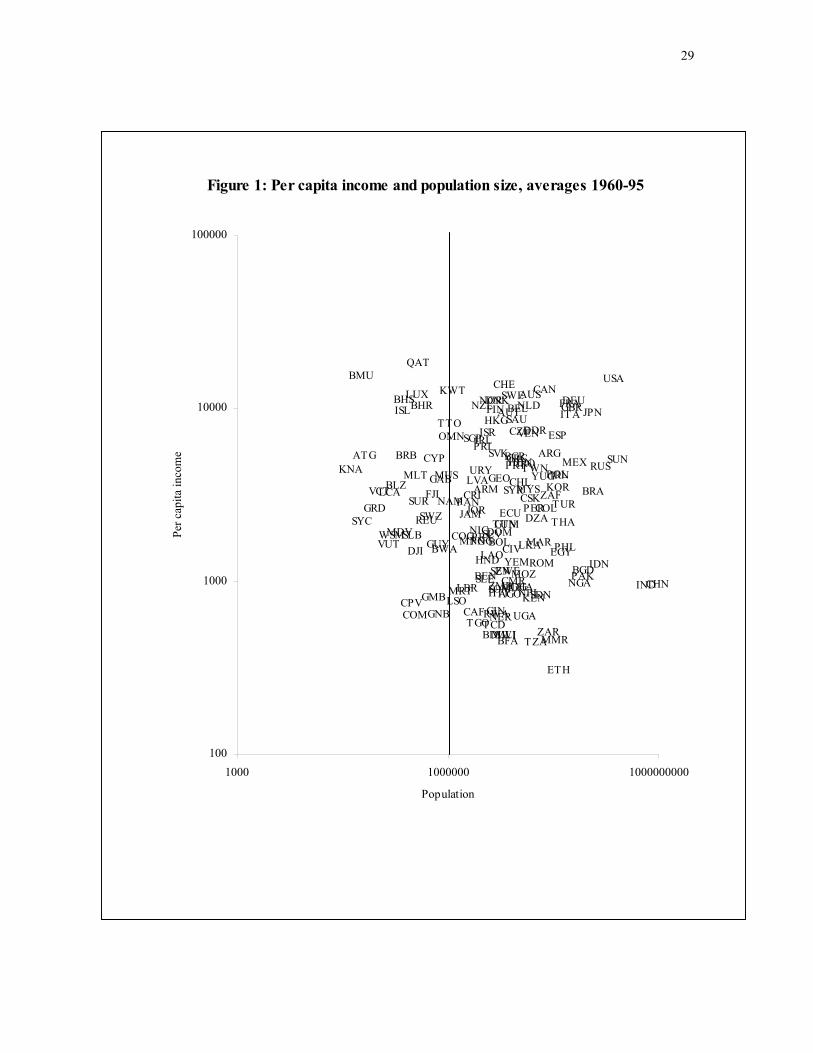
In this paper, we consider a large cross section of 157 countries for which at least 10
years of annual data on per capita GDP adjusted for differences in purchasing power parity is
available. Of these, 33 are small states defined as having an average population over the period
1960-1995 of less than one million. These countries are listed in Table 1, and range in size from
tiny St. Kitts and Nevis with population of 42,000 to Mauritius with 912,000. The income range
is similarly wide, from very poor African countries such as Guineau-Bissau and Comoros with
real PPP-adjusted per capita GDPs around $600 to wealthy oil-exporting countries such as Qatar
with per capita GDP of over $18,000. Although our sample is quite large, it is worth noting that
it is not comprehensive but rather is constrained by data availability. Of the 212 states and
territories listed in the World Bank’s databases, 55 have populations less than one million, but we
5
have only have internationally-comparable per capita GDP data for 33 of these small states.
While it is not clear a priori what biases this might introduce (both rich small states such as
Liechtenstein and poor small states such as Equatorial Guinea are excluded from our sample), we
do note that some caution is in order before generalizing our results to all small states. In
subsequent regressions the sample is even smaller, reflecting the non-availability of variables
other than per capita incomes in these regressions. Details on variable definitions and data
availability are provided in the Appendix.
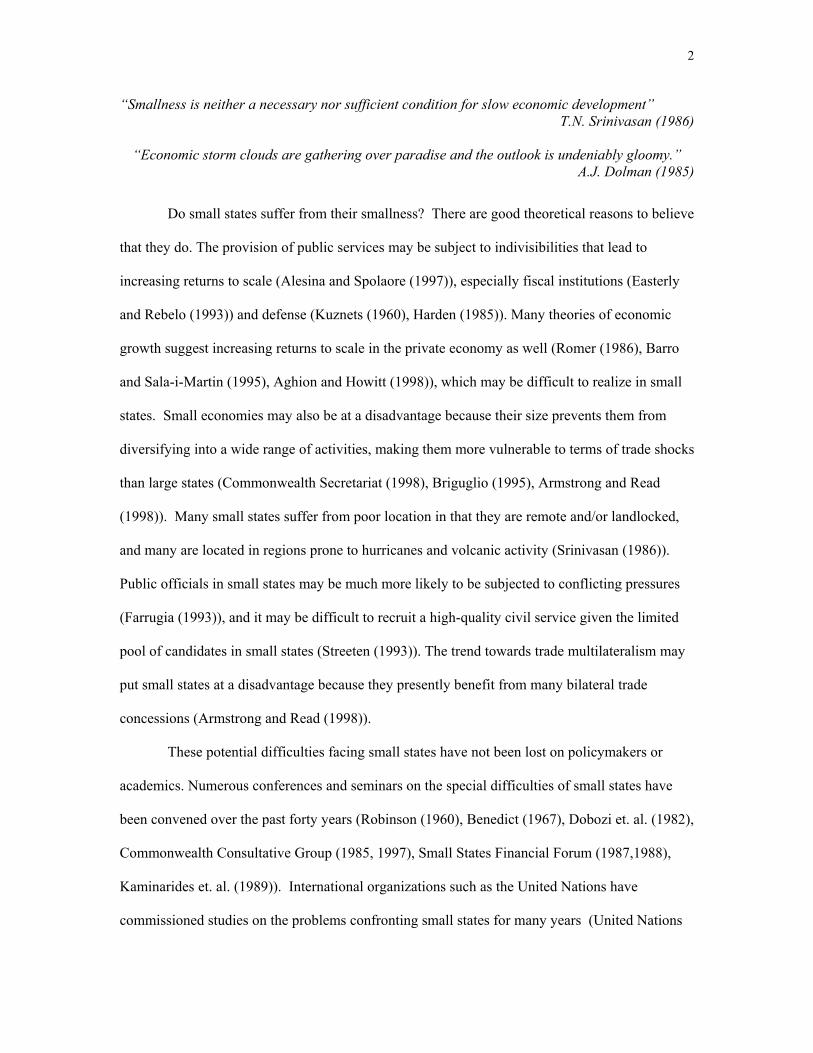
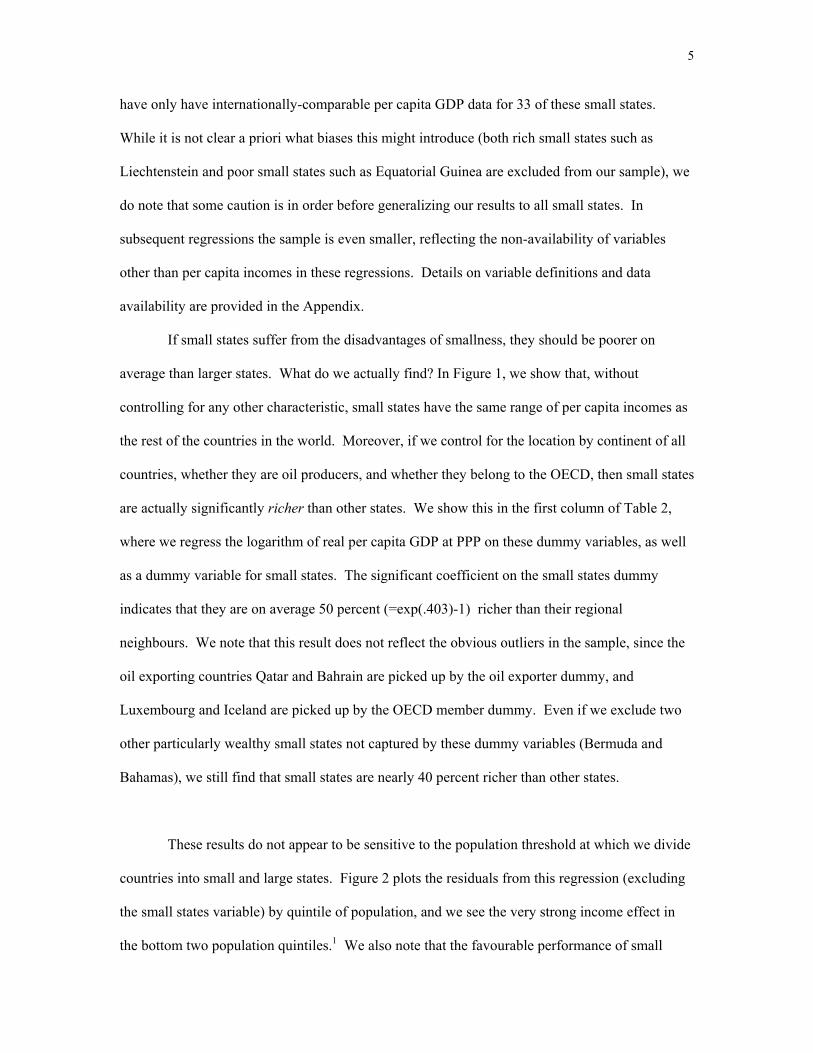
If small states suffer from the disadvantages of smallness, they should be poorer on
average than larger states. What do we actually find? In Figure 1, we show that, without
controlling for any other characteristic, small states have the same range of per capita incomes as
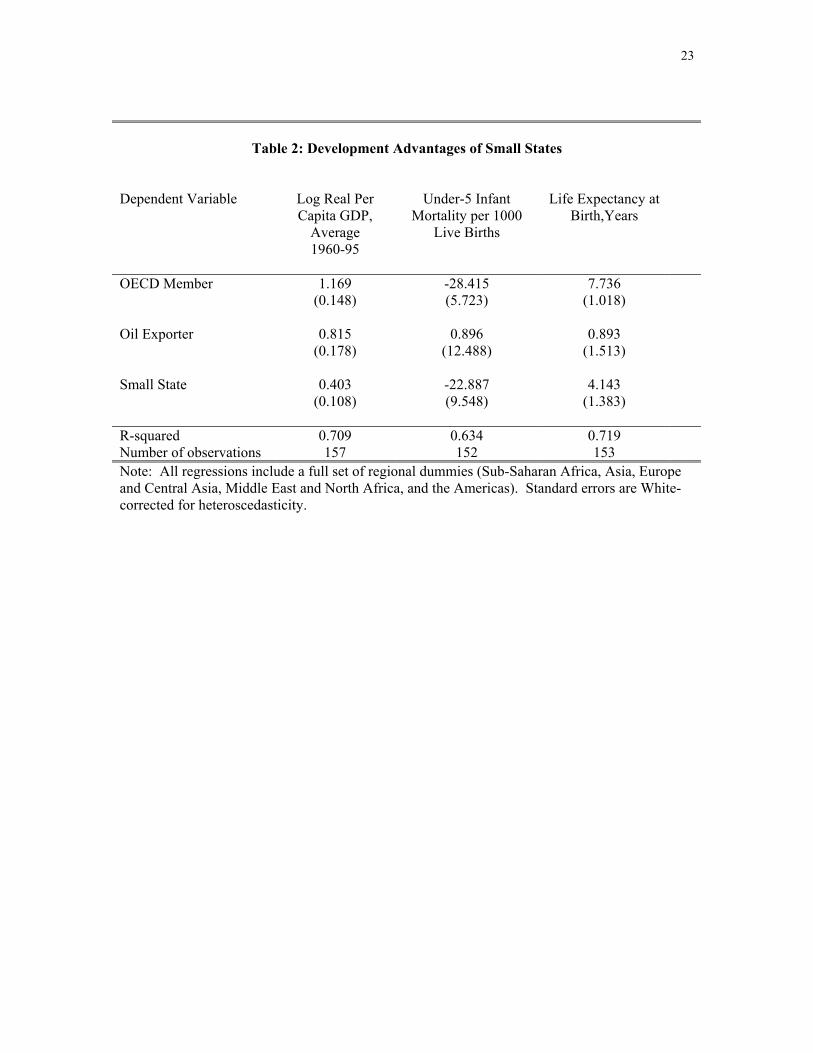
the rest of the countries in the world. Moreover, if we control for the location by continent of all
countries, whether they are oil producers, and whether they belong to the OECD, then small states
are actually significantly richer than other states. We show this in the first column of Table 2,
where we regress the logarithm of real per capita GDP at PPP on these dummy variables, as well
as a dummy variable for small states. The significant coefficient on the small states dummy
indicates that they are on average 50 percent (=exp(.403)-1) richer than their regional
neighbours. We note that this result does not reflect the obvious outliers in the sample, since the
oil exporting countries Qatar and Bahrain are picked up by the oil exporter dummy, and
Luxembourg and Iceland are picked up by the OECD member dummy. Even if we exclude two
other particularly wealthy small states not captured by these dummy variables (Bermuda and
Bahamas), we still find that small states are nearly 40 percent richer than other states.
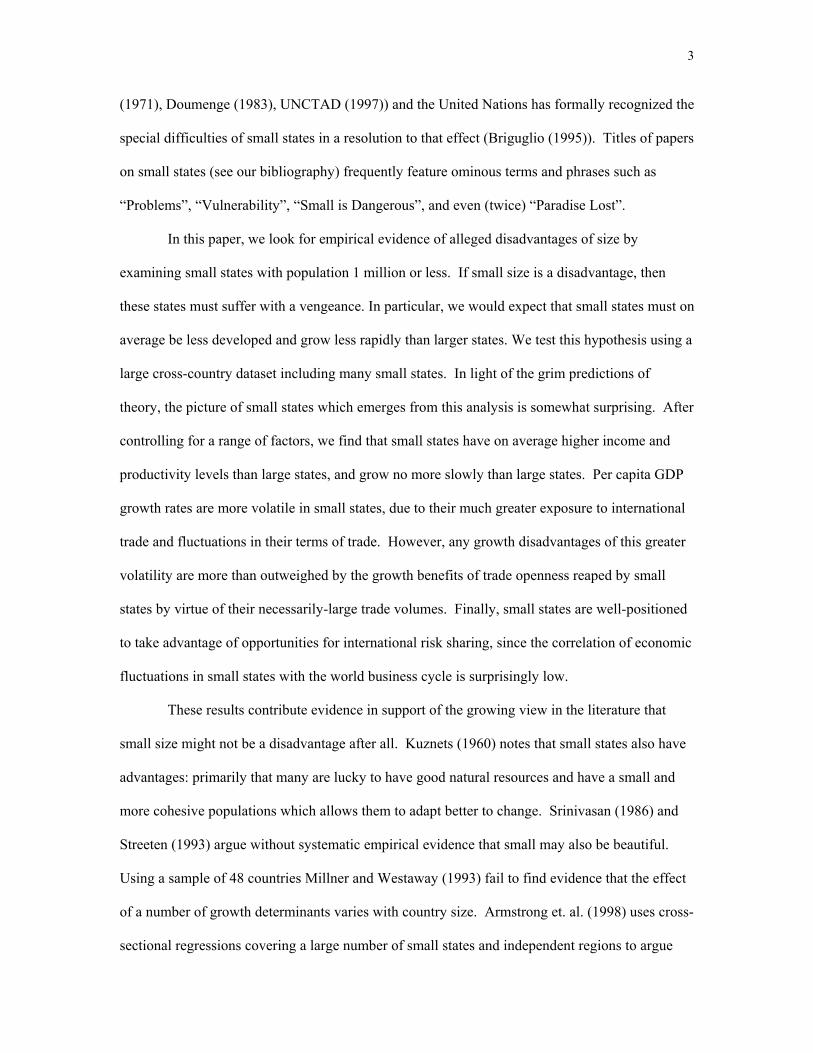
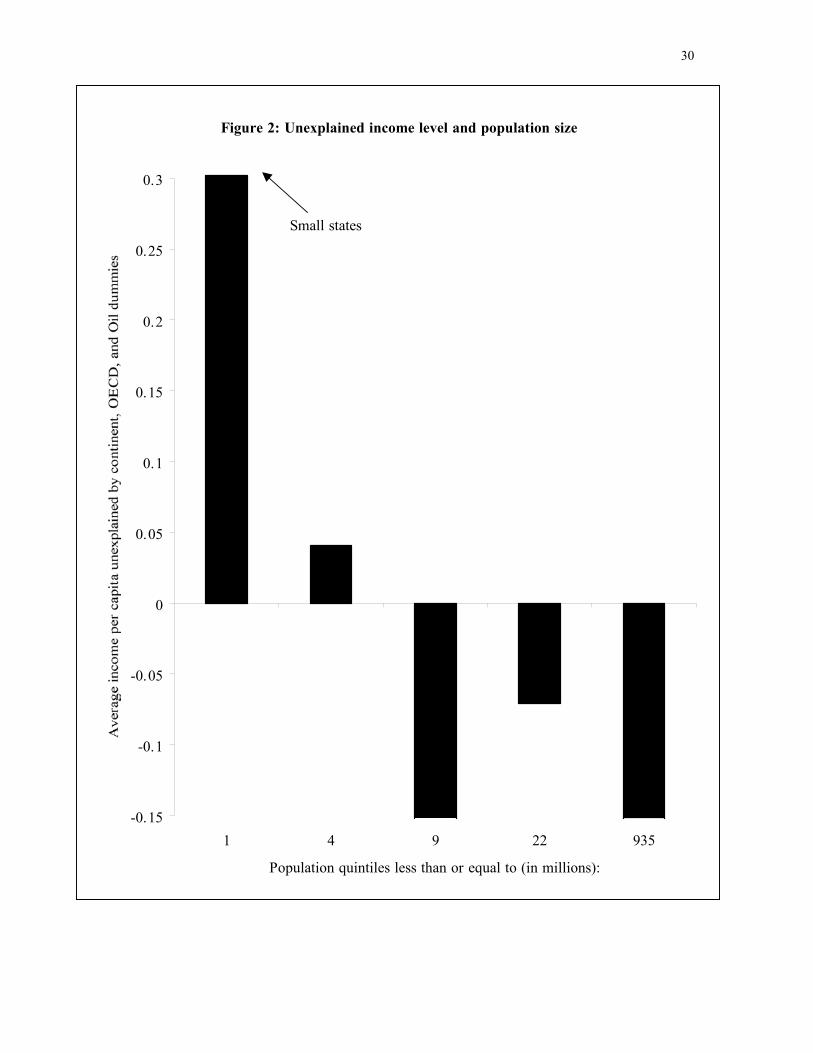
These results do not appear to be sensitive to the population threshold at which we divide
countries into small and large states. Figure 2 plots the residuals from this regression (excluding
the small states variable) by quintile of population, and we see the very strong income effect in
the bottom two population quintiles.1 We also note that the favourable performance of small
6
states carries over to other quality of life indicators. For example, if we in turn use under-five
infant mortality and life expectancy at birth as the dependent variable in the above regression, we
find that infant mortality is significantly lower in small states by 22 per thousand, while life
expectancy is about four years higher (columns 2 and 3 of Table 2). Although this analysis does
not tell us why small states are so much richer than their regional neighbors and have better
human development indicators, it does cast doubt on the often-heard arguments that small states
suffer from a development disadvantage.
We next ask whether small states are richer than large states because they save more or
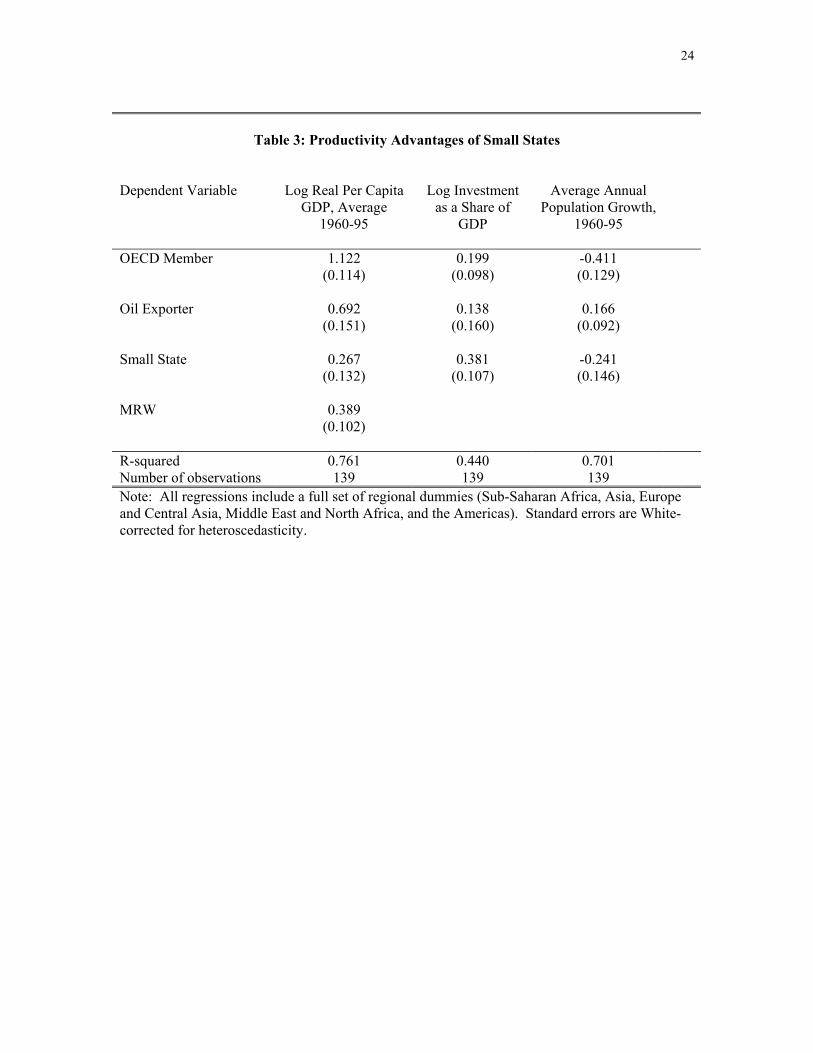
because they have higher productivity levels. Following Mankiw, Romer and Weil (1992), we
consider the prediction of the neoclassical Solow growth model that the steady-state level of
output per person is given by:
(1) Y/L = A (s/(x+δ+n))α/(1-α)
where Y/L is output per person, A is the level of labor-augmenting productivity, s is the
investment to GDP ratio, x is the rate of labor-augmenting productivity growth, δ is depreciation,
n is population growth, and α is the share of capital income in GDP. We assume a productivity
growth of 2 percent and a depreciation rate of 7 percent. We take logs of both sides and regress
the log of output per person on the same dummies as above (capturing continental and other
productivity differences) and the log of the second multiplicative term in (1):
(2) ln(Y/L) = ln A + α/(1-α) [ln s – ln(x+δ+n)]
We call this second term MRW, and report the results of this specification in the first column of
Table 3. Comparing the coefficient on the small states dummy with that in the first column of
7
Table 2, we find that small states’ productivity advantage accounts for about two-thirds of their
income per capita advantage (i.e. 0.267/0.403). This evidence is inconsistent with the commonly-
held idea that small states suffer from productivity disadvantages due to their inability to exploit
increasing returns to scale. We also note that our specification differs from Mankiw, Romer and
Weil (1992) in that we allow the average level of productivity to vary across regions, and these
differences are statistically significant (remember that the regressions include a full set of
regional dummies). Once we allow the productivity level to vary, the coefficient on MRW
implies a capital share of .28 -- which is in line with most estimates from national income
accounting.
It is interesting to decompose the MRW into its numerator and denominator from
Equation (1). We do this in the second and third columns of Table 3, where we regress the log
investment rate and the population growth rate on the same set of dummy variables as before.
We find that that small states have significantly higher investment rates but not significantly
lower population growth rates. This suggests that some portion of the previously-unexplained
income differential between small states and large states can be explained by the former’s higher
investment rates.
We conclude with two important caveats regarding these results on the productivity and
investment advantages of small states. First, the regressions in Table 3 do not control for
differences across countries in human capital, since it is difficult to adequately measure saving in
the form of human capital. As a result, the productivity advantage of small states to some extent
reflects their human capital differences from the rest of the world. This is consistent with the
strand of the literature that argues that small states need to rely on imported technology and high
quality human capital to compensate for their lack of natural resources (Bhaduri et al. (1982)
suggest human capital-intensive exported services as a way to escape “smallness”; Briguglio
(1995) suggests the importance of regional technical cooperation; Milner and Westaway (1993)
find that small states have a weak disadvantage in agricultural technological catch-up but a weak
8
advantage in non-agricultural technological catch-up; and Armstrong and Read (1998) suggest
that advances in transport and communications technology have helped offset “smallness” and
“remoteness”).
Second, we should take with more than a grain of salt the result that investment accounts
for some of the income advantage of small states. The significance of the MRW term in Table 3
may reflect reverse causality – richer states can afford to invest more and are usually thought to
choose lower population growth than poor states. Or it may reflect an omitted third factor, like
incentive policies that affect both investment and income. It is difficult to adequately control for
these possibilities. Instead, we simply note that they are likely to result in an overstatement of the
contribution of investment to the income advantage of small states.
2. Micro States and Macro Growth
Even if small states do not have a disadvantage in terms of their income levels, they
might grow more slowly over time for various reasons. Several endogenous growth theories
predict that growth rates will be positively correlated with size due to scale effects. As we discuss
below, small states exhibit greater output volatility, which has been shown empirically to have
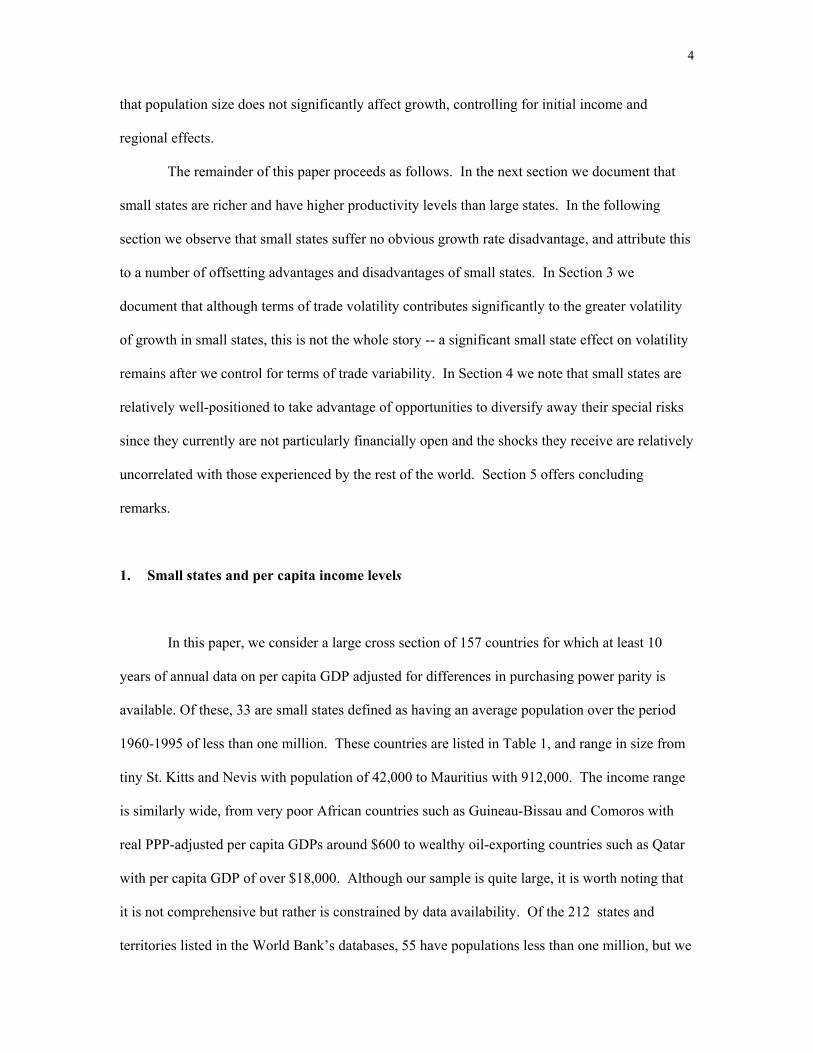
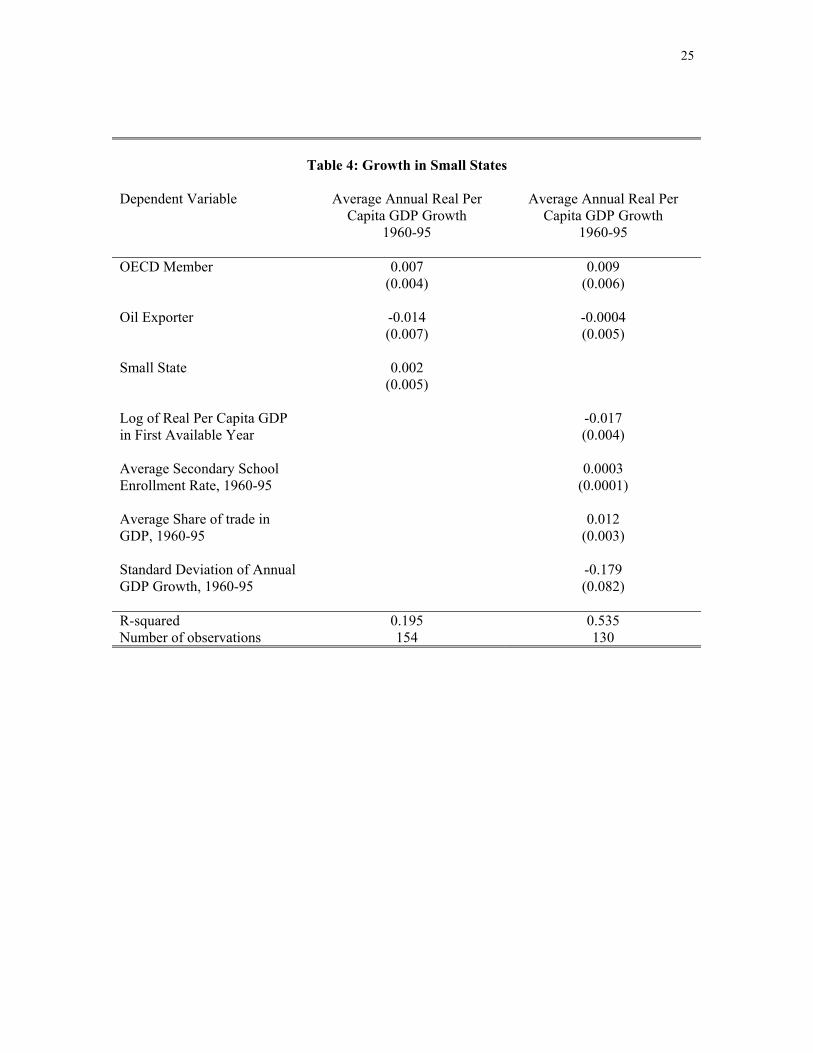
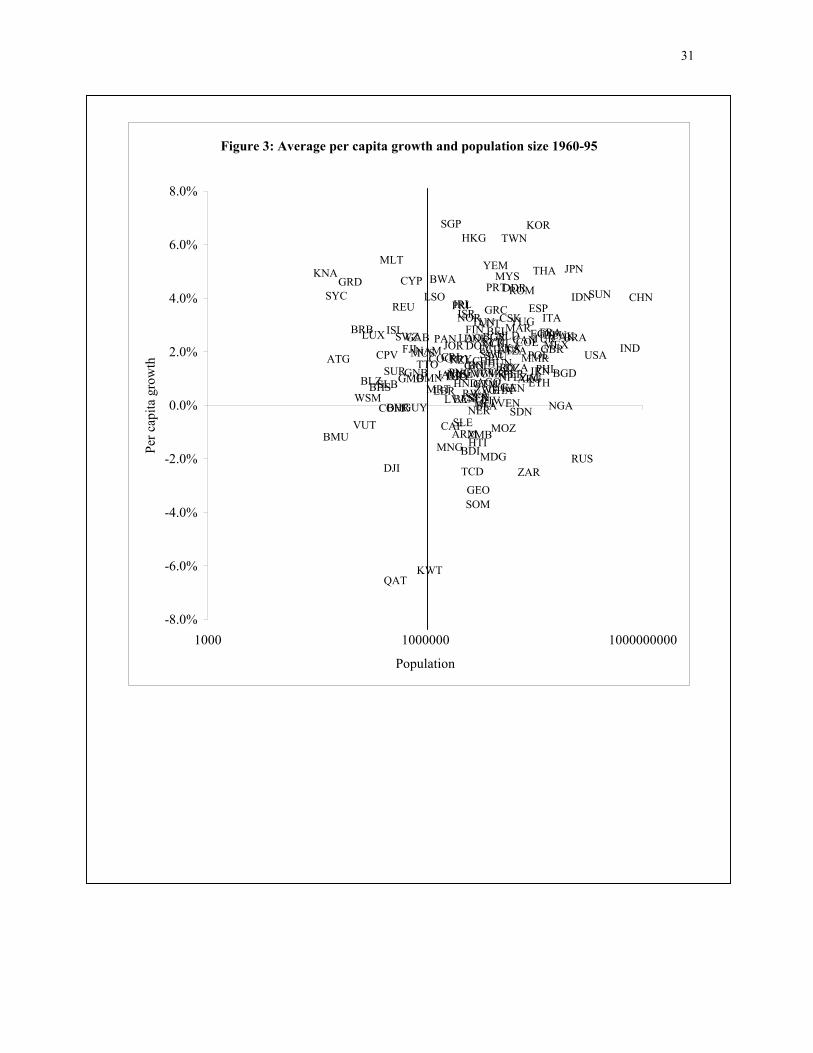
adverse effects on growth (Ramey and Ramey (1995)). What do the data say? In Figure 3 we
show that small states have the same range of growth experiences as other states, suggesting that
there is no obvious scale effect for growth rates that is related to population size. There is also no
growth difference for small states after controlling for continental location, oil, and OECD
dummies, as shown in the first column of Table 4 where we regress growth on these dummies
and the small states dummy.
Why do small states not suffer any apparent growth disadvantages due to their small size?
To answer this question, we consider a parsimonious cross-country growth regression which
captures two of the factors prominent in the small states debate: openness to international trade
9
(measured as the share of imports and exports in GDP), and volatility (measured as the standard
deviation of annual growth rates within each country). We also include initial income to capture
convergence effects, and secondary school enrollment rates. The results are shown in the second
column of Table 4. All of the variables are significant of the expected sign. The negative
coefficient on initial income shows that there is conditional convergence, secondary enrollment
rates and trade openness are positively correlated with growth, and growth rate volatility has a
negative effect on growth.
This regression framework provides some useful clues as to why the small state dummy
is not significant in the basic regression in the first column of Table 4. In particular, we can see
from this regression that small states will have several offsetting advantages and disadvantages.
We have already seen that they are richer than other countries (relative to regional averages) and
hence will have slower growth than average by the conditional convergence effect. They have
slightly higher secondary enrollment rates, which would give them higher growth. Most
important, as we document below, small states tend to have much higher trade shares (which is
good for growth), offset by much higher volatility of growth rates (which is bad for growth).2 As
a result, the insignificance of the small state dummy in the growth regression suggests that the
negative effects of high initial income and high volatility are roughly offset by the positive effects
of trade openness and better educational attainment.
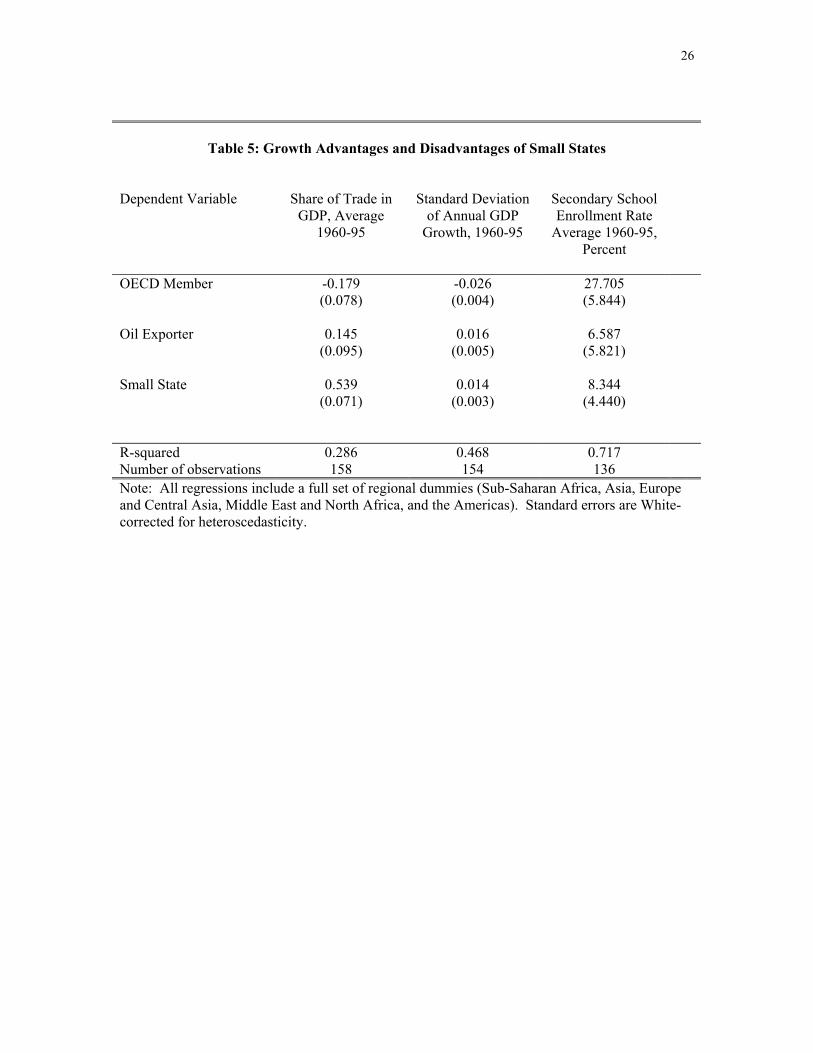
In order to document the magnitude of these offsetting effects, we first need to know how
different small states are from non-small states in terms of their growth determinants. We
document the well-known fact that small states typically have much higher trade ratios than larger
states in the first column of Table 5, where we regress this variable on the same set of dummy
variables as before, as well as the small states dummy. The consequences for openness of being a
small state are truly remarkable. Small states have a ratio of trade to GDP that is 54 percentage
points (1.2 standard deviations) higher than the average economy controlling for continent
dummies! Second, real per capita GDP growth rates tend to be much more volatile in small
10
states. The second column of Table 5 shows that the standard deviation of annual real per capita
GDP growth is 1.4 percentage points higher in small states than in non-small states. 3 Finally for
completeness we show that while secondary school enrollment rates are modestly higher in small
states, this difference is only marginally statistically significant.
These results suggest that the absence of a clear growth advantage of small states is due
to three main offsetting effects: (i) they are significantly richer, and hence grow more slowly due
to the conditional convergence effect; (ii) they are significantly more open to international trade,
which is good for growth, and (iii) they suffer from significantly greater growth rate volatility,
which is bad for growth. Interestingly, the positive growth effect of openness in Table 5
(0.012x0.54=0.65 percent) is 2.5 times larger than the negative growth effect (-1.79x0.014=-0.25
percent) of small states’ greater output volatility. This suggests that even if output volatility is
one of the consequences of openness (as we discuss in more detail below), small states’ greater
openness is still on balance a positive factor for small states’ growth. This finding is of particular
interest, given the widely held view that small states suffer from their openness.4 Of course, any
source of growth volatility that is not related to openness might still be detrimental to small
states’ growth performance.
Finally, it is interesting to note that one often-heard benefit of small states does not
appear to be empirically very important. It is often argued that one of the advantages of small
states is that they tend to be ethnically very homogeneous, which may make it easier for such
states to forge the political consensus required to adjust to a changing environment (for example,
Kuznets (1960)). Easterly and Levine (1997) and Alesina, Baqir, and Easterly (1999) find that
measures of ethnic fractionalization are associated with a lower level of public goods provision
and lower growth. However, the mean value of an ethnolinguistic indicator of diversity among
those small states for which data is available is insignificantly different from that among non-
small states, suggesting that the benefits of homogeneity may not be especially pronounced for
small states.5
11
3. Openness and Volatility
In the previous section we saw that small states reap growth benefits from their openness
to international trade, but suffer growth costs due to the greater volatility of their growth rates. In
this section we consider in more detail the relationship between trade openness and volatility in
small states. A significant portion of the growth rate volatility experienced by small states can be
attributed to volatility in their terms of trade, but this is not the entire story. Even after
controlling for terms of trade volatility, growth rates in small states are significantly more volatile
than in non-small states.
We first document that the volatility of terms of trade shocks experienced by small states
is much greater than for larger states. We define terms of trade shocks as the growth in the local
currency price of exports times the share of exports in GDP less the growth in the local currency
price of imports less the share of imports in GDP, which captures both the magnitude of price
fluctuations (changes in export and import prices) and their importance for the domestic economy
(weighted by the shares of exports and imports in GDP). We then regress the standard deviation
of this measure of terms of trade shocks on the same set of regional dummies as before, dummy
variables to capture oil exporters and commodity exporters who are more likely to suffer extreme
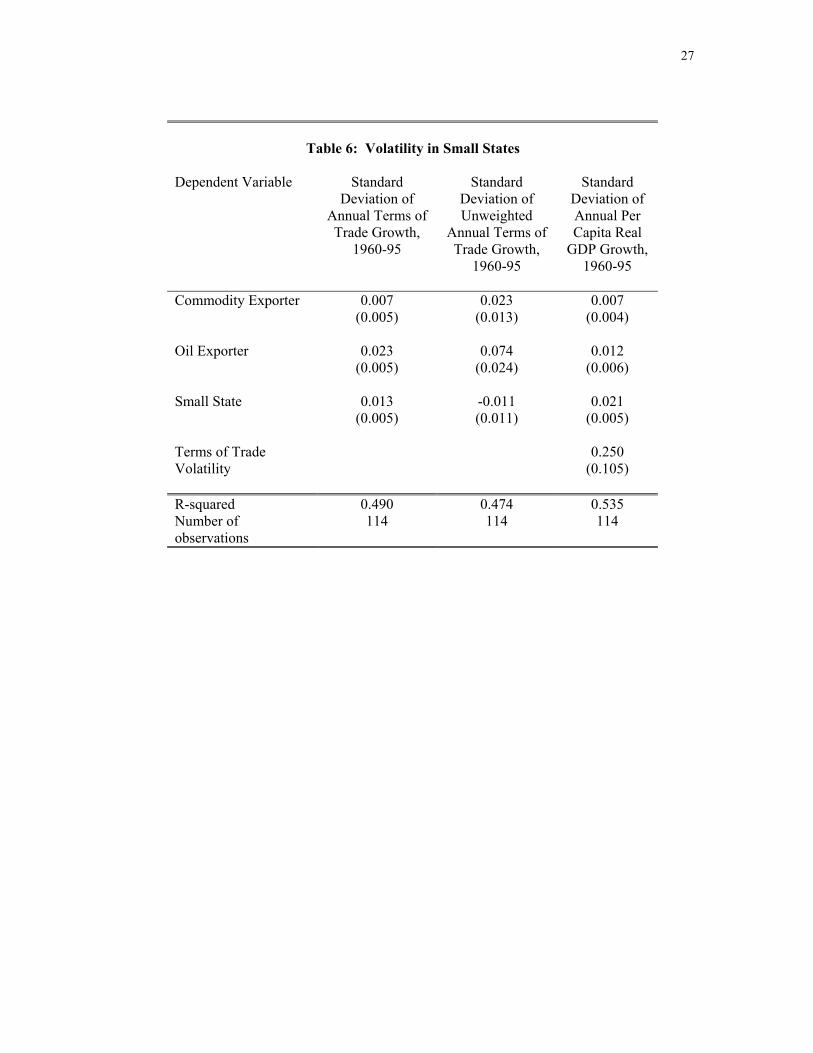
fluctuations in their terms of trade, and the small state dummy. The results are shown in the first
column of Table 6. We find that there is a highly-significant small state effect, with the standard
deviation of terms of trade shocks larger by 0.013 (or about one-third of one standard deviation of
the dependent variable) in small states.
This terms of trade volatility might be due to two factors. First, we have already seen
that the share of trade in GDP is especially large in small states, and this may contribute to the
magnitude of our measure of terms of trade shocks (since it weights changes in import and export
prices by the shares of imports and exports in GDP). Second, small states’ exports are likely to
12
be more specialized than those of large states, both in terms of products exported and in terms of
export markets (Kuznets (1960), Armstrong and Read (1998)). As a result, the average prices of
their exports and imports might be more volatile than in countries with more diversified trade
patterns. The distinction between these two factors is important because there is little that small
states can do about their overall trade volumes – autarky is simply not an option for small states
that produce a much narrower range of goods and services than they consume, and moreover we
have already documented the substantial growth benefits accruing to small states due to their
openness. If in contrast the greater volatility of growth is due to excessive reliance on a few
export products and a few export markets, then policies designed to help diversify exports may
help to dampen economic fluctuations.6
We can get a rough idea of the relative importance of these two factors by redefining the
terms of trade shock as the unweighted difference between the growth in export prices and the
growth in import prices. When we use this alternative measure of terms of trade shocks as the
dependent variable in the second column of Table 6, we find that the small states dummy is
negative and insignificant. That is, the volatility of changes in the price of exports relative to
imports is if anything lower in small states relative to larger states. Although this is not
conclusive evidence, it does cast doubt on the notion that small states are especially vulnerable to
external shocks simply because their international trade is more specialized. Rather, the greater
volatility of terms of trade shocks in small states is primarily due to their unavoidably large trade
shares.
Finally, it is worth noting that greater volatility of growth in small states is not solely due
to their greater susceptibility to terms of trade shocks. To illustrate this point, we re-estimate the
growth rate volatility regression in the second column of Table 4, adding the volatility of the
terms of trade as an explanatory variable. The results are shown in the last column of Table 6.
We find that the small state dummy remains significant even after controlling for the effect of
greater terms of trade volatility on the volatility of overall growth. This indicates that a
13
significant portion of the volatility of output in small states is unrelated to their exposure to
international trade. This additional volatility may be due to several factors. Many of the small
states in our sample are located in areas prone to natural disasters such as hurricanes, and the
higher growth volatility in small states may simply reflect the devastating effect of these natural
forces. However, it is also possible that some of this observed volatility reflects difficulties in
measuring per capita incomes, which may be particularly acute in small states where statistical
institutions may be weaker than average.
4. Opportunities for Diversification
In the previous section we have seen that small states experience much more volatile
growth rates than non-small states. This in part reflects their greater vulnerability to terms of
trade shocks, and perhaps also the tendency of many small states to suffer heavily from natural
disasters. In this section we briefly consider the potential of small states to mitigate the adverse
effects of this largely-unavoidable volatility by sharing risks with the rest of the world.
One of the potential benefits of financial openness is that it allows countries to share risks
with the rest of the world, by holding claims on assets located outside their borders whose returns
are not perfectly correlated with returns to domestic assets. The magnitude of these benefits
depends on how volatile are shocks to the domestic economy, and the extent to which they are
uncorrelated with shocks abroad. Small states are particularly well-situated to benefit from such
risk sharing arrangements, for two reasons. First, small states suffer large shocks, as documented
in Section 3. Second, in contrast to the often-heard view that small states are particularly
susceptible to cyclical fluctuations abroad, we find that the shocks experienced by small states are
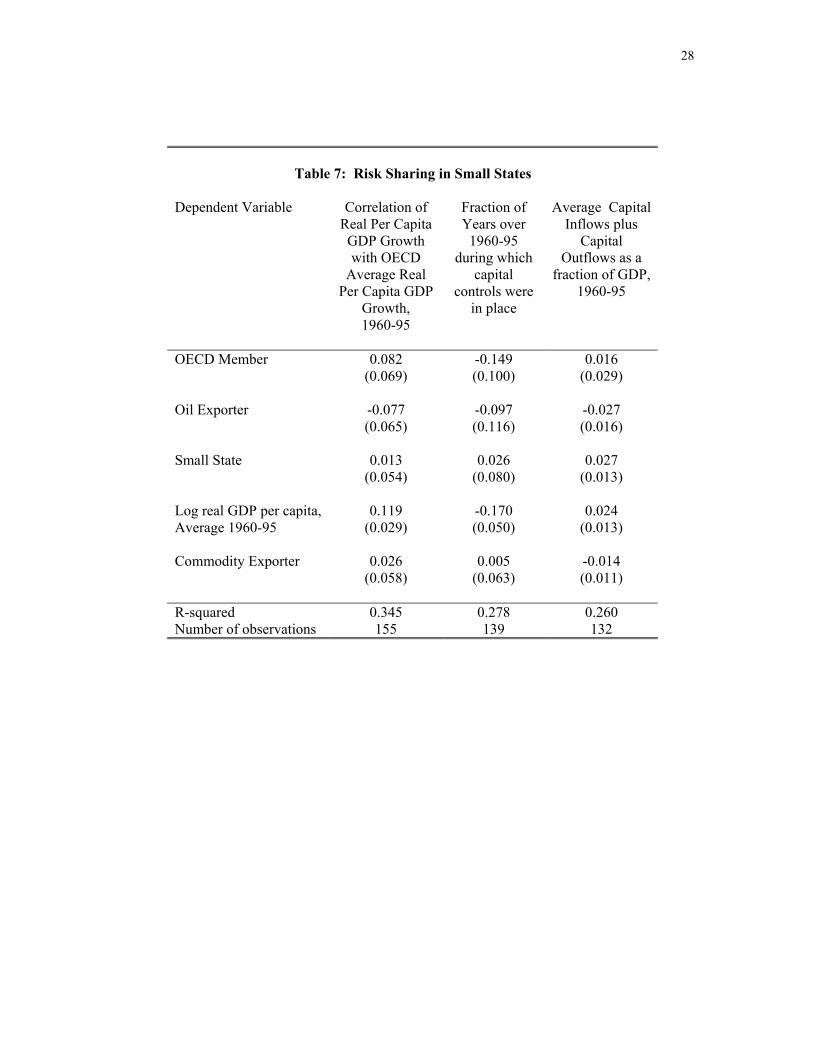
not unusually correlated with the world business cycle. We illustrate this point in the first column
of Table 7, where we regresses the correlation of per capita GDP growth in a country with
OECD average real per capita GDP growth on the same set of dummies as before, as well as the
14
logarithm of average per capita GDP (to capture the stylized fact documented by Kraay and
Ventura (1998) that business cycles in poorer countries tend to be less correlated with the world
average cycle), and a small state dummy. The small state dummy is insignificant, suggesting that
small states are in fact not unusually correlated with the OECD cycle. However, it is important to
note that growth rates in neighbouring small states may be highly correlated, especially to the
extent that their growth rate volatility reflects natural disasters such as hurricanes. This suggests
that regional arrangements to share risk among small states will be much less valuable than
pooling risks with a wider range of countries.
Despite the potential benefits of risk sharing through participation in international
financial markets, small states do not appear to be especially open financially. We illustrate this
point in the last two columns of Table 7, where we regress two alternative measures of financial
openess on a set of regional dummies as well as the logarithm of average per capita income. The
first is the fraction of years for which data is available in which the IMF reports restrictions on
capital account transactions in that country.7 The coefficient on the small state dummy is
positive, although insignificantly so. This suggests that small states are not particularly open to
financial flows, as measured by legal impediments to such flows. Combining this observation
with the empirical results of Lewis (1995), who finds that consumption risks are less diversified
in countries with this measure of capital controls, this suggests that small states are not taking full
advantage of the opportunities for risk diversification afforded by international capital markets.
The second outcome measure of financial openness (capital inflows plus capital outflows as a
share of GDP) paints a somewhat more favorable picture, as the small state dummy is positive
and statistically significant at conventional levels. This suggests that the volume of capital flows
is slightly larger for small states than for non-small states, although the magnitude of this effect is
small – only about 2-3 percentage points of GDP. Overall, this evidence suggests that small
states are not as financially open as they might be given the high volatility they face, and hence
are not fully exploiting opportunities for international risk diversification.
15
We conclude this section with the observation that although greater financial openness
may help small states insure against the large shocks they receive, financial openness is itself no
panacea. Grilli and Milesi-Ferretti (1995) and Rodrik (1998) both note that there is no evidence
that financially-open economies grow faster or enjoy higher investment rates. On the other hand,
there is also no systematic evidence in favor of the popular view that by opening up financially,
countries expose themselves to greater volatility due to the vagaries of international financial
markets (Kraay (1998)). In summary, although financial openness may provide a valuable means
for small states to diversify some of the large risks they face, existing evidence does not support
the view that there will be a large growth payoff from such policies.
5. Conclusions
Our analysis suggests that small states have perhaps received excessive attention from the
literature – notwithstanding our own addition to the literature!--as special cases calling for special
policy measures. We find that small states have, if anything, significantly higher per capita
income than others in their region. There is no significant difference in growth performance
between large and small states. It is true that growth volatility and volatility of terms of trade
shocks as percent of GDP is higher in small states, but this is largely due to their greater trade
openness – and the net benefits of openness on growth are positive. The one missing piece in the
current situation of small states is that they are not fully exploiting the potential to diversify their
risks by opening up to international capital movements. But even the payoff to filling in this last
missing piece is unclear from evidence in the literature.
This is not to say that small states are free of economic problems! Many small states are
still poor, and promoting growth as a means to alleviate poverty is as important in small poor
states as it is in other poor countries. The good news is that the lessons of growth experience
16
from all countries seem to be applicable to small states, so they can benefit from the large amount
of cross-country evidence on the determinants of long-run growth.
17
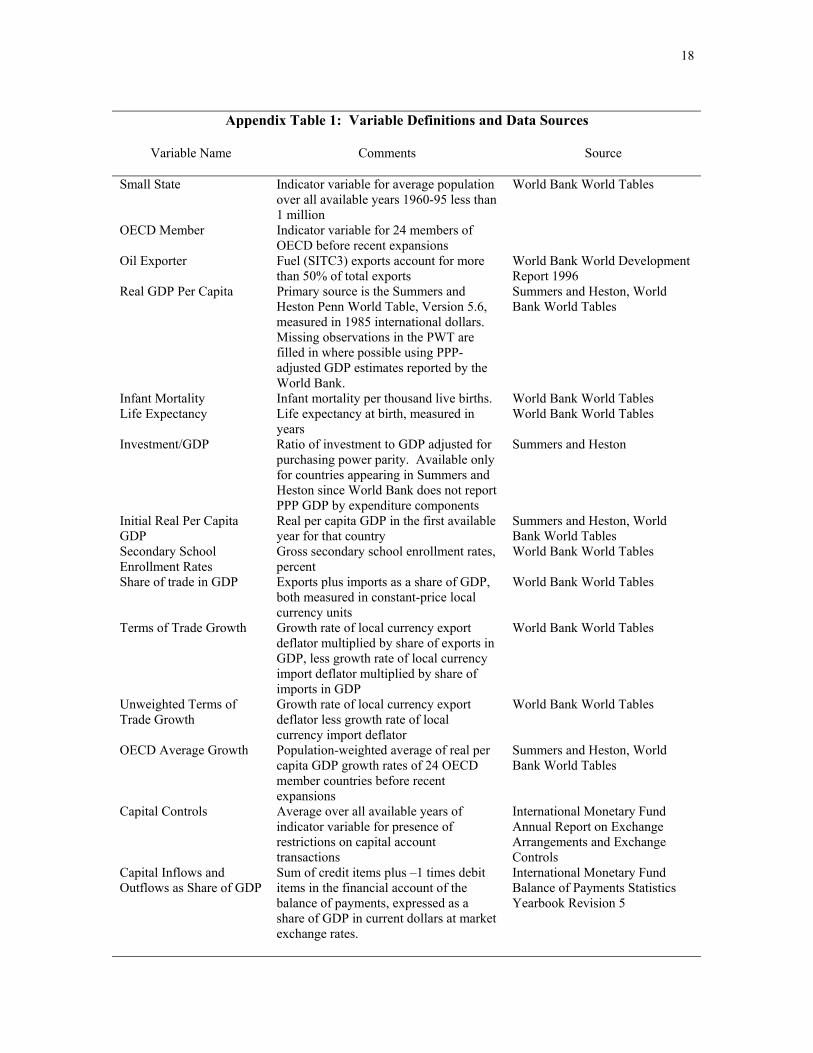
Appendix: Variable Definitions and Data Sources
This appendix documents the definitions of all variables and the data sources from which
they were constructed. Variables are listed in the order in which they appear in the tables in the
table below. The sample consists of all countries for which at least ten years of data on real per
capita GDP adjusted for purchasing power parity is available, as documented below. Since a
number of very small states do not report national accounts data and/or are not included in the
United Nations/World Bank Income Comparison Project, real per capita GDP data is not
available for these states. As discussed in the text, it is not clear a priori what sorts of biases this
might introduce. Nevertheless, some caution is in order before extending the results to the
universe of small states.
All of the cross-sectional regressions are based on averages over all available years of the
relevant variables. As a result, the time period covered for each country varies with the length of
the time series available for that country. Due to unavailability of additional explanatory
variables, the sample of countries covered in the regressions varies, ranging from the maximum
possible of 157 to a minimum of 114.
18
Appendix Table 1: Variable Definitions and Data Sources
Variable Name
Comments Source
Small State Indicator variable for average population over all available years 1960-95 less than 1 million
World Bank World Tables
OECD Member Indicator variable for 24 members of OECD before recent expansions
Oil Exporter Fuel (SITC3) exports account for more than 50% of total exports
World Bank World Development Report 1996
Real GDP Per Capita Primary source is the Summers and Heston Penn World Table, Version 5.6, measured in 1985 international dollars. Missing observations in the PWT are filled in where possible using PPP-adjusted GDP estimates reported by the World Bank.
Summers and Heston, World Bank World Tables
Infant Mortality Infant mortality per thousand live births. World Bank World Tables Life Expectancy Life expectancy at birth, measured in
years World Bank World Tables
Investment/GDP Ratio of investment to GDP adjusted for purchasing power parity. Available only for countries appearing in Summers and Heston since World Bank does not report PPP GDP by expenditure components
Summers and Heston
Initial Real Per Capita GDP
Real per capita GDP in the first available year for that country
Summers and Heston, World Bank World Tables
Secondary School Enrollment Rates
Gross secondary school enrollment rates, percent
World Bank World Tables
Share of trade in GDP Exports plus imports as a share of GDP, both measured in constant-price local currency units
World Bank World Tables
Terms of Trade Growth Growth rate of local currency export deflator multiplied by share of exports in GDP, less growth rate of local currency import deflator multiplied by share of imports in GDP
World Bank World Tables
Unweighted Terms of Trade Growth
Growth rate of local currency export deflator less growth rate of local currency import deflator
World Bank World Tables
OECD Average Growth Population-weighted average of real per capita GDP growth rates of 24 OECD member countries before recent expansions
Summers and Heston, World Bank World Tables
Capital Controls Average over all available years of indicator variable for presence of restrictions on capital account transactions
International Monetary Fund Annual Report on Exchange Arrangements and Exchange Controls
Capital Inflows and Outflows as Share of GDP
Sum of credit items plus –1 times debit items in the financial account of the balance of payments, expressed as a share of GDP in current dollars at market exchange rates.
International Monetary Fund Balance of Payments Statistics Yearbook Revision 5
19
References
Aghion, Philippe and Peter Howitt (1998) Endogenous Growth Theory. MIT Press, Cambridge, MA.
Alesina, Alberto, Reza Baqir, and William Easterly (1999) Public goods and ethnic divisions.
Quarterly Journal of Economics, forthcoming. Alesina, Alberto, and Enrico Spoalare (1997) On The Number and Size of Nations. Quarterly
Journal of Economics, November. Armstrong, H.W. and R. Read (1998) Trade and growth in small states: the impact of global trade
liberalization. World Economy, Armstrong, H, R.J. de Kervenoael, X. Li and R. Read (1998) A Comparison of the Economic
Performance of Different Microstates, and Between Microstates and Larger Countries. World Development, 26(4):639-656.
Barro, Robert and Xavier Sala-I-Martin (1995) Economic Growth. McGraw-Hill, New York, NY. Benedict, Burton (1967) Problems of Smaller Territories. Athlone Press, London. Bhaduri, Amit, Anjan Mukerji, and Ramprasad Sengupta (1982) Problems of long-term growth: a
theoretical analysis, in Briguglio, Lino (1995) Small Island Developing States and Their Economic Vulnerabilities.
World Development, 23(9): 1615-1632. Cashin, Paul and Norman Loayza (1995) Paradise lost? Growth, convergence, and migration in
the South Pacific. IMF Staff Papers, 42:608-41. Commonwealth Consultative Group (1985) Vulnerability: Small States in the Global Society.
Commonwealth Secretariat, London. Commonwealth Consultative Group (1997) A Future for Small States: Overcoming
Vulnerability. Commonwealth Secretariat, London. Dobozi, Istvan, Clare Keller and Harriet Matejka (1981) Small Countries and International
Structural Adjustment: A Collection of Hungarian and Swiss Views. Dolman, Antony (1985) Paradise Lost? The Past Performance and Future Prospects of Small
Island States. In . States, Microstates and Islands, eds. Edward Dommen and Philippe Hein. Croom Helm, London.
Doumenge, Francois (1983) Viability of Small Island States. Paper prepared for United Nations
Conference on Trade and Development. Easterly, William and Ross Levine (1997) Africa’s Growth Tragedy: Policies and Ethnic
Divisions. Quarterly Journal of Economics, November.
20
Easterly, William and Sergio Rebelo (1993) Fiscal Policy and Economic Growth: an Empirical Investigation. Journal of Monetary Economics, 32:417-57.
Farrugia, Charles (1993) The Special Working Environment of Senior Administrators in Small
States. World Development, 21(2):221-226. Grilli, Vittorio and Gian Maria Milesi-Ferretti (1995) Economic Effects and Structural
Determinants of Capital Controls. International Monetary Fund Staff Papers, 42(3):517-551.
Harden, Sheila (1985) Small is Dangerous: Micro States in a Macro World. Frances Pinter,
London. Jalan, B. ed. (1982) Problems and policies in small economies. St. Martin’s Press, New York. Kaminarides, John, Lino Briguglio and Henk N. Hoogendonk (1989) The Economic
Development of Small Countries: Problems, Strategies and Policies. Eburon, Delft. Kraay, Aart and Jaume Ventura (1998) Comparative Advantage and the Cross-Section of
Business Cycles. World Bank Policy Research Department Working Paper No. 1948. World Bank, Washington, DC.
Kraay, Aart (1998) In Search of the Macroeconomic Effects of Capital Account Liberalization.
Manuscript, World Bank. Kuznets, S. (1960) Economic Growth of Small Nations. In The Economic Consequences of the
Size of Nations, ed. E.A.G. Robinson, Proceedings of a Conference Held by the International Economic Associations. MacMillan, Toronto.
Lewis, Karen (1996) What Can Explain the Apparent Lack of International Consumption Risk
Sharing? Journal of Political Economy, 104:267-297. Mankiw, N. Gregory, David Romer and David Weil (1992) A Contribution to the Empirics of
Economic Growth. Quarterly Journal of Economics. Milner, Chris and Tony Westaway (1993) Country Size and the Medium-Term Growth Process:
Some Cross-Country Evidence. World Development, 21 (2):203-211. Ramey, Garey and Valerie A. Ramey (1995) Cross-country Evidence on the Link Between
Volatility and Growth. American Economic Review, 85: 1138-51. Robinson, E.A.G., ed. (1960) The Economic Consequences of the Size of Nations: Proceedings
of of A Conference Held by the International Economic Associations. MacMillan, Toronto.
Rodrik, Dani (1998) Who Needs Capital Account Convertibility? In Should the IMF Pursue
Capital-Account Convertibility? ed. Peter Kenen. Princeton Essays in International Finance, No. 207.
Romer, Paul M. (1986) Increasing Returns and Long-Run Growth. Journal of Political Economy,
94: 1002-37.
21
Scitovsky, Tibor (1960) International Trade and Economic Integration as a Means of Overcoming
the Disadvantages of a Small Nation. In The Economic Consequences of the Size of Nations, ed. E.A.G. Robinson, Proceedings of a Conference Held by the International Economic Associations. MacMillan, Toronto.
Small States Financial Forum (1987) Round Table on Foreign Investment and Commercial
Finance for Small States. Crown Agents Financial Advisory Service, London. Small States Financial Forum (1988) Round Table on Some Practical Possibilities of Financial
Co-operation Between Small States. Crown Agents Financial Advisory Service, London. Streeten, Paul (1993) The Special Problems of Small Countries. World Development, 21 (2):197-
202. Srinivasan, T.N. (1986) The Costs and Benefits of Being A Small, Remote, Island, Landlocked or
Ministate Economy. World Bank Research Observer, 1 (2):205-218. Tarshis, L. (1960) The Size of the Economy and Its Relation to Stability and Steady Progress. In
The Economic Consequences of the Size of Nations, ed. E.A.G. Robinson, Proceedings of a Conference Held by the International Economic Associations. MacMillan, Toronto.
United Nations Institute for Training and Research (1971) Small States and Territories: Status
and Problems. Arno Press, New York. UNCTAD (1997) The Vulnerability of Small Island Developing States in the Context of
Globalisation.
22
Tables and Figures
Table 1 – Small States
Population Average Per Capita(Thousands) GDP, 1985 PPP-Adjusted Dollars
ATG Antigua and Barbuda 63 5329BHR Bahrain 419 10342BHS Bahamas, The 237 11136BLZ Belize 178 3548BMU Bermuda 58 15356BRB Barbados 247 5341BWA Botswana 880 1516COM Comoros 340 632CPV Cape Verde 295 746CYP Cyprus 638 5084DJI Djibouti 344 1479FJI Fiji 602 3149GAB Gabon 777 3853GMB Gambia, The 628 803GNB Guinea-Bissau 739 644GRD Grenada 92 2632GUY Guyana 719 1630ISL Iceland 223 9689KNA St. Kitts and Nevis 42 4399LCA St. Lucia 148 3264LUX Luxembourg 358 11934MDV Maldives 201 1908MLT Malta 341 4049MUS Mauritius 916 4092QAT Qatar 384 18278REU Reunion 496 2253SLB Solomon Islands 299 1845SUR Suriname 378 2877SWZ Swaziland 556 2358SYC Seychelles 59 2214VCT St. Vincent and the Grenad 107 3312VUT Vanuatu 145 1633WSM Samoa 160 1844
23
Table 2: Development Advantages of Small States
Dependent Variable Log Real Per Capita GDP,
Average 1960-95
Under-5 Infant Mortality per 1000
Live Births
Life Expectancy at Birth,Years
OECD Member 1.169 (0.148)
-28.415 (5.723)
7.736 (1.018)
Oil Exporter 0.815 (0.178)
0.896 (12.488)
0.893 (1.513)
Small State 0.403 (0.108)
-22.887 (9.548)
4.143 (1.383)
R-squared Number of observations
0.709 157
0.634 152
0.719 153
Note: All regressions include a full set of regional dummies (Sub-Saharan Africa, Asia, Europe and Central Asia, Middle East and North Africa, and the Americas). Standard errors are White-corrected for heteroscedasticity.
24
Table 3: Productivity Advantages of Small States
Dependent Variable Log Real Per Capita GDP, Average
1960-95
Log Investment as a Share of
GDP
Average Annual Population Growth,
1960-95
OECD Member 1.122 (0.114)
0.199 (0.098)
-0.411 (0.129)
Oil Exporter 0.692 (0.151)
0.138 (0.160)
0.166 (0.092)
Small State 0.267 (0.132)
0.381 (0.107)
-0.241 (0.146)
MRW 0.389 (0.102)
R-squared Number of observations
0.761 139
0.440 139
0.701 139
Note: All regressions include a full set of regional dummies (Sub-Saharan Africa, Asia, Europe and Central Asia, Middle East and North Africa, and the Americas). Standard errors are White-corrected for heteroscedasticity.
25
Table 4: Growth in Small States
Dependent Variable Average Annual Real Per Capita GDP Growth
1960-95
Average Annual Real Per Capita GDP Growth
1960-95
OECD Member 0.007 (0.004)
0.009 (0.006)
Oil Exporter -0.014 (0.007)
-0.0004 (0.005)
Small State 0.002 (0.005)
Log of Real Per Capita GDP in First Available Year
-0.017 (0.004)
Average Secondary School Enrollment Rate, 1960-95
0.0003 (0.0001)
Average Share of trade in GDP, 1960-95
0.012 (0.003)
Standard Deviation of Annual GDP Growth, 1960-95
-0.179 (0.082)
R-squared Number of observations
0.195 154
0.535 130
26
Table 5: Growth Advantages and Disadvantages of Small States
Dependent Variable Share of Trade in GDP, Average
1960-95
Standard Deviation of Annual GDP
Growth, 1960-95
Secondary School Enrollment Rate
Average 1960-95, Percent
OECD Member -0.179 (0.078)
-0.026 (0.004)
27.705 (5.844)
Oil Exporter 0.145 (0.095)
0.016 (0.005)
6.587 (5.821)
Small State 0.539 (0.071)
0.014 (0.003)
8.344 (4.440)
R-squared Number of observations
0.286 158
0.468 154
0.717 136
Note: All regressions include a full set of regional dummies (Sub-Saharan Africa, Asia, Europe and Central Asia, Middle East and North Africa, and the Americas). Standard errors are White-corrected for heteroscedasticity.
27
Table 6: Volatility in Small States
Dependent Variable Standard
Deviation of Annual Terms of Trade Growth,
1960-95
Standard Deviation of Unweighted
Annual Terms of Trade Growth,
1960-95
Standard Deviation of Annual Per Capita Real
GDP Growth, 1960-95
Commodity Exporter 0.007
(0.005) 0.023
(0.013)
0.007 (0.004)
Oil Exporter 0.023 (0.005)
0.074 (0.024)
0.012 (0.006)
Small State 0.013 (0.005)
-0.011 (0.011)
0.021 (0.005)
Terms of Trade Volatility
0.250 (0.105)
R-squared Number of observations
0.490 114
0.474 114
0.535 114
28
Table 7: Risk Sharing in Small States
Dependent Variable Correlation of
Real Per Capita GDP Growth with OECD
Average Real Per Capita GDP
Growth, 1960-95
Fraction of Years over
1960-95 during which
capital controls were
in place
Average Capital Inflows plus
Capital Outflows as a
fraction of GDP, 1960-95
OECD Member 0.082 (0.069)
-0.149 (0.100)
0.016 (0.029)
Oil Exporter -0.077 (0.065)
-0.097 (0.116)
-0.027 (0.016)
Small State 0.013 (0.054)
0.026 (0.080)
0.027 (0.013)
Log real GDP per capita, Average 1960-95
0.119 (0.029)
-0.170 (0.050)
0.024 (0.013)
Commodity Exporter 0.026 (0.058)
0.005 (0.063)
-0.014 (0.011)
R-squared Number of observations
0.345 155
0.278 139
0.260 132
29
Figure 1: Per capita income and population size, averages 1960-95
AGO
ARG
ARM
ATG
AUSAUT
BDI
BEL
BEN
BFA
BGD
BGR
BHRBHS
BLZ
BMU
BOL
BRA
BRB
BWA
CAF
CANCHE
CHL
CHN
CIV
CMR
COG
COL
COMCPV
CRI CSK
CYP
CZEDDR
DEU
DJI
DNK
DOMDZAECU
EGY
ESP
ETH
FIN
FJI
FRA
GAB
GBR
GEO
GHA
GINGMB
GNB
GRC
GRDGTM
GUY
HKG
HND
HTI
HUN
IDN
IND
IRL
IRNIRQ
ISL
ISRITA
JAMJOR
JPN
KEN
KNAKOR
KWT
LAO
LBR
LCA
LKA
LSO
LUX
LVA
MAR
MDG
MDV
MEX
MLI
MLT
MMR
MNG
MOZMRT
MUS
MWI
MYSNAM
NER
NGA
NIC
NLDNOR
NPL
NZL
OMN
PAK
PAN PER
PHLPNG
POL
PRI
PRT
PRY
QAT
REU
ROM
RUS
RWA
SAU
SDN
SEN
SGP
SLB
SLE
SLV
SOM
SUN
SUR
SVK
SWE
SWZSYC
SYR
TCDTGO
THA
TTO
TUN
TUR
TWN
TZA
UGA
URY
USA
VCT
VEN
VUTWSM
YEM
YUG
ZAF
ZAR
ZMBZWE
100
1000
10000
100000
1000 1000000 1000000000
Population
Per c
apita
inco
me
30
Figure 2: Unexplained income level and population size
-0.15
-0.1
-0.05
0
0.05
0.1
0.15
0.2
0.25
0.3
1 4 9 22 935
Population quintiles less than or equal to (in millions):
Small states
31
1 All of the results reported in the paper are qualitatively similar if we use the logarithm of population rather than an indicator variable for small states. 2 The model of Alesina and Spolaore (1997) mentioned earlier has the prediction that openness reduces the costs of forming small states, since countries will not need to produce domestically the entire basket of goods they wish to consume. 3 An interesting historical footnote is that the greater volatility of small states has not always been accepted. Tarshis (1960) finds little evidence of a relationship between the coefficient of variation of per capita income and size across US states, and poses this as a puzzle. 4 This view of small states dates back at least to Scitovsky (1960). Dolman (1985) goes so far as to suggest that many small island states would be better off reverting to autarkic subsistence economies. 5 One characteristic of small states that we do not examine is geographical isolation. It is difficult to test the effect of this, because some of the literature indicates that being geographically isolated because you are landlocked is harmful to growth, while other strands of the literature stress “islandness”. Since virtually all small states are either islands or landlocked, it would be hard to separate out the effects of geographical isolation, however measured. 6 Of course, to the extent that scale economies are important at the industry level, the potential for such diversification might be limited in small states. 7 As reported in the International Monetary Fund’s Annual Report on Exchange Arrangements and Exchange Restrictions. The disadvantages of this measure are well-known. First, it captures only the presence, and not the intensity of controls. Second, it captures only controls on residents, and not on non-residents, although there is some presumption that these two types of controls are correlated across countries.
Figure 3: Average per capita growth and population size 1960-95