Small States, Small Problems? Income, Growth, and Volatility in Small States WILLIAM EASTERLY and AART KRAAY * The World Bank, Washington, DC, USA Summary. — Small states have attracted a large amount of research. In this paper we test whether small states are any dierent from other states in terms of their income, growth, and volatility outcomes. We find that, controlling for location, small states have higher per capita GDP than other states. This income advantage is largely due to a productivity advantage, constituting evidence against the idea that small states suer from an inability to exploit increasing returns to scale. Small states also do not have dierent per capita growth rates than other states. Small states do have greater volatility of annual growth rates, which is in part due to their greater volatility of terms of trade shocks. This terms of trade-based volatility is in turn due to small statesÕ greater openness. Their greater openness on balance has, however, a positive net payo for growth. The one dierential policy measure that might be relevant for small states is to further open up to international capital markets in order to better diversify risk, but the benefits of even that are still unresolved in the literature. We conclude that small states are no dierent from large states, and so should receive the same policy advice that large states do. Ó 2000 Elsevier Science Ltd. All rights reserved. Key words — The Caribbean, Pacific Islands, growth, volatility, trade, small states Smallness is neither a necessary nor sucient condi- tion for slow economic development T.N. Srinivasan (1986) Economic storm clouds are gathering over paradise and the outlook is undeniably gloomy A.J. Dolman (1985) 1. INTRODUCTION Do small states suer from their smallness? There are good theoretical reasons to believe that they do. The provision of public services may be subject to indivisibilities that lead to increasing returns to scale (Alesina & Spoalare, 1997), especially fiscal institutions (Easterly & Rebelo, 1993) and defense (Kuznets, 1960; Harden, 1985). Many theories of economic growth suggest increasing returns to scale in the private economy as well (Romer, 1986; Barro & Sala-i-Martin, 1995; Aghion & Howitt, 1998), which may be dicult to realize in small states. Small economies may also be at a disadvantage because their size prevents them from diversi- fying into a wide range of activities, making them more vulnerable to terms of trade shocks than large states (Commonwealth Consultative Group, 1997), Briguglio, 1995; Armstrong & Read, 1998). Many small states suer from poor location in that they are remote and/or landlocked, and many are located in regions prone to hurricanes and volcanic activity (Srinivasan, 1986). Public ocials in small states may be much more likely to be subjected to conflicting pressures (Farrugia, 1993), and it may be dicult to recruit a high-quality civil service given the limited pool of candidates in small states (Streeten, 1993). The trend toward trade multilateralism may put small states at a disadvantage because they presently benefit World Development Vol. 28, No. 11, pp. 2013–2027, 2000 Ó 2000 Elsevier Science Ltd. All rights reserved Printed in Great Britain 0305-750X/00/$ - see front matter PII: S0305-750X(00)00068-1 www.elsevier.com/locate/worlddev * The views expressed here are the authorsÕ and do not reflect those of the World Bank, its Executive Directors, or the countries they represent. We would like to thank two anonymous referees, Edgardo Favaro, and seminar participants (especially our discussant Byron Blake) in the Joint Commonwealth Secretariat/World Bank Task Force Conference on Small States in St. Lucia in February 1999 for useful discussions. Final revision accepted: 7 February 2000. 2013
Transcript
Small States, Small Problems? Income, Growth, and
Volatility in Small States
WILLIAM EASTERLY and AART KRAAY *
The World Bank, Washington, DC, USA
Summary. Ð Small states have attracted a large amount of research. In this paper we test whethersmall states are any di�erent from other states in terms of their income, growth, and volatilityoutcomes. We ®nd that, controlling for location, small states have higher per capita GDP thanother states. This income advantage is largely due to a productivity advantage, constitutingevidence against the idea that small states su�er from an inability to exploit increasing returns toscale. Small states also do not have di�erent per capita growth rates than other states. Small statesdo have greater volatility of annual growth rates, which is in part due to their greater volatility ofterms of trade shocks. This terms of trade-based volatility is in turn due to small statesÕ greateropenness. Their greater openness on balance has, however, a positive net payo� for growth. Theone di�erential policy measure that might be relevant for small states is to further open up tointernational capital markets in order to better diversify risk, but the bene®ts of even that are stillunresolved in the literature. We conclude that small states are no di�erent from large states, and soshould receive the same policy advice that large states do. Ó 2000 Elsevier Science Ltd. All rightsreserved.
Key words Ð The Caribbean, Paci®c Islands, growth, volatility, trade, small states
Smallness is neither a necessary nor su�cient condi-tion for slow economic development
T.N. Srinivasan (1986)
Economic storm clouds are gathering over paradiseand the outlook is undeniably gloomy
A.J. Dolman (1985)
1. INTRODUCTION
Do small states su�er from their smallness?There are good theoretical reasons to believethat they do. The provision of public servicesmay be subject to indivisibilities that lead toincreasing returns to scale (Alesina & Spoalare,1997), especially ®scal institutions (Easterly &Rebelo, 1993) and defense (Kuznets, 1960;Harden, 1985). Many theories of economicgrowth suggest increasing returns to scale in theprivate economy as well (Romer, 1986; Barro &Sala-i-Martin, 1995; Aghion & Howitt, 1998),which may be di�cult to realize in small states.Small economies may also be at a disadvantagebecause their size prevents them from diversi-
fying into a wide range of activities, makingthem more vulnerable to terms of trade shocksthan large states (Commonwealth ConsultativeGroup, 1997), Briguglio, 1995; Armstrong &Read, 1998). Many small states su�er frompoor location in that they are remote and/orlandlocked, and many are located in regionsprone to hurricanes and volcanic activity(Srinivasan, 1986). Public o�cials in smallstates may be much more likely to be subjectedto con¯icting pressures (Farrugia, 1993), and itmay be di�cult to recruit a high-quality civilservice given the limited pool of candidates insmall states (Streeten, 1993). The trend towardtrade multilateralism may put small states at adisadvantage because they presently bene®t
World Development Vol. 28, No. 11, pp. 2013±2027, 2000Ó 2000 Elsevier Science Ltd. All rights reserved
Printed in Great Britain0305-750X/00/$ - see front matter
* The views expressed here are the authorsÕ and do not
re¯ect those of the World Bank, its Executive Directors,
or the countries they represent. We would like to thank
two anonymous referees, Edgardo Favaro, and seminar
participants (especially our discussant Byron Blake) in
the Joint Commonwealth Secretariat/World Bank Task
Force Conference on Small States in St. Lucia in
February 1999 for useful discussions. Final revision
accepted: 7 February 2000.
2013
from many bilateral trade concessions(Armstrong & Read, 1998).
These potential di�culties facing small stateshave not been lost on policymakers or aca-demics. Numerous conferences and seminarson the special di�culties of small states havebeen convened over the past 40 years (Robin-son, 1960; Benedict, 1967; Dobozi, Kellen, &Matejka, 1982; Commonwealth ConsultativeGroup, 1985, 1997; Small States FinancialForum, 1987, 1988; Kaminarides, Briguglio, &Hoogendonk, 1989). International organiza-tions such as the United Nations havecommissioned studies on the problemsconfronting small states for many years (UnitedNations, 1971; Doumenge, 1983, UNCTAD,1997) and the United Nations has formallyrecognized the special di�culties of small statesin a resolution to that e�ect (Briguglio, 1995).Titles of papers on small states (see our bibli-ography) frequently feature ominous terms andphrases such as ``Problems,'' ``Vulnerability,''``Small is Dangerous,'' and even (twice) ``Par-adise Lost.'' (Cashin & Loayza, 1995.)
In this paper, we look for empirical evidenceof alleged disadvantages of size by examiningsmall states with population one million or less.If small size is a disadvantage, then these statesmust su�er with a vengeance. In particular, wewould expect that small states must on averagebe less developed and grow less rapidly thanlarger states. We test this hypothesis using alarge cross-country dataset including manysmall states. In light of the grim predictions oftheory, the picture of small states which emer-ges from this analysis is somewhat surprising.After controlling for a range of factors, we ®ndthat small states have on average higher incomeand productivity levels than large states, andgrow no more slowly than large states. Percapita GDP growth rates are more volatile insmall states, due to their much greater exposureto international trade and ¯uctuations in theirterms of trade. But, any growth disadvantagesof this greater volatility are more thanoutweighed by the growth bene®ts of tradeopenness reaped by small states by virtue oftheir necessarily large trade volumes. Finally,small states are well positioned to take advan-tage of opportunities for international risksharing, since the correlation of economic¯uctuations in small states with the worldbusiness cycle is surprisingly low.
These results contribute evidence in supportof the growing view in the literature that smallsize might not be a disadvantage after all.
Kuznets (1960) notes that small states also haveadvantages: primarily that many are lucky tohave good natural resources and have a smalland more cohesive populations which allowsthem to adapt better to change. Srinivasan(1986) and Streeten (1993) argue withoutsystematic empirical evidence that small mayalso be beautiful. Using a sample of 48 coun-tries Milner and Westaway (1993) fail to ®ndevidence that the e�ect of a number of growthdeterminants varies with country size.Armstrong, de Kervenoael, Li and Read (1998)use cross-sectional regressions covering a largenumber of small states and independent regionsto argue that population size does not signi®-cantly a�ect growth, controlling for initialincome and regional e�ects.
The remainder of this paper proceeds asfollows. In the next section we document thatsmall states are richer and have higherproductivity levels than large states. In Section3 we observe that small states su�er no obviousgrowth rate disadvantage, and attribute this toa number of o�setting advantages and disad-vantages of small states. In Section 4 wedocument that although terms of trade vola-tility contributes signi®cantly to the greatervolatility of growth in small states, this is notthe whole storyÐa signi®cant small state e�ecton volatility remains after we control for termsof trade variability. In Section 5 we note thatsmall states are relatively well positioned totake advantage of opportunities to diversifyaway their special risks since they currently arenot particularly ®nancially open and the shocksthey receive are relatively uncorrelated withthose experienced by the rest of the world.Section 6 o�ers concluding remarks.
2. SMALL STATES AND PER CAPITAINCOME LEVELS
In this paper, we consider a large cross-sec-tion of 157 countries for which at least 10 yearsof annual data on per capita GDP adjusted fordi�erences in purchasing power parity areavailable. Of these, 33 are small states de®nedas having an average population during 1960±95 of less than one million. These countries arelisted in Table 1, and range in size from tiny St.Kitts and Nevis with population of 42,000 toMauritius with 912,000. The income range issimilarly wide, from very poor African coun-tries such as Guineau-Bissau and Comoroswith real PPP-adjusted per capita GDPs
WORLD DEVELOPMENT2014
around $600 to wealthy oil-exporting countriessuch as Qatar with per capita GDP of over$18,000. Although our sample is quite large, itis worth noting that it is not comprehensive butrather is constrained by data availability. Of the212 states and territories listed in the WorldBankÕs databases, 55 have populations less thanone million, but we have only have interna-tionally-comparable per capita GDP data for33 of these small states. While it is not clear apriori what biases this might introduce (bothrich small states such as Liechtenstein and poorsmall states such as Equatorial Guinea areexcluded from our sample), we do note thatsome caution is in order before generalizing ourresults to all small states. In subsequentregressions the sample is even smaller, re¯ectingthe nonavailability of variables other than percapita incomes in these regressions. Details on
variable de®nitions and data availability areprovided in the Appendix A.
If small states su�er from the disadvantagesof smallness, they should be poorer on averagethan larger states. What do we actually ®nd? InFigure 1, we show that, without controlling forany other characteristic, small states have thesame range of per capita incomes as the rest ofthe countries in the world. Moreover, if wecontrol for the location by continent of allcountries, whether they are oil producers, andwhether they belong to the OECD, then smallstates are actually signi®cantly richer than otherstates. We show this in the ®rst column ofTable 2, where we regress the logarithm of realper capita GDP at PPP on these dummy vari-ables, as well as a dummy variable for smallstates. The signi®cant coe�cient on the smallstates dummy indicates that they are on
Table 1. Small states
Population(Thousands)
Average per capitaGEP, 1985 PPP-adjusted dollars
ATG Antigua and Barbuda 63 5329BHR Bahrain 419 10342BHS Bahamas, The 237 11136BLZ Belize 178 3548BMU Barbados 58 15356BRB Bermuda 247 5341BWA Barbados 880 1516COM Comoros 340 632CPV Cape Verde 295 746CYP Cyprus 638 5084DJI Djibouti 344 1479FJI Fiji 602 3149GAB Gabon 777 3853GMB Gambia, The 628 803GNB Guinea-Bissau 739 644GRD Grenada 92 2632GUY Guyana 719 1630ISL Iceland 223 9689KNA St. Kitts and Nevis 42 4399LCA St. Lucia 148 3264LUX Luxembourg 358 11934MDV Maldives 201 1908MLT Malta 341 4049MUS Mauritius 916 4092QAT Qatar 384 18278REU Reunion 496 2253SLB Solomon Islands 299 1845SUR Suriname 378 2877SWZ Swaziland 556 2358SYC Seychelles 59 2214VCT St. Vincent and the Grenad 107 3312VUT Vanuatu 145 1633WSM Samoa 160 1844
SMALL STATES, SMALL PROBLEMS? 2015
Figure 1. Per capita income and population size, averages 1960±95.
Table 2. Development advantages of small statesa
Dependent variable Log real per capitaGDP, average
1960±95
Under-5 infantmortality per 1000
live births
Life expectancy atbirth, years
OECD member 1.169 )28.415 7.736(0.148) (5.723) (1.018)
Small state 0.403 )22.887 4.143(0.108) (9.548) (1.383)
R2 0.709 0.634 0.719Number of observations 157 152 153
a Note: All regressions include a full set of regional dummies (sub-Saharan Africa, Asia, Europe and Central Asia,Middle East and North Africa, and the Americas). Standard errors are White-corrected for heteroskedasticity.
WORLD DEVELOPMENT2016
average 50% (� exp(0.403) ) 1) richer thantheir regional neighbours. We note that thisresult does not re¯ect the obvious outliers in thesample, since the oil exporting countries Qatarand Bahrain are picked up by the oil exporterdummy, and Luxembourg and Iceland arepicked up by the OECD member dummy. Evenif we exclude two other particularly wealthysmall states not captured by these dummyvariables (Bermuda and Bahamas), we still ®ndthat small states are nearly 40% richer thanother states.
These results do not appear to be sensitive tothe population threshold at which we dividecountries into small and large states. Figure 2
plots the residuals from this regression(excluding the small states variable) by quintileof population, and we see the very strongincome e�ect in the bottom two populationquintiles. 1 We also note that the favorableperformance of small states carries over toother quality of life indicators. For example, ifwe in turn use under-®ve infant mortality andlife expectancy at birth as the dependent vari-able in the above regression, we ®nd that infantmortality is signi®cantly lower in small statesby 22 per thousand, while life expectancy isabout four years higher (columns 2 and 3 ofTable 2). Although this analysis does not tell uswhy small states are so much richer than their
Figure 2. Unexplained income level and population size.
SMALL STATES, SMALL PROBLEMS? 2017
regional neighbors and have better humandevelopment indicators, it does cast doubt onthe often-heard arguments that small statessu�er from a development disadvantage.
We next ask whether small states are richerthan large states because they save more orbecause they have higher productivity levels.Following Mankiw, Romer and Weil (1992),we consider the prediction of the neoclassicalSolow growth model that the steady-state levelof output per person is given by:
Y =L � A�s=�x� d� n��a=�1ÿa�; �1�where Y/L is output per person, A is thelevel of labor-augmenting productivity, s theinvestment to GDP ratio, x the rate of labor-augmenting productivity growth, d the depre-ciation, n the population growth, and a is theshare of capital income in GDP. We assume aproductivity growth of 2% and a depreciationrate of 7%. We take logs of both sides andregress the log of output per person on thesame dummies as above (capturing continentaland other productivity di�erences) and the logof the second multiplicative term in (1):
We call this second term MRW, and report theresults of this speci®cation in the ®rst column ofTable 3. Comparing the coe�cient on the smallstates dummy with that in the ®rst column ofTable 2, we ®nd that small statesÕ productivityadvantage accounts for about two-thirds oftheir income per capita advantage (i.e. 0.267/0.403). This evidence is inconsistent with thecommonly-held idea that small states su�erfrom productivity disadvantages due to theirinability to exploit increasing returns to scale.We also note that our speci®cation di�ers fromMankiw et al. (1992) in that we allow theaverage level of productivity to vary acrossregions, and these di�erences are statisticallysigni®cant (remember that the regressionsinclude a full set of regional dummies). Once weallow the productivity level to vary, the coe�-cient on MRW implies a capital share of 0.28Ðwhich is in line with most estimates fromnational income accounting.
It is interesting to decompose the MRW intoits numerator and denominator from Eqn. (1).We do this in the second and third columns ofTable 3, where we regress the log investmentrate and the population growth rate on the
same set of dummy variables as before. We ®ndthat that small states have signi®cantly higherinvestment rates but not signi®cantly lowerpopulation growth rates. This suggests thatsome portion of the previously-unexplainedincome di�erential between small states andlarge states can be explained by the formerÕshigher investment rates.
We conclude with two important caveatsregarding these results on the productivity andinvestment advantages of small states. First, theregressions in Table 3 do not control fordi�erences across countries in human capital,since it is di�cult to adequately measure savingin the form of human capital. As a result, theproductivity advantage of small states to someextent re¯ects their human capital di�erencesfrom the rest of the world. This is consistentwith the strand of the literature that argues thatsmall states need to rely on imported technol-ogy and high quality human capital tocompensate for their lack of natural resources.Briguglio (1995) suggests the importance ofregional technical cooperation; Milner andWestaway (1993) ®nd that small states have aweak disadvantage in agricultural technologicalcatch-up but a weak advantage in non-agri-cultural technological catch-up; and Armstrongand Read (1998) suggest that advances intransport and communications technologyhave helped o�set ``smallness'' and ``remote-ness'').
Second, we should take with more than agrain of salt the result that investment accountsfor some of the income advantage of smallstates. The signi®cance of the MRW term inTable 3 may re¯ect reverse causalityÐricherstates can a�ord to invest more and are usuallythought to choose lower population growththan poor states. Or it may re¯ect an omittedthird factor, like incentive policies that a�ectboth investment and income. It is di�cult tocontrol adequately for these possibilities.Instead, we simply note that they are likely toresult in an overstatement of the contributionof investment to the income advantage of smallstates.
3. MICRO STATES AND MACROGROWTH
Even if small states do not have a disadvan-tage in terms of their income levels, they mightgrow more slowly over time for variousreasons. Several endogenous growth theories
WORLD DEVELOPMENT2018
predict that growth rates will be positivelycorrelated with size due to scale e�ects. As wediscuss below, small states exhibit greateroutput volatility, which has been shown
empirically to have adverse e�ects on growth(Ramey & Ramey, 1995). What do the datasay? In Figure 3 we show that small states havethe same range of growth experiences as other
Figure 3. Average per capita growth and population size 1960±95.
Table 3. Productivity advantages of small statesa
Dependent variable Log real per capitaGDP, average 1960±95
Log investment as ashare of GDP
Average annual popu-lation growth, 1960±95
OECD member 1.122 0.199 )0.411(0.114) (0.098) (0.129)
Small state 0.267 0.381 )0.241(0.132) (0.107) (0.146)
MRW 0.389(0.102)
R2 0.761 0.440 0.701Number ofobservations
139 139 139
a Note: All regressions include a full set of regional dummies (sub-Saharan Africa, Asia, Europe and Central Asia,Middle East and North Africa, and the Americas). Standard errors are White-corrected for heteroskedasticity.
SMALL STATES, SMALL PROBLEMS? 2019
states, suggesting that there is no obvious scalee�ect for growth rates that is related to popu-lation size. There is also no growth di�erencefor small states after controlling for continentallocation, oil, and OECD dummies, as shown inthe ®rst column of Table 4 where we regressgrowth on these dummies and the small statesdummy.
Why do small states not su�er any apparentgrowth disadvantages due to their small size?To answer this question, we consider a parsi-monious cross-country growth regressionwhich captures two of the factors prominent inthe small states debate: openness to interna-tional trade (measured as the share of importsand exports in GDP), and volatility (measuredas the standard deviation of annual growthrates within each country). We also includeinitial income to capture convergence e�ects,and secondary school enrollment rates. Theresults are shown in the second column ofTable 4. All of the variables are signi®cant withthe expected sign. The negative coe�cient oninitial income shows that there is conditionalconvergence, secondary enrollment rates andtrade openness are positively correlated withgrowth, and growth rate volatility has a nega-tive e�ect on growth.
This regression framework provides someuseful clues as to why the small state dummy isnot signi®cant in the basic regression in the ®rstcolumn of Table 4. In particular, we can seefrom this regression that small states will haveseveral o�setting advantages and disadvan-
tages. We have already seen that they are richerthan other countries (relative to regional aver-ages) and hence will have slower growth thanaverage by the conditional convergence e�ect.They have slightly higher secondary enrollmentrates, which would give them higher growth.Most important, as we document below, smallstates tend to have much higher trade shares(which is good for growth), o�set by muchhigher volatility of growth rates (which is badfor growth). 2 As a result, the insigni®cance ofthe small state dummy in the growth regressionsuggests that the negative e�ects of high initialincome and high volatility are roughly o�set bythe positive e�ects of trade openness and bettereducational attainment.
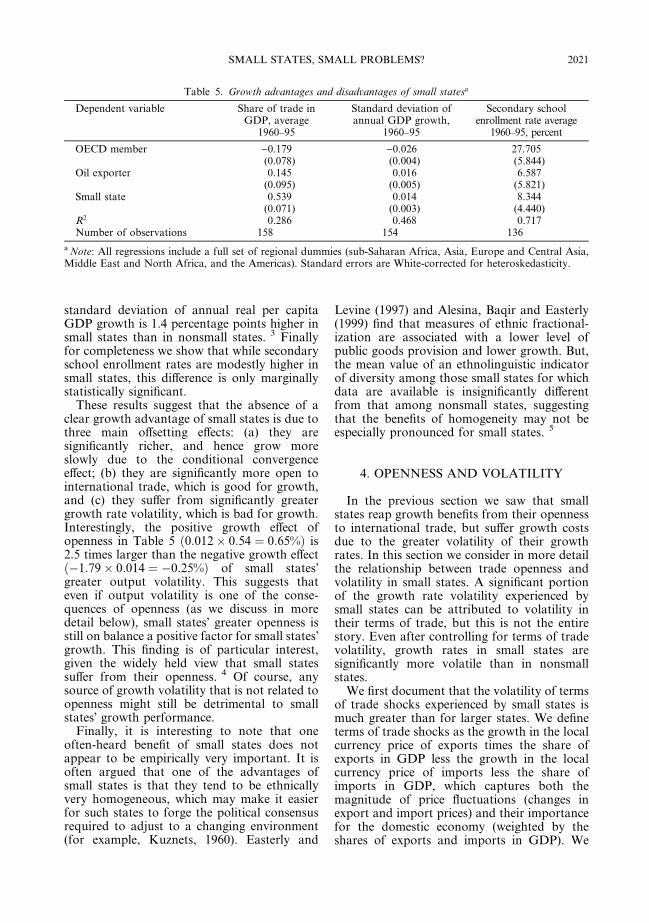
In order to document the magnitude of theseo�setting e�ects, we ®rst need to know howdi�erent small states are from nonsmall statesin terms of their growth determinants. Wedocument the well-known fact that small statestypically have much higher trade ratios thanlarger states in the ®rst column of Table 5,where we regress this variable on the same setof dummy variables as before, as well as thesmall states dummy. The consequences foropenness of being a small state are trulyremarkable. Small states have a ratio of tradeto GDP that is 54 percentage points (1.2 stan-dard deviations) higher than the average econ-omy controlling for continent dummies!Second, real per capita GDP growth rates tendto be much more volatile in small states. Thesecond column of Table 5 shows that the
Table 4. Growth in small statesa
Dependent variable Average annual real per capitaGDP growth 1960±95
Average annual real per capitaGDP growth 1960±95
OECD member 0.007 0.009(0.004) (0.006)
Oil exporter )0.014 )0.0004(0.007) (0.005)
Small state 0.002(0.005)
Log of real per capita GDP in®rst available year
)0.017(0.004)
Average secondary schoolenrollment rate, 1960±95
0.0003(0.0001)
Average share of trade in GDP,1960±95
0.012(0.003)
Standard deviation of annualGDP growth, 1960±95
)0.179(0.082)
R2 0.195 0.535Number of observations 154 130
a Note: All regressions include a full set of regional dummies (sub-Saharan Africa, Asia, Europe and Central Asia,Middle East and North Africa, and the Americas). Standard errors are White-corrected for heteroskedasticity.
WORLD DEVELOPMENT2020
standard deviation of annual real per capitaGDP growth is 1.4 percentage points higher insmall states than in nonsmall states. 3 Finallyfor completeness we show that while secondaryschool enrollment rates are modestly higher insmall states, this di�erence is only marginallystatistically signi®cant.
These results suggest that the absence of aclear growth advantage of small states is due tothree main o�setting e�ects: (a) they aresigni®cantly richer, and hence grow moreslowly due to the conditional convergencee�ect; (b) they are signi®cantly more open tointernational trade, which is good for growth,and (c) they su�er from signi®cantly greatergrowth rate volatility, which is bad for growth.Interestingly, the positive growth e�ect ofopenness in Table 5 �0:012� 0:54 � 0:65%� is2.5 times larger than the negative growth e�ect�ÿ1:79� 0:014 � ÿ0:25%� of small statesÕgreater output volatility. This suggests thateven if output volatility is one of the conse-quences of openness (as we discuss in moredetail below), small statesÕ greater openness isstill on balance a positive factor for small statesÕgrowth. This ®nding is of particular interest,given the widely held view that small statessu�er from their openness. 4 Of course, anysource of growth volatility that is not related toopenness might still be detrimental to smallstatesÕ growth performance.
Finally, it is interesting to note that oneoften-heard bene®t of small states does notappear to be empirically very important. It isoften argued that one of the advantages ofsmall states is that they tend to be ethnicallyvery homogeneous, which may make it easierfor such states to forge the political consensusrequired to adjust to a changing environment(for example, Kuznets, 1960). Easterly and
Levine (1997) and Alesina, Baqir and Easterly(1999) ®nd that measures of ethnic fractional-ization are associated with a lower level ofpublic goods provision and lower growth. But,the mean value of an ethnolinguistic indicatorof diversity among those small states for whichdata are available is insigni®cantly di�erentfrom that among nonsmall states, suggestingthat the bene®ts of homogeneity may not beespecially pronounced for small states. 5
4. OPENNESS AND VOLATILITY
In the previous section we saw that smallstates reap growth bene®ts from their opennessto international trade, but su�er growth costsdue to the greater volatility of their growthrates. In this section we consider in more detailthe relationship between trade openness andvolatility in small states. A signi®cant portionof the growth rate volatility experienced bysmall states can be attributed to volatility intheir terms of trade, but this is not the entirestory. Even after controlling for terms of tradevolatility, growth rates in small states aresigni®cantly more volatile than in nonsmallstates.
We ®rst document that the volatility of termsof trade shocks experienced by small states ismuch greater than for larger states. We de®neterms of trade shocks as the growth in the localcurrency price of exports times the share ofexports in GDP less the growth in the localcurrency price of imports less the share ofimports in GDP, which captures both themagnitude of price ¯uctuations (changes inexport and import prices) and their importancefor the domestic economy (weighted by theshares of exports and imports in GDP). We
Table 5. Growth advantages and disadvantages of small statesa
Dependent variable Share of trade inGDP, average
1960±95
Standard deviation ofannual GDP growth,
1960±95
Secondary schoolenrollment rate average
1960±95, percent
OECD member )0.179 )0.026 27.705(0.078) (0.004) (5.844)
Small state 0.539 0.014 8.344(0.071) (0.003) (4.440)
R2 0.286 0.468 0.717Number of observations 158 154 136
a Note: All regressions include a full set of regional dummies (sub-Saharan Africa, Asia, Europe and Central Asia,Middle East and North Africa, and the Americas). Standard errors are White-corrected for heteroskedasticity.
SMALL STATES, SMALL PROBLEMS? 2021
then regress the standard deviation of thismeasure of terms of trade shocks on the sameset of regional dummies as before, dummyvariables to capture oil exporters andcommodity exporters who are more likely tosu�er extreme ¯uctuations in their terms oftrade, and the small state dummy. The resultsare shown in the ®rst column of Table 6. We®nd that there is a highly signi®cant small statee�ect, with the standard deviation of terms oftrade shocks larger by 0.013 (or about one-third of one standard deviation of the depen-dent variable) in small states.
This terms of trade volatility might be due totwo factors. First, we have already seen that theshare of trade in GDP is especially large insmall states, and this may contribute to themagnitude of our measure of terms of tradeshocks (since it weights changes in import andexport prices by the shares of imports andexports in GDP). Second, small statesÕ exportsare likely to be more specialized than those oflarge states, both in terms of products exportedand in terms of export markets (Kuznets, 1960;Armstrong & Read, 1998). As a result, theaverage prices of their exports and importsmight be more volatile than in countries withmore diversi®ed trade patterns. The distinctionbetween these two factors is important becausethere is little that small states can do abouttheir overall trade volumesÐautarky is simplynot an option for small states that produce amuch narrower range of goods and servicesthan they consume, and moreover we havealready documented the substantial growthbene®ts accruing to small states due to theiropenness. If in contrast the greater volatility of
growth is due to excessive reliance on a fewexport products and a few export markets, thenpolicies designed to help diversify exports mayhelp to dampen economic ¯uctuations. 6
We can get a rough idea of the relativeimportance of these two factors by rede®ningthe terms of trade shock as the unweighteddi�erence between the growth in export pricesand the growth in import prices. When we usethis alternative measure of terms of tradeshocks as the dependent variable in the secondcolumn of Table 6, we ®nd that the small statesdummy is negative and insigni®cant. That is,the volatility of changes in the price of exportsrelative to imports is if anything lower in smallstates relative to larger states. Although this isnot conclusive evidence, it does cast doubt onthe notion that small states are especiallyvulnerable to external shocks simply becausetheir international trade is more specialized.Rather, the greater volatility of terms of tradeshocks in small states is primarily due to theirunavoidably large trade shares.
Finally, it is worth noting that greater vola-tility of growth in small states is not solely dueto their greater susceptibility to terms of tradeshocks. To illustrate this point, we re-estimatethe growth rate volatility regression in thesecond column of Table 4, adding the volatilityof the terms of trade as an explanatory vari-able. The results are shown in the last columnof Table 6. We ®nd that the small state dummyremains signi®cant even after controlling forthe e�ect of greater terms of trade volatility onthe volatility of overall growth. This indicatesthat a signi®cant portion of the volatility ofoutput in small states is unrelated to their
Table 6. Volatility in small statesa
Dependent variable Standard deviation ofannual terms of trade
growth, 1960±95
Standard deviation ofunweighted annual
terms of trade growth,1960±95
Standard deviation ofannual per capita realGDP growth, 1960±95
Small state 0.013 )0.011 0.021(0.005) (0.011) (0.005)
Terms of trade 0.250Volatility (0.105)R2 0.490 0.474 0.535Number ofobservations
114 114 114
a Note: All regressions include a full set of regional dummies (sub-Saharan Africa, Asia, Europe and Central Asia,Middle East and North Africa, and the Americas). Standard errors are White-corrected for heteroskedasticity.
WORLD DEVELOPMENT2022
exposure to international trade. This additionalvolatility may be due to several factors. Manyof the small states in our sample are located inareas prone to natural disasters such as hurri-canes, and the higher growth volatility in smallstates may simply re¯ect the devastating e�ectof these natural forces. It is also possible,however, that some of this observed volatilityre¯ects di�culties in measuring per capitaincomes, which may be particularly acute insmall states where statistical institutions may beweaker than average.
5. OPPORTUNITIES FORDIVERSIFICATION
In the previous section we have seen thatsmall states experience much more volatilegrowth rates than nonsmall states. This in partre¯ects their greater vulnerability to terms oftrade shocks, and perhaps also the tendency ofmany small states to su�er heavily from naturaldisasters. In this section we brie¯y consider thepotential of small states to mitigate the adversee�ects of this largely unavoidable volatility bysharing risks with the rest of the world.
One of the potential bene®ts of ®nancialopenness is that it allows countries to sharerisks with the rest of the world, by holdingclaims on assets located outside their borderswhose returns are not perfectly correlated withreturns to domestic assets. The magnitude ofthese bene®ts depends on how volatile are
shocks to the domestic economy, and the extentto which they are uncorrelated with shocksabroad. Small states are particularly well situ-ated to bene®t from such risk sharing arrange-ments, for two reasons. First, small states su�erlarge shocks, as documented in Section 4.Second, in contrast to the often-heard view thatsmall states are particularly susceptible tocyclical ¯uctuations abroad, we ®nd that theshocks experienced by small states are notunusually correlated with the world businesscycle. We illustrate this point in the ®rst columnof Table 7, where we regresses the correlation ofper capita GDP growth in a country withOECD average real per capita GDP growth onthe same set of dummies as before, as well as thelogarithm of average per capita GDP (tocapture the stylized fact documented by Kraayand Ventura (1998) that business cycles inpoorer countries tend to be less correlated withthe world average cycle), and a small statedummy. The small state dummy is insigni®cant,suggesting that small states are in fact notunusually correlated with the OECD cycle. It isimportant to note, however, that growth ratesin neighboring small states may be highlycorrelated, especially to the extent that theirgrowth rate volatility re¯ects natural disasterssuch as hurricanes. This suggests that regionalarrangements to share risk among small stateswill be much less valuable than pooling riskswith a wider range of countries.
Despite the potential bene®ts of risk sharingthrough participation in international ®nancial
Table 7. Risk sharing in small statesa
Dependent variable Correlation of real percapita GDP growthwith OECD averagereal per capita GDP
growth, 1960±95
Fraction of years over1960±95 during which
capital controls were inplace
Average capital in¯owsplus capital out¯ows as
a fraction of GDP,1960±95
OECD member 0.082 )0.149 0.016(0.069) (0.100) (0.029)
a Note: All regressions include a full set of regional dummies (sub-Saharan Africa, Asia, Europe and Central Asia,Middle East and North Africa, and the Americas). Standard errors are White-corrected for heteroskedasticity.
SMALL STATES, SMALL PROBLEMS? 2023
markets, small states do not appear to beespecially open ®nancially. We illustrate thispoint in the last two columns of Table 7, wherewe regress two alternative measures of ®nancialopeness on a set of regional dummies as well asthe logarithm of average per capita income.The ®rst is the fraction of years for which dataare available in which the IMF reports restric-tions on capital account transactions in thatcountry. The coe�cient on the small statedummy is positive, although insigni®cantlyso. 7 This suggests that small states are notparticularly open to ®nancial ¯ows, asmeasured by legal impediments to such ¯ows.Combining this observation with the empiricalresults of Lewis (1996), who ®nds thatconsumption risks are less diversi®ed in coun-tries with this measure of capital controls, thissuggests that small states are not taking fulladvantage of the opportunities for risk diver-si®cation a�orded by international capitalmarkets. The second outcome measure of®nancial openness (capital in¯ows plus capitalout¯ows as a share of GDP) paints a somewhatmore favorable picture, as the small statedummy is positive and statistically signi®cant atconventional levels. This suggests that thevolume of capital ¯ows is slightly larger forsmall states than for nonsmall states, althoughthe magnitude of this e�ect is smallÐonlyabout 2±3 percentage points of GDP. Overall,this evidence suggests that small states are notas ®nancially open as they might be given thehigh volatility they face, and hence are not fullyexploiting opportunities for international riskdiversi®cation.
We conclude this section with the observa-tion that although greater ®nancial opennessmay help small states insure against the largeshocks they receive, ®nancial openness is itselfno panacea. Grilli and Milesi-Ferretti (1995)and Rodrik (1998) both note that there is noevidence that ®nancially-open economies growfaster or enjoy higher investment rates. On theother hand, there is also no systematic evidence
in favor of the popular view that by opening up®nancially, countries expose themselves togreater volatility due to the vagaries of inter-national ®nancial markets (Kraay, 1998). Insummary, although ®nancial openness mayprovide a valuable means for small states todiversify some of the large risks they face,existing evidence does not support the view thatthere will be a large growth payo� from suchpolicies.
6. CONCLUSIONS
Our analysis suggests that small states haveperhaps received excessive attention from theliteratureÐnotwithstanding our own additionto the literature!Ðas special cases calling forspecial policy measures. We ®nd that smallstates have, if anything, signi®cantly higher percapita income than others in their region. Thereis no signi®cant di�erence in growth perfor-mance between large and small states. It is truethat growth volatility and volatility of terms oftrade shocks as percentage of GDP is higher insmall states, but this is largely due to theirgreater trade opennessÐand the net bene®ts ofopenness on growth are positive. The onemissing piece in the current situation of smallstates is that they are not fully exploiting thepotential to diversify their risks by opening upto international capital movements. But eventhe payo� to ®lling in this last missing piece isunclear from evidence in the literature.
This is not to say that small states are free ofeconomic problems! Many small states are stillpoor, and promoting growth as a means toalleviate poverty is as important in small poorstates as it is in other poor countries. The goodnews is that the lessons of growth experiencefrom all countries seem to be applicable tosmall states, so they can bene®t from the largeamount of crosscountry evidence on the deter-minants of long-run growth.
NOTES
1. All of the results reported in the paper are qualita-
tively similar if we use the logarithm of population
rather than an indicator variable for small states.
2. The model of Alesina and Spolaore (1997)
mentioned earlier has the prediction that openness
reduces the costs of forming small states, since countries
will not need to produce domestically the entire basket
of goods they wish to consume.
3. An interesting historical footnote is that the greater
volatility of small states has not always been accepted.
Tarshis (1960) ®nds little evidence of a relationship
between the coe�cient of variation of per capita
WORLD DEVELOPMENT2024
income and size across US states, and poses this as a
puzzle.
4. This view of small states dates back at least to
Scitovsky (1960). Dolman (1985) goes so far as to
suggest that many small island states would be better o�
reverting to autarkic subsistence economies.
5. One characteristic of small states that we do not
examine is geographical isolation. It is di�cult to test the
e�ect of this, because some of the literature indicates
that being geographically isolated because you are
landlocked is harmful to growth, while other strands
of the literature stress ``islandness.'' Since virtually all
small states are either islands or landlocked, it would be
hard to separate out the e�ects of geographical isolation,
however measured.
6. Of course, to the extent that scale economies are
important at the industry level, the potential for such
diversi®cation might be limited in small states.
7. As reported in the IMF's Annual Report on
Exchange Arrangements and Exchange Restrictions
(IMF, various issues). The disadvantages of this measure
are well-known. First, it captures only the presence, and
not the intensity of controls. Second, it captures only
controls on residents, and not on nonresidents, although
there is some presumption that these two types of
controls are correlated across countries.
REFERENCES
Aghion, P., & Howitt, P. (1998). Endogenous growththeory. Cambridge, MA: MIT Press.
Alesina, A., & Spoalare, E. (1997). On the number andsize of nations. Quarterly Journal of Economics,November.
Alesina, A., Baqir, R., & Easterly, W. (1999). Publicgoods and ethnic divisions. Quarterly Journal ofEconomics, forthcoming.
Armstrong, H., de Kervenoael, R. J., Li, X., & Read, R.(1998). A comparison of the economic performanceof di�erent microstates and between microstates andlarger countries. World Development, 26(4), 639±656.
Armstrong, H. W., & Read, R. (1998). Trade andgrowth in small states: the impact of global tradeliberalization. World Economy.
Barro, R., & Sala-I-Martin, X. (1995). Economic growth.New York: McGraw-Hill.
Benedict, B. (1967). Problems of smaller territories.London: Athlone Press.
Briguglio, L. (1995). Small island developing states andtheir economic vulnerabilities. World Development,23(9), 1615±1632.
Cashin, P., & Loayza, N. (1995). Paradise lost? Growth,convergence, and migration in the South Paci®c.IMF Sta� Papers, 42, 608±641.
Commonwealth Consultative Group (1985). Vulnerabil-ity: Small states in the global society. London:Commonwealth Secretariat.
Commonwealth Consultative Group (1997). A future forsmall states: Overcoming vulnerability. London:Commonwealth Secretariat.
Dobozi, I., Keller, C., & Matejka, H. (1982). Smallcountries and international structural adjustment: acollection of Hungarian and Swiss views. In I.Dobozi, C. Keller, & H. Matejka (Eds.), Proceedingsof the second Hungarian±Swiss Round Table, 7±11April 1981. Geneva: study Group on East±WestRelations, Graduate Institute of InternationalStudies.
Dolman, A. (1985). Paradise lost? The past performanceand future prospects of small island states. In
E. Dommen, P. Hein (Eds.), States, microstates andislands, London: Croom Helm.
Doumenge, F. (1983). Viability of small island states.Paper prepared for United Nations Conference onTrade and Development.
Easterly, W., & Levine, R. (1997). AfricaÕs growthtragedy: policies and ethnic divisions. QuarterlyJournal of Economics, November.
Easterly, W., & Rebelo, S. (1993). Fiscal policy andeconomic growth: an empirical investigation. Journalof Monetary Economics, 32, 417±457.
Farrugia, C. (1993). The special working environment ofsenior administrators in small states. World develop-ment, 21(2), 221±226.
Grilli, V., & Milesi-Ferretti, G. M. (1995). Economice�ects and structural determinants of capital con-trols. International Monetary Fund Sta� Papers,42(3), 517±551.
Harden, S. (1985). Small is dangerous: Micro states in amacro world. London: Frances Pinter.
International Monetary Fund (IMF) (various issues).Annual report on exchange arrangements and ex-change restrictions. Washington DC: IMF.
Kaminarides, J., Briguglio, L., & Hoogendonk, H. N.(1989). The economic development of small countriesproblems strategies and policies. Delft: Eburon.
Kraay, A. (1998). In Search of the macroeconomic e�ectsof capital account liberalization. Manuscript, Wash-ington DC: World Bank.
Kraay, A., & Ventura, J. (1998). Comparative advantageand the cross-section of business cycles. World BankPolicy Research Department Working Paper No.1948. Washington, DC: World Bank.
Kuznets, S. (1960). Economic growth of small nations.In E. A. G. Robinson (Ed.). The economic conse-quences of the size of nations, Proceedings of aconference held by the international economic associ-ations. Toronto: MacMillan.
Lewis, K. (1996). What can explain the apparent lack ofinternational consumption risk sharing? Journal ofPolitical Economy, 104, 267±297.
SMALL STATES, SMALL PROBLEMS? 2025
Mankiw, N. G., Romer, D., & Weil, D. (1992). Acontribution to the empirics of economic growth.Quarterly Journal of Economics.
Milner, C., & Westaway, T. (1993). Country size and themedium-term growth process: some cross-countryevidence. World Development, 21(2), 203±211.
Ramey, G., & Ramey, V. A. (1995). Cross-countryevidence on the link between volatility and growth.American Economic Review, 85, 1138±1151.
Robinson, E. A. G. (1960). The economic consequencesof the size of nations: Proceedings of a conference heldby the international economic associations. Toronto:MacMillan.
Rodrik, D. (1998). Who needs capital account convert-ibility? In P. Kenen (Ed.). Should the IMF pursuecapital-account convertibility? Princeton Essays inInternational Finance, No. 207.
Romer, P. M. (1986). Increasing returns and long-rungrowth. Journal of Political Economy, 94, 1002±1037.
Scitovsky, T. (1960). International trade and economicintegration as a means of overcoming the disadvan-tages of a small nation. In E. A. G. Robinson (Ed.).The economic consequences of the size of nations,Proceedings of a conference held by the internationaleconomic associations. Toronto: MacMillan.
Small States Financial Forum (1987). Round table onforeign investment and commercial ®nance for smallstates. London: Crown Agents Financial AdvisoryService.
Small States Financial Forum (1988). Round table onsome practical possibilities of ®nancial co-operationbetween small states. London: Crown Agents Finan-cial Advisory Service.
Srinivasan, T. N. (1986). The costs and bene®ts of beinga small remote island landlocked or ministate econ-omy. World Bank Research Observer, 1(2), 205±218.
Streeten, P. (1993). The special problems of smallcountries. World Development, 21(2), 197±202.
Tarshis, L. (1960). The size of the economy and itsrelation to stability and steady progress. In E. A. G.Robinson, The economic consequences of the size ofnations, Proceedings of a conference held by theinternational economic associations. Toronto:MacMillan.
United Nations Institute for Training and Research(1971). Small states and territories: Status andproblems. New York: Arno Press.
UNCTAD (1997). The vulnerability of small islanddeveloping states in the context of globalisation.Geneva: UNCTAD.
APPENDIX A. VARIABLE DEFINITIONSAND DATA SOURCES
This appendix documents the de®nitions ofall variables and the data sources from whichthey were constructed. Variables are listed inthe order in which they appear in Table 8. Thesample consists of all countries for which atleast 10 years of data on real per capita GDPadjusted for purchasing power parity areavailable, as documented below. Since anumber of very small states do not reportnational accounts data and/or are not includedin the United Nations/World Bank IncomeComparison Project, real per capita GDP dataare not available for these states. As discussedin the text, it is not clear a priori what sorts ofbiases this might introduce. Nevertheless, somecaution is in order before extending the resultsto the universe of small states.
All of the cross-sectional regressions arebased on averages over all available years of therelevant variables. As a result, the time periodcovered for each country varies with the lengthof the time series available for that country.Due to unavailability of additional explanatoryvariables, the sample of countries covered inthe regressions varies, ranging from the maxi-mum possible of 157 to a minimum of 114.
(For Table 8 see opposite).
WORLD DEVELOPMENT2026
Table 8. Variable de®nitions and data sources
Variable name Comments Source
Small state Indicator variable for average population over all available years1960±95 less than one million
World BankWorld Table
OECD member Indicator variable for 24 members of OECD before recentexpansions
Oil exporter Fuel (SITC3) exports account for more than 50% of total exports World BankWorld Develop-ment Report 1996
Real GDP percapita
Primary source is the Summers and Heston Penn World Table,Version 5.6, measured in 1985 international dollars. Missingobservations in the PWT are ®lled in where possible usingPPP-adjusted GDP estimates reported by the World Bank.
Summers andHeston, WorldBank WorldTables
Infant mortality Infant mortality per thousand live births. World BankWorld Tables
Life expectancy Life expectancy at birth, measured in years World BankWorld Tables
Investment/GDP Ratio of investment to GDP adjusted for purchasing powerparity. Available only for countries appearing in Summers andHeston since World Bank does not report PPP GDP byexpenditure components
Summers andHeston
Initial real percapita GDP
Real per capita GDP in the ®rst available year for that country Summers andHeston, WorldBank WorldTables
Secondary schoolenrollment rates
Gross secondary school enrollment rates, percent World BankWorld Tables
Share of trade inGDP
Exports plus imports as a share of GDP, both measured inconstant-price local currency units
World BankWorld Tables
Terms of tradegrowth
Growth rate of local currency export de¯ator multiplied by shareof exports in GDP, less growth rate of local currency importde¯ator multiplied by share of imports in GDP
World BankWorld Tables
Unweighted termsof trade growth
Growth rate of local currency export de¯ator less growth rate oflocal currency import de¯ator
World BankWorld Tables
OECD averagegrowth
Population-weighted average of real per capita GDP growthrates of 24 OECD member countries before recent expansions
Summers andHeston, WorldBank WorldTables
Capital controls Average over all available years of indicator variable for presenceof restrictions on capital account transactions
Sum of credit items plus )1 times debit items in the ®nancialaccount of the balance of payments, expressed as a share of GDPin current dollars at market exchange rates
InternationalMonetary FundBalance of Pay-ments StatisticsYearbookRevision 5