Date post: | 27-Feb-2018 |
Category: |
Documents |
Upload: | truongtuyen |
View: | 214 times |
Download: | 1 times |
1
Sustainability and the Highway 20 EnvironmentalCorridor
Small Town Outlook
Dr. Tara Lynne ClappIowa State University
Amy FreiburgerJung Hak SeoKyle KarsjenBrian Leslie
Jill MascarelloAmy PotratzCky Ready
2
Executive Summary
Our goal for this project is to determine what impacts the rerouted and
widened Highway 20 would have on the towns in the area. In order to determine the
effects a bypass would have on these towns, our group compared them to other towns
that have been bypassed in the past. By evaluating these communities we were able
to get a better understanding of what may happen when highway 20 is rerouted.
Once it was determined that it was not likely the towns were going to suffer
due solely to the bypass, it was then necessary to consider what may have helped the
previously bypassed towns survive. There were a few reasons that these towns stayed
alive.
The first important aspect is to have an active economic development board.
This will assist the community in attracting businesses that in turn keep the downtown
alive. If the town does succeed in attracting new business ventures and the citizens
support them, the community will likely thrive.
Second, the community’s economic development department should consider
the federal and state economic development program. These programs can assist
communities in attracting new businesses. Utilizing these different resources had a
strong part in the success of the towns we will be comparing.
Introduction
Throughout our work on this project, we sought to determine if there were
positive or negative impacts on these towns’ retail sales, and in general, quality of
life. First, we chose three towns that are going to be bypassed and studied their
profiles. The three towns we chose were Sac City, Lytton, and Rockwell City. We
looked at the population of each town, how close these towns are to a metropolitan
3
area, and how many local stores there are in each town. We then chose six other
towns that had similar profiles. These towns had a four-lane highway that bypassed
them in the 1980’s. From this comparison, we wanted to see if the towns began to
become more prosperous or if they started to decline.
After examining the retail characteristics of each town, we discuss ways to
make Iowa’s small towns more sustainable. It is important for small towns to figure
out their strengths and their weaknesses. Once they find out their strengths, they need
to focus on these strengths to build their community. It is true that Iowa’s small
towns are declining, but it is possible to not fall into this trend. There are many
organizations that want to help these towns with ideas to make these towns socially
and economically stronger.
Background
The Environmental Highway concept has gained great momentum as
people realize that this corridor can serve not only as a transportation network,
but a tourism draw by highlighting our natural resources. As an environmental
corridor, Highway 20 (1) creates a positive environment for economic
development, (2) establishes a model of scenic beauty for Iowa roadways, (3)
protects Iowa’s rich soil, pure water and clean air, (4) design-in habitat
amenities for the benefit of wildlife and (6) embraces the natural features of the
Iowa landscape.
According to World Commission on Environment and Development,
sustainable development is defined as meeting “the needs of the present without
compromising the ability of future generations to meet their own needs.”
Sustainability is related to the quality of life in a community–whether the
4
economic, social and environmental systems that make up the community are
providing a healthy, productive, meaningful life for all community residents,
present and future. Therefore, a sustainable community resembles a living
system in which human, natural and economic elements are interdependent and
draw strength from each other.
The investment in bringing US Highway 20 to full four-lane service
across the entire state is an issue of great economic importance to all of Iowa
and certainly to the thousands of businesses and hundreds of communities in
northern Iowa. The corridor is almost finished with less than 92 miles of this
vital transportation link to complete. The gap left to complete is from Sioux
City to Fort Dodge which would greatly enhance the transportation network for
thousands of businesses. But there are some concerns about the impacts of
Highway 20 bypasses on small towns around the highway. Especially, the
residents of small towns are worrying over the economic impacts from the
highway bypasses.
Concerns and Issues
After speaking with community members as well as the Highway 20
Association, we outlined some of the concerns community members expressed about
the proposed bypass. Most disagreed with the bypass, and it was easy to see why;
they feared that losing the highway would wreak havoc on their economies. Many of
these fears revolved around the retail activity within the downtown area.
Many residents believed the reason for their downtown retail success was
highway 20. They felt that people were not likely to get off the highway to patronize
their shops. They also feared a shift from downtown development to out by the
5
highway. After listening to all of their fears and concerns, we decided to concentrate
on the retail aspects of their communities.
Retail sales are a good indicator of a town’s health because they give an idea
of economic activity. Retail sales can also show the condition of a town center and
shows trends in the economy as well as which areas are thriving or declining. Retail
sales can also illustrate which sectors of the economy are growing. A diverse town
center will attract more customers and investors, which can help a community to
grow.
Analysis and Methods
When we decided to concentrate our efforts on a project for the small towns
that were being bypassed by Highway 20 construction, we asked ourselves, “How will
these small towns react to the bypass? What will they think? Are they for it, or are
they against it?” We set out to show them that there was nothing to fear; that though
their towns might change a bit, they would not die.
We decided to look for indicators of sustainability that we could use to
compare these towns to other similar small towns in Iowa that had been bypassed. In
narrowing down our search for comparative cities, we looked for towns that were of
similar size, makeup, and had the same relative location to a major metropolitan area.
It was also important to us that we stick to comparative towns in Iowa. We could
have found towns that were closer in population out of state, but we decided that we
wanted to have the same rural, farm-based economy that one would find in a small
town in Iowa. We located our towns, and then began to do the analysis.
We contacted Ken Stone and Georgianne Artz from the Iowa State Department
of Economics to enlist their advice. We used their online Iowa PROfiles data to get
6
our own economic data for our analysis. We concentrated on the following indicators:
1. Number of firms
2. Actual retail sales
3. Decade-long total retail sales of these towns to see if the trend kept going
Once the comparison cities were decided upon we began to collect relevant
data. We looked at retail sales data for four years prior to the highway bypass and
four years after the bypass to track any significant changes in the overall retail sales
trend. Several of the comparison towns were bypassed in the eighties. We were
interested in how these towns were doing today so we also tracked retail sales date for
the decade of the nineties.
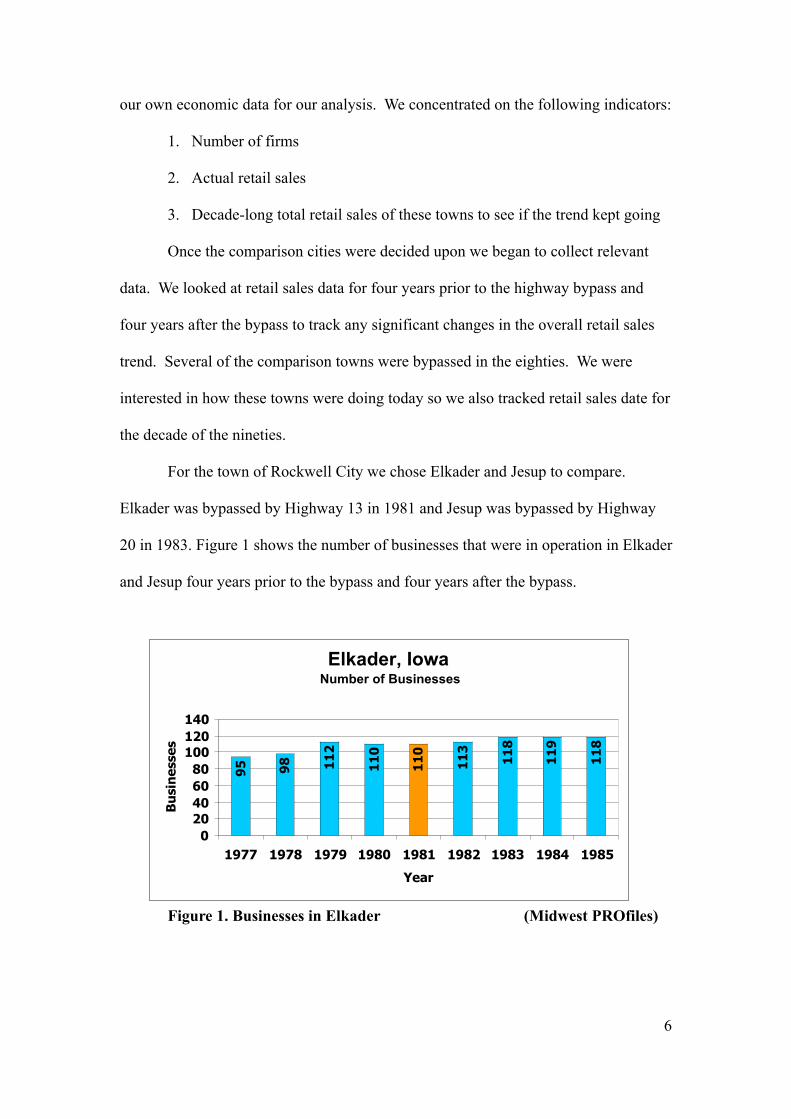
For the town of Rockwell City we chose Elkader and Jesup to compare.
Elkader was bypassed by Highway 13 in 1981 and Jesup was bypassed by Highway
20 in 1983. Figure 1 shows the number of businesses that were in operation in Elkader
and Jesup four years prior to the bypass and four years after the bypass.
Figure 1. Businesses in Elkader (Midwest PROfiles)
Elkader, IowaNumber of Businesses
95 98 11
2
11
0
11
0
11
3
11
8
11
9
11
8
020406080
100120140
1977 1978 1979 1980 1981 1982 1983 1984 1985
Year
Bu
sin
esse
s
7
As you can see the number of businesses held steady and showed no reduction
as a result of the bypass. The orange bar represents the year the town was bypassed
by the Highway.
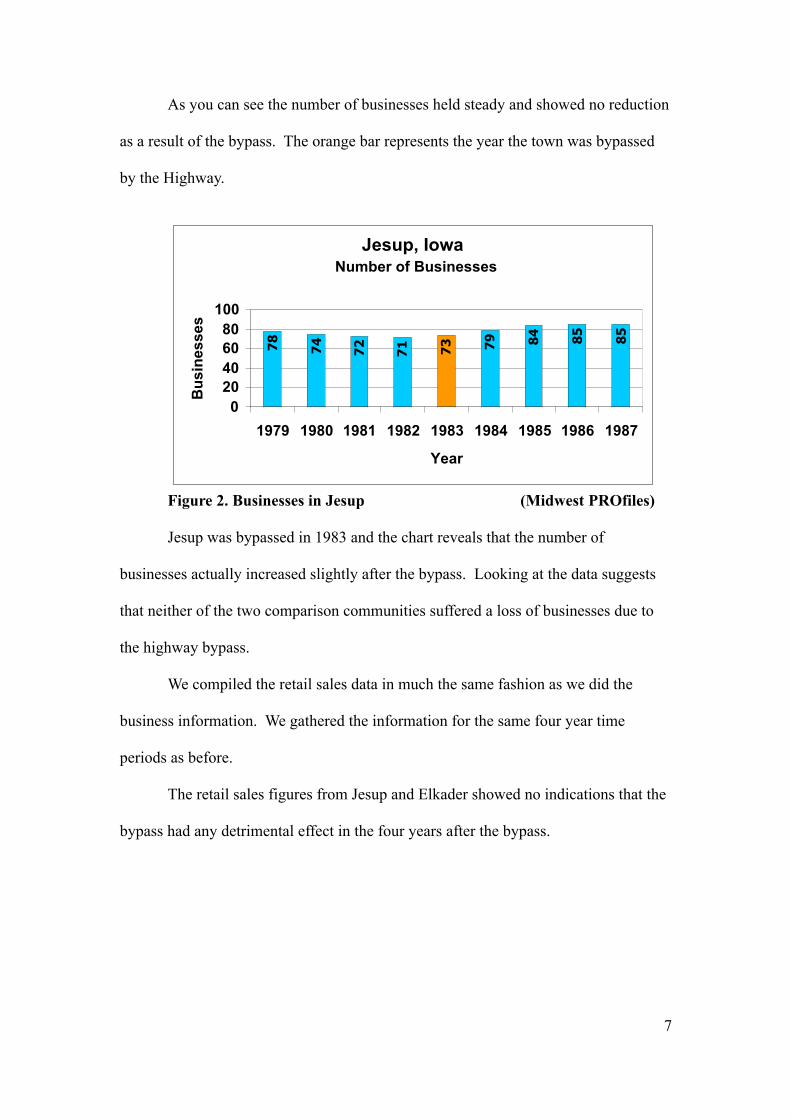
Figure 2. Businesses in Jesup (Midwest PROfiles)
Jesup was bypassed in 1983 and the chart reveals that the number of
businesses actually increased slightly after the bypass. Looking at the data suggests
that neither of the two comparison communities suffered a loss of businesses due to
the highway bypass.
We compiled the retail sales data in much the same fashion as we did the
business information. We gathered the information for the same four year time
periods as before.
The retail sales figures from Jesup and Elkader showed no indications that the
bypass had any detrimental effect in the four years after the bypass.
Jesup, Iowa Number of Businesses
78
74
72
71 73 79 84 85
85
020406080
100
1979 1980 1981 1982 1983 1984 1985 1986 1987
Year
Bu
sin
esse
s
8
Figure 3. Retail Sales in Elkader (Midwest PROfiles)
Jesup shows a slight decline in the retail sales in the years after the bypass, but
this is more of an indication of the overall general decline that small town Iowa has
been experiencing in the last 10 years.
Figure 4. Retail Sales in Jesup (Midwest PROfiles)
Elkader, Iowa Retail Sales In Millions
17
.5
16
.4 20
.8 23
.4
21
.3
22
.5
23
.6
24
.8
22
.5
05
1015
202530
1977 1978 1979 1980 1981 1982 1983 1984 1985
Year
Do
llars
Jesup, Iowa Retail Sales In Millions
6.4 7.6
7.3 9
.1 9.5 9.6
9.5
9.1
8.6
0
5
10
15
1979 1980 1981 1982 1983 1984 1985 1986 1987
Year
Do
llars
9
Figure 5. Retail Sales 1990-2000 for Elkader. (Midwest PROfiles)
Since these two towns were bypassed in the early 1980’s we were curious how
retail sales had held up in more recent years. Figures 5 and 6 show that they have
grown economically and that retail sales have remained strong showing no signs of
decline as a result of the bypass.
Figure 6. Retail Sales 1990-2000 for Jesup (Midwest PROfiles)
Elkader, Iowa Retail Sales 1990-2000
18
.6
18
.7
20
.7
20
.8
22
.8
22
.7 24
24
.5
22
.8 25
.8
23
.6
05
1015202530
1990 1991 1992 1993 1994 1995 1996 1997 1998 1999 2000
Year
Dol
lars
Jesup, Iowa Retail Sales 1990-2000
9.9
9.6 1
3.2 15
.2
15
.6
16
.5
15
.5
15
.7
16
.7 18
.4
16
.8
0
5
10
15
20
1990 1991 1992 1993 1994 1995 1996 1997 1998 1999 2000
Year
Do
llars
10
For the community of Sac City we chose Center Point and Dyersville as the
comparison communities. Center Point was bypassed in 1984 by US Interstate 380
and Dyersville was bypassed in 1988 by US Highway 20.
Figure 7. Businesses in Center Point (Midwest PROfiles)
Figures 7 and 8 show the number of businesses that were in each of the
comparison communities prior to and following the bypasses. Dyersville shows an
increase in the number of businesses following the bypass. Center Point shows a
slight decline in the number of businesses but once again this is related to an overall
decline in small town Iowa.
Figure 8. Businesses in Dyersville (Midwest PROfiles)
Center Point, Iowa Number of Businesses
49
48 50
50 5
6 57
53
52 53
0
10
20
30
40
50
60
1980 1981 1982 1983 1984 1985 1986 1987 1988
Year
Bu
sin
esse
s
Dyersville, Iowa Number of Businesses
162 161 159 157162
165171
176 174
140
150
160
170
180
1984 1985 1986 1987 1988 1989 1990 1991 1992
Year
Businesses
11
Figures 9 and 10 indicate that the comparison communities held their own in
the retail sales end of the analysis. Both of these small communities showed a stable
timeline following the bypasses.
Figure 9. Retail Sales for Center Point (Midwest PROfiles)
Figure 10. Retail Sales in Dyersville (Midwest PROfiles)
Center Point, Iowa Retail Sales in Millions
4.2
4.1 4.4 4
4.2 4.5 5
.3
5.3
4.6
0123456
1980 1981 1982 1983 1984 1985 1986 1987 1988
Year
Do
llars
Dyersville, Iowa Retail Sales in Millions
37
35
.5
33
.8 38
.6
37
.9
35
.7
35
.6 40
.1
41
.8
0
10
20
30
40
50
1984 1985 1986 1987 1988 1989 1990 1991 1992
Year
Do
llars
12
Figure 11. Retail Sales 1990-2000 for Center Point (Midwest PROfiles)
Figures 11 and 12 show the retail sales for the years 1990 to 2000. These
figures clearly indicate that neither of these two communities showed any detrimental
or long lasting effects from the bypasses.
Figure 12. Retail Sales 1990-2000 for Dyersville (Midwest PROfiles)
Center Point, Iowa Retail Sales 1990-2000
8.2 8
7.5 8
.5 8.8 8.9 9.3
10
.3
10
.8
11
.4
9.2
02468
1012
1990 1991 1992 1993 1994 1995 1996 1997 1998 1999 2000
Year
Do
llars
Dyersville, Iowa Retail Sales 1990-2000
35
.6
40
.1
41
.8
45
.8
48
.1
51
.9
54
.7
59
.8
65
.3
70
.8
64
.3
0
20
40
60
80
1990 1991 1992 1993 1994 1995 1996 1997 1998 1999 2000
Year
Do
llars
13
For Lytton we chose Walker and Janesville as the comparison communities.
Walker was bypassed in 1984 by US Interstate I-380 and Janesville was bypassed in
1993 by US Highway 318.
Figure 13. Businesses for Walker. (Midwest PROfiles)
Figures 13 and 14 represent the data collected for the number of businesses in
both of our comparison communities. Both Janesville and Walker reflected previous
results by keeping the number of businesses at a steady level and neither showed any
negative results to the number of businesses as a sign of the bypasses.
Figure 14. Businesses for Janesville (Midwest PROfiles)
Walker, IowaNumber of Businesses
37 4
1
39
39
37
37 38
37 38
0
10
20
30
40
50
1980 1981 1982 1983 1984 1985 1986 1987 1988
Year
Bu
sin
esse
s
Janesville, Iowa Number of Businesses
48
45
42
42 4
7
46 49
48 5
2
0102030405060
1989 1990 1991 1992 1993 1994 1995 1996 1997
Year
Bu
sin
esse
s
14
Figure 15. Retail Sales for Walker (Midwest PROfiles)
Figures 15 and 16 show the data collected for Janesville and Walker for retail
sales over the time of the bypass. These two communities showed no indication that
the bypass had caused any loss of retail sales to their local businesses.
Figure 16. Retail Sales for Janesville (Midwest PROfiles)
Walker, Iowa Retail Sales In Millions
2.7
2
2.1
5
2.3
5
2.5
4
2.4
6
2.2 2.8
3
3.0
6
2.3
6
01234
1980 1981 1982 1983 1984 1985 1986 1987 1988
Year
Do
llars
Janesville, Iowa Retail Sales in Millions
3.8
3.5
3.3
3.1 3.4
3.4 3.7
3.3
4.4
0
1
2
3
4
5
1989 1990 1991 1992 1993 1994 1995 1996 1997
Year
Do
llars
15
Looking at the 10-year period from 1990 to 2000 both of these communities
have shown an increase in the amount of retail sales generated. This is an indication
that once again the bypasses had little or no negative economic impact on either the
number of businesses or the amount of retail sales generated by these communities.
Figure 17. Retail Sales 1990-2000 for Walker (Midwest PROfiles)
Figure 18. Retail Sales 1990-2000 for Janesville (Midwest PROfiles)
The use of similar comparison towns, and the results of the retail sales analysis
left us with the impression that the communities of Sac City, Rockwell City, and
Walker, Iowa Retail Sales 1990-2000
3
2.6
4.3
4.3
6.1 7
.2
7.1 8
.1
4
7.7
7.5
02468
10
1990 1991 1992 1993 1994 1995 1996 1997 1998 1999 2000
Year
Do
llars
Janesville, Iowa Retail Sales 1990-2000
3.5
3.3
3.1 3.4
3.4 3.7
3.3
4.4 4.6
5.6
4.2
0
1
2
3
4
5
6
1990 1991 1992 1993 1994 1995 1996 1997 1998 1999 2000
Year
Do
llars
16
Lytton can put their fears to rest when it comes to losing either retail sales dollars or
the number of businesses. None of the six comparison communities showed a
negative effect from being bypassed by a four-lane highway.
Conclusions and Future Directions
Why do people choose Iowa? Our state is one of the healthiest and safest
places to live and raise a family. This provides an ideal environment which is good
for families, careers, and shaping the future of a new service-oriented economy. Iowa
is coveted for safe neighborhoods, wide-open opportunities for professional growth,
short commutes, lower costs of living and higher student standards. With one of the
lowest crime rates in the nation, Iowans spend more time in their neighborhoods and
parks with a feeling of safety and security. Iowa's clean, uncongested cities have less
traffic, less noise, and a sense of neighborliness!
According to the Iowa Department of Economic Development, Iowa holds the
following notorious ranks among the states: second nationally in business retention,
fifth lowest nationally in business costs, among the top 10 states for “technology
sophistication” in K-12 schools, among the top 10 in academic research and
development and home to three state universities rated in the top 100.
There are several programs and funding available for small towns looking to
revitalize their landscape more sustainably. We will describe programs offered
through the Iowa Department of Economic Development, options available from the
Sustainable Measures organization, and further resources offered through Iowa State
University.
17
The Iowa Department of Economic Development provides the following
financial assistance programs for entrepreneurs looking to invest in Iowa’s local
economy:
® Venture Project Component of the Community Economic Betterment
Account (CEBA)
The Venture Project Component of CEBA makes equity-like investments of up to
$250,000 to start-up and early-stage businesses.
® Economic Development Set-Aside (EDSA)
The EDSA program provides financial assistance to companies that create new
employment opportunities and/or retain existing jobs, and make new capital
investment in Iowa.
® Entrepreneurial Ventures Assistance (EVA)
Offers technical and financial assistance to eligible start-up and early-stage
enterprises. To qualify, applicants must have completed or be participating in
entrepreneurial training from the John Pappajohn Entrepreneurial Center, or have
comparable training or experience.
® Value-Added Agricultural Products and
Processes Financial Assistance Program (VAAPFAP)
The Value-Added Agricultural Products and Processes Financial Assistance
Program seeks to increase the innovative utilization of Iowa's agricultural
commodities.
® Export Trade Assistance Program (ETAP)
ETAP provides financial assistance to eligible Iowa businesses wishing to enter
new markets by participating in foreign trade shows and trade missions.
18
® Self-Employment Loan Program (SELP)
Offers low-interest loans of up to $10,000 to low-income owners of new or
expanding small businesses.
® Targeted Small Business Financial Assistance Program (TSBFAP)
Designed to create and expand minority- or women-owned businesses through
direct loans of up to $25,000 and loan guarantees of up to $40,000.
Additional financial assistance programs can be found at the Iowa
Department of Economic web site at http://www.iowasmart.com/
Sustainable Measures is a private consulting firm dedicated to promoting
sustainable communities, primarily through the development, understanding and use
of effective indicators and systems for measuring progress. The organization assists
governments, businesses, and non-profits find appropriate, practical ways to
contribute to the overall sustainability of their communities.
Sustainable Measures offers a variety of consulting services on a fee basis.
Typical clients include communities, non-profit organizations, federal, state, regional,
and local governments, foundations and private sector businesses. Their services
include: training, community, organizational and system development, process design
and facilitation, evaluation, data analysis, reporting, and editing, presentations,
practitioner networks, and practice sessions and learning forums.
A daylong, online workshop is offered free of charge to orient those interested
in making their communities more sustainable. Access to the program and additional
information can be retrieved at: (http://www.sustainablemeasures.com/).
Appointments can also be made for a spokesperson to conduct the seminar by
contacting Maureen Hart at [email protected].
19
In addition to these resources, Dr. Terry Besser of Iowa State University's
sociology department specializes in sustaining rural communities. She has further
information regarding how sample communities have overcome the hurdles of
economic downturn. A videotape entitled, Quality Jobs for Quality Communities,
showcases the efforts of other Iowa communities in order to make for a brighter
tomorrow. She can be contacted via e-mail at [email protected] or 515-294-6508.
Vernon Ryan, Steve Padgitt, Kenneth Stone, and Jan Flora are also university
professors specializing in rural community development, which can be contacted
through the university.
We can conclude that Iowa does have areas of improvement to be made in
regards to sustainable development. Iowa must focus on retaining its youth, attracting
a more diverse population, establishing economic vitality, and preserving its
predominately agricultural way of life without sacrificing economic, social and
environmental sustainability. This in turn will stimulate economic growth and liven
the social fabric which make Iowa such a unique place to live and grow. In many
ways bringing about economic vibrancy can go hand-in-hand with achieving
sustainability if planned and executed in the proper manner.
Works Cited
Besser, Terry. Personal Communication. March 2003.
Stone, Kenneth. Personal Communication. February, 2003.
Flora, Jan & Cornelia. Rural Communities. Westview Press. 1992.
Iowa Department of Economic Development. http://www.iowasmart.com/. Dateaccessed: March 2003.
Sustainable Measures. http://www.sustainablemeasures.com. Date accessed: March,2003.