SMALLHOLDER DAIRY PRODUCTION AND MARKETING IN WESTERN KENYA: A Review of Literature P. O. Mudavadi, K. Otieno, J. W. Wanambacha, J. O. Odenya, M. Odendo and O. K. Njaro MOARD/KARI/ILRI Smallholder Dairy (Research & Development) Project Funded by British Department for International Development (DFID) August 2001 This Report is circulated prior to full peer review to stimulate discussion and comment. Based on that process, its content may be revised. Please send comments to the authors at Kakamega RRC and to the SD (R&D) Project Manager: [email protected]( )
Transcript
SMALLHOLDER DAIRY PRODUCTION
AND MARKETING IN WESTERN KENYA:
A Review of Literature
P. O. Mudavadi, K. Otieno, J. W. Wanambacha, J. O. Odenya, M. Odendo and O. K. Njaro
2.6 Constraints to dairy cattle production in the region ............................. 27
3.0 LIVESTOCK RESEARCH AND DEVELOPMENT PROGRAMMES IN THE REGION ...................................................................................................................... 28
4.0 LIVESTOCK EXTENSION SERVICES WITHIN THE REGION ............ 30
4.1 Ministry of Agriculture and Rural Development (MoARD) .................. 30
Various production systems exist over the mandate region (Table 2). In the LM1 - LM3 zones,
mainly in Nandi District, dairying is the major enterprise and is also the main source of
income. Dairy is kept in the extensive system, where most animals are grazed both on natural
or planted pastures and legumes. Most pastures are paddocked and there is an element of
fodder production. In Mumias and Butere Divisions of Butere/Mumias District and Lurambi,
Kabras and Navakholo Dvisions of Kakamega district and Nalondo Division of Bungoma
district, LM1-2 is the main sugarcane zone. Sugar cane is the main enterprise and cash earner
in those areas. Tea is the major cash crop in UH1 and LH2 zones. The main crop enterprises in
zones LH1-2 and UM1-4 are maize, beans, sweet potatoes and horticultural crops. In the UM1 -
UM3 of Kakamega, Vihiga and Bungoma Districts, maize (usually inter-cropped with beans)
and dairy are the two major enterprises. The cattle are grazed or tethered in paddocks of
either natural or planted pastures and forage legumes. Other crop enterprises include
5
sunflower, tea, coffee, sweet potatoes, bananas and horticultural crops. Dairy under zero -
grazing is over the years becoming popular in these Districts.
The lower midland zones 3 and 4 are the areas that do not have any cash crop. Rainfall is low
and the crop and livestock productivity are also low. The enterprises are maize, beans,
cassava, sorghum, finger millet, groundnuts, sweet potatoes, green grams, Soya beans, a wide
variety of exotic and local and indigenous vegetables and fruits. The cattle kept are local
zebus that are poorly fed and managed.
6
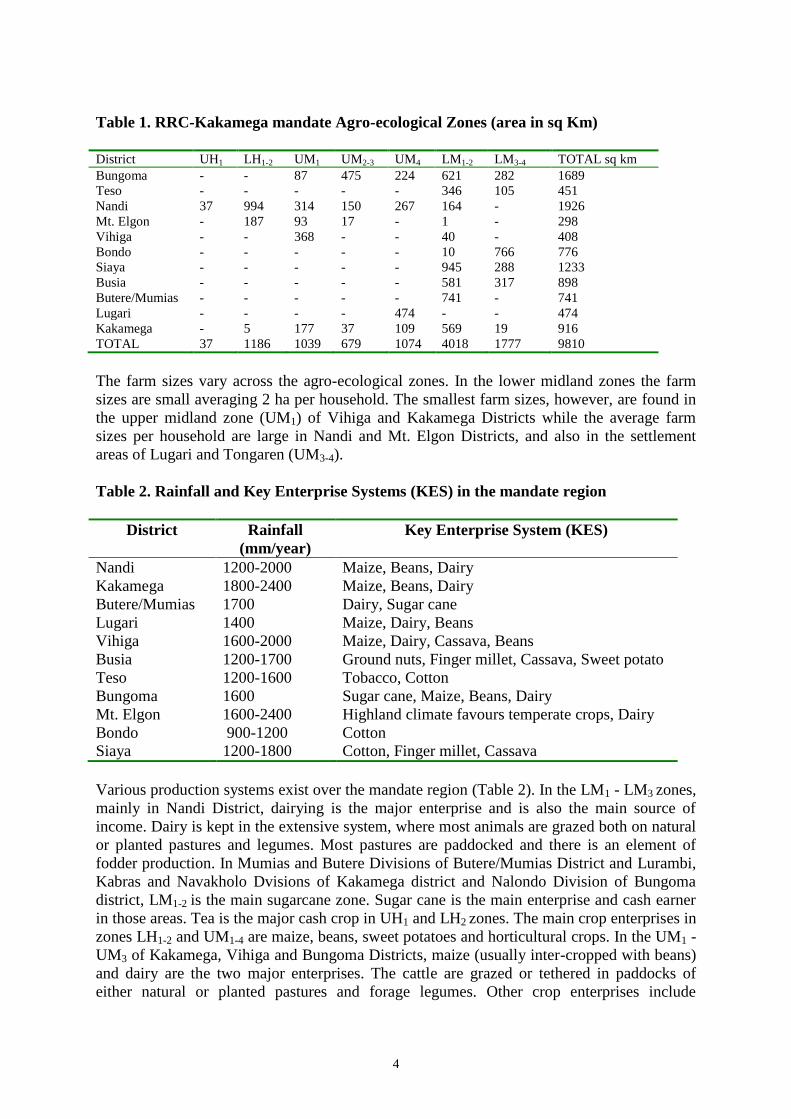
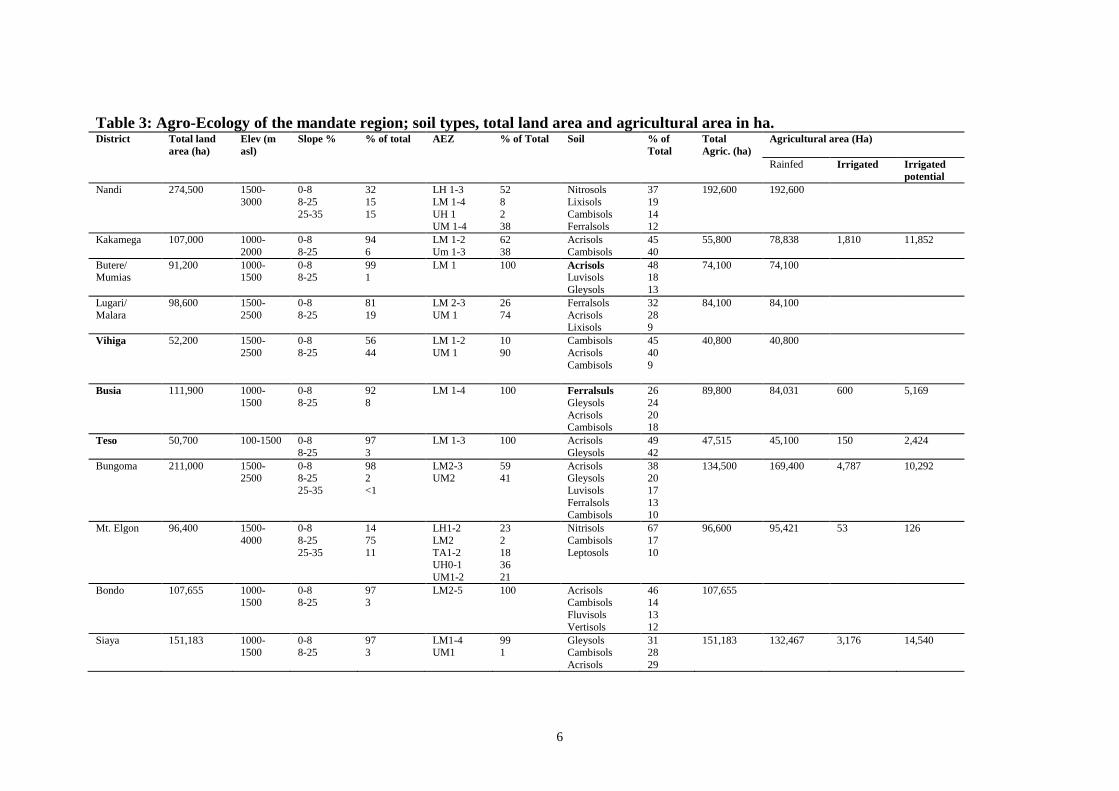
Table 3: Agro-Ecology of the mandate region; soil types, total land area and agricultural area in ha. District Total land
area (ha)
Elev (m
asl)
Slope % % of total AEZ % of Total Soil % of
Total
Total
Agric. (ha)
Agricultural area (Ha)
Rainfed Irrigated Irrigated
potential
Nandi 274,500 1500-
3000
0-8
8-25
25-35
32
15
15
LH 1-3
LM 1-4
UH 1
UM 1-4
52
8
2
38
Nitrosols
Lixisols
Cambisols
Ferralsols
37
19
14
12
192,600 192,600
Kakamega 107,000 1000-
2000
0-8
8-25
94
6
LM 1-2
Um 1-3
62
38
Acrisols
Cambisols
45
40
55,800 78,838 1,810 11,852
Butere/ Mumias
91,200 1000-1500
0-8 8-25
99 1
LM 1 100 Acrisols
Luvisols
Gleysols
48 18
13
74,100 74,100
Lugari/
Malara
98,600 1500-
2500
0-8
8-25
81
19
LM 2-3
UM 1
26
74
Ferralsols
Acrisols Lixisols
32
28 9
84,100 84,100
Vihiga 52,200 1500-
2500
0-8
8-25
56
44
LM 1-2
UM 1
10
90
Cambisols
Acrisols
Cambisols
45
40
9
40,800
40,800
Busia 111,900 1000-
1500
0-8
8-25
92
8
LM 1-4 100 Ferralsuls
Gleysols
Acrisols Cambisols
26
24
20 18
89,800 84,031 600 5,169
Teso 50,700 100-1500 0-8
8-25
97
3
LM 1-3 100 Acrisols
Gleysols
49
42
47,515 45,100 150 2,424
Bungoma 211,000 1500-2500
0-8 8-25
25-35
98 2
<1
LM2-3 UM2
59 41
Acrisols Gleysols
Luvisols
Ferralsols
Cambisols
38 20
17
13
10
134,500 169,400 4,787 10,292
Mt. Elgon 96,400 1500-
4000
0-8
8-25
25-35
14
75
11
LH1-2
LM2
TA1-2 UH0-1
UM1-2
23
2
18 36
21
Nitrisols
Cambisols
Leptosols
67
17
10
96,600 95,421 53 126
Bondo 107,655 1000-1500
0-8 8-25
97 3
LM2-5 100 Acrisols Cambisols
Fluvisols
Vertisols
46 14
13
12
107,655
Siaya 151,183 1000-1500
0-8 8-25
97 3
LM1-4 UM1
99 1
Gleysols Cambisols
Acrisols
31 28
29
151,183 132,467 3,176 14,540
7
There is heavy reliance on family labour to carry out farm activities on smallholder farms in
the region. It is evident in recent years that a large share of livestock activities is carried out
by women, and this is mainly attributed to three factors. Firstly, animal care traditionally was
an important male activity, however in recent years, men have increasingly directed their
labour towards off-farm wage earning opportunities, leaving women responsible for much of
the farm work. Secondly, with the advent of compulsory education, children are now
available to help with the care of livestock only in the afternoon, or weekends, and during
holidays. Thirdly, the intensification process itself which focuses labour on food crop
production and the provision of cut and carry system of feeds to animals in zero or semi -
zero grazing systems has brought livestock care more closely into the sphere of women
responsibility. The concern should thus be to develop a strong extension programme that
would offer training geared to improving smallholder women skills in the feeding and
management of dairy cattle.
Land use dynamics
The land tenure system is free hold, with owners having title deeds. There are though few and
isolated cases of communal and urban/peri-urban land tenure systems. However, land is
continuously being sub divided into uneconomical units by families as grown up sons seek
ownership rights. The region has high potential for both crop and livestock production,
though, the productivity is low largely due to low use of inputs and extensive cropping
leading to over exhausting the soils.
Most farmers in RRC-Kakamega mandate region practice mixed farming with both crops and
livestock farming being practiced. Maize is the staple food crop in the region and is grown
for both subsistence and commercial purposes. Other food crops include finger millet,
sorghum, cassava, rice and sweet potatoes. Horticultural crops like bananas, kales, French
beans, onions and tomatoes are also grown. The cash crops in order of importance include
sugar cane, tea, coffee, tobacco, sunflower and cotton. Groundnuts and simsim are also
grown but on small scale. Livestock especially cattle, poultry, sheep and goats are kept in the
region. Others include pigs, donkeys and rabbits. The acreage under pastures in the region is
low as most of it is under cash and food crop production, and this has greatly hindered the
growth of the livestock industry.
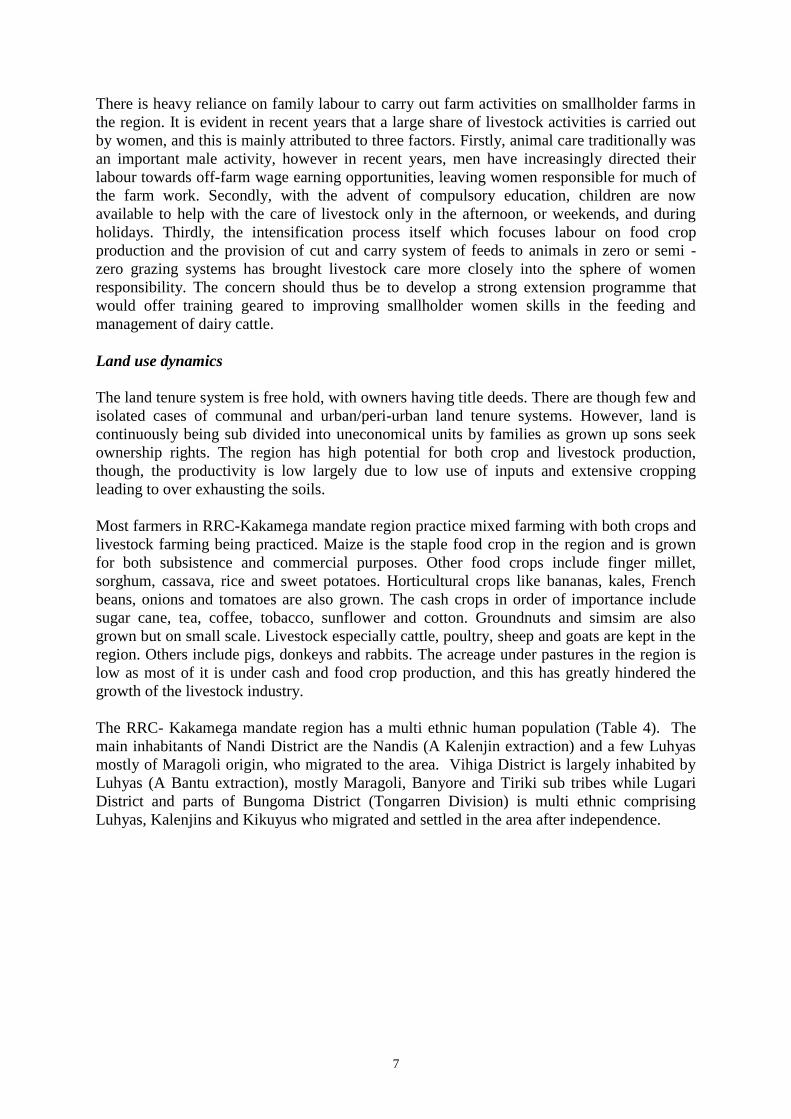
The RRC- Kakamega mandate region has a multi ethnic human population (Table 4). The
main inhabitants of Nandi District are the Nandis (A Kalenjin extraction) and a few Luhyas
mostly of Maragoli origin, who migrated to the area. Vihiga District is largely inhabited by
Luhyas (A Bantu extraction), mostly Maragoli, Banyore and Tiriki sub tribes while Lugari
District and parts of Bungoma District (Tongarren Division) is multi ethnic comprising
Luhyas, Kalenjins and Kikuyus who migrated and settled in the area after independence.
8
Table 4: RRC- Kakamega mandate Districts human population figures in ‘000. (1999
National census report).
Districts Males Females Total
Bondo 112 135 247
Bungoma 426 452 878
Butere/Mumias 227 251 478
Busia 174 197 371
Kakamega 290 315 605 Lugari 106 111 217
Mt. Elgon 62 68 130
Nandi 291 291 582
Teso 82 89 171
Vihiga 233 266 499
Siaya 220 260 480
Total 2223 2435 4658
Mt. Elgon District is largely inhabited by Saboats (A Kalenjin Extraction) and few Bukusus,
a Luhya sub tribe while Bukusu and Tachoni Luhya sub tribes inhabits Bungoma District.
Luos inhabit Siaya, Bondo and parts of Busia Districts. Isukha, Idhako, Batsotso, Banyala,
Kabras, Wanga, Kisa, Marama, Marachi and Wakhayo Luhya sub tribes inhabit parts of
Kakamega, Butere/Mumias and Busia districts and Atessos occupy Teso district.
(JAETZOLD and SCHMIDT 1982). These ethnic diversities have a bearing on the
development and adoption of the dairy cattle production technologies in the region.
2.0 LIVESTOCK PRODUCTION IN THE REGION
2.1 Cattle Production systems, Population and Distribution
RRC-Kakamega mandate area has about 2 million cattle of which 80% are local zebus and
20% improved. Siaya District has the highest number in total cattle followed by Nandi,
Kakamega, Bungoma, Busia and lastly Vihiga. This distribution is related to land pressure as
a result of human population increases, feed supply and husbandry methods. The high
numbers of zebu cattle in the region is also associated with the socio-cultural practices
(dowry payment and prestige), including their ability to resist diseases especially tick borne,
where the number of cattle per household is more valuable than the quantity and quality of
the product (milk).
The cattle production systems in RRC-Kakamega mandate area can be classified broadly as
Small scale dairy production system; Small scale dairy/meat production system; Small scale
dairy/meat/traction production system; and Large scale dairy production system. Within these
production systems, there are three different breeds of cattle namely; Pure breeds (graded
cattle), cross breeds and local zebu cattle. These cattle are reared under free grazing/tethering,
semi-zero grazing or zero grazing systems and depend on natural pastures/forage, fodder
crops and agricultural by-products as their main feed source.
9
These production systems are distributed across the different agro-ecological zones. Large-
scale dairy production is practiced in agro-ecological zone LH1-3, whereas small-scale dairy
production is confined to agro-ecological zones LH2-3 and UM1-4. Small scale or large scale
dairy farmers are not found in agro-ecological zone LM1-4 which covers 61% of the total
mandate area, whereas small scale dairy/meat and dairy/meat/traction production systems are
found across all the agro-ecological zones.
Local zebus are found in all agro-ecological zones within the region except in agro-ecological
zone LH1-3. Graded cattle and crosses are largely confined to agro-ecological zone LH1-3 that
covers 12% of the total mandate area and agro-ecological zone UM1-4 that covers 11% of the
total mandate area. Agro-ecological zone LM1-4 that covers 61% of the total mandate area
does not have improved cattle (pure breeds and crosses). This therefore means that 77% of
the total mandate area comprises small- scale farmers who keep local zebu cattle and low
value crosses across agro-ecological zones UM1-4 and LM1-4.
Graded (improved) cattle are mainly found in Nandi District followed by Kakamega,
Bungoma, Vihiga, Siaya and lastly Busia. It is also observed that the density of improved
cattle in these Districts is 7 animals per km2 except in Nandi where the density is 115 animals
per km2. This greatly contrasts with densities reported in other Districts across the country
such as: Trans Nzoia, 44 animals per km2 (76% of the total District herd); Uasin Gishu, 86
animals per km2 (93% of the total District herd); Kiambu, 61 animals per km
2 (87% of the
total District herd); Kirinyaga, 45 animals per km2 (73% of the total District herd); Murang’a,
73 animals per km2 (95% of the total District herd); and Nyandarua 81 animals per km
2 (96%
of the total District herd). It may be necessary at this stage to give some detailed assessment
of the situation in some of the Districts under RRC-Kakamega mandate area with high
populations of cattle.
Bungoma District
Bungoma borders Mt. Elgon District to the Northwest, Trans Nzoia district to the North,
Kakamega District to the East and Southeast, Busia and Teso Districts to the West and
Southwest and the Republic of Uganda to the Northwest at Lwakhakha border point. The
District lies between latitude 00 25.3’ North and 0
0 53.2’ North and longitude 34
0 21.4’ East
and 350 04’ East and covers a total land area of 1689 square kilometres, about 25% of the
total area of the province, out of which 1438 square kilometres is arable land and 1,175
square kilometres is under cultivation. Administratively the district is divided into nine
Divisions (Nalondo or Central Division, Kanduyi, Chwele, Bumula, Sirisia, Kimilili, Ndivisi,
Webuye and Tongaren), 42 Locations and 105 Sub Locations.
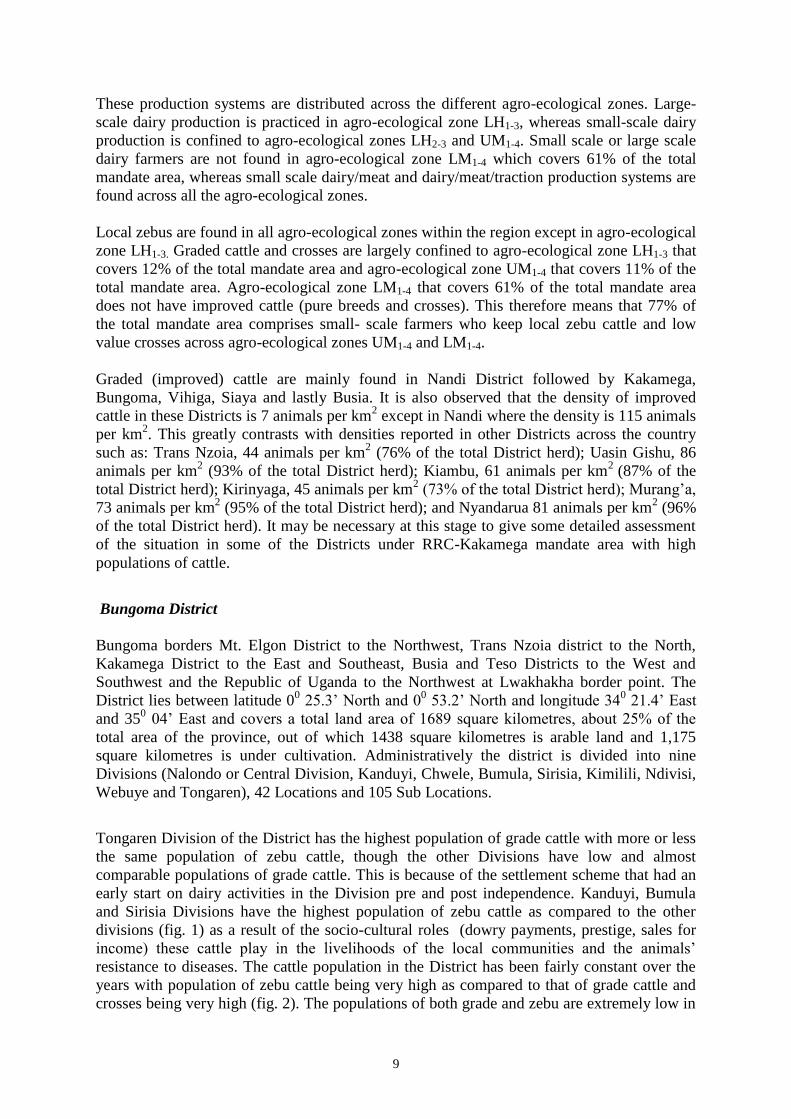
Tongaren Division of the District has the highest population of grade cattle with more or less
the same population of zebu cattle, though the other Divisions have low and almost
comparable populations of grade cattle. This is because of the settlement scheme that had an
early start on dairy activities in the Division pre and post independence. Kanduyi, Bumula
and Sirisia Divisions have the highest population of zebu cattle as compared to the other
divisions (fig. 1) as a result of the socio-cultural roles (dowry payments, prestige, sales for
income) these cattle play in the livelihoods of the local communities and the animals’
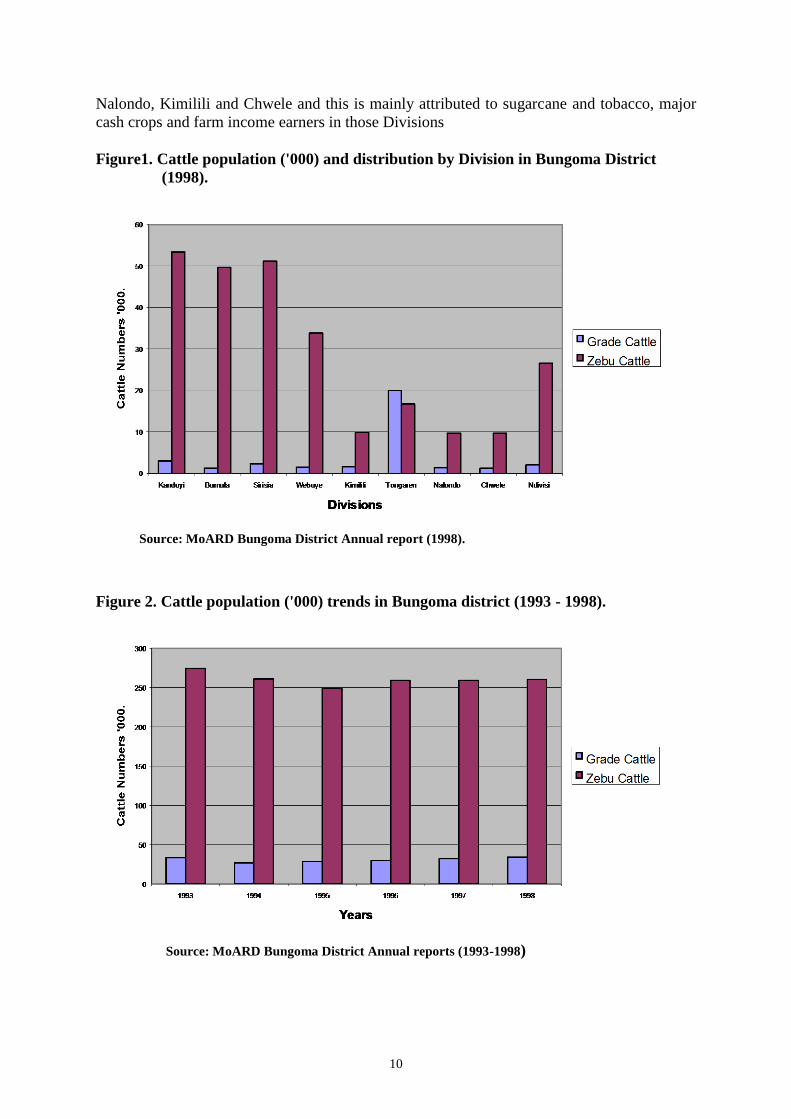
resistance to diseases. The cattle population in the District has been fairly constant over the
years with population of zebu cattle being very high as compared to that of grade cattle and
crosses being very high (fig. 2). The populations of both grade and zebu are extremely low in
10
Nalondo, Kimilili and Chwele and this is mainly attributed to sugarcane and tobacco, major
cash crops and farm income earners in those Divisions
Figure1. Cattle population ('000) and distribution by Division in Bungoma District
(1998).
Source: MoARD Bungoma District Annual report (1998).
Figure 2. Cattle population ('000) trends in Bungoma district (1993 - 1998).
Source: MoARD Bungoma District Annual reports (1993-1998)
11
Nandi District
Nandi district is one of the districts in the Rift valley province and falls within RRC-
Kakamega regional mandate. Uasin gishu District to the North and East, Vihiga, Kakamega
and Lugari Districts to the West and Kericho and Kisumu Districts to the South border the
district. It falls in the high potential region with a surface area of 1926 square kilometres of
which 1401 sq. Km. is arable land. Forests, rocks, water and swamps cover the rest of the
land. It has an average land size of about 7 acres per household (District Development Plan,
1997-2001). Administratively the District is divided into nine divisions (Kapsabet, Kilibwoni,
Nandi hiils, Aldai, Kaptumo, Kosirai, Kabiyet, Kipkarren and Tindiret), 91 Locations and
283 Sub Locations.
The District is predominantly dairying with farmers keeping pure breed dairy cattle and high
grade crosses with tea as the main cash crop. Zebu cattle are, however, still kept in the lower
parts of the District neighboring Kisumu District, where sugar cane as a cash crop is grown.
Cattle management in the District is mostly by grazing and semi-zero grazing with zero
grazing on few farms. Development in the dairy industry in Nandi District unlike in the other
Districts within the region could be attributed to the presence of Kenya co-operative
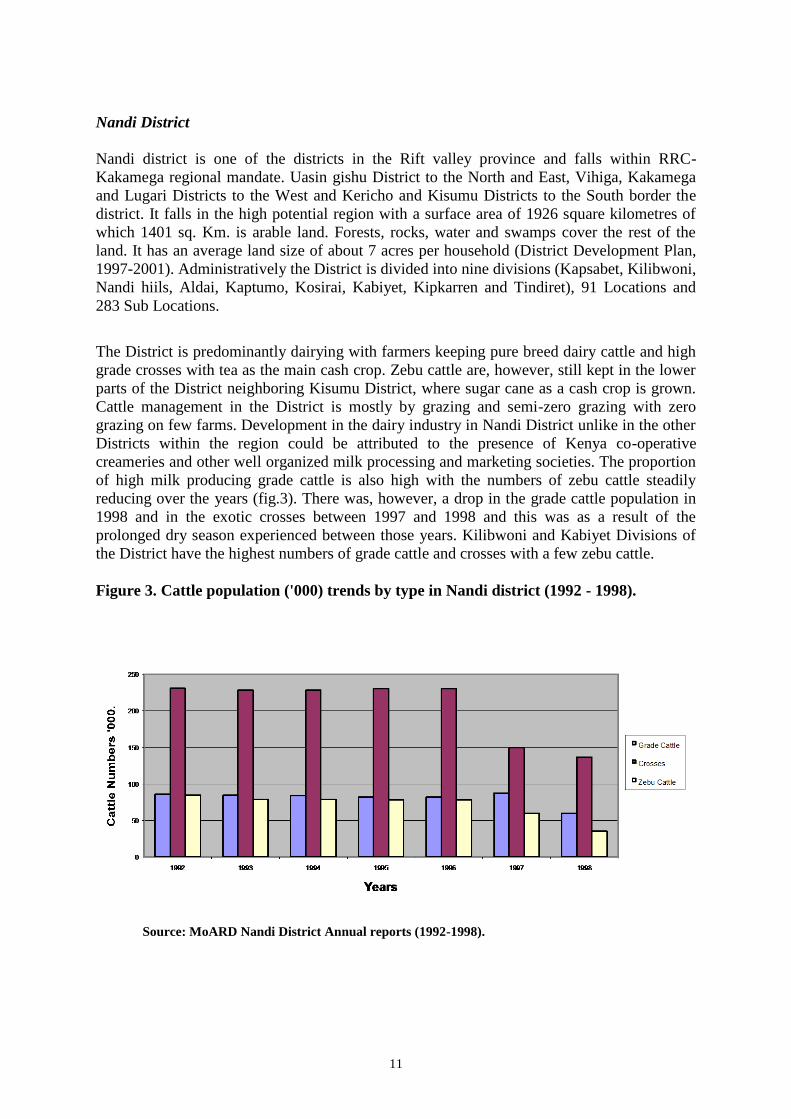
creameries and other well organized milk processing and marketing societies. The proportion
of high milk producing grade cattle is also high with the numbers of zebu cattle steadily
reducing over the years (fig.3). There was, however, a drop in the grade cattle population in
1998 and in the exotic crosses between 1997 and 1998 and this was as a result of the
prolonged dry season experienced between those years. Kilibwoni and Kabiyet Divisions of
the District have the highest numbers of grade cattle and crosses with a few zebu cattle.
Figure 3. Cattle population ('000) trends by type in Nandi district (1992 - 1998).
Source: MoARD Nandi District Annual reports (1992-1998).
12
Kakamega District
Kakamega District borders Vihiga District to the South, Nandi and Uasin gishu Districts to
the East, Trans nzoia and Lugari Districts to the North and Bungoma, Busia, Butere/Mumias
and Siaya Districts to the West. The District lies between longitudes 340 20’ and 350Eand
latitudes 00 15’ and 10N of the equator. Administratively, it is divided into seven (7)
Divisions, namely; Municipality, Ikolomani, Lurambi, Navakholo, Ileho, Shinyalu and
Kabras; 23 Locations and 82 Sub-locations.
The District covers a total land area of 916 square kilometres of which 879 sq. Km. is arable
land and 37 sq. Km. is covered by Kakamega Forest. The District has about 100,760 farm
families with an average family size of 8 persons per household and a mean farm size of 0.8
hectares (1.5 acres).
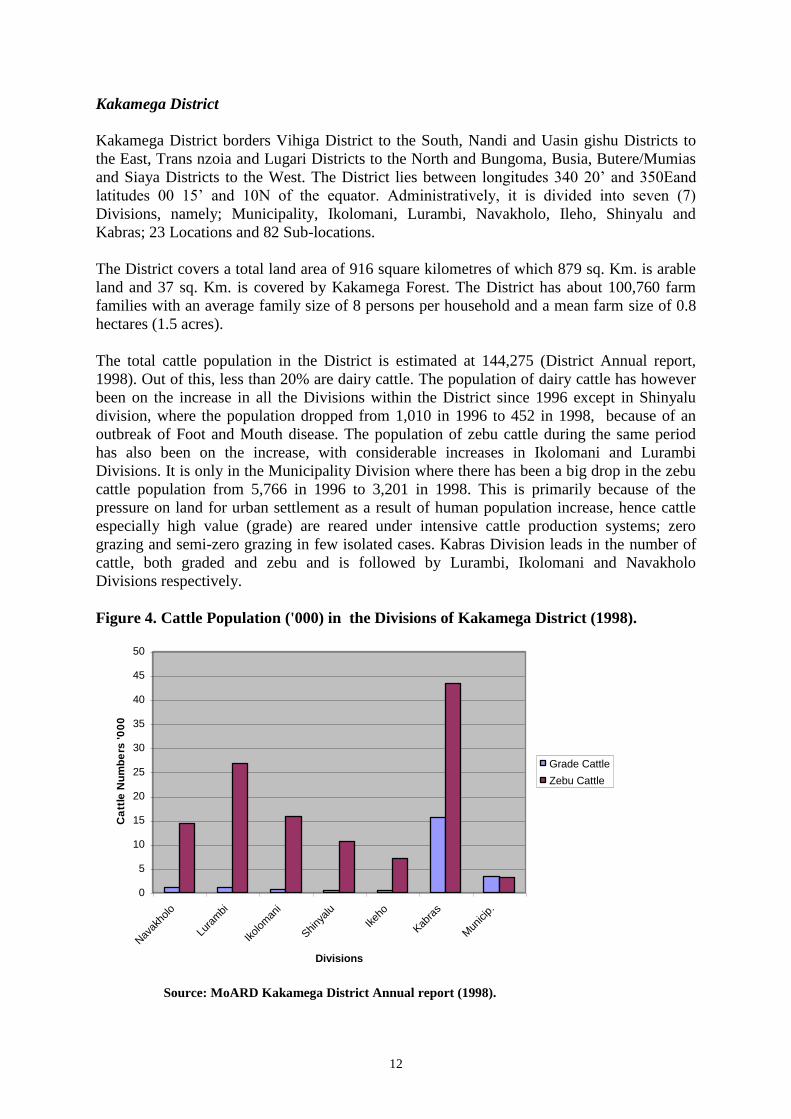
The total cattle population in the District is estimated at 144,275 (District Annual report,
1998). Out of this, less than 20% are dairy cattle. The population of dairy cattle has however
been on the increase in all the Divisions within the District since 1996 except in Shinyalu
division, where the population dropped from 1,010 in 1996 to 452 in 1998, because of an
outbreak of Foot and Mouth disease. The population of zebu cattle during the same period
has also been on the increase, with considerable increases in Ikolomani and Lurambi
Divisions. It is only in the Municipality Division where there has been a big drop in the zebu
cattle population from 5,766 in 1996 to 3,201 in 1998. This is primarily because of the
pressure on land for urban settlement as a result of human population increase, hence cattle
especially high value (grade) are reared under intensive cattle production systems; zero
grazing and semi-zero grazing in few isolated cases. Kabras Division leads in the number of
cattle, both graded and zebu and is followed by Lurambi, Ikolomani and Navakholo
Divisions respectively.
Figure 4. Cattle Population ('000) in the Divisions of Kakamega District (1998).
0
5
10
15
20
25
30
35
40
45
50
Nav
akho
lo
Lura
mbi
Ikol
oman
i
Shiny
alu
Ikeh
o
Kab
ras
Mun
icip
.
Divisions
Ca
ttle
Nu
mb
ers
'0
00
.
Grade Cattle
Zebu Cattle
Source: MoARD Kakamega District Annual report (1998).
13
Vihiga District
Vihiga District was curved out of Kakamega District in 1991 and now forms one of the eight
Districts in Western Province. It borders Kakamega District to the North, Nandi District to
the East, Kisumu District to the South and Siaya District to the South West. The District lies
between longitude 340 30’ East and 35
0 0’ East and between longitude 0
0 and 0
0 15’ North.
The Equator cuts across the southern tip of the District. The District is 33 km wide from East
to West and 19 km from North to South and occupies a total land area of 408 sq. km (District
Development Plan, 1997-2001).
The District has about 75,000 farm families, with an average population density of 1050
persons per sq. km. The average family size is 8 persons per household with a mean farm size
of 0.6ha (1.2 acres) (1989 Population Census Report). Administratively, the District is
divided into six Divisions namely; Emuhaya, Luanda, Sabatia, Tiriki East, Tiriki West and
Vihiga, that are further sub-divided into 27 Locations and 115 sub locations.
Due to lack of good quality feeds for exotic dairy cattle and their crosses and small size of
land holdings, most farmers in the District still prefer to keep the local stock. There is
however a shift towards intensive cattle production systems.
Ministry of Agriculture Rural Development reports from Vihiga District MoARD Annual
Reports 1997-1999) shows that the cattle population in the district rose from a total of
135,350 in 1997 to 146,492 in 1998, representing an increase of about 8% (Appendix 1). By
1999, there was however a drop of 9% in the cattle population to a total of 133,109, the drop
being mainly in the total population of Zebu cattle compared to the Grade cattle (Appendix
1). The major drop occurred in Sabatia division. Implying that there has been a departure
from keeping indigenous breeds of cattle by some farmers in the District mainly due to the
limited land space and the realization of benefits of keeping high value stock. There is no
land in the District for communal grazing and the zebu cattle kept are restricted to owner’s
plots.
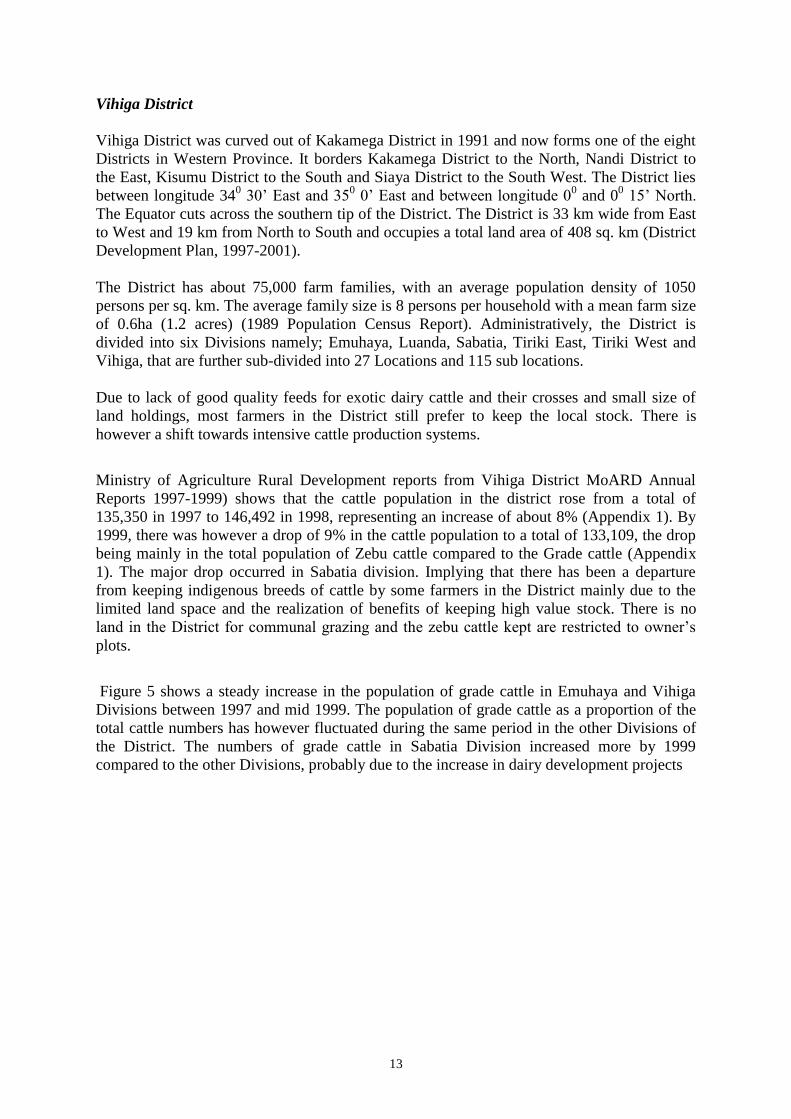
Figure 5 shows a steady increase in the population of grade cattle in Emuhaya and Vihiga
Divisions between 1997 and mid 1999. The population of grade cattle as a proportion of the
total cattle numbers has however fluctuated during the same period in the other Divisions of
the District. The numbers of grade cattle in Sabatia Division increased more by 1999
compared to the other Divisions, probably due to the increase in dairy development projects
14
Figure 5: Grade cattle population ('000) trends per Division in Vihiga District (1997-
1999)
Source: MoARD Vihiga District Annual Reports (1997-1999).
2.2 Cattle breeding programmes within the region
The main breeding systems are by natural service either using improved bulls introduced by
various cattle development projects or the bulls and Artificial Insemination.
2.2.1 Artificial Insemination
This is very popular with farmers in the region and the service is being rendered by both the
government and private groups. Artificial insemination services in the region have, however,
not fared well because farmers opt to use natural service due to costs involved. The farmers
find AI services expensive at the range of KSH 300 to 2000 depending on the quality and
source of the semen and transport charges. Natural service dominates using locally owned
bulls and bull schemes set up by the Livestock development project (LDP), Heifer Project
International (HPI) and a few other Non governmental organizations (NGO) projects. Their
impact for improving the dairy genotype is, however, so far low. The tables 5 and 6 below
show the recorded inseminations for each scheme as offered by both the government and
private groups in Vihiga, Bungoma, Nandi and Kakamega Districts, while table 7 shows
semen distribution by cattle breeds in the same Districts.
15
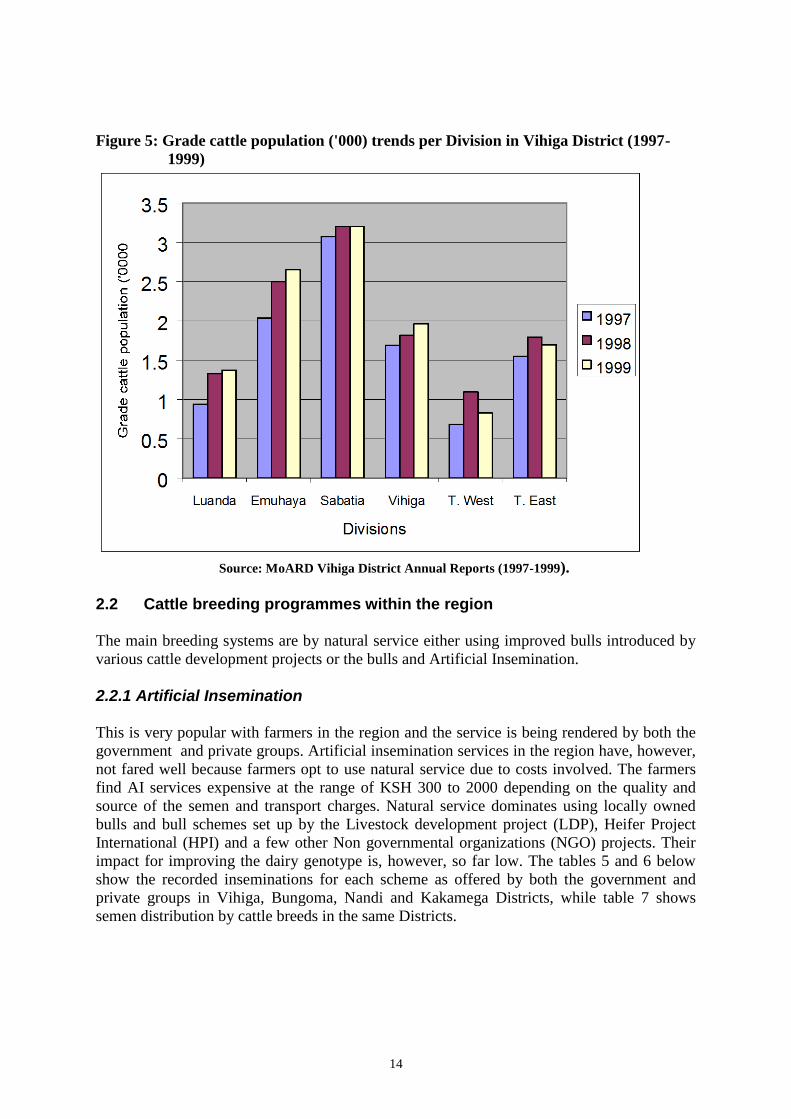
Table 5. Government recorded inseminations per scheme (1998).
Station Grade Cattle Zebu Cattle Total Grand
Total
First
service
Repea
t
First
Service
Repeat First
Service
Repeat
Kakamega 556 280 44 08 600 288 888
Bungoma 583 260 103 13 686 273 959
Vihiga 682 138 116 34 788 174 963
Nandi 498 144 - - 498 144 642
Total 2319 822 263 55 2572 879 3451
Source: Western Province. AI report, 1998.
Table 6. Private schemes recorded inseminations (1998).
Scheme (District) Grade Cattle Zebu Cattle Total
1st Service Repeat 1st Service Repeat
MOCO (Kakamega) 938 258 136 48 1380
KARI (Kakamega) 18 8 nil nil 26
Esabalu (Vihiga) 179 20 14 - 213
Lessos FCS (Nandi) 529 103 - - 632
Kamno FCS (Nandi) 347 101 - - 448
Tambache Malugei
(Nandi)
69 1 - - 70
Kopoch Farm 27 1 - - 28
Total 2107 498 150 48 2849
Source: Western Province. AI report, 1998.
Note: Private artificial insemination services recorded for Nandi District excludes those
offered by the University of Eastern Africa (Baraton), Kibabet Tea Estate and the American
Breeding Services (ABS) based in Sabatia Division of Vihiga District.
16
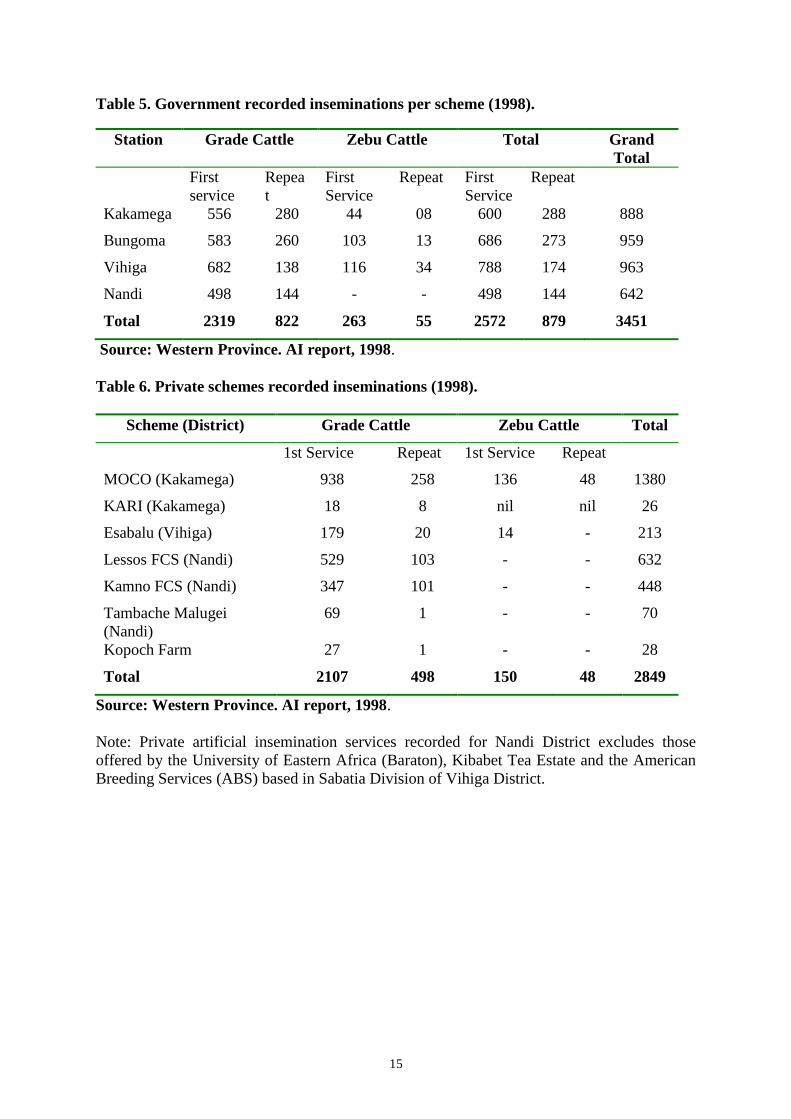
Table 7. Semen distribution by cattle breed in Bungoma, Vihiga and Kakamega
Districts (1998).
Station Ayrshire Friesian Guernsey Jersey Boran Sahiwal Brown
Swiss
Total
Vihiga 641 493 635 507 nil nil nil 2270
Bungoma 409 399 283 175 nil 7 nil 1339
Kakameg
a
357 206 269 56 nil nil nil 888
Nandi 275 250 76 41 nil nil nil 642
Total 1682 1348 989 779 nil 7 nil 5239
Source: Western Province. AI report, 1998.
However, a number of problems hinder proper delivery and expansion of artificial
insemination services in the region and these include;
a) Lack of proper transport modes and poor road networks limiting accessibility
to farmers on time after heat detection.
b) Lack of A.I containers i.e. they are not readily available in the market and the
ones which are there are expensive hence not easily affordable.
c) Acquisition of A.I resources (semen) from C.A.I.S in Nairobi i.e. it is difficult
to get these resources from there due to the distance and this increases the
insemination costs rendering it unaffordable to most farmers.
d) Insufficient knowledge on management of fertility of dairy cows by the
farmers.
e) Few technically competent inseminators employed by the groups.
2.2.2 Bull Schemes
There are quite a number of bull schemes established by the government through Livestock
Development Project in Bungoma, Vihiga and Kakamega Districts to help improve the
genetic potential of animals for increased milk production. In addition there are also privately
owned bulls for the same.
2.2.3 Contract Mating
Mukumu farm in Kakamega District has Guernsey animals and operates a contract-mating
scheme with semen imported from the United States of America (U.S.A) through the Central
Artificial Insemination Station (C.A.I.S) in Nairobi. The imported semen is used for contract
mating dams selected by the bull purchasing committee on the farm. The farm was
established in 1927 by the Catholic Church and sells Guernsey animals to farmers in the
region.
2.2.4 Progeny Testing
Bukura Farmers Training Centre and Bukura Agricultural College in Kakamega District and
Mabanga Farmers Training Centre in Bungoma District carry this out on Aryshire breed of
cattle, though on small scale.
17
2.3 Cattle Diseases
Cattle Diseases and pests have been identified as a major constraint to increased cattle
productivity in the region (NARPII inception report, 1995). To realize optimum productive
and reproductive performance from these cattle, it is vital to enhance efforts on disease
control and pest management. Currently, the region is characterized by poor disease control
strategies resulting into high morbidity and mortality of both the young and adult stock
(District Annual reports, 1998). This is largely due to the high cost of veterinary drugs and
deterioration in the quality of animal health care delivery systems in the region over the
years.
The most prevalent cattle diseases in Bungoma, Kakamega, Nandi and Vihiga Districts
include:
a) Tick Borne Diseases - East Coast Fever (ECF), Anaplasmosis, Babesiosis,
Heart water and Black Quarter.
b) Worm infestations.
c) Nutritional and Metabolic disorders - Milk fever, Bloat and Avitaminoses.
d) Lumpy Skin Disease (LSD).
e) Mastitis.
f) Respiratory Disease ie Pneumonia, especially in young stock.
g) Helminthiasis - both worm and liver fluke infestation.
h) Foot and Mouth Disease (FMD).
Most communal cattle dips are non operational after the government withdrew their funding
and left them to community initiative and management. Also high costs of accaricides has
rendered them unaffordable by most small scale rural farmers in these areas. There are also
no strategic and pre-determined vaccination campaigns against the various notifiable cattle
diseases. It is therefore necessary to adopt an integrated approach (making optimal use of all
the available control methods in a flexible way adopted to the local circumstances and to
economic reality) in the management of these cattle diseases and pests. Also integration of
locally available materials and technology (Indigenous Technical Knowledge) in control and
treatment of these diseases is bound to reduce the costs and enhance sustainability.
2.4 Cattle feed resources and utilization
Dairy farming in RRC-Kakamega mandate region is mostly practiced under rain-fed
conditions. The uneven rainfall distribution pattern across the agro-ecological zones
influences the availability and quality of forages. Severe feed shortage in the region is
experienced during the dry seasons between the months of December and February and
during this time there is increased concentrates (bran, dairy meal, local brewers waste,
molasses and spoilt maize) and crop by products (Stover, banana pseudo stems, sugar cane
tops, sweet potato vines, bean hauls etc) usage. However during the wet seasons dairy cows
are constrained by low intake owing to the high moisture content of grass based diets even
though total available dry matter may be adequate in nutritional value. Smallholder dairy
farmers in the region rarely practice any form of feed (pasture and fodder) conservation
during this time when there are plenty of forages.
18
Dairy producers in high rainfall areas of the region depend almost entirely on Napier grass as
the feed resource during the wet season and on crop residues during the dry season. Little
commercial concentrates are used due to the high cost and in, some areas their unavailability.
Technology to introduce forage legumes to improve quality and utilization of these grasses
has not been adequately disseminated in most areas.
Currently, the pressure on land is increasing due to sub divisions and hence the feed resource
production will need to be intensified to sustain dairying. Certain areas are characterized by
frequent night frosts, especially during the cold months, others are water logged in rainy
seasons, whilst other areas have low and erratic rainfall with frequent droughts. Adopted
forages of high productivity need to be developed for these specific ecological niches.
Systems of utilization to maximize nutrient intake by dairy cows from these feed resources
are equally lacking.
It is therefore necessary to adopt technologies that could be used to improve on the feed
quality and increase herbage production per unit land for the dairy enterprise. Ideally, the
concept should be to provide adequate nutrition to the dairy cow, without a net reduction in
food and/or cash crop production.
2.4.1 Vihiga District
The District is characterized by ever diminishing land sizes per household as a result of rapid
human population increase and this remains a major constraint to cattle production. The
forage resource base of the District continues to decline as the available land is put under
crop production, both cash (i.e. tea, coffee) and food crops (i.e. maize, beans) and this limits
the expansion of the dairy herd. There is minimal acreage of land under natural pastures
(improved and unimproved) and in most cases animals will be found tethered or grazing
along road reserves.
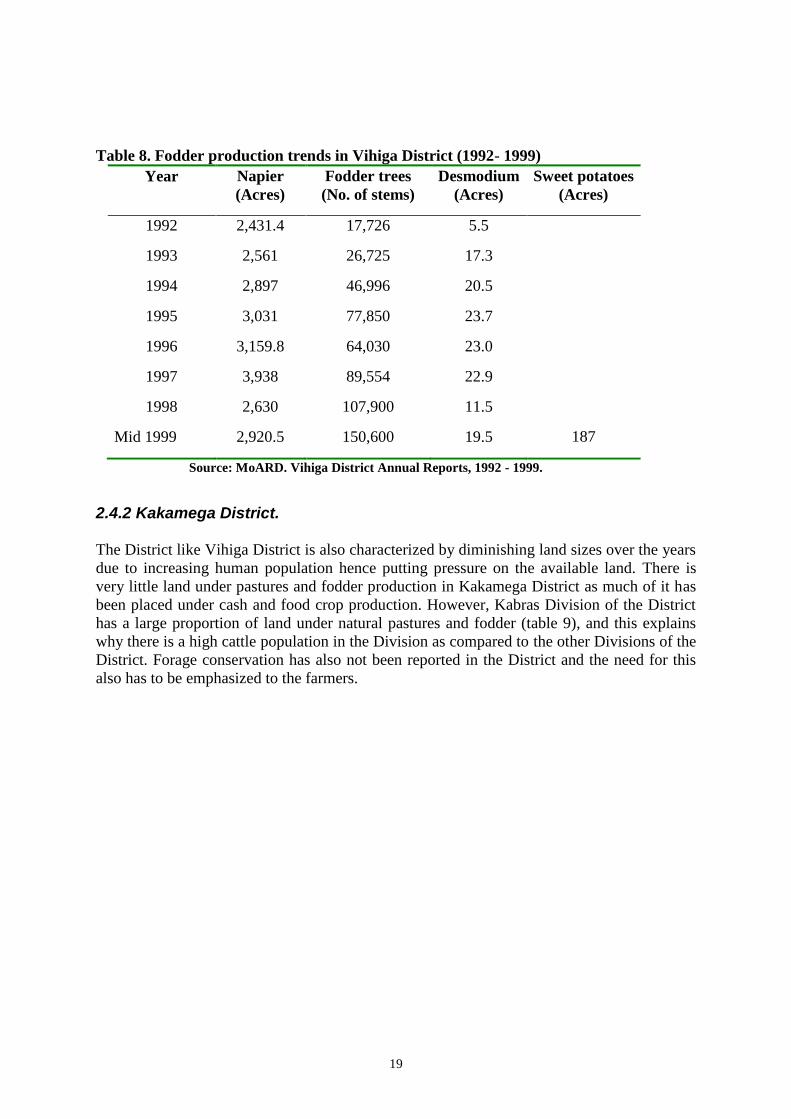
There have been fluctuations in the acreage of land under Napier grass over the years since
1992 (table 8). There is also quite a sizeable proportion of land under sweet potatoes, and this
form a supplementary feed resource for the animals especially during the dry season between
the months of December and February. There is thus a need to emphasize to farmers on the
need for forage conservation to be fed to the animals during the dry season, and also on
appropriate techniques of increasing herbage production per unit area of land without a net
reduction in food and/or cash crop production.
19
Table 8. Fodder production trends in Vihiga District (1992- 1999)
Year Napier
(Acres)
Fodder trees
(No. of stems)
Desmodium
(Acres)
Sweet potatoes
(Acres)
1992 2,431.4 17,726 5.5
1993 2,561 26,725 17.3
1994 2,897 46,996 20.5
1995 3,031 77,850 23.7
1996 3,159.8 64,030 23.0
1997 3,938 89,554 22.9
1998 2,630 107,900 11.5
Mid 1999 2,920.5 150,600 19.5 187
Source: MoARD. Vihiga District Annual Reports, 1992 - 1999.
2.4.2 Kakamega District.
The District like Vihiga District is also characterized by diminishing land sizes over the years
due to increasing human population hence putting pressure on the available land. There is
very little land under pastures and fodder production in Kakamega District as much of it has
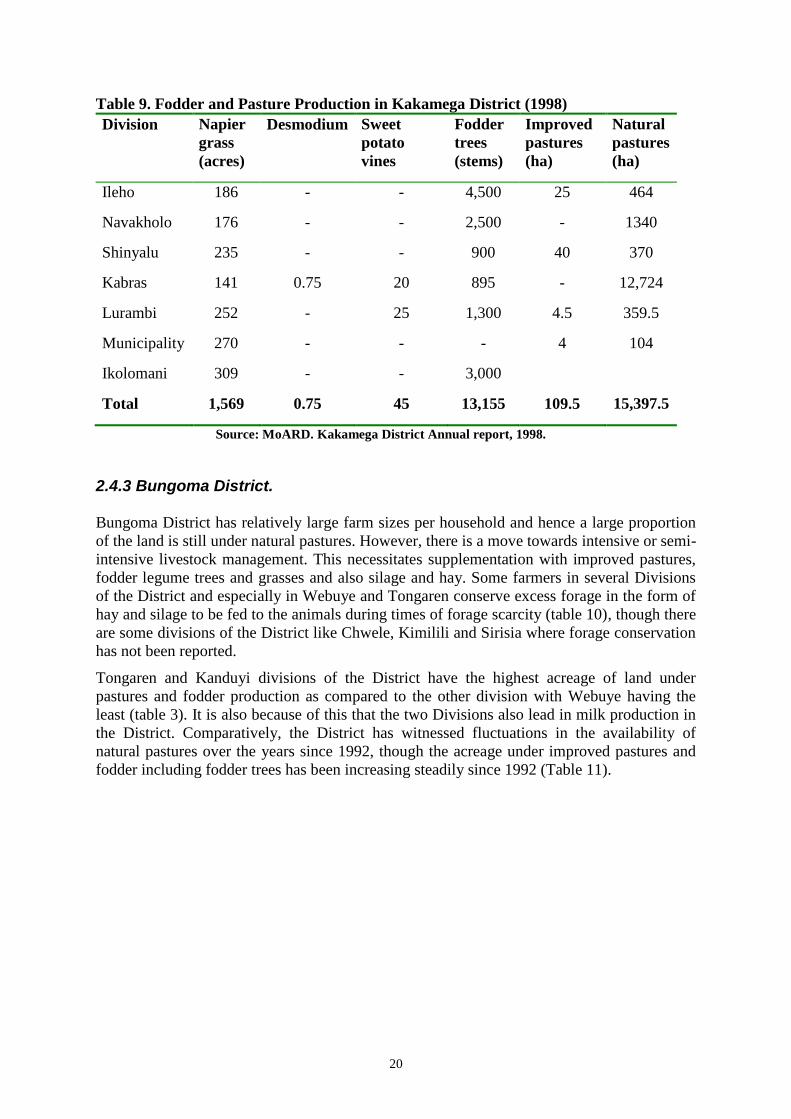
been placed under cash and food crop production. However, Kabras Division of the District
has a large proportion of land under natural pastures and fodder (table 9), and this explains
why there is a high cattle population in the Division as compared to the other Divisions of the
District. Forage conservation has also not been reported in the District and the need for this
also has to be emphasized to the farmers.
20
Table 9. Fodder and Pasture Production in Kakamega District (1998)
Division Napier
grass
(acres)
Desmodium Sweet
potato
vines
Fodder
trees
(stems)
Improved
pastures
(ha)
Natural
pastures
(ha)
Ileho 186 - - 4,500 25 464
Navakholo 176 - - 2,500 - 1340
Shinyalu 235 - - 900 40 370
Kabras 141 0.75 20 895 - 12,724
Lurambi 252 - 25 1,300 4.5 359.5
Municipality 270 - - - 4 104
Ikolomani 309 - - 3,000
Total 1,569 0.75 45 13,155 109.5 15,397.5
Source: MoARD. Kakamega District Annual report, 1998.
2.4.3 Bungoma District.
Bungoma District has relatively large farm sizes per household and hence a large proportion
of the land is still under natural pastures. However, there is a move towards intensive or semi-
intensive livestock management. This necessitates supplementation with improved pastures,
fodder legume trees and grasses and also silage and hay. Some farmers in several Divisions
of the District and especially in Webuye and Tongaren conserve excess forage in the form of
hay and silage to be fed to the animals during times of forage scarcity (table 10), though there
are some divisions of the District like Chwele, Kimilili and Sirisia where forage conservation
has not been reported.
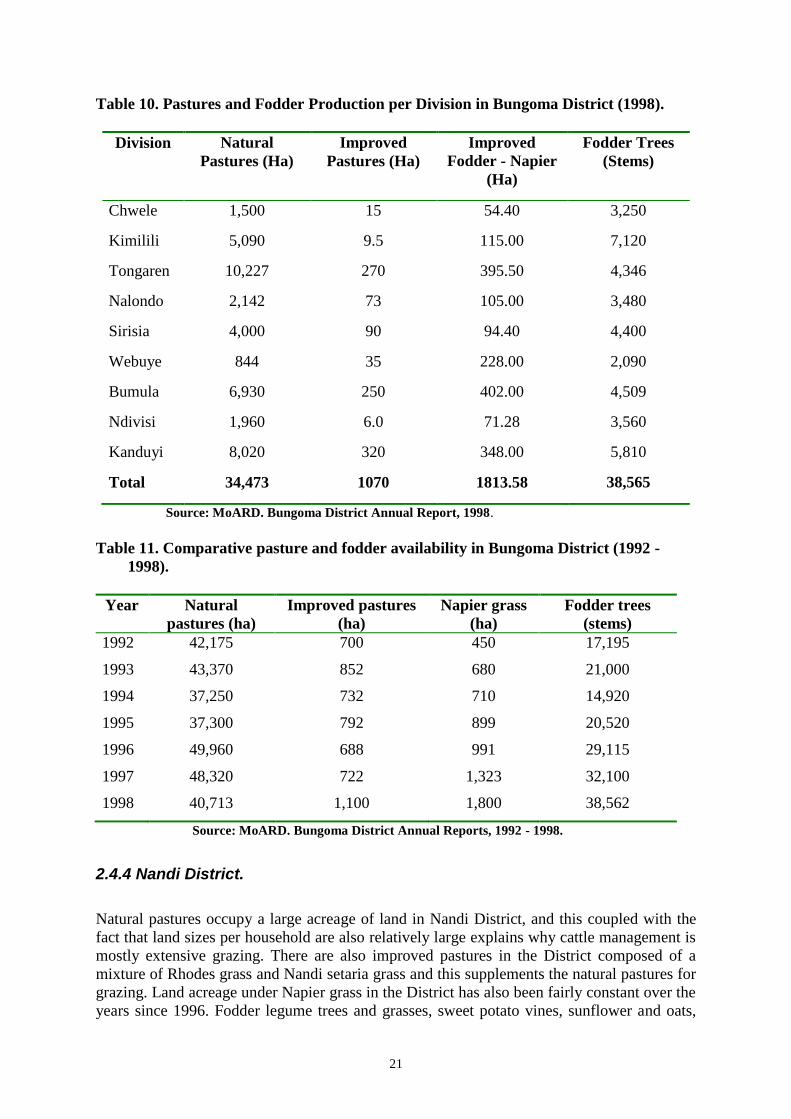
Tongaren and Kanduyi divisions of the District have the highest acreage of land under
pastures and fodder production as compared to the other division with Webuye having the
least (table 3). It is also because of this that the two Divisions also lead in milk production in
the District. Comparatively, the District has witnessed fluctuations in the availability of
natural pastures over the years since 1992, though the acreage under improved pastures and
fodder including fodder trees has been increasing steadily since 1992 (Table 11).
21
Table 10. Pastures and Fodder Production per Division in Bungoma District (1998).
Division Natural
Pastures (Ha)
Improved
Pastures (Ha)
Improved
Fodder - Napier
(Ha)
Fodder Trees
(Stems)
Chwele 1,500 15 54.40 3,250
Kimilili 5,090 9.5 115.00 7,120
Tongaren 10,227 270 395.50 4,346
Nalondo 2,142 73 105.00 3,480
Sirisia 4,000 90 94.40 4,400
Webuye 844 35 228.00 2,090
Bumula 6,930 250 402.00 4,509
Ndivisi 1,960 6.0 71.28 3,560
Kanduyi 8,020 320 348.00 5,810
Total 34,473 1070 1813.58 38,565
Source: MoARD. Bungoma District Annual Report, 1998.
Table 11. Comparative pasture and fodder availability in Bungoma District (1992 -
1998).
Year Natural
pastures (ha)
Improved pastures
(ha)
Napier grass
(ha)
Fodder trees
(stems)
1992 42,175 700 450 17,195
1993 43,370 852 680 21,000
1994 37,250 732 710 14,920
1995 37,300 792 899 20,520
1996 49,960 688 991 29,115
1997 48,320 722 1,323 32,100
1998 40,713 1,100 1,800 38,562
Source: MoARD. Bungoma District Annual Reports, 1992 - 1998.
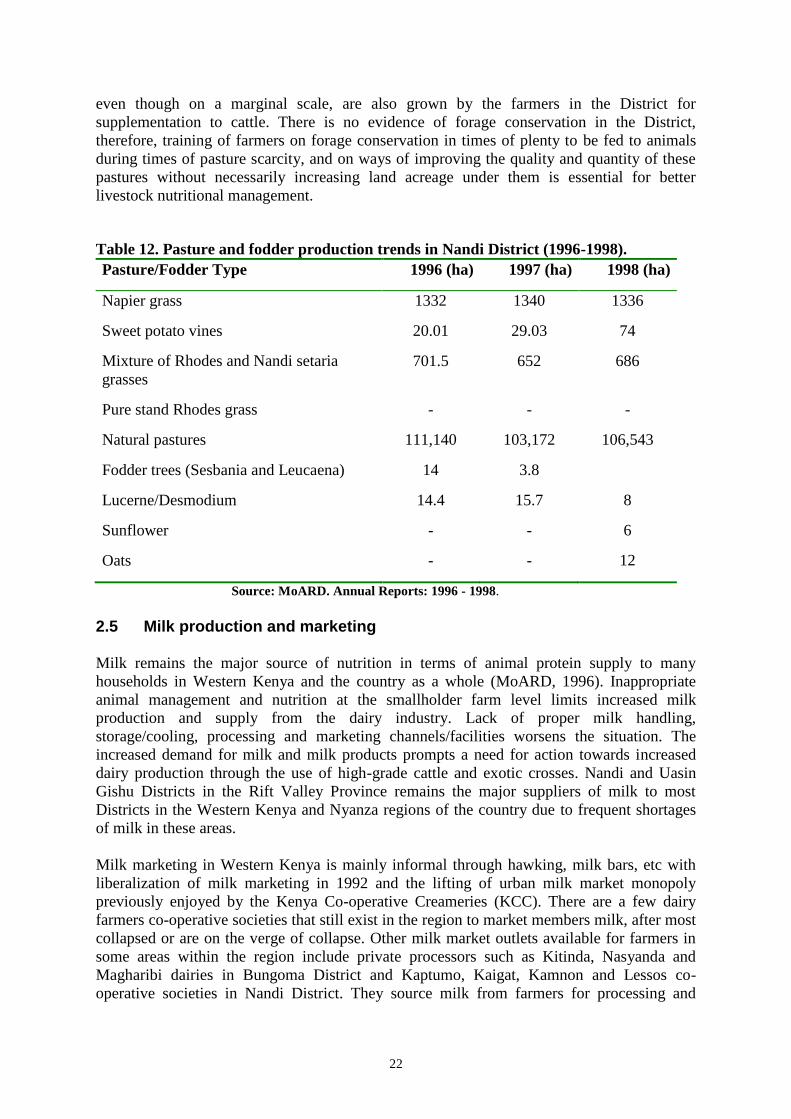
2.4.4 Nandi District.
Natural pastures occupy a large acreage of land in Nandi District, and this coupled with the
fact that land sizes per household are also relatively large explains why cattle management is
mostly extensive grazing. There are also improved pastures in the District composed of a
mixture of Rhodes grass and Nandi setaria grass and this supplements the natural pastures for
grazing. Land acreage under Napier grass in the District has also been fairly constant over the
years since 1996. Fodder legume trees and grasses, sweet potato vines, sunflower and oats,
22
even though on a marginal scale, are also grown by the farmers in the District for
supplementation to cattle. There is no evidence of forage conservation in the District,
therefore, training of farmers on forage conservation in times of plenty to be fed to animals
during times of pasture scarcity, and on ways of improving the quality and quantity of these
pastures without necessarily increasing land acreage under them is essential for better
livestock nutritional management.
Table 12. Pasture and fodder production trends in Nandi District (1996-1998).
Pasture/Fodder Type 1996 (ha) 1997 (ha) 1998 (ha)
Napier grass 1332 1340 1336
Sweet potato vines 20.01 29.03 74
Mixture of Rhodes and Nandi setaria
grasses
701.5 652 686
Pure stand Rhodes grass - - -
Natural pastures 111,140 103,172 106,543
Fodder trees (Sesbania and Leucaena) 14 3.8
Lucerne/Desmodium 14.4 15.7 8
Sunflower - - 6
Oats - - 12
Source: MoARD. Annual Reports: 1996 - 1998.
2.5 Milk production and marketing
Milk remains the major source of nutrition in terms of animal protein supply to many
households in Western Kenya and the country as a whole (MoARD, 1996). Inappropriate
animal management and nutrition at the smallholder farm level limits increased milk
production and supply from the dairy industry. Lack of proper milk handling,
storage/cooling, processing and marketing channels/facilities worsens the situation. The
increased demand for milk and milk products prompts a need for action towards increased
dairy production through the use of high-grade cattle and exotic crosses. Nandi and Uasin
Gishu Districts in the Rift Valley Province remains the major suppliers of milk to most
Districts in the Western Kenya and Nyanza regions of the country due to frequent shortages
of milk in these areas.
Milk marketing in Western Kenya is mainly informal through hawking, milk bars, etc with
liberalization of milk marketing in 1992 and the lifting of urban milk market monopoly
previously enjoyed by the Kenya Co-operative Creameries (KCC). There are a few dairy
farmers co-operative societies that still exist in the region to market members milk, after most
collapsed or are on the verge of collapse. Other milk market outlets available for farmers in
some areas within the region include private processors such as Kitinda, Nasyanda and
Magharibi dairies in Bungoma District and Kaptumo, Kaigat, Kamnon and Lessos co-
operative societies in Nandi District. They source milk from farmers for processing and
23
marketing. KCC is still operational in areas like Nandi where there are two cooling plants in
Kapsabet and Lessos.
Formal milk marketing channels like co-operative societies and processing agencies are less
developed in the region as a result of managerial problems with most being un-operational or
operating under capacity. This results into a lot of milk spoilages and exploitation of small-
scale milk producers by middlemen. The milk disposal outlets include household consumers,
institutions, hotels and restaurants with the price ranging between Kshs 25 to 30 per litre
depending on seasonal fluctuations in milk supply. Quality control measures undertaken by
the Dairy farmers co-operative societies prior to milk intake include use of a lactometer and
match test in some cases. The main constraints that have been cited to hinder the progress of
these co-operative societies include managerial problems and competition from informal milk
market agents.
2.5.1 Vihiga District.
Low acceptability of improved cattle breeds and AI services by smallholder farmers due to
costs involved in various parts of the District has tended to lower the production of milk.
Some farmers, for instance, have continued to keep zebu cattle as opposed to the improved
dairy cows. This is largely attributed to the socio-cultural attachment to the breeds ie dowry
payment, hardiness, prestige etc. This is despite the fact that improved breeds have higher
milk yields, which can support setting up of milk based industries, for processing
fresh/fermented milk, yogurt, ghee, butter, cheese etc. These would easily be marketed within
the region and offer employment opportunities and a chance for appropriate skills
development for the District’s population in the new firms.
Lack of quality animal feeds aggravates the situation. Market skills and information are
poorly developed in that even within the district, people tend not to know areas with effective
demand for their milk products. Coupled with lack of storage facilities and cooling plants
prices tend to fluctuate seasonally, with very low prices being offered to farmers for their
produce. There is also a high demand for credit in the District for dairy development,
however, the District has limited credit facilities and lending institutions, and where
available, the demand for collaterals such as title deeds and high interest rates on loans
offered to the farmers.
There have been high fluctuations in milk production from both the dairy and zebu cattle in
Vihiga District over the period 1995 to 1999 (District Annual Reports, 1995-1999). These
fluctuations could be attributed to seasonality in pasture production, a major feed resource for
cattle in the region, and the need for more land for food crop production than livestock
production, leading to less land under pastures and fodder production. The District has also
witnessed minimal growth in cattle numbers over the years as a result of reduced feed supply
due to land presure. Sabatia Division of the District had the highest milk production levels by
mid 1999, with Tiriki East Division having the least. This may be due to the presence of
many research and extension activities on dairy production in the Division leading to more
uptakes of dairy technologies.
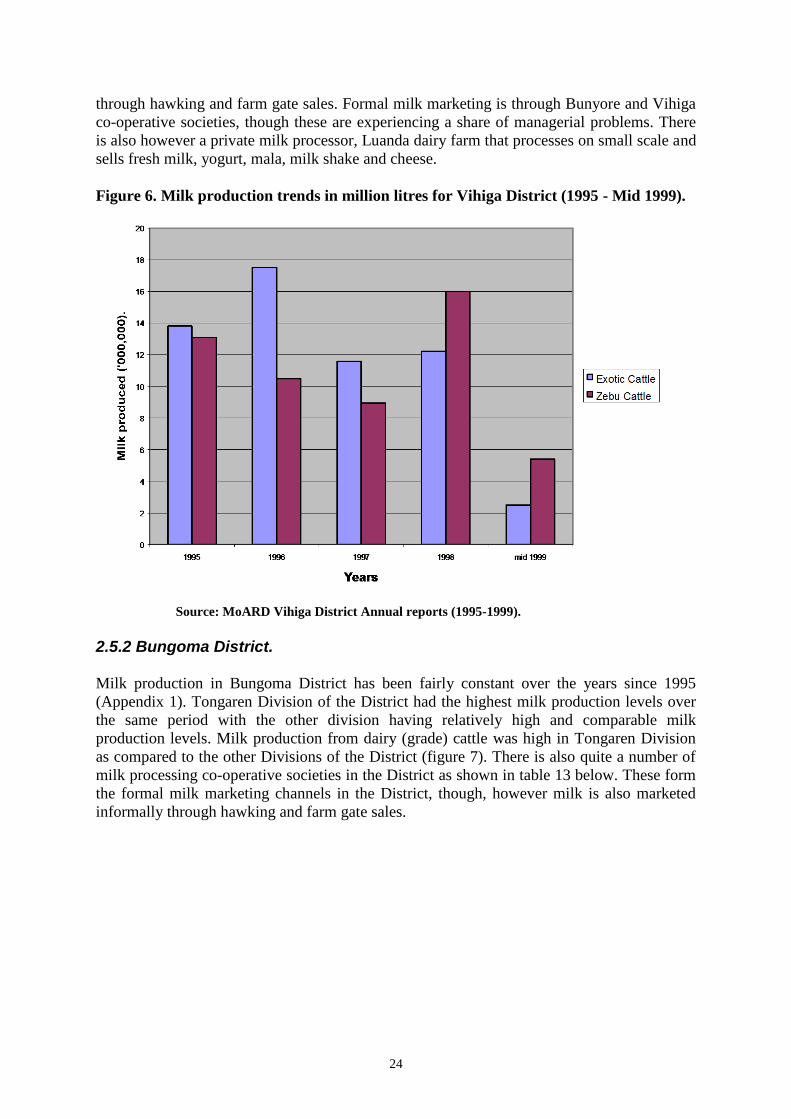
Milk processing and marketing is also not well developed in the District and this limits the
expansion of the dairy industry. This is because of the fewer number of dairy animals kept
and managerial problems of the two co-operative societies i.e. Vihiga and Sabatia that had
been formed to market farmers’ milk. Most of the milk produced is consumed locally within
the District, though however, this is not always enough and more has to be imported from the
neighboring Nandi District that has surplus. Milk in the District is disposed off informally
24
through hawking and farm gate sales. Formal milk marketing is through Bunyore and Vihiga
co-operative societies, though these are experiencing a share of managerial problems. There
is also however a private milk processor, Luanda dairy farm that processes on small scale and
sells fresh milk, yogurt, mala, milk shake and cheese.
Figure 6. Milk production trends in million litres for Vihiga District (1995 - Mid 1999).
Source: MoARD Vihiga District Annual reports (1995-1999).
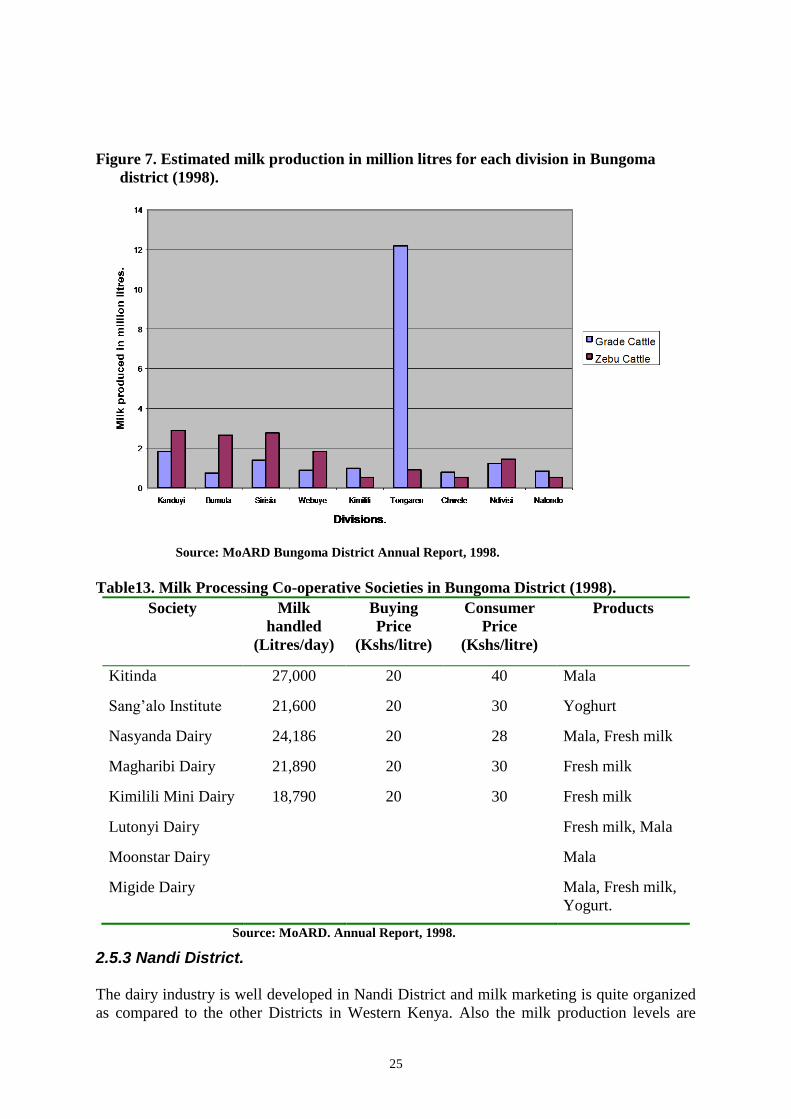
2.5.2 Bungoma District.
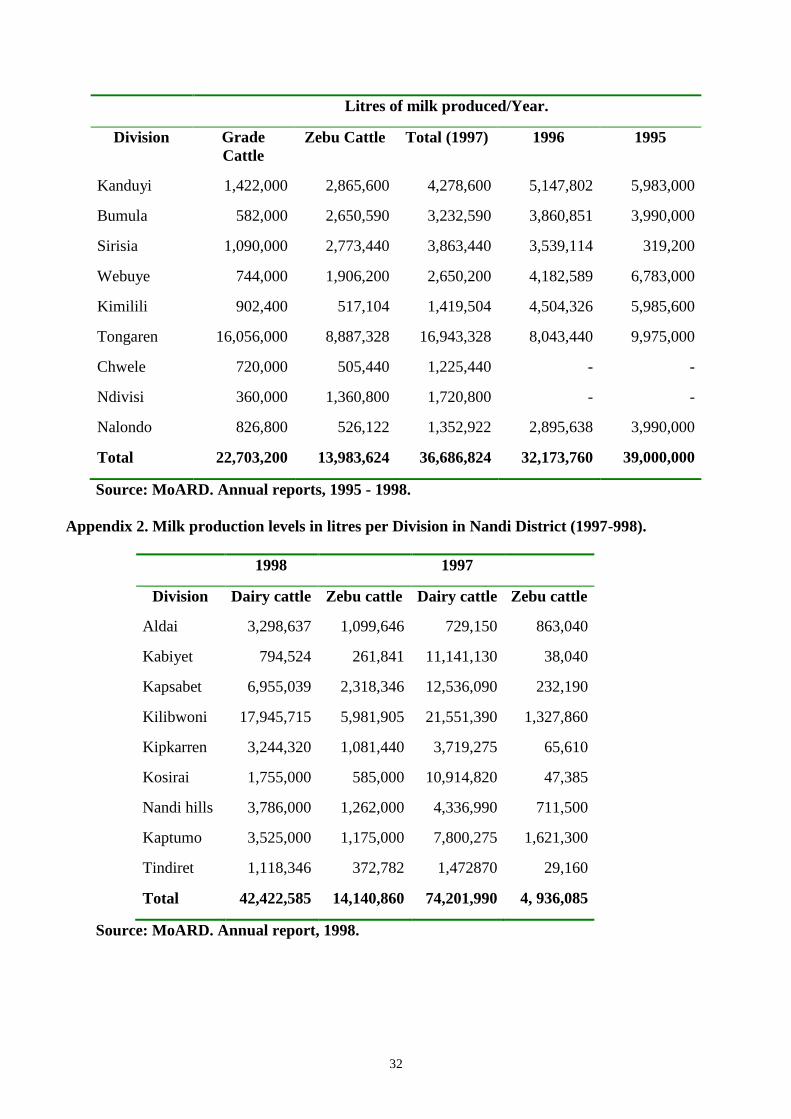
Milk production in Bungoma District has been fairly constant over the years since 1995
(Appendix 1). Tongaren Division of the District had the highest milk production levels over
the same period with the other division having relatively high and comparable milk
production levels. Milk production from dairy (grade) cattle was high in Tongaren Division
as compared to the other Divisions of the District (figure 7). There is also quite a number of
milk processing co-operative societies in the District as shown in table 13 below. These form
the formal milk marketing channels in the District, though, however milk is also marketed
informally through hawking and farm gate sales.
25
Figure 7. Estimated milk production in million litres for each division in Bungoma
district (1998).
Source: MoARD Bungoma District Annual Report, 1998.
Table13. Milk Processing Co-operative Societies in Bungoma District (1998).
Society Milk
handled
(Litres/day)
Buying
Price
(Kshs/litre)
Consumer
Price
(Kshs/litre)
Products
Kitinda 27,000 20 40 Mala
Sang’alo Institute 21,600 20 30 Yoghurt
Nasyanda Dairy 24,186 20 28 Mala, Fresh milk
Magharibi Dairy 21,890 20 30 Fresh milk
Kimilili Mini Dairy 18,790 20 30 Fresh milk
Lutonyi Dairy Fresh milk, Mala
Moonstar Dairy Mala
Migide Dairy Mala, Fresh milk,
Yogurt.
Source: MoARD. Annual Report, 1998.
2.5.3 Nandi District.
The dairy industry is well developed in Nandi District and milk marketing is quite organized
as compared to the other Districts in Western Kenya. Also the milk production levels are
26
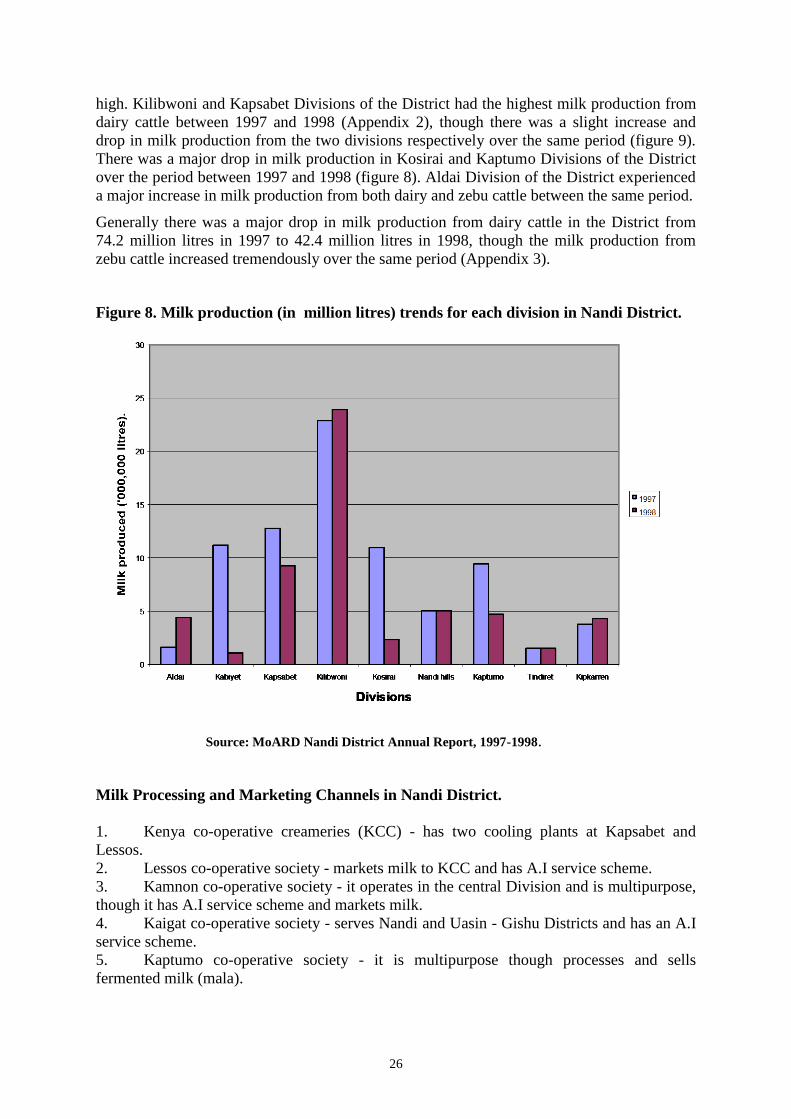
high. Kilibwoni and Kapsabet Divisions of the District had the highest milk production from
dairy cattle between 1997 and 1998 (Appendix 2), though there was a slight increase and
drop in milk production from the two divisions respectively over the same period (figure 9).
There was a major drop in milk production in Kosirai and Kaptumo Divisions of the District
over the period between 1997 and 1998 (figure 8). Aldai Division of the District experienced
a major increase in milk production from both dairy and zebu cattle between the same period.
Generally there was a major drop in milk production from dairy cattle in the District from
74.2 million litres in 1997 to 42.4 million litres in 1998, though the milk production from
zebu cattle increased tremendously over the same period (Appendix 3).
Figure 8. Milk production (in million litres) trends for each division in Nandi District.
Source: MoARD Nandi District Annual Report, 1997-1998.
Milk Processing and Marketing Channels in Nandi District.
1. Kenya co-operative creameries (KCC) - has two cooling plants at Kapsabet and
Lessos.
2. Lessos co-operative society - markets milk to KCC and has A.I service scheme.
3. Kamnon co-operative society - it operates in the central Division and is multipurpose,
though it has A.I service scheme and markets milk.
4. Kaigat co-operative society - serves Nandi and Uasin - Gishu Districts and has an A.I
service scheme.
5. Kaptumo co-operative society - it is multipurpose though processes and sells
fermented milk (mala).
27
2.6 Constraints to dairy cattle production in the region
Experience within the Regional Research Centre mandate area reveals that biophysical and
socio- economic constraints limit the productive and reproductive potential of the dairy herd
on smallholder farms even though the soils and climate of the region provides a suitable
environment for intensive crop and dairy production. The major constraints include:
a) Inadequacy and poor quality feeds.
b) Unavailability of suitable dairy breeds.
c) High levels of mortality due to diseases and parasites.
d) Poor management/husbandry practices.
e) Reluctance by farmers to direct labour and management efforts from other
farm activities to dairy production.
f) Lack of cash for capital investment in basic infrastructure required for dairy
production.
g) Marketing problems for milk and milk products (poor milk prices, delayed
payments, lack of market etc.)
28
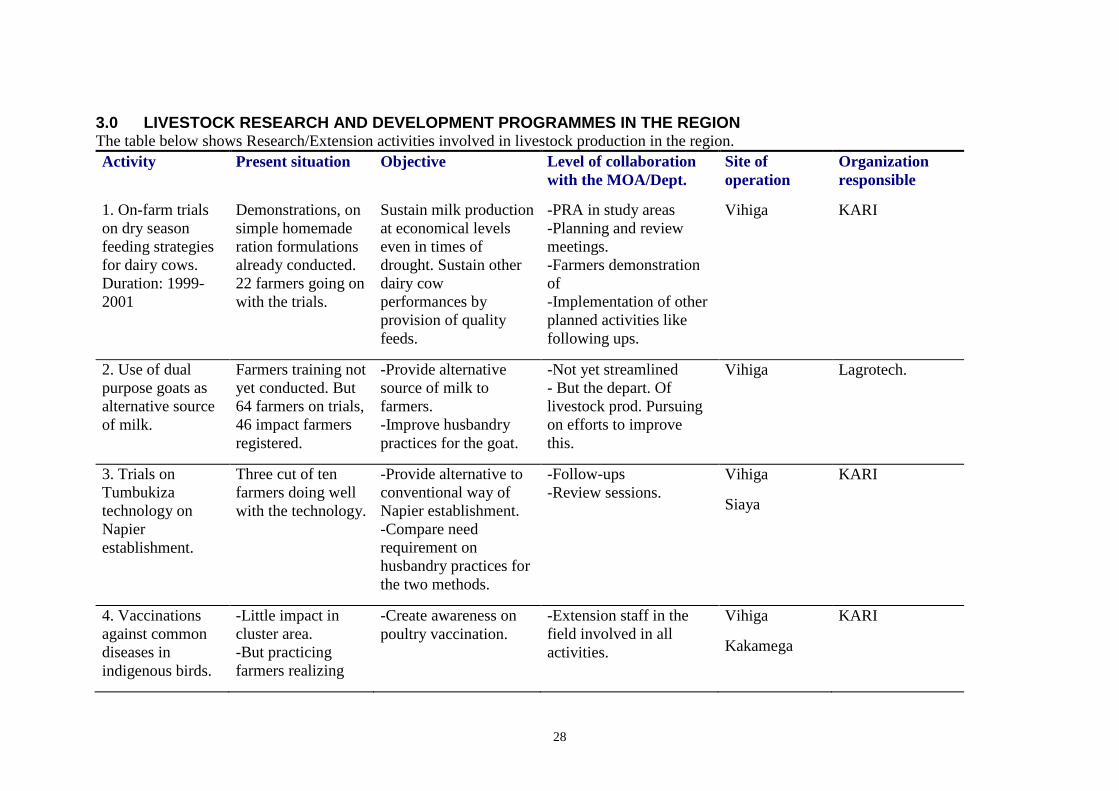
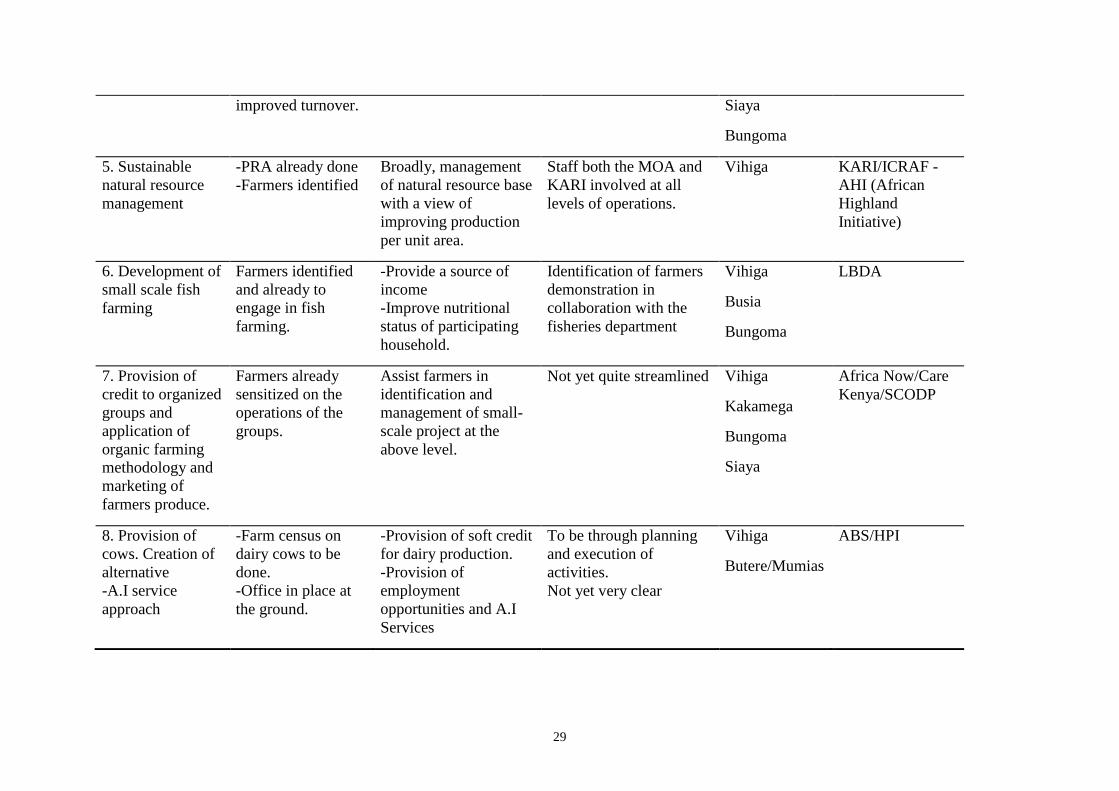
3.0 LIVESTOCK RESEARCH AND DEVELOPMENT PROGRAMMES IN THE REGION The table below shows Research/Extension activities involved in livestock production in the region.
Activity Present situation Objective Level of collaboration
with the MOA/Dept.
Site of
operation
Organization
responsible
1. On-farm trials
on dry season
feeding strategies
for dairy cows.
Duration: 1999-
2001
Demonstrations, on
simple homemade
ration formulations
already conducted.
22 farmers going on
with the trials.
Sustain milk production
at economical levels
even in times of
drought. Sustain other
dairy cow
performances by
provision of quality
feeds.
-PRA in study areas
-Planning and review
meetings.
-Farmers demonstration
of
-Implementation of other
planned activities like
following ups.
Vihiga
KARI
2. Use of dual
purpose goats as
alternative source
of milk.
Farmers training not
yet conducted. But
64 farmers on trials,
46 impact farmers
registered.
-Provide alternative
source of milk to
farmers.
-Improve husbandry
practices for the goat.
-Not yet streamlined
- But the depart. Of
livestock prod. Pursuing
on efforts to improve
this.
Vihiga Lagrotech.
3. Trials on
Tumbukiza
technology on
Napier
establishment.
Three cut of ten
farmers doing well
with the technology.
-Provide alternative to
conventional way of
Napier establishment.
-Compare need
requirement on
husbandry practices for
the two methods.
-Follow-ups
-Review sessions.
Vihiga
Siaya
KARI
4. Vaccinations
against common
diseases in
indigenous birds.
-Little impact in
cluster area.
-But practicing
farmers realizing
-Create awareness on
poultry vaccination.
-Extension staff in the
field involved in all
activities.
Vihiga
Kakamega
KARI
29
improved turnover. Siaya
Bungoma
5. Sustainable
natural resource
management
-PRA already done
-Farmers identified
Broadly, management
of natural resource base
with a view of
improving production
per unit area.
Staff both the MOA and
KARI involved at all
levels of operations.
Vihiga KARI/ICRAF -
AHI (African
Highland
Initiative)
6. Development of
small scale fish
farming
Farmers identified
and already to
engage in fish
farming.
-Provide a source of
income
-Improve nutritional
status of participating
household.
Identification of farmers
demonstration in
collaboration with the
fisheries department
Vihiga
Busia
Bungoma
LBDA
7. Provision of
credit to organized
groups and
application of
organic farming
methodology and
marketing of
farmers produce.
Farmers already
sensitized on the
operations of the
groups.
Assist farmers in
identification and
management of small-
scale project at the
above level.
Not yet quite streamlined Vihiga
Kakamega
Bungoma
Siaya
Africa Now/Care
Kenya/SCODP
8. Provision of
cows. Creation of
alternative
-A.I service
approach
-Farm census on
dairy cows to be
done.
-Office in place at
the ground.
-Provision of soft credit
for dairy production.
-Provision of
employment
opportunities and A.I
Services
To be through planning
and execution of
activities.
Not yet very clear
Vihiga
Butere/Mumias
ABS/HPI
30
4.0 LIVESTOCK EXTENSION SERVICES WITHIN THE REGION
4.1 Ministry of Agriculture and Rural Development (MoARD)
A) Livestock Development Project (LDP)
This project started in 1991 and has been running in phases. Phase 1(1991-1994), Phase II
(1995-June 1998) and Phase III was from July 1998 and is still on going. This project is co-
funded by both the Finish Government and the Kenyan Government and is run under two
ministries, the Ministry of Agriculture and Rural Development and the Ministry of Co-
operative development. In western Kenya it operates in all Districts. However Nandi District
does not have any component of the project.
The main objective of the project is to increase milk production in milk deficit areas. The
main activirty under the project is upgrading of the local cattle by use of grade bulls (Bull
Schemes) through natural services. They also carry out disease control (dips rehabilitation,
issuance of spray pumps on cost sharing basis and community maintained animal health
assistance), forage (fodder and pasture) production through establishment and maintenance of
bulking plots and nurseries, training of farmers and staff, cow from cow rotation scheme
under the women groups and support of dairy co-operatives on milk handling, marketing and