UNITED STATES SECURITIES AND EXCHANGE COMMISSION WASHINGTON, D.C. 20549 FORM 10-Q QUARTERLY REPORT PURSUANT TO SECTION 13 OR 15(d) OF THE SECURITIES EXCHANGE ACT OF 1934 Smart Balance, Inc. (Exact name of registrant as specified in its charter) Registrant’s telephone number, including area code: (201) 568-9300 Indicate by check mark whether the registrant (1) has filed all reports required to be filed by Section 13 or 15(d) of the Securities Exchange Act of 1934 during the preceding 12 months (or for such shorter period that the registrant was required to file such reports), and (2) has been subject to such filing requirements for the past 90 days. Yes No . Indicate by check mark whether the registrant is a large accelerated filer, an accelerated filer, a non-accelerated filer, or a smaller reporting company. See definitions of “large accelerated filer,” “accelerated filer” and “smaller reporting company” in Rule 12b-2 of the Exchange Act. Indicate by check mark whether the registrant is a shell company (as defined in Rule 12b-2 of the Exchange Act). Yes No . As of August 7, 2008 the Registrant had 62,630,683 shares of common stock, par value $.0001 per share, outstanding. For The Quarter Ended June 30, 2008 Commission File Number 000-51506 Delaware 20-2949397 (State of or other jurisdiction of incorporation) (I.R.S. Employer Identification No.) 115 West Century Road, Suite 260, Paramus, New Jersey 07652 (Address of principal executive offices) (Zip code) Large Accelerated Filer £ Accelerated Filer T Non-Accelerated Filer £ (Do not check if a smaller reporting company) Smaller Reporting Company £
Transcript
UNITED STATES
SECURITIES AND EXCHANGE COMMISSION
WASHINGTON, D.C. 20549
FORM 10-Q
QUARTERLY REPORT PURSUANT TO SECTION 13 OR 15(d) OF THE
SECURITIES EXCHANGE ACT OF 1934
Smart Balance, Inc. (Exact name of registrant as specified in its charter)
Registrant’s telephone number, including area code: (201) 568-9300
Indicate by check mark whether the registrant (1) has filed all reports required to be filed by Section 13 or 15(d) of the Securities Exchange Act of 1934 during the preceding 12 months (or for such shorter period that the registrant was required to file such reports), and (2) has been subject to such filing requirements for the past 90 days. Yes No � . Indicate by check mark whether the registrant is a large accelerated filer, an accelerated filer, a non-accelerated filer, or a smaller reporting company. See definitions of “large accelerated filer,” “accelerated filer” and “smaller reporting company” in Rule 12b-2 of the Exchange Act.
Indicate by check mark whether the registrant is a shell company (as defined in Rule 12b-2 of the Exchange Act). Yes � No . As of August 7, 2008 the Registrant had 62,630,683 shares of common stock, par value $.0001 per share, outstanding.
For The Quarter Ended June 30, 2008 Commission File Number 000-51506
Delaware 20-2949397 (State of or other jurisdiction
of incorporation)
(I.R.S. Employer Identification No.)
115 West Century Road, Suite 260, Paramus, New Jersey 07652
(Address of principal executive offices) (Zip code)
Large Accelerated Filer £ Accelerated Filer T Non-Accelerated Filer £ (Do not check if a smaller reporting company) Smaller Reporting Company £
SMART BALANCE, INC.
INDEX
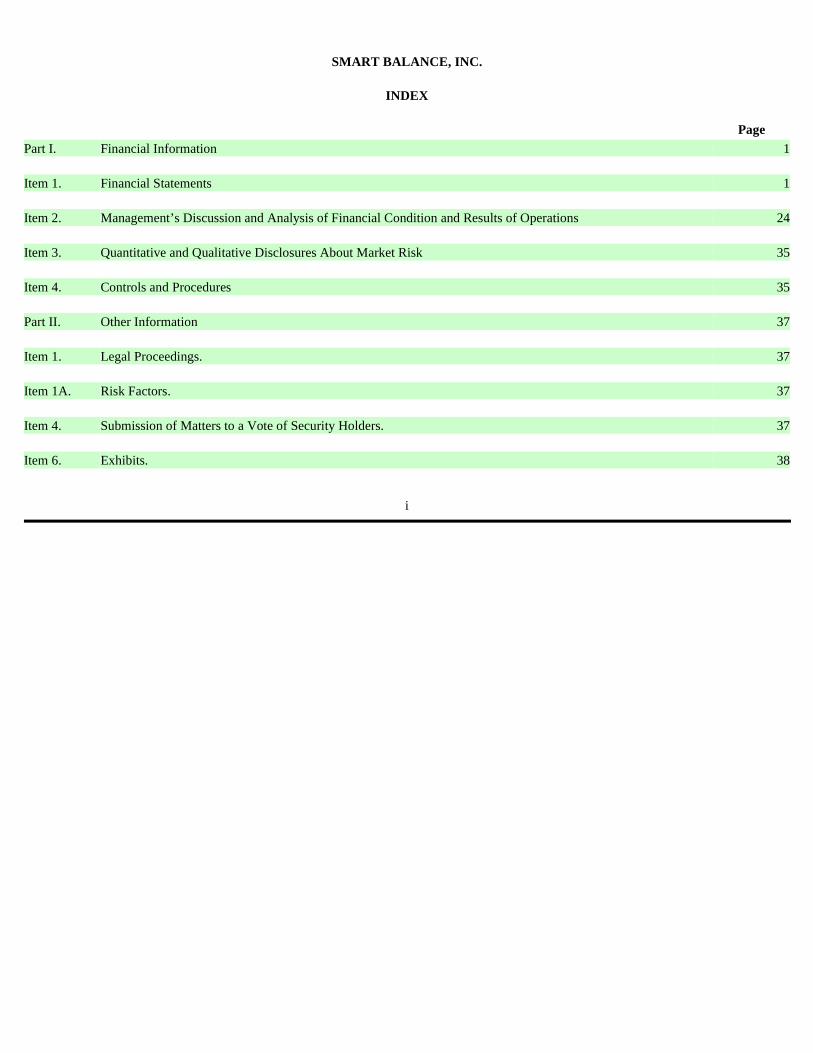
Page Part I. Financial Information 1 Item 1. Financial Statements 1 Item 2. Management’s Discussion and Analysis of Financial Condition and Results of Operations 24 Item 3. Quantitative and Qualitative Disclosures About Market Risk 35 Item 4. Controls and Procedures 35 Part II. Other Information 37 Item 1. Legal Proceedings. 37 Item 1A. Risk Factors. 37 Item 4. Submission of Matters to a Vote of Security Holders. 37 Item 6. Exhibits. 38
i
Part I. Financial Information Item 1. Financial Statements
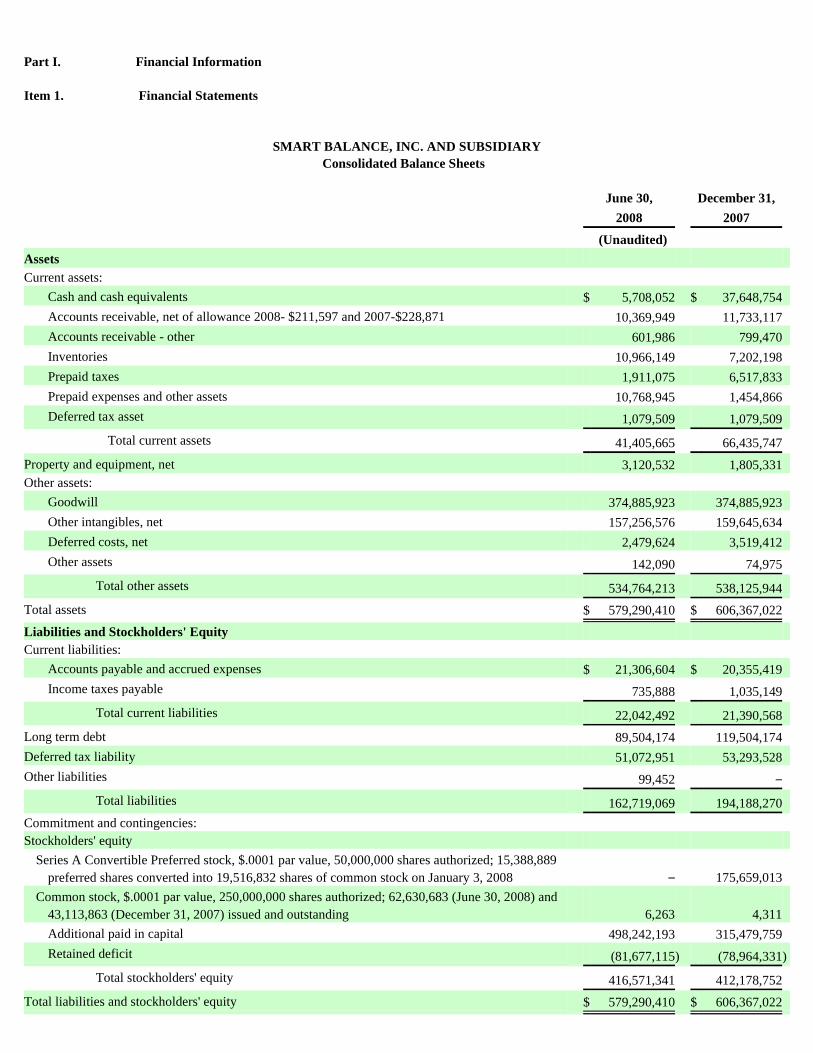
SMART BALANCE, INC. AND SUBSIDIARY Consolidated Balance Sheets
June 30, December 31, 2008 2007 (Unaudited) Assets Current assets:
Cash and cash equivalents $ 5,708,052 $ 37,648,754 Accounts receivable, net of allowance 2008- $211,597 and 2007-$228,871 10,369,949 11,733,117 Accounts receivable - other 601,986 799,470 Inventories 10,966,149 7,202,198 Prepaid taxes 1,911,075 6,517,833 Prepaid expenses and other assets 10,768,945 1,454,866 Deferred tax asset 1,079,509 1,079,509
Total current assets 41,405,665 66,435,747 Property and equipment, net 3,120,532 1,805,331 Other assets:
Goodwill 374,885,923 374,885,923 Other intangibles, net 157,256,576 159,645,634 Deferred costs, net 2,479,624 3,519,412 Other assets 142,090 74,975
Total other assets 534,764,213 538,125,944
Total assets $ 579,290,410 $ 606,367,022 Liabilities and Stockholders' Equity Current liabilities:
Accounts payable and accrued expenses $ 21,306,604 $ 20,355,419 Income taxes payable 735,888 1,035,149
Total current liabilities 22,042,492 21,390,568 Long term debt 89,504,174 119,504,174 Deferred tax liability 51,072,951 53,293,528 Other liabilities 99,452 −
Total liabilities 162,719,069 194,188,270 Commitment and contingencies: Stockholders' equity
Series A Convertible Preferred stock, $.0001 par value, 50,000,000 shares authorized; 15,388,889 preferred shares converted into 19,516,832 shares of common stock on January 3, 2008
− 175,659,013
Common stock, $.0001 par value, 250,000,000 shares authorized; 62,630,683 (June 30, 2008) and 43,113,863 (December 31, 2007) issued and outstanding
6,263 4,311
Additional paid in capital 498,242,193 315,479,759 Retained deficit (81,677,115 ) (78,964,331 )
Total stockholders' equity 416,571,341 412,178,752
Total liabilities and stockholders' equity $ 579,290,410 $ 606,367,022
See accompanying notes to the consolidated financial statements
1
SMART BALANCE, INC. AND SUBSIDIARY
Consolidated Statements of Operations (Unaudited)
See accompanying notes to the consolidated financial statements
Three months ended
June 30, 2008
Three months ended
June 30, 2007
Six Months ended
June 30, 2008
Six Months ended
June 30, 2007 Net sales $ 47,989,930 $ 18,649,243 $ 98,779,785 $ 18,649,243 Cost of goods sold 28,112,737 9,908,083 56,052,905 9,908,083 Gross profit 19,877,193 8,741,160 42,726,880 8,741,160 Operating expenses:
Marketing 7,443,077 3,047,489 14,840,590 3,047,489 Selling 3,902,982 1,640,080 8,111,992 1,640,080 General and administrative 9,031,717 3,449,058 18,314,767 3,796,337
Total operating expenses 20,377,776 8,136,627 41,267,349 8,483,906 Operating (loss) income (500,583 ) 604,533 1,459,531 257,254 Other income (expense):
Interest income 13,006 1,215,847 264,367 2,299,970 Interest expense (1,989,066 ) (2,097,892 ) (5,220,788 ) (2,099,582 ) Loss on derivative liability − (13,102,582 ) − (20,886,694 )
Other income (expense), net (36,697 ) 119,606 (978,716 ) 119,607 Total other income (expense) (2,012,757 ) (13,865,021 ) (5,935,137 ) (20,566,699 )
(Loss) before income taxes (2,513,340 ) (13,260,488 ) (4,475,606 ) (20,309,445 )
(Benefit) provision for income taxes (977,915 ) 393,539 (1,762,822 ) 541,722 Net (loss) $ (1,535,425 ) $ (13,654,027 ) $ (2,712,784 ) $ (20,851,167 )
(Loss) per share:
Basic $ (0.02 ) $ (0.65 ) $ (0.04 ) $ (1.18 )
Diluted $ (0.02 ) $ (0.65 ) $ (0.04 ) $ (1.18 )
Weighted average shares outstanding: Basic 62,630,683 20,848,447 62,415,028 17,620,131
See accompanying notes to the consolidated financial statements
Six months ended
June 30, 2008
Six months ended
June 30, 2007 Cash flows from operating activities
Net (loss) $ (2,712,784 ) $ (20,851,167 )
Adjustments to reconcile net (loss) to net cash provided by operating activities: Depreciation and amortization 3,220,576 544,734 Deferred income taxes (2,220,577 ) (1,593,028 )
Stock based compensation 7,197,377 1,077,279 Increase in derivative liabilities − 20,886,694 Deferred interest income − (432,623 )
Changes in assets and liabilities: Accounts receivable 1,363,168 1,238,909 Inventories (3,763,951 ) (924,281 )
Prepaid expenses and other current assets (4,509,837 ) (68,280 )
Accounts payable and accrued expenses 592,257 (3,415,549 )
Net cash (used in) operating activities (833,771 ) (3,537,312 )
Cash flows from investing activities Purchase of property and equipment (1,457,483 ) (2,306 )
Capitalization/recovery of legal fees 350,552 − Purchase of GFA − (486,132,283 )
Net cash (used in) investing activities (1,106,931 ) (486,134,589 )
Cash flows from financing activities Repayment of debt (30,000,000 ) (300,000 )
Proceeds from issuance of long-term debt − 160,000,000 Proceeds from issuance of common stock − 107,500,000 Proceeds from issuance of preferred stock − 138,500,001 Payments for costs of equity issuance − (12,409,756 )
Payment for acquiring long-term debt facility − (4,666,698 )
Payment of advances from stockholders − (206,276 )
Net cash provided by (used in) financing activities (30,000,000 ) 388,417,271 Net (decrease) in cash for the period (31,940,702 ) (101,254,630 )
Cash - Beginning of period 37,648,754 101,642,753 Cash - End of period $ 5,708,052 $ 388,123 Supplemental disclosure of cash flow information: Cash paid during the period for:
Income taxes $ 716,000 $ 6,127,500
Interest $ 5,211,356 $ 1,975,527 Supplemental disclosure of non-cash activity:
Conversion of Series A Convertible Preferred Stock $ 175,659,013 $ −
Accrual of preferred stock derivative liability $ − $ 9,204,659
3
SMART BALANCE, INC. AND SUBSIDIARY
Notes to Consolidated Financial Statements (Unaudited)
On May 21, 2007, Smart Balance, Inc. (formerly known as Boulder Specialty Brands, Inc. or “Boulder”), completed a merger
pursuant to an Agreement and Plan of Merger dated September 25, 2006, as extended by a letter agreement dated as of February 15, 2007, between Boulder and GFA Holdings, Inc. (“GFA Holdings”), the sole stockholder of GFA Brands, Inc. (“GFA Brands”) (on May 21, 2007, GFA Holdings was merged into GFA Brands, the surviving company is referred to herein as “GFA”). Pursuant to the merger agreement, a wholly-owned Delaware subsidiary of Boulder merged with and into GFA, and GFA became a wholly-owned subsidiary of Boulder.
Immediately following the merger, Boulder changed its name to Smart Balance, Inc. All references to Smart Balance, Inc. (or the “Company”) herein should be considered to include the predecessor company Boulder.
The accompanying condensed consolidated financial statements include all adjustments (consisting only of normal recurring accruals) which are, in the opinion of management, considered necessary for a fair presentation of the results for the periods presented. These financial statements should be read in conjunction with the consolidated financial statements of Smart Balance, Inc. included in the Company's 2007 annual report on Form 10-K. The reported results for the three and six month periods ended June 30, 2008 are not necessarily indicative of the results to be expected for the full year. Certain amounts have been reclassified to conform with current presentations. Basis of Presentation:
The condensed consolidated financial statements included herein reflect the acquisition of GFA on May 21, 2007, with results of operations included from that date and the estimated fair value of the net assets of GFA included on May 21, 2007 (see footnote 2). Prior to May 21, 2007, the Company was a blank check company with no operating activities, whose sole purpose was to serve as a vehicle for an acquisition in the consumer foods or beverage industry. The Company was capitalized through an initial public offering on December 21, 2005, which raised approximately $96 million. Of this amount, approximately 96% was placed in a trust account until an acquisition was completed or until the Company was liquidated, as required by its charter. Change in Accounting Principle:
During the first quarter of 2008, the Company changed its method of accounting for certain trade incentives and marketing costs and began deferring a portion of such items as prepaid expenses in proportion to forecasted revenues for the year. This change enhances the matching of the Company’s expenses with revenues. Additionally, this change provides better comparability to the Company’s industry peers, most of whom defer a portion of trade incentives and marketing costs as prepaid expenses earlier in the year and recognize those expenses in subsequent quarters in line with actual revenue earned. While this methodology may create timing differences between quarters in 2007 as previously reported, it had no impact on the full year results. For more information, see the section entitled “Prepaid Expenses” contained in footnote 3.
1. General
4
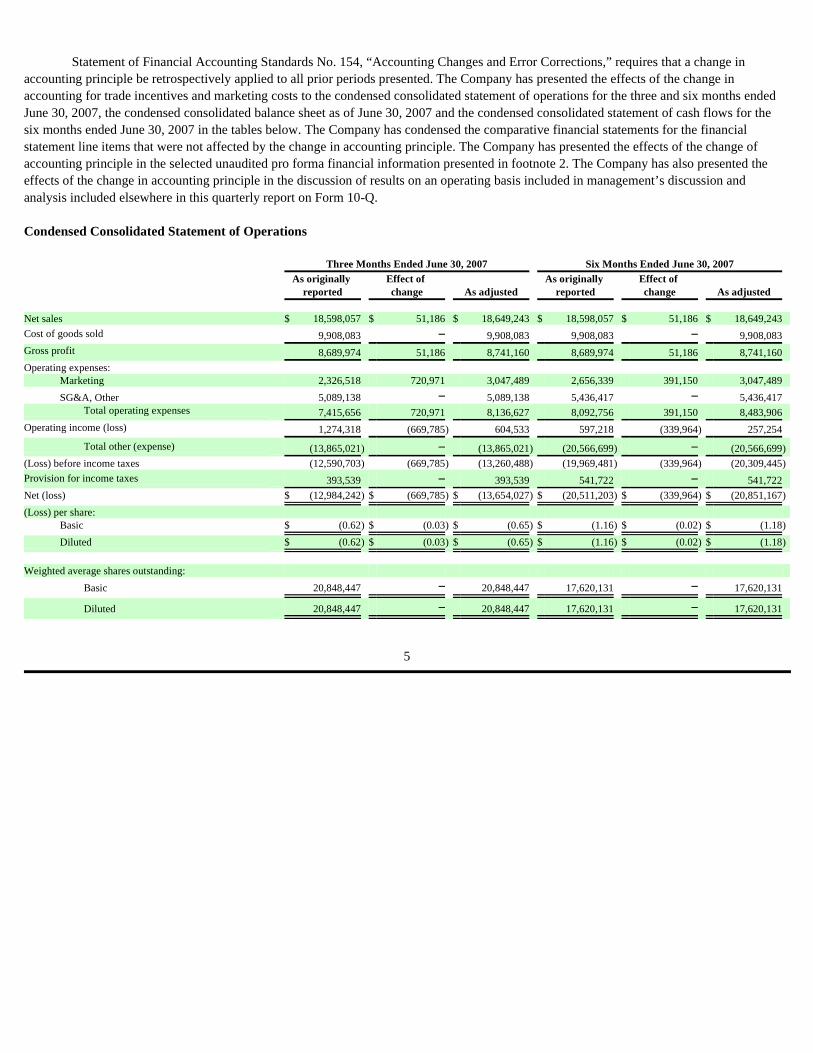
Statement of Financial Accounting Standards No. 154, “Accounting Changes and Error Corrections,” requires that a change in
accounting principle be retrospectively applied to all prior periods presented. The Company has presented the effects of the change in accounting for trade incentives and marketing costs to the condensed consolidated statement of operations for the three and six months ended June 30, 2007, the condensed consolidated balance sheet as of June 30, 2007 and the condensed consolidated statement of cash flows for the six months ended June 30, 2007 in the tables below. The Company has condensed the comparative financial statements for the financial statement line items that were not affected by the change in accounting principle. The Company has presented the effects of the change of accounting principle in the selected unaudited pro forma financial information presented in footnote 2. The Company has also presented the effects of the change in accounting principle in the discussion of results on an operating basis included in management’s discussion and analysis included elsewhere in this quarterly report on Form 10-Q. Condensed Consolidated Statement of Operations
Three Months Ended June 30, 2007 Six Months Ended June 30, 2007
Condensed Consolidated Balance Sheet As of June 30, 2007
Condensed Consolidated Statement of Cash Flows Six months ended June 30, 2007
As noted above, the Company changed its method of accounting for trade incentives and marketing costs during the first quarter of
2008 with the effects for the second quarter of 2007 shown in detail above. For the third and fourth quarter of 2007, the estimated impact on operating income/net loss was $(4.4) million and $4.7 million, respectively, and the estimated impact on diluted EPS was $(0.15) per share and $0.14 per share, respectively. The effect on net sales was not material. The change had no impact on the full year results.
As originally Effect of reported Change As adjusted Assets Current assets:
Prepaid expenses and other assets $ 12,208,860 $ − $ 12,208,860 Other current assets 16,670,748 135,985 16,806,733
Total current assets 28,879,608 135,985 29,015,593 Property and equipment, net 112,560 − 112,560 Total other assets 486,335,527 − 486,335,527
Total assets $ 515,327,695 $ 135,985 $ 515,463,680 Liabilities and Stockholders' Equity Current liabilities:
Income taxes payable $ − $ 135,985 $ 135,985 Other current liabilities 80,368,176 339,964 80,708,140
Total current liabilities 80,368,176 475,949 80,844,125 Noncurrent liabilities 304,418,359 − 304,418,359
Total liabilities 384,786,535 475,949 385,262,484 Total stockholders' equity 130,541,160 (339,964 ) 130,201,196
Total liabilities and stockholders' equity $ 515,327,695 $ 135,985 $ 515,463,680
Net cash provided by (used in) financing activities 388,417,271 − 388,417,271 Net (decrease) in cash for the period (101,254,630 ) − (101,254,630 )
Cash - Beginning of period 101,642,753 − 101,642,753 Cash - End of period $ 388,123 $ − $ 388,123
6
On May 21, 2007, the Company, as part of the merger agreement, acquired 100% of the stock of GFA Holdings, Inc., the parent
company of GFA Brands, Inc. GFA Brands, Inc. sells and markets consumer food products primarily under the Smart Balance ® and Earth Balance ® brand names to regional and national grocery stores. Concurrent with this acquisition, the Company changed its name to Smart Balance, Inc. The cost of the acquisition was approximately $491 million.
Under the GFA merger agreement, stockholders of GFA Holdings were paid an aggregate of $491.4 million in cash which included the assumption of post-closing bonus payments, net of tax benefits. The acquisition cost was paid with: (i) $101.1 million of cash held in a trust account established in connection with the Company’s initial public offering; (ii) the net proceeds of a private placement (see the stockholders’ equity note located elsewhere in these notes to the financial statements) of $246.0 million ($107.5 million for common stock and $138.5 million for the Series A convertible preferred stock together with the investor warrants); and (iii) proceeds from the secured debt financing (see the long-term debt note located elsewhere in these notes to the financial statements) of $160.0 million.
The purchase price consists of the following:
The Company’s purchase price allocation for the net assets acquired is as follows:
The weighted-average amortization period is approximately 10.2 years. The amount of goodwill which was carried over from a
predecessor acquisition and is deductible for tax purposes is $48.8 million.
Total assets 573,894,479 Accounts payable, accrued expenses and other liabilities 40,163,743 Deferred taxes and other 57,287,010
Total liabilities assumed 97,450,753 Net assets acquired $ 476,443,726
7
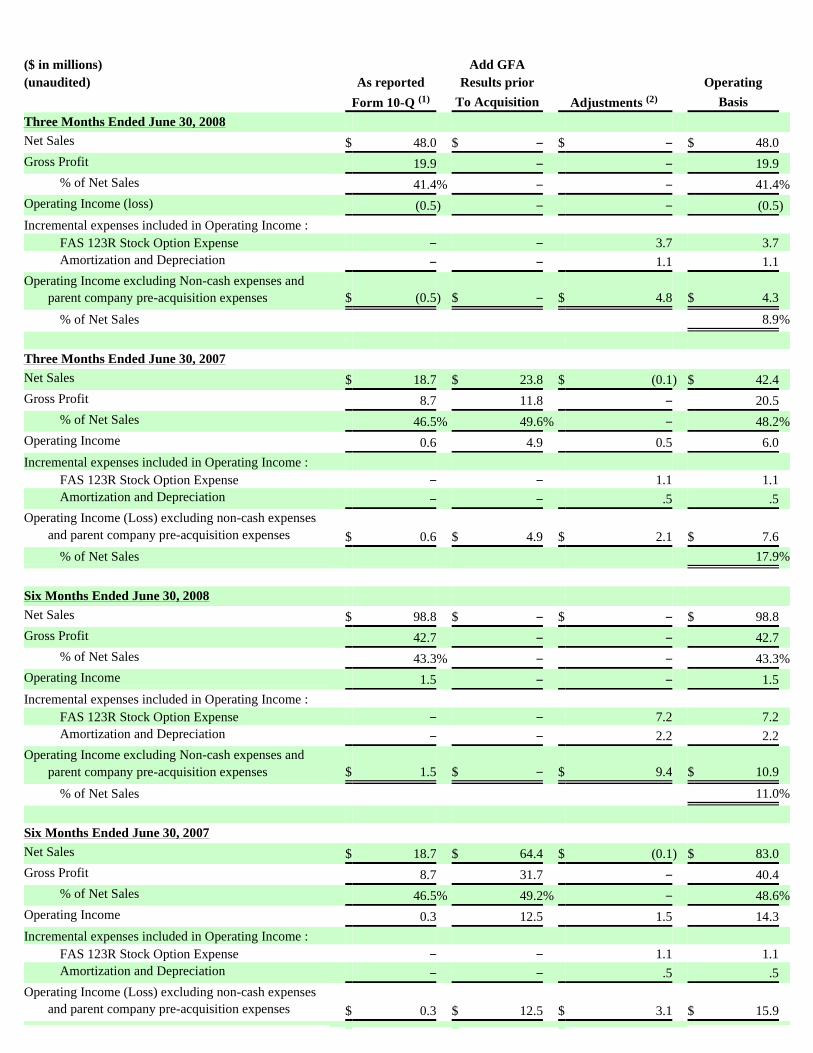
Selected Unaudited Pro Forma Financial Information
The financial information in the table below summarizes the actual results of the Company for the three months and six months ended June 30, 2008 and the combined results of operations of Boulder and GFA for the three and six months ended June 30, 2007, as though the GFA merger had occurred on January 1, 2007. A retrospective application of a change in accounting principle is being applied to the pro forma results for 2007 in order to improve comparability. For additional details regarding the change in accounting principle, see footnote 1. The unaudited pro forma financial information is presented for informational purposes only and is not indicative of the results of operations that would have been achieved if the merger had taken place on January 1, 2007 or that may result in the future. Prior to the completion of the merger, we were a blank check company with no operations.
(1) The retrospective application of the change in accounting principle resulted in adjustments to previously reported amounts of $(0.156) million and $(1.664) million to net sales and operating income, respectively. (2) The retrospective application of the change in accounting principle resulted in adjustments to previously reported amounts of $(0.07) million and $(0.101) million to net sales and operating income, respectively.
Cash and cash equivalents
The Company considers all highly liquid investments with original maturities of three months or less to be cash equivalents. Accounts receivable
Accounts receivable are carried at original invoice amount less allowances for cash discounts and doubtful receivables based on a review of all outstanding amounts. Management determines the allowance for doubtful accounts by regularly evaluating individual customer receivables and considering a customer’s financial condition, credit history and current economic conditions. Accounts receivable are written off when deemed uncollectible. Recoveries of receivables previously written off are recorded when received. The Company does not charge interest on past due receivables.
Net (loss) available for EPS $ (1,535,425 ) $ (15,661,357 ) $ (2,712,784 ) $ (25,554,547 )
Loss per share $ (0.02 ) $ (0.54 ) $ (0.04 ) $ (0.89 )
Weighted average shares outstanding 62,630,683 28,766,133 62,415,028 28,766,133
3. Summary of significant accounting policies
8
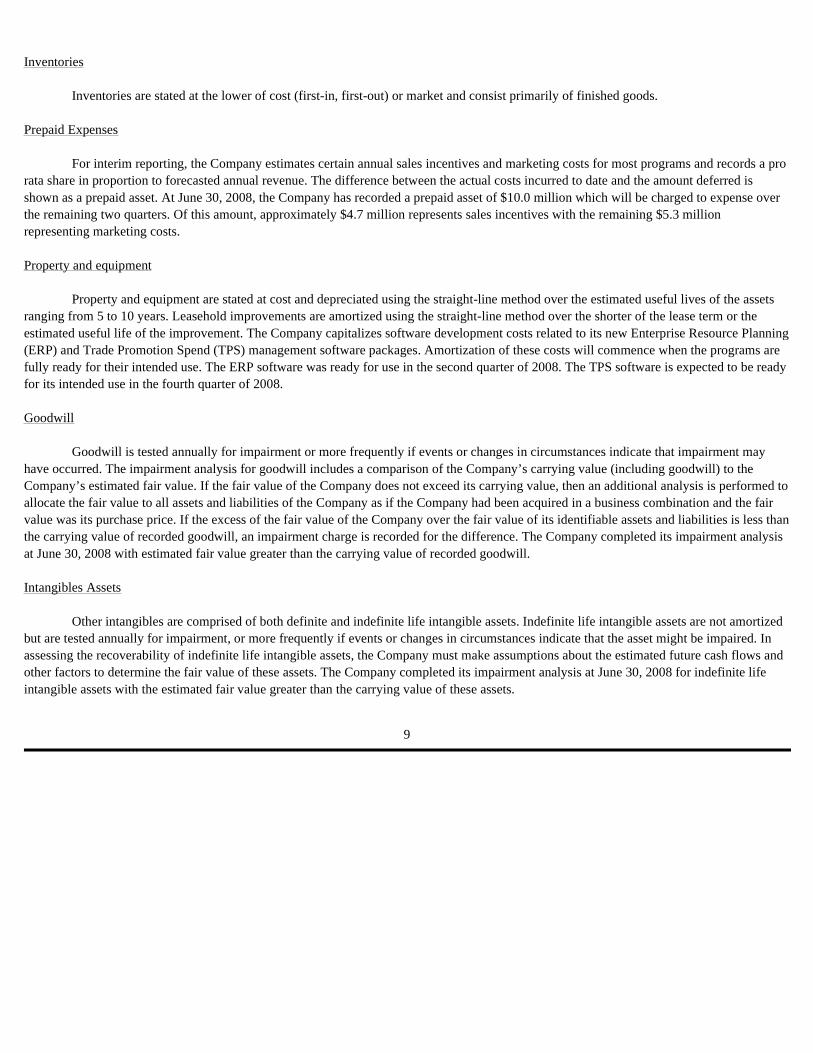
Inventories
Inventories are stated at the lower of cost (first-in, first-out) or market and consist primarily of finished goods. Prepaid Expenses
For interim reporting, the Company estimates certain annual sales incentives and marketing costs for most programs and records a pro rata share in proportion to forecasted annual revenue. The difference between the actual costs incurred to date and the amount deferred is shown as a prepaid asset. At June 30, 2008, the Company has recorded a prepaid asset of $10.0 million which will be charged to expense over the remaining two quarters. Of this amount, approximately $4.7 million represents sales incentives with the remaining $5.3 million representing marketing costs. Property and equipment
Property and equipment are stated at cost and depreciated using the straight-line method over the estimated useful lives of the assets ranging from 5 to 10 years. Leasehold improvements are amortized using the straight-line method over the shorter of the lease term or the estimated useful life of the improvement. The Company capitalizes software development costs related to its new Enterprise Resource Planning (ERP) and Trade Promotion Spend (TPS) management software packages. Amortization of these costs will commence when the programs are fully ready for their intended use. The ERP software was ready for use in the second quarter of 2008. The TPS software is expected to be ready for its intended use in the fourth quarter of 2008. Goodwill
Goodwill is tested annually for impairment or more frequently if events or changes in circumstances indicate that impairment may have occurred. The impairment analysis for goodwill includes a comparison of the Company’s carrying value (including goodwill) to the Company’s estimated fair value. If the fair value of the Company does not exceed its carrying value, then an additional analysis is performed to allocate the fair value to all assets and liabilities of the Company as if the Company had been acquired in a business combination and the fair value was its purchase price. If the excess of the fair value of the Company over the fair value of its identifiable assets and liabilities is less than the carrying value of recorded goodwill, an impairment charge is recorded for the difference. The Company completed its impairment analysis at June 30, 2008 with estimated fair value greater than the carrying value of recorded goodwill. Intangibles Assets
Other intangibles are comprised of both definite and indefinite life intangible assets. Indefinite life intangible assets are not amortized but are tested annually for impairment, or more frequently if events or changes in circumstances indicate that the asset might be impaired. In assessing the recoverability of indefinite life intangible assets, the Company must make assumptions about the estimated future cash flows and other factors to determine the fair value of these assets. The Company completed its impairment analysis at June 30, 2008 for indefinite life intangible assets with the estimated fair value greater than the carrying value of these assets.
9
An intangible asset is determined to have an indefinite useful life when there are no legal, regulatory, contractual, competitive,
economic or any other factors that may limit the period over which the asset is expected to contribute directly or indirectly to the future cash flows of the Company. In each reporting period, the Company also evaluates the remaining useful life of an intangible asset that is not being amortized to determine whether events and circumstances continue to support an indefinite useful life. If an intangible asset that is not being amortized is determined to have a finite useful life, the asset will be amortized prospectively over the estimated remaining useful life and accounted for in the same manner as intangible assets subject to amortization.
The Company has determined that its Smart Balance ® and Earth Balance ® trademarks have indefinite lives and these assets are not being amortized. Certain other assets acquired, primarily patent technology, have been determined to have definite lives ranging from 10 to 20 years and their costs are being amortized over their expected lives.
The Company generally expenses legal and related costs incurred in defending or protecting its intellectual property unless it can be established that such costs have added economic value to the business enterprise, in which case the Company capitalizes the costs incurred as part of intangible assets. The primary consideration in making the determination of whether to capitalize the costs is whether the Company can prove that it has been successful in defending itself against such intellectual property challenges. The second consideration for capitalization is whether such costs have, in fact, increased the economic value of the Company’s intellectual property. Legal defense costs that do not meet the considerations described above will be expensed as incurred. Recovery of legal expenses as part of a settlement agreement will be recorded as a reduction of capitalized legal fees with any excess recorded as income. During 2007, the Company capitalized approximately $1.2 million of legal defense costs. During the six months ended June 30, 2008, the Company was successful in recovering $0.4 million of legal expenses and, therefore, reduced previously capitalized costs by that amount. Deferred costs
Deferred loan costs associated with the secured debt financing are being amortized over the life of debt, using the effective interest method. During the first quarter of 2008, the Company prepaid $30 million of second lien debt and, accordingly, accelerated the amortization of deferred loan costs in the amount of $0.9 million. Revenue Recognition
Revenue is recognized when the earnings process is complete and the risks and rewards of ownership have transferred to the customer, which is generally considered to have occurred upon the receipt of product by the customer. The earnings process is complete once the customer order has been placed and approved and the product shipped has been received by the customer. Product is sold to customers on credit terms established on an individual basis. The credit factors used include historical performance, current economic conditions and the nature and volume of the product.
10
The Company offers its customers and consumers a variety of sales and incentive programs, including discounts, allowances, coupons
and slotting fees; such amounts are estimated and recorded as a reduction in revenue. The Company sells their products to customers without the right of return and is not obligated to accept any returns. Accounting for Warrants – Derivative Liability
Common Stock:
On December 21, 2005, the Company consummated its initial public offering of 12,760,840 units. Each unit consisted of one share of common stock and one redeemable common stock purchase warrant (which we refer to as public warrants). Each public warrant entitled the holder to purchase from the Company one share of its common stock at an exercise price of $6.00. In addition, certain initial shareholders of the Company purchased 1,000,000 warrants for $1.70 per warrant with an exercise price of $6.00 per share (which we refer to as founders’ warrants).
Emerging Issues Task Force Issue No. 00-19, “Accounting for Derivative Financial Instruments Indexed to and Potentially Settled in, a Company’s Own Stock” (“EITF 00-19”), requires freestanding contracts that are settled in a company’s own stock, including common stock warrants, to be designated as an equity instrument, asset or a liability. Under the provisions of Statement of Financial Accounting Standard No. 133 (“SFAS No. 133”), “Accounting for Derivative Instruments and Hedging Activities,” as amended, a contract designated as an asset or a liability must be carried at fair value on a company’s balance sheet, with any changes in fair value recorded in the company’s results of operations. A contract designated as an equity instrument must be included within equity, and no fair value adjustments are required from period to period. In accordance with EITF 00-19, the 12,760,840 public warrants were separately accounted for as liabilities and the 1,000,000 founders’ warrants are accounted for as equity.
SFAS No. 133 requires all derivatives to be recorded on the balance sheet at fair value. Furthermore, paragraph 11 (a) of SFAS No. 133 precludes contracts issued or held by a reporting entity that are both (1) indexed to its own stock and (2) classified as stockholders’ equity in its statement of financial position from being treated as derivative instruments. While the public warrants were indexed to the Company’s common stock, the fact that the shares underlying the warrants required that they be settled in registered shares required the Company to classify these instruments as a liability in accordance with EITF 00-19 paragraph 14. This derivative liability was adjusted to fair value, with any changes being recorded as non-operating gains or losses.
The public warrants began trading separately from the units in January 2006. Consequently, the fair value of these warrants was estimated at the market price of a warrant at each period end. To the extent that the market price increased or decreased, the Company’s derivative liabilities also increased or decreased, with a corresponding effect on the Company’s consolidated statement of operations. The net change in the valuation from December 31, 2006 through October 31, 2007, the redemption date, of $45.6 million was recorded as a non-operating loss.
11
On October 31, 2007, the Company called for redemption of all of its outstanding public warrants for $.01 per warrant. Under the
terms of the warrant agreement, the holders of the warrants had thirty days to exercise the warrants once called. Each public warrant entitled the holder to purchase one share of common stock of the Company at a price of $6.00 per public warrant share exercised. The public warrants were exercised by early December. The fair value of these warrants on the date the redemption was announced was $6.10 per warrant, which resulted in a decrease in the derivative liability from September 30, 2007 of $4,976,728 with a corresponding effect on the Company’s consolidated statement of operations. The remaining balance of $77,841,121 was reclassified from derivative liability to additional paid in capital. The founders’ warrants are not redeemable by the Company so long as they are owned by the initial stockholders. As of June 30, 2008, all 1,000,000 founders’ warrants remained outstanding and unexercised.
Series A Convertible Preferred Stock:
In connection with the acquisition of GFA, the Company entered into a private placement transaction for common stock and Series A convertible preferred stock together with investor warrants, pursuant to a Securities Purchase Agreement dated September 25, 2006, as amended by letter agreement, dated February 15, 2007. The Agreement included 14,410,188 shares of common stock and 15,388,889 shares of Series A convertible preferred stock along with an equal number of investor warrants. The investor warrants were determined to have a di minimus value as the Company had assessed the probability very low that the investor warrants would ever be exercisable. The net proceeds of approximately $246 million were used to fund a portion of the acquisition costs of GFA.
On January 3, 2008, the Company announced that it was forcing the conversion of all of its issued and outstanding shares of Series A convertible preferred stock into common stock. Each share of Series A convertible preferred stock was automatically converted into approximately 1.268 shares of common stock and all of the issued and outstanding shares of Series A convertible preferred stock ceased to exist. As a result of this conversion, the investor warrants will never be exercisable.
The Company exercised its right to force the conversion of the shares of Series A convertible preferred stock into common stock pursuant to the terms of the Company’s Restated Certificate of Incorporation, governing the terms of the preferred shares. Pursuant to the Restated Certificate of Incorporation, the Company had the right to force the conversion of all of the outstanding shares of Series A convertible preferred stock if: (i) the last sales price of the Company’s common stock equaled or exceeded $11.50 per share on each of 20 trading days within any 30 day trading period ending on the third business day prior to the date on which notice of conversion is given and (ii) the Company had elected to redeem all of the outstanding public warrants pursuant to the public warrant agreement. The last sales price of the Company’s common stock was at least $11.50 per share on each of 20 trading days within the 30 day trading period ending on December 28, 2007 (which is the third business day prior to the date of the notice letter). The Company redeemed all of its outstanding public warrants on December 3, 2007.
12
Loss per Share of Common Stock
Basic earnings (loss) per share is computed by dividing net income or loss applicable to common stockholders by the weighted-average shares of common stock outstanding for the period. Diluted earnings (loss) per share is computed by dividing net income (loss) by the weighted-average shares outstanding adjusted for any additional common shares that would have been outstanding if all of the potential dilutive common shares had been issued. Potential dilutive common shares outstanding would include primarily stock options and founders’ warrants. The following table summarizes stock options not included in the computation of diluted EPS:
(1) None of the 1,000,000 outstanding founders’ warrants were included because their inclusion would have been anti-dilutive. Segments
SFAS 131, “Disclosures about Segments of an Enterprise and Related Information” requires segment information to be prepared using the “management” approach. The management approach is based on the method that management organizes the segments within the Company for making operating decisions and assessing performance. The Company evaluates all products, makes operating decisions and performance assessments based on a total company approach and therefore considers itself as having only one segment. Fair Value of Financial Instruments
The Company’s financial instruments consist of cash and cash equivalents, short term trade receivables, payables and note payables. The carrying values of cash and cash equivalents and short term receivables and payables approximate fair value because of their short maturities. The Company’s note payable is determined by quoted market prices that are reset every three months and, therefore, approximates fair value. Research and Development
Research and development expenses are charged to operations when incurred and amounted to $49,048 for the three months June 30, 2008 and $92,288 for the six months ended June 30, 2008. On a pro forma basis, research and development expenses amounted to $18,735 for the three months June 30, 2007 and $37,278 for the six months ended June 30, 2007.
Three and Six Months Ended
June 30, 2008 (1) 2007 (1) Excluded due to option price being greater than market value 10,985,000 715,000 Excluded due to anti-dilution 62,500 6,682,500
13
Derivative Instruments
The Company recognizes derivatives as either assets or liabilities and measures those instruments at fair value. The accounting for changes in fair value is included in earnings when the hedged exposure affects earnings. The Company uses interest rate swaps to cover exposure to changes in interest rates. No interest rate swaps were outstanding as of June 30, 2008. Income Taxes
Deferred income taxes are provided for the differences between the basis of assets and liabilities for financial reporting and income tax purposes. A valuation allowance is established when necessary to reduce deferred tax assets to the amount expected to be realized. As of June 30, 2008, no valuation allowances were recorded. For the three months and six months ended June 30, 2007, the effective tax rate was higher than the statutory tax rate primarily due to the effect of the change in derivative liabilities since such losses are not deductible for income tax purposes. Advertising
Advertising costs are charged to operations (classified as marketing expenses) and amounted to $4,875,438 and $9,638,680 for the three months and six months ended June 30, 2008, respectively. Advertising costs for the three months and six months ended June 30, 2007 amounted to $5,374,205 and $10,447,805, respectively. Use of Estimates
The preparation of financial statements in conformity with accounting principles generally accepted in the United States requires management to make estimates and assumptions that affect the reported amounts of assets and liabilities and disclosure of contingent assets and liabilities at the date of the financial statements and the reported amounts of revenue and expenses during the reporting period. Actual results could differ from those estimates. Concentration of Credit Risk
Financial instruments which potentially subject the Company to concentrations of credit risk consist principally of cash, cash equivalents, short term investments and trade receivables. The Company maintains the majority of its cash and cash equivalents in the form of demand deposits with financial institutions that management believes are creditworthy. At June 30, 2008, the cash balances in these institutions exceeded federally insured amounts. Concentrations of credit risk relative to trade receivables are limited due to our diverse client base. The Company does have one customer that accounted for approximately 20% and 18 % of sales during the three months and six months ended June 30, 2008, respectively. The aggregate accounts receivable from this customer amounted to approximately 16% of the accounts receivable balance outstanding at June 30, 2008. The Company also has one product, “spreads,” which, accounted for approximately 68% and 70 % of total revenue during the three months and six months ended June 30, 2008, respectively. Approximately 72 % of the Company’s revenues during the first half of 2008 came from products utilizing a license from Brandeis University.
14
Recently Issued Accounting Pronouncements
In March 2008, the Financial Accounting Standards Board (“FASB”) issued Statement of Financial Accounting Standards (“SFAS”) No. 161, “Disclosure about Derivative Instruments and Hedging Activities,” an amendment of FASB No. 133, “Accounting for Derivative Instruments and Hedging Activities.” SFAS No. 161 requires increased qualitative, quantitative and credit risk disclosures, but does not change the scope or accounting requirements of FASB No. 133. SFAS No. 161 is effective for financial statements issued after November 15, 2008. The Company is evaluating the potential impact, if any, of the adoption of SFAS No. 161 on the Company’s financial statements.
In December 2007, the FASB issued SFAS No. 141 (revised 2007), “Business Combinations” (“SFAS 141R”), which replaces FASB Statement No. 141. SFAS 141R establishes principles and requirements for how an acquirer recognizes and measures in its financial statements the identifiable assets acquired, the liabilities assumed, any non controlling interest in the acquiree and the goodwill acquired, and establishes that acquisition costs will be generally expensed as incurred. This statement also establishes disclosure requirements which will enable users to evaluate the nature and financial effects of the business combination. SFAS 141R is effective as of the beginning of an entity’s fiscal year that begins after December 15, 2008. The adoption of SFAS 141R will not have an impact on the Company’s financial statements.
In December 2007, the FASB issued SFAS No. 160, “Noncontrolling Interests in Consolidated Financial Statement—amendments of ARB No. 51.” SFAS No. 160 states that accounting and reporting for minority interests will be recharacterized as noncontrolling interests and classified as a component of equity. The SFAS No. 160 also establishes reporting requirements that provide sufficient disclosures that clearly identify and distinguish between the interests of the parent and the interests of the noncontrolling owners. This statement is effective as of the beginning of an entity’s first fiscal year beginning after December 15, 2008. The adoption of SFAS No. 160 will not have an impact on the Company’s financial statements.
In February 2007, the FASB issued SFAS No. 159, “ The Fair Value Option for Financial Assets and Financial Liabilities - Including an amendment of FASB Statement No. 115. ” SFAS No. 159 provides for an election to expand the use of fair value accounting but does not affect existing standards which require assets or liabilities to be carried at fair value. Under SFAS No. 159, a company may elect to use fair value to measure accounts and loans receivable, available-for-sale and held-to-maturity securities, equity method investments, accounts payable, guarantees and issued debt. Other eligible items include firm commitments for financial instruments that otherwise would not be recognized at inception and non-cash warranty obligations where a warrantor is permitted to pay a third party to provide the warranty goods or services. If the use of fair value is elected, any upfront costs and fees related to the item must be recognized in earnings and cannot be deferred, e.g., debt issue costs. The fair value election is irrevocable and generally made on an instrument-by-instrument basis, even if a company has similar instruments that it elects not to measure based on fair value. At the adoption date, unrealized gains and losses on existing items for which fair value has been elected are reported as a cumulative adjustment to beginning retained earnings. Subsequent to the adoption of SFAS No. 159, changes in fair value are recognized in earnings. SFAS No. 159 is effective for fiscal years beginning after November 15, 2007. The Company has elected to adopt SFAS No. 159 on a instrument-by-instrument basis effective January 1, 2008. The Company had no assets or liabilities it was treating under the fair value basis at the adoption date and does not currently have any assets accounted for under the provisions of SFAS No. 159.
15
Property and equipment consist of the following:
Depreciation expense was $142,283 for the six months ended June 30, 2008 and $47,569 for the year ended December 31, 2007.
Accounts payable and accrued expenses consist of the following:
The Company has one customer that accounted for approximately 20% and 18% of sales during the three months and six months
ended June 30, 2008, respectively. The aggregate accounts receivable from this customer amounted to approximately 16% of the total accounts receivable at June 30, 2008.
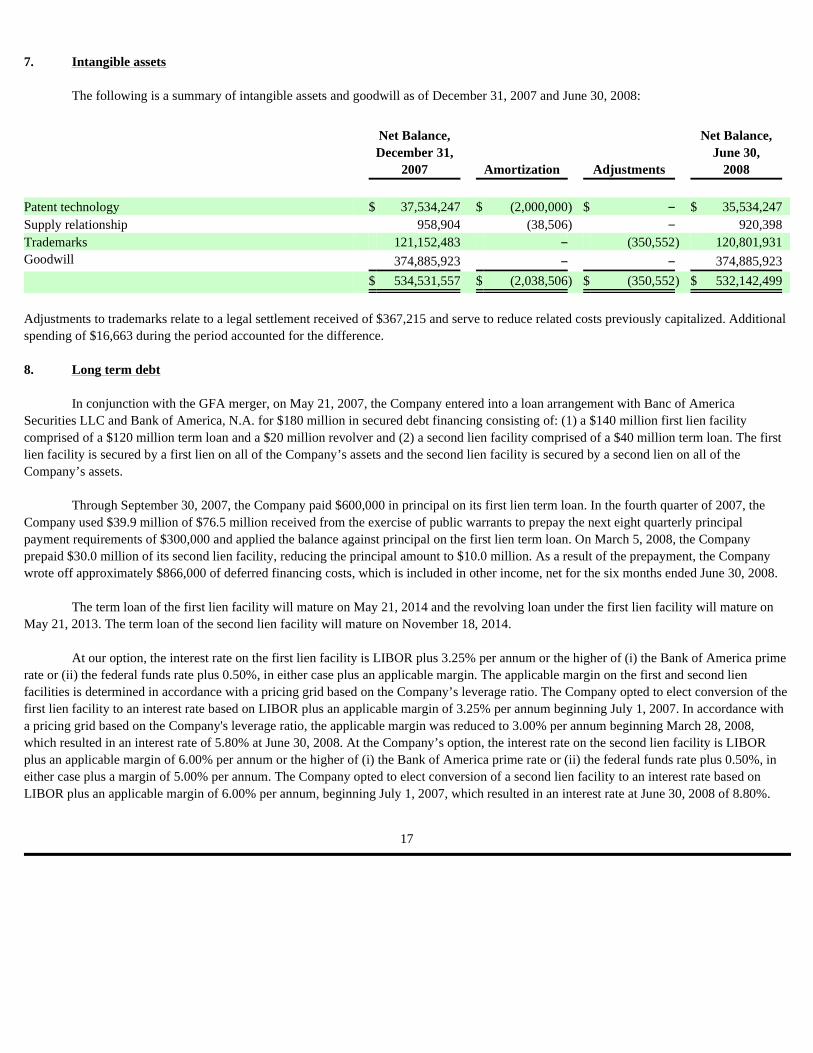
The following is a summary of intangible assets and goodwill as of December 31, 2007 and June 30, 2008:
Adjustments to trademarks relate to a legal settlement received of $367,215 and serve to reduce related costs previously capitalized. Additional spending of $16,663 during the period accounted for the difference.
In conjunction with the GFA merger, on May 21, 2007, the Company entered into a loan arrangement with Banc of America
Securities LLC and Bank of America, N.A. for $180 million in secured debt financing consisting of: (1) a $140 million first lien facility comprised of a $120 million term loan and a $20 million revolver and (2) a second lien facility comprised of a $40 million term loan. The first lien facility is secured by a first lien on all of the Company’s assets and the second lien facility is secured by a second lien on all of the Company’s assets.
Through September 30, 2007, the Company paid $600,000 in principal on its first lien term loan. In the fourth quarter of 2007, the Company used $39.9 million of $76.5 million received from the exercise of public warrants to prepay the next eight quarterly principal payment requirements of $300,000 and applied the balance against principal on the first lien term loan. On March 5, 2008, the Company prepaid $30.0 million of its second lien facility, reducing the principal amount to $10.0 million. As a result of the prepayment, the Company wrote off approximately $866,000 of deferred financing costs, which is included in other income, net for the six months ended June 30, 2008.
The term loan of the first lien facility will mature on May 21, 2014 and the revolving loan under the first lien facility will mature on May 21, 2013. The term loan of the second lien facility will mature on November 18, 2014.
At our option, the interest rate on the first lien facility is LIBOR plus 3.25% per annum or the higher of (i) the Bank of America prime rate or (ii) the federal funds rate plus 0.50%, in either case plus an applicable margin. The applicable margin on the first and second lien facilities is determined in accordance with a pricing grid based on the Company’s leverage ratio. The Company opted to elect conversion of the first lien facility to an interest rate based on LIBOR plus an applicable margin of 3.25% per annum beginning July 1, 2007. In accordance with a pricing grid based on the Company's leverage ratio, the applicable margin was reduced to 3.00% per annum beginning March 28, 2008, which resulted in an interest rate of 5.80% at June 30, 2008. At the Company’s option, the interest rate on the second lien facility is LIBOR plus an applicable margin of 6.00% per annum or the higher of (i) the Bank of America prime rate or (ii) the federal funds rate plus 0.50%, in either case plus a margin of 5.00% per annum. The Company opted to elect conversion of a second lien facility to an interest rate based on LIBOR plus an applicable margin of 6.00% per annum, beginning July 1, 2007, which resulted in an interest rate at June 30, 2008 of 8.80%.
There is no prepayment penalty for optional prepayments of the first lien facility and the following penalties for optional prepayments
on the second lien facility: 2.00% premium if prepaid the first year; 1.00% premium if prepaid the second year; and no prepayment penalty thereafter. As a result of prepaying $30.0 million of the second lien facility the Company paid a $0.6 million prepayment penalty, which is included in interest expense for the six months ended June 30, 2008. Mandatory prepayments under both facilities include 50% of excess cash flow (as defined in the loan documentation) and 50% of all net cash proceeds from the issuance of additional equity interests by us. In addition, the term loan of the first lien facility is subject to quarterly amortization of principal with 1.00% of the initial aggregate advances under such loan to be payable in each of the first six years and the remainder of the initial aggregate advance to be payable in a balloon payment at maturity.
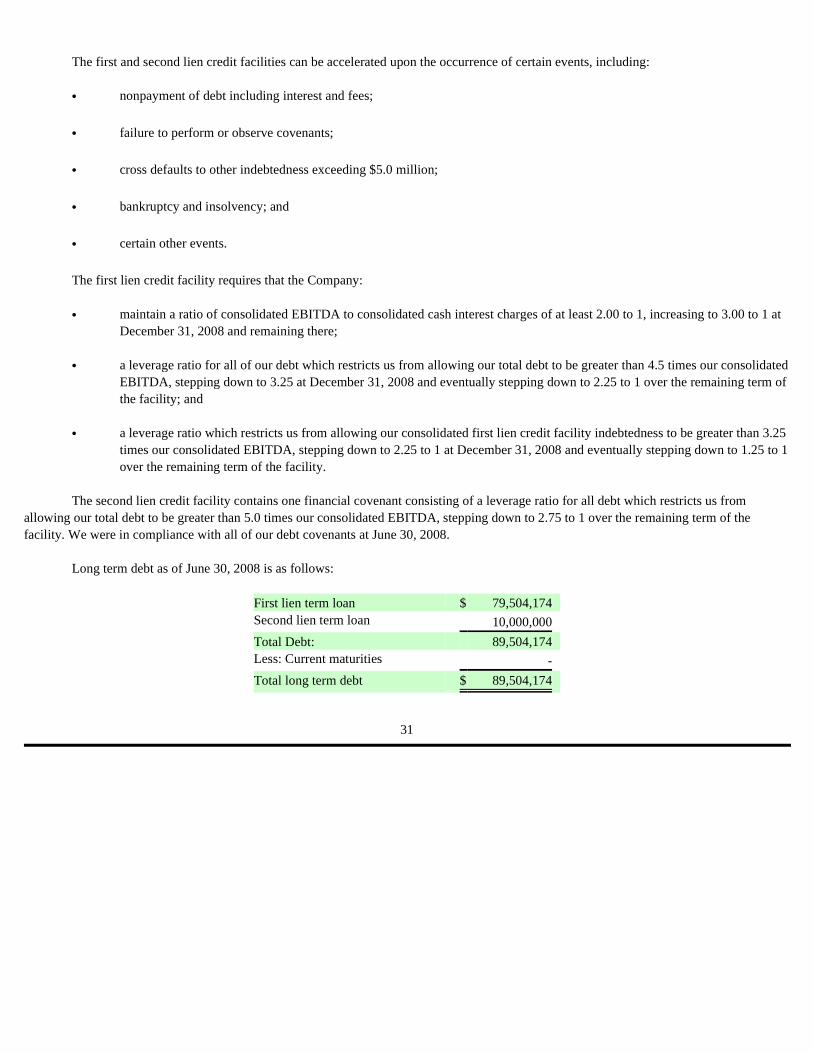
The first and second lien credit facilities can be accelerated upon the occurrence of certain events, including:
The first lien credit facility requires that the Company:
The second lien credit facility contains one financial covenant consisting of a leverage ratio for all debt which restricts the Company
from allowing its total debt to be greater than 5.0 times its consolidated EBITDA, stepping down to 2.75 to 1 over the remaining term of the facility. The Company was in compliance with all of its debt covenants at June 30, 2008.
• nonpayment of debt including interest and fees;
• failure to perform or observe covenants;
• cross defaults to other indebtedness exceeding $5.0 million;
• bankruptcy and insolvency; and
• certain other events.
• maintain a ratio of consolidated EBITDA to consolidated cash interest charges of at least 2.00 to 1 increasing to 3.00 to 1 at December 31, 2008 and remaining there;
• a leverage ratio for all Company’s debt which restricts the Company from allowing its total debt to be greater than 4.5 times its consolidated EBITDA, stepping down to 3.25 at December 31, 2008 and eventually stepping down to 2.25 to 1 over the remaining term of the facility; and
• a leverage ratio which restricts the Company from allowing its consolidated first lien credit facility indebtedness to be greater than 3.25 times its consolidated EBITDA, stepping down to 2.25 to 1 at December 31, 2008 and eventually stepping down to 1.25 to 1 over the remaining term of the facility.
18
Under the terms of the lien credit facilities, the Company is precluded from reacquiring its own shares.
Long term debt is as follows:
On October 19, 2006, the compensation committee of the board of directors unanimously approved the Company’s Stock and Awards
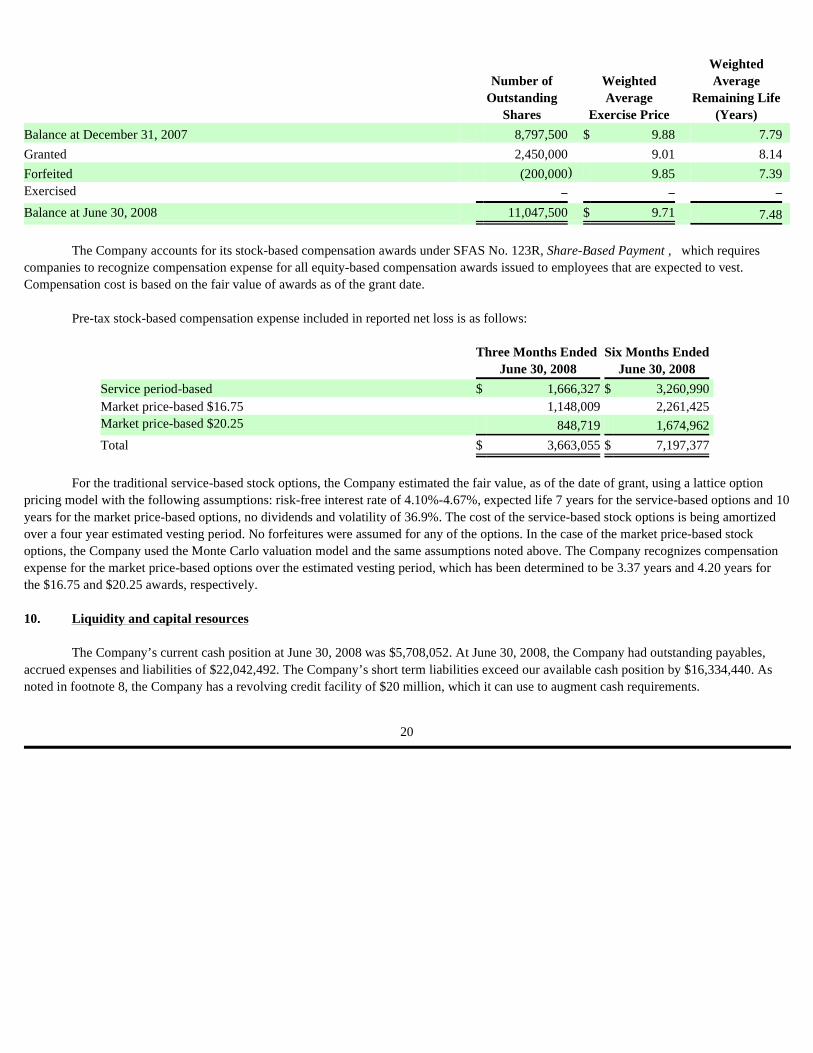
Plan, which we refer to as the stock plan, and directed it be submitted to the stockholders for approval. During a special stockholders meeting on May 17, 2007, the stock plan was approved, pursuant to which the Company reserved up to 9,650,000 shares of common stock for issuance to its officers, directors, employees and consultants and on May 21, 2008, the Company, after a shareholder vote, amended the stock plan to increase the number of shares available for award to a total of 12,150,000. During 2007, the Company granted options to purchase 8,797,500 shares of stock under the stock plan. During the six months ended June 30, 2008, the Company granted options to purchase 1,250,000 shares of stock under the stock plan.
During the first quarter of 2008, the compensation committee and a sub-committee of the compensation committee approved the issuance of up to 1,375,000 inducement stock options grants to new employees outside of the Company’s stock plan pursuant to NASDAQ Marketplace Rule 4350. During the six months ended June 30, 2008, the Company issued 1,200,000 inducement grant stock options to new employees.
The Company has two types of stock options, traditional service-based options with a four year graded (25% vest each year) vesting and market condition-based stock options which vest when the underlying stock prices reaches either $16.75 or $20.25, respectively, and remains there for 20 out of 30 consecutive trading days. Stock options are granted to recipients at exercise prices equal to the fair market value of the Company's stock at the dates of grant and can consist solely of the service-based options or market conditions-based options or a can consist of a combination of both types of options. Stock options granted to employees have a term of 10 years. The Company recognizes stock-based compensation expense over the requisite service period of the individual grants, which generally equals the vesting period, or as determined by the Monte Carlo valuation model.
June 30,
2008 December 31,
2007 First lien term loan $ 79,504,174 $ 79,504,174 Second lien term loan 10,000,000 40,000,000 Total Debt: 89,504,174 119,504,174 Less: Current maturities − − Total long term debt $ 89,504,174 $ 119,504,174
9. Stock-based compensation
19
The Company accounts for its stock-based compensation awards under SFAS No. 123R, Share-Based Payment , which requires
companies to recognize compensation expense for all equity-based compensation awards issued to employees that are expected to vest. Compensation cost is based on the fair value of awards as of the grant date.
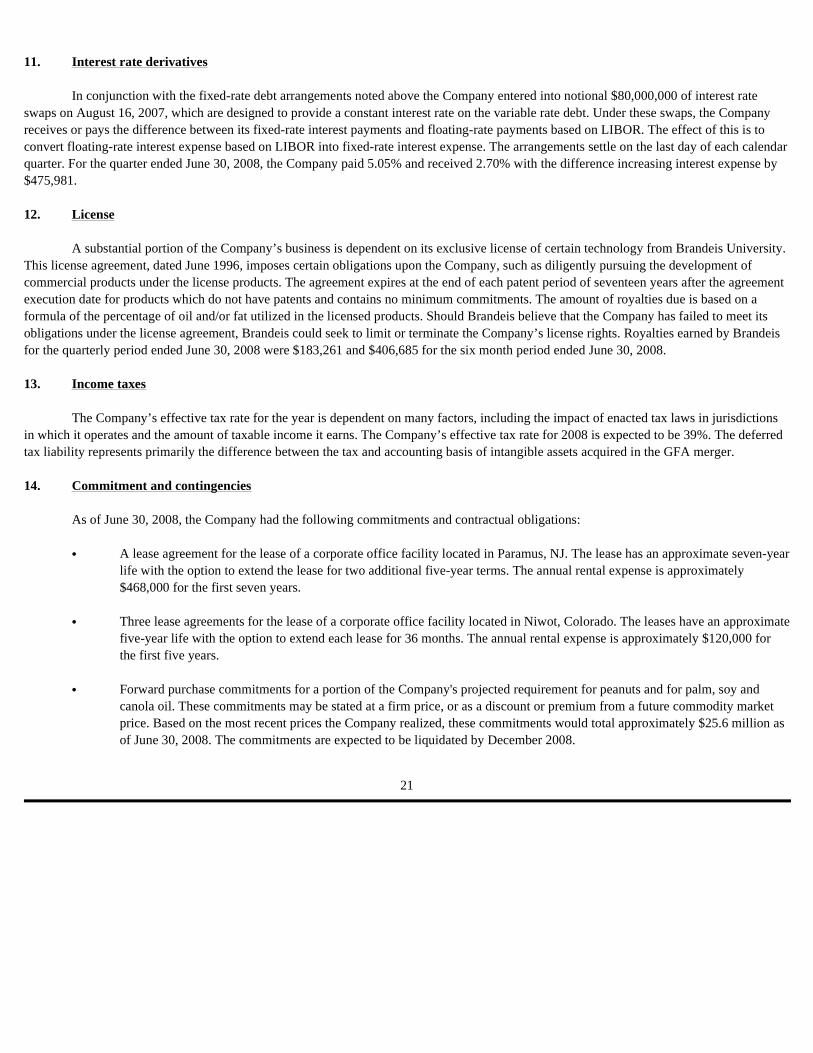
Pre-tax stock-based compensation expense included in reported net loss is as follows:
For the traditional service-based stock options, the Company estimated the fair value, as of the date of grant, using a lattice option
pricing model with the following assumptions: risk-free interest rate of 4.10%-4.67%, expected life 7 years for the service-based options and 10 years for the market price-based options, no dividends and volatility of 36.9%. The cost of the service-based stock options is being amortized over a four year estimated vesting period. No forfeitures were assumed for any of the options. In the case of the market price-based stock options, the Company used the Monte Carlo valuation model and the same assumptions noted above. The Company recognizes compensation expense for the market price-based options over the estimated vesting period, which has been determined to be 3.37 years and 4.20 years for the $16.75 and $20.25 awards, respectively.
The Company’s current cash position at June 30, 2008 was $5,708,052. At June 30, 2008, the Company had outstanding payables,
accrued expenses and liabilities of $22,042,492. The Company’s short term liabilities exceed our available cash position by $16,334,440. As noted in footnote 8, the Company has a revolving credit facility of $20 million, which it can use to augment cash requirements.
Number of
Outstanding Shares
Weighted Average
Exercise Price
Weighted Average
Remaining Life (Years)
Balance at December 31, 2007 8,797,500 $ 9.88 7.79 Granted 2,450,000 9.01 8.14 Forfeited (200,000 ) 9.85 7.39 Exercised − − − Balance at June 30, 2008 11,047,500 $ 9.71 7.48
Three Months Ended
June 30, 2008 Six Months Ended
June 30, 2008 Service period-based $ 1,666,327 $ 3,260,990 Market price-based $16.75 1,148,009 2,261,425 Market price-based $20.25 848,719 1,674,962 Total $ 3,663,055 $ 7,197,377
10. Liquidity and capital resources
20
In conjunction with the fixed-rate debt arrangements noted above the Company entered into notional $80,000,000 of interest rate
swaps on August 16, 2007, which are designed to provide a constant interest rate on the variable rate debt. Under these swaps, the Company receives or pays the difference between its fixed-rate interest payments and floating-rate payments based on LIBOR. The effect of this is to convert floating-rate interest expense based on LIBOR into fixed-rate interest expense. The arrangements settle on the last day of each calendar quarter. For the quarter ended June 30, 2008, the Company paid 5.05% and received 2.70% with the difference increasing interest expense by $475,981.
A substantial portion of the Company’s business is dependent on its exclusive license of certain technology from Brandeis University.
This license agreement, dated June 1996, imposes certain obligations upon the Company, such as diligently pursuing the development of commercial products under the license products. The agreement expires at the end of each patent period of seventeen years after the agreement execution date for products which do not have patents and contains no minimum commitments. The amount of royalties due is based on a formula of the percentage of oil and/or fat utilized in the licensed products. Should Brandeis believe that the Company has failed to meet its obligations under the license agreement, Brandeis could seek to limit or terminate the Company’s license rights. Royalties earned by Brandeis for the quarterly period ended June 30, 2008 were $183,261 and $406,685 for the six month period ended June 30, 2008.
The Company’s effective tax rate for the year is dependent on many factors, including the impact of enacted tax laws in jurisdictions
in which it operates and the amount of taxable income it earns. The Company’s effective tax rate for 2008 is expected to be 39%. The deferred tax liability represents primarily the difference between the tax and accounting basis of intangible assets acquired in the GFA merger.
As of June 30, 2008, the Company had the following commitments and contractual obligations:
11. Interest rate derivatives
12. License
13. Income taxes
14. Commitment and contingencies
• A lease agreement for the lease of a corporate office facility located in Paramus, NJ. The lease has an approximate seven-year life with the option to extend the lease for two additional five-year terms. The annual rental expense is approximately $468,000 for the first seven years.
• Three lease agreements for the lease of a corporate office facility located in Niwot, Colorado. The leases have an approximate five-year life with the option to extend each lease for 36 months. The annual rental expense is approximately $120,000 for the first five years.
• Forward purchase commitments for a portion of the Company's projected requirement for peanuts and for palm, soy and canola oil. These commitments may be stated at a firm price, or as a discount or premium from a future commodity market price. Based on the most recent prices the Company realized, these commitments would total approximately $25.6 million as of June 30, 2008. The commitments are expected to be liquidated by December 2008.
21
The Company is party to various legal proceedings arising in the ordinary course of business. Management believes that the resolution of these matters will not have a material adverse affect on the Company’s financial position, results of operations or cash flow.
Private Placement
In connection with the GFA merger, the Company entered into a private placement transaction for common stock and Series A
convertible preferred stock together with investor warrants, pursuant to a Securities Purchase Agreement dated, September 25, 2006, as amended by letter agreement, dated February 15, 2007. The Agreement included 14,410,188 of shares of common stock and 15,388,889 of Series A convertible preferred stock along with related investor warrants. The net proceeds of approximately $246 million received by the Company were used to fund a portion of the GFA merger acquisition costs.
Series A Convertible Preferred Stock
On January 3, 2008, the Company announced that it was forcing the conversion of all of its issued and outstanding shares of Series A convertible preferred stock into common stock. Each share of Series A convertible preferred stock was automatically converted into 1.268 shares of common stock and all of the issued and outstanding shares of Series A convertible preferred ceased to exist.
The Company exercised its right to force the conversion of the shares of Series A convertible preferred stock into common stock pursuant to the terms of the Company’s Restated Certificate of Incorporation, governing the terms of the preferred shares. Pursuant to the Restated Certificate of Incorporation, the Company had the right to force the conversion of all of the outstanding shares of Series A convertible preferred stock if: (i) the last sales price of the Company’s common stock equaled or exceeded $11.50 per share on each of 20 trading days within any 30 day trading period ending on the third business day prior to the date on which notice of conversion is given and (ii) the Company had elected to redeem all of the outstanding public warrants pursuant to the public warrant agreement. The last sales price of the Company’s common stock was at least $11.50 per share on each of 20 trading days within the 30 day trading period ending on December 28, 2007 (which is the third business day prior to the date of the notice letter) and, on December 3, 2007, the Company redeemed all of its outstanding public warrants.
• The Company uses interest rate swaps to cover exposure to changes in interest rates on its secured debt financing; no interest rate swaps were outstanding as of June 30, 2008.
15. Stockholders’ equity
22
Common Stock in Escrow
All of the shares of the Company’s common stock outstanding prior to December 16, 2005, the date of its initial public offering, were
placed in escrow, as required by the Company’s IPO underwriters, with Continental Stock Transfer & Trust Company, as escrow agent. The shares, when purchased in June 2005 by the Company’s officers, directors and related parties, were freely transferable and not subject to a substantial risk of forfeiture. The shares were only to be released from escrow on December 16, 2008 in the event that the Company was able to complete an initial business combination, but one-half of the escrowed shares could be released after an initial business combination if the Company’s stock closed at $11.50 or above for a specified period of time. Of the 3,190,210 shares initially held in escrow, 1,595,105 were released on October 11, 2007 because the last sales price of the Company’s common stock was at least $11.50 per share for 20 out of 30 trading days. The Company recorded a charge to earnings in the fourth quarter of 2007 of $18,455,815 (excluding amounts previously expensed), as all of the shares were held by officers, directors and related parties. The charges were based on the price of common stock of $12.31 on the date the above conditions were met. The remaining 1,595,105 shares in escrow are subject to release on December 16, 2008. As these shares are not performance based, no charge to earnings will be required to be made upon their release.
Redemption of Public Warrants
In December 2007, the Company received approximately $76.5 million from the exercise of its public warrants. The Company paid down approximately $40.0 million of its first lien debt, as it was required to use one-half of the proceeds of the public warrant redemption to pay off a portion of its term loan. In March 2008, the Company paid an additional $30.0 million of its second lien debt with the funds received from the exercise of public warrants.
In July 2008, the Company settled a lawsuit with one of its shareholders from an alleged violation of Section 16(b) of the Securities
Exchange Act of 1934, as amended, by the shareholder. As part of the settlement, the Company received $2.3 million. The settlement funds will be reported as additional paid-in-capital in the Company’s financial statements for the third quarter of 2008 and will have no effect of the Company’s statement of operations.
16. Subsequent Events
23
Forward Looking Statements
Certain information included in this “Management’s Discussion and Analysis of Financial Condition and Results of Operations,” contains forward-looking statements made in reliance upon the safe harbor provisions of Section 27A of the Securities Act of 1933, as amended, and Section 21E of the Securities Exchange Act of 1934, as amended. These statements may be identified by the use of words, such as “anticipate,” “estimates,” “should,” “expect,” “guidance,” “project,” “intend,” “plan,” “believe” and other words and terms of similar meaning, in connection with any discussion of our future business, results of operations, liquidity and operating or financial performance. Such forward-looking statements involve significant material known and unknown risks, uncertainties and other factors which may cause the actual results, performance or achievements to be materially different from any future results, performance or achievements expressed or implied by such forward-looking statements. These risks should be considered in connection with any written or oral forward-looking statement that we or any person acting on our behalf may issue in this document or otherwise, now or in the future. Further, certain information contained in this document is a reflection of our intention as of the date of this filing and is based upon, among other things, the existing regulatory environment, industry conditions, market conditions and prices, the economy in general and our assumptions as of such date. We may change our intentions based upon any changes in such factors, in our assumptions or otherwise.
We undertake no obligation to publicly update or revise any forward-looking statement, whether as a result of new information, future events or otherwise. We cannot assure you that any future results, performance or achievements will be achieved. For a discussion of these risks, uncertainties and other factors, see the “Risk Factors” and “Cautionary Note Regarding Forward-Looking Statements” sections included in our annual report on Form 10-K for the year ended December 31, 2007. GFA Merger
We were incorporated in Delaware on May 31, 2005 under the name Boulder Specialty Brands, Inc. On May 21, 2007, we completed a merger with GFA Brands, Inc. (“GFA”), which owns and markets the Smart Balance ® line of products, among others. GFA is our wholly-owned subsidiary. After the merger, the corporate name was changed from Boulder Specialty Brands, Inc. to Smart Balance, Inc. (“Smart Balance” or the “Company”). Pursuant to the merger agreement with GFA, we paid an aggregate of $491 million in cash (which included post-closing bonus payments net of tax benefits) as merger consideration. The cash consideration for the merger was funded with cash held in the trust account established in connection with our initial public offering, the proceeds of a private placement and a secured debt financing.
Prior to the merger, the Company was a blank check company with no operations, formed as a vehicle for an acquisition of an operating business in the consumer food and beverage industry whose net assets constituted at least 80% of our net assets. The following information is provided about us, our business and securities, reflecting the consummation of the GFA merger.
Item 2. Management’s Discussion and Analysis of Financial Condition and Results of Operations
24
Company Overview
We are a consumer food products company that competes primarily in the retail branded food products industry and focuses on providing value-added, functional food products to consumers. Functional food is defined as a food or a food ingredient that has been shown to affect specific functions or systems in the body and may play an important role in disease prevention. We market buttery spreads, popcorn, peanut butter, cooking oil, mayonnaise and other products primarily under the Smart Balance ® trademark. In the natural food channel, we sell similar natural and organic spreads products under the Earth Balance ® trademark. Our trademarks are of material importance to our business and are protected by registration or other means in the United States and a number of international markets. Our buttery spreads business, marketed under Smart Balance ® , Earth Balance ® , Smart Beat ® and Nucoa ® , is by far the most developed product segment and accounted for approximately 68% and 70% of sales during the three months and six months ended June 30, 2008, respectively.
Our products are sold in all 50 states, with little international sales presence. We sell our products in mass merchandise, grocery, natural food and club stores throughout the U.S, with a majority of products sold through supermarket chains and food wholesalers. We utilize regional sales managers who are full-time employees and work with food brokers to sell our products. In September 2007, we entered into an agreement with Acosta, Inc. to become our national sales agency. Additionally, we sell a small portion of our products through independent food distributors. Our largest customer, Wal-Mart Stores, Inc. and its affiliates, accounted for approximately 20% and 18% of consolidated net sales during the three months and six months ended June 30, 2008, respectively.
Our signature buttery spreads and popcorn products utilize a proprietary licensed, patented technology that is free of trans fats and enhances good-to-bad cholesterol ratios. In 1996, Brandeis University licensed to GFA certain technology relating to the use of a balanced proportion of saturated and polyunsaturated fatty acids from one or more vegetable oil sources for incorporation in food products to increase HDL and HDL/LDL cholesterol ratio. Our agreement with Brandeis provides us with an exclusive license to a number of patents until April 7, 2015, at which time the patents will expire. In addition, we have proprietary trade secrets, technology, know-how processes and other intellectual property rights that are not registered.
Our primary growth strategy is to continue to drive consumer and trade awareness of our brands, increase distribution of our existing products, and continue to launch additional line extensions and new products. We actively advertise via network and cable TV, radio, coupons, and in-store promotions. We have also benefited from favorable trends in the food industry regarding the required labeling of trans fats levels in food products and increased consumer awareness of the negative health implications of trans fats in foods.
We outsource finished goods through third-party manufacturers. We do not own or operate any manufacturing facilities. Outsourcing is designed to allow us to enhance production flexibility and capacity, leverage working capital, and focus our energy and resources on marketing and sales, while substantially reducing capital expenditures and avoiding the complication of managing a production work force. Our buttery spreads are produced by two manufacturers with multiple locations. Most of our other products are each supplied by a separate sole source. In the event of an interruption in supply, we believe we could arrange for additional suppliers to provide the affected products. While we believe our manufacturers have the capacity to fulfill our current production needs and are willing to increase capacity as we grow, we will monitor capacity, service and costs and will qualify alternative sources of supply as needed.
25
Our manufacturers supply our products at a price equal to the cost of ingredients and certain packaging plus a fixed toll charge. Except
in unusual circumstances, we provide no raw materials to our manufacturers. However, we work with our manufacturers to source high quality ingredients at attractive pricing. The prices paid for raw materials used in our products generally reflect factors such as weather, commodity market fluctuations, currency fluctuations, tariffs, and the effects of governmental agricultural programs. Although the prices of raw materials can be expected to fluctuate as a result of these factors, we believe such raw materials to be in adequate supply and generally available from numerous sources. We also negotiate certain commodities and packaging costs directly with the suppliers. Manufacturers are required by contract to announce changes in ingredient prices in advance. Toll charges cannot be unilaterally increased by the manufacturers, however, some manufacturers are able to increase toll charges after giving us notice of the increase at least six months in advance. We bear all freight costs associated with shipping finished products.
We use third party distributors and a network of public warehouses to deliver product from our manufacturers to our customers. We rely primarily on two third party distributors to deliver all of our spreads and other refrigerated products. All freight costs associated with shipping finished products are borne by us.
The food industry is highly competitive and numerous multinational, regional and local firms currently compete, or are capable of competing, with us. Our products compete with branded products as well as generic and private-label products of food retailers, wholesalers and cooperatives. We compete primarily on the basis of product quality, brand recognition, brand loyalty, service, marketing, advertising, patent protections and price. Some competitors may have different profit or strategic objectives than we do. Substantial advertising and promotional expenditures are required to maintain or improve a brand’s market position or to introduce a new product. Our largest principal competitors are Unilever, Kraft Foods, and ConAgra Foods, each of whom have substantially greater market presence, longer operating histories, better distribution, more significant customer bases and greater financial, marketing, capital and other resources than us. Results of Operations
The following discussion includes the operating results of GFA, the Company’s wholly-owned subsidiary. Prior to the completion of the merger, we were a blank check company with no operations. Accordingly, the results of operations do not provide a meaningful comparison with the prior periods. Information for the three months and six months ended June 30, 2008 includes the operations of GFA. Information for the three months and six months ended June 30, 2007 relates mostly to the Company as a blank check company that had no operations until it acquired GFA on May 21, 2007.
26
The following discussion should be read in conjunction with our unaudited consolidated financial statements and related notes thereto
included elsewhere in this Form 10-Q. Also, the reported results for the period from May 21, 2007 have been adjusted to give effect to a change in accounting principle. For more information on the change in accounting principle, see note 1 to the financial statements included elsewhere in this quarterly report. Results of Operations for the Three Months and Six Months Ended June 30, 2008 Compared to the Three Months and Six Months Ended June 30, 2007
Net Sales:
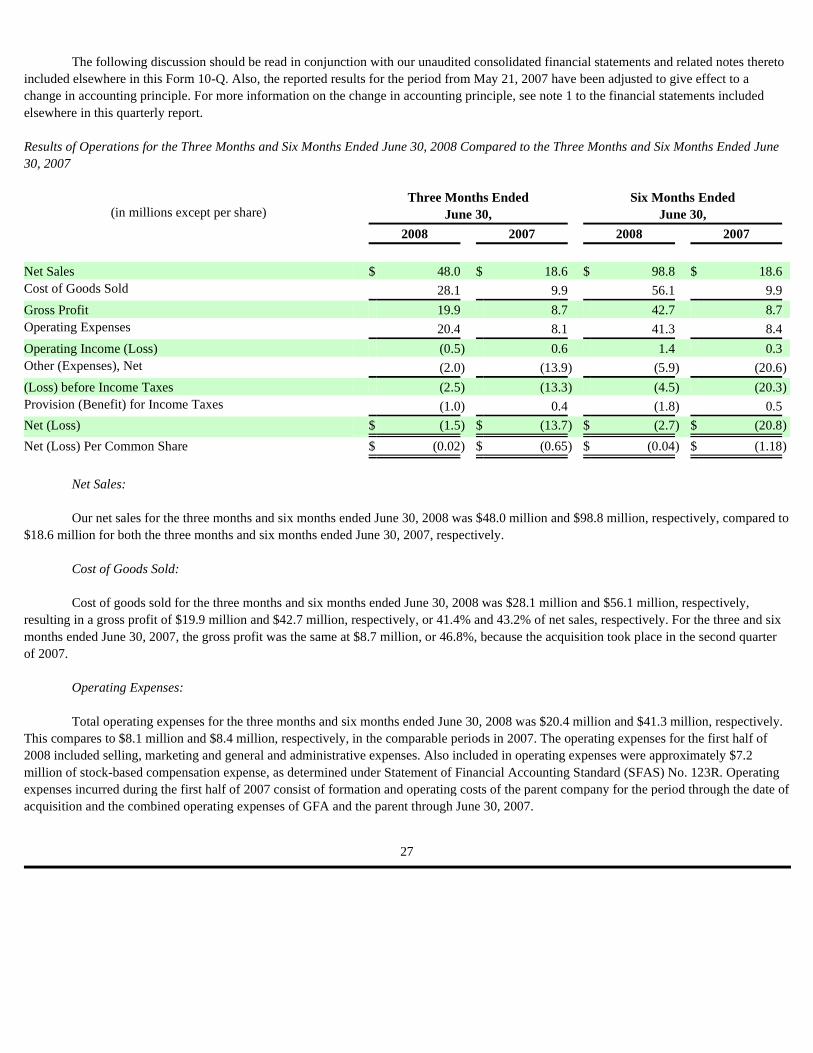
Our net sales for the three months and six months ended June 30, 2008 was $48.0 million and $98.8 million, respectively, compared to
$18.6 million for both the three months and six months ended June 30, 2007, respectively.
Cost of Goods Sold:
Cost of goods sold for the three months and six months ended June 30, 2008 was $28.1 million and $56.1 million, respectively, resulting in a gross profit of $19.9 million and $42.7 million, respectively, or 41.4% and 43.2% of net sales, respectively. For the three and six months ended June 30, 2007, the gross profit was the same at $8.7 million, or 46.8%, because the acquisition took place in the second quarter of 2007.
Operating Expenses:
Total operating expenses for the three months and six months ended June 30, 2008 was $20.4 million and $41.3 million, respectively. This compares to $8.1 million and $8.4 million, respectively, in the comparable periods in 2007. The operating expenses for the first half of 2008 included selling, marketing and general and administrative expenses. Also included in operating expenses were approximately $7.2 million of stock-based compensation expense, as determined under Statement of Financial Accounting Standard (SFAS) No. 123R. Operating expenses incurred during the first half of 2007 consist of formation and operating costs of the parent company for the period through the date of acquisition and the combined operating expenses of GFA and the parent through June 30, 2007.
(in millions except per share) Three Months Ended June 30,
Six Months Ended June 30,
2008 2007 2008 2007 Net Sales $ 48.0 $ 18.6 $ 98.8 $ 18.6 Cost of Goods Sold 28.1 9.9 56.1 9.9 Gross Profit 19.9 8.7 42.7 8.7 Operating Expenses 20.4 8.1 41.3 8.4 Operating Income (Loss) (0.5 ) 0.6 1.4 0.3 Other (Expenses), Net (2.0 ) (13.9 ) (5.9 ) (20.6 )
(Loss) before Income Taxes (2.5 ) (13.3 ) (4.5 ) (20.3 ) Provision (Benefit) for Income Taxes (1.0 ) 0.4 (1.8 ) 0.5 Net (Loss) $ (1.5 ) $ (13.7 ) $ (2.7 ) $ (20.8 )
Net (Loss) Per Common Share $ (0.02 ) $ (0.65 ) $ (0.04 ) $ (1.18 )
27
Operating Income (Loss):
We had an operating loss of $0.5 million and operating income of $1.4 million for the three months and six months ended June 30,
2008, respectively, compared with operating income of $0.6 million and $0.3 million, respectively, for the corresponding periods in 2007.
Other Income (Expense):
We incurred other expenses of $2.0 million for the three months ended June 30, 2008 compared to expenses of $13.9 million in the corresponding period in 2007. The results for 2008 included net interest expense of $2.0 million compared with interest expense of $2.1 million in the corresponding period in 2007. Also, included in the results for the second quarter of 2007 was a $13.1 million loss from derivative liabilities. In 2007, we also had interest income from the investment of the IPO proceeds held in trust of $1.2 million. For the six months ended June 30, 2008, we had other expenses of $5.9 million, which consisted primarily of $5.0 million in net interest expense, compared with $20.6 million in the prior year period, which consisted primarily of derivative losses of $20.9 million.
Income Taxes:
The provision for income taxes for the three months and six months ended June 30, 2008 was a benefit of $1.0 million and $1.8 million, respectively. This compares with a provision of $0.4 million and $0.5 million, respectively, for the corresponding periods in 2007. The provision in 2007 was based on taxable income, which excluded the losses for derivatives which is not deductible for tax purposes.
Net (Loss):
Our net loss for the three months ended June 30, 2008 was $1.5 million compared with a loss of $13.7 million for the corresponding period in 2007. For the six months ended June 30, 2008, our net loss was $2.7 million compared with a loss of $20.8 million in the comparable period of 2007.
Net (Loss) Per Common Share:
Our net loss per share in the second quarter of 2008 was $(0.02) compared to a net loss of $(0.65) in the corresponding period in 2007 based on the weighted average shares outstanding of 62.6 million in the second quarter of 2008 compared to 20.8 million in the second quarter of 2007. For the six month period ended June 30, 2008, our net loss per share was $(0.04) compared with $(1.18) in the corresponding period in 2007. The weighted average shares outstanding was 62.4 million for 2008 and 17.6 million for 2007.
28
Cash Flows
The discussion of cash flows for the first half of 2008 includes the consolidated results of GFA, the Company’s wholly-owned subsidiary which was acquired on May 21, 2007. Prior to the completion of the merger, we were a blank check company with no operations. Accordingly, the cash flows do not provide a meaningful comparison with the prior periods. Six Months Ended June 30, 2008 Compared to the Six Months Ended June 30, 2007
Cash used in operating activities was $0.8 million for the six months ended June 30, 2008 compared to cash used in operating activities of $3.5 million in the corresponding period in 2007. For the first six months of 2008, we had net loss of $2.7 million, which included $7.2 million of stock-based compensation expenses and $3.2 million of depreciation and amortization. Higher working capital needs in the first half of 2008 more than offset the benefit of these non-cash charges. For the six months ended June 30, 2007, the cash flow used in operating activities, excluding the increase in derivative liabilities of $20.9 million, resulted from higher working capital due to a reduction of accounts payable and accrued expenses.
Cash used in investing activities totaled $1.1 million during the six months ended June 30, 2008 which resulted from software development costs of $1.5 million and other fixed assets offset by recovery of certain legal costs related to protecting our intangible assets of $0.4 million. In 2007, we had a net use of $486.1 million, which resulted from the purchase of GFA on May 21, 2007.
Cash used in financing activities was $30.0 million for the six months ended June 30, 2008, resulting from the prepayment of our second lien debt, compared to cash provided from financing activities of $388.4 million for the corresponding period in 2007. For 2007, the net proceeds from the issuance of debt and equity required for the purchase of GFA accounted for most of net cash provided from financing activities. Liquidity and Capital Resources
Liquidity:
Our liquidity and capital resource planning is largely dependent on the generation of operating cash flows, which is highly sensitive to changes in demand and to a lesser extent, pricing, for our major products. While changes in key operating costs, such as outsourced production, advertising, promotion and distribution, may adversely affect cash flows, we generate significant cash flows as demand for our products grows. Our principal liquidity requirements are to finance current operations, pay down existing indebtedness and fund future expansion. Currently, our primary source of liquidity requirements to meet these needs is cash generated by operations.
We believe that cash flows generated from operations, existing cash and cash equivalents, and borrowing capacity under the revolving credit facility will be sufficient to finance working capital requirements for our business for the foreseeable future. As of June 30, 2008, $20 million was available for borrowing under our revolving credit facility, subject to certain covenant limitations. Developing and bringing to the market other new brands and business opportunities may require additional outside funding, which may require us to seek out additional borrowing arrangements.
29
Secured Debt Financing:
In conjunction with the GFA merger, on May 21, 2007, we entered into a loan arrangement with Banc of America Securities LLC and
Bank of America, N.A. for $180 million in secured debt financing consisting of: (1) a $140 million first lien facility comprised of a $120 million term loan and a $20 million revolver and (2) a second lien facility comprised of a $40 million term loan. The first lien facility is secured by a first lien on all of our assets and the second lien facility is secured by a second lien on all of our assets. Through September 30, 2007, we paid $0.6 million in principal payments on its first lien facility. In December 2007, we made a $39.9 million principal pre-payment on its first lien facility as a result of the proceeds derived from the exercise of the public warrants. In March 2008, we prepaid $30 million on our second lien facility, reducing the outstanding principal balance to $10 million. As a result of the prepayment, the Company wrote off approximately $0.9 million of deferred financing costs, which is included in other income, net for the six months ended June 30, 2008.
The term loan of the first lien facility will mature on May 21, 2014 and the revolving loan under the first lien facility will mature on May 21, 2013. The term loan of the second lien facility will mature on November 18, 2014.
At our option, the interest rate on the first lien facility is LIBOR plus 3.25% per annum or the higher of (i) the Bank of America prime rate or (ii) the federal funds rate plus 0.50%, in either case plus an applicable margin. The applicable margin on the first and second lien facilities is determined in accordance with a pricing grid based on the Company’s leverage ratio. The Company opted to elect conversion of the first lien facility to an interest rate based on LIBOR plus an applicable margin of 3.25% per annum beginning July 1, 2007 in accordance with a pricing grid based on the Company's leverage ratio. The applicable margin was reduced to 3.00% per annum beginning March 28, 2008, which resulted in an interest rate of 5.80% at June 30, 2008. At the Company’s option, the interest rate on the second lien facility is LIBOR plus an applicable margin of 6.00% per annum or the higher of (i) the Bank of America prime rate or (ii) the federal funds rate plus 0.50%, in either case plus a margin of 5.00% per annum. The Company opted to elect conversion of a second lien facility to an interest rate based on LIBOR plus an applicable margin of 6.00% per annum, beginning July 1, 2007, which resulted in an interest rate at June 30, 2008 of 8.80%.
There is no prepayment penalty for optional prepayments of the first lien facility and the following penalties for optional prepayments on the second lien facility: 2.00% premium if prepaid the first year; 1.00% premium if prepaid the second year; and no prepayment penalty thereafter. As a result of prepaying $30.0 million of the second lien facility the Company paid a $0.6 million prepayment penalty, which is included in interest expense for the six months ended June 30, 2008. Mandatory prepayments under both facilities include 50% of excess cash flow (as defined in the loan documentation) and 50% of all net cash proceeds from the issuance of additional equity interests by us. In addition, the term loan of the first lien facility is subject to quarterly amortization of principal with 1.00% of the initial aggregate advances under such loan to be payable in each of the first six years and the remainder of the initial aggregate advance to be payable in a balloon payment at maturity.
30
The first and second lien credit facilities can be accelerated upon the occurrence of certain events, including:
The first lien credit facility requires that the Company:
The second lien credit facility contains one financial covenant consisting of a leverage ratio for all debt which restricts us from
allowing our total debt to be greater than 5.0 times our consolidated EBITDA, stepping down to 2.75 to 1 over the remaining term of the facility. We were in compliance with all of our debt covenants at June 30, 2008.
Long term debt as of June 30, 2008 is as follows:
• nonpayment of debt including interest and fees;
• failure to perform or observe covenants;
• cross defaults to other indebtedness exceeding $5.0 million;
• bankruptcy and insolvency; and
• certain other events.
• maintain a ratio of consolidated EBITDA to consolidated cash interest charges of at least 2.00 to 1, increasing to 3.00 to 1 at December 31, 2008 and remaining there;
• a leverage ratio for all of our debt which restricts us from allowing our total debt to be greater than 4.5 times our consolidated EBITDA, stepping down to 3.25 at December 31, 2008 and eventually stepping down to 2.25 to 1 over the remaining term of the facility; and
• a leverage ratio which restricts us from allowing our consolidated first lien credit facility indebtedness to be greater than 3.25 times our consolidated EBITDA, stepping down to 2.25 to 1 at December 31, 2008 and eventually stepping down to 1.25 to 1 over the remaining term of the facility.
First lien term loan $ 79,504,174 Second lien term loan 10,000,000 Total Debt: 89,504,174 Less: Current maturities - Total long term debt $ 89,504,174
31
Off Balance Sheet Arrangements
We do not have off-balance sheet arrangements, financings, or other relationships with unconsolidated entities or other persons, also known as “variable interest entities.” Discussion of Results on an Operating Basis
Our GAAP financial information includes the results of GFA from the date of the acquisition (May 21, 2007) and, therefore, is not necessarily comparable for the prior periods presented. Accordingly, the information below presents historical periods on an “operating basis.” The accompanying table reconciles those results to GAAP results. We believe that this presentation allows investors more useful information because it more closely reflects the performance and expenses of the operating entity in both the current and prior periods presented. Also, the results for 2007 have been adjusted for a retrospective change in accounting principle. For more information on the change in accounting principle, see note 1 to the financial statements included elsewhere in this quarterly report.
For the three months and six months ended June 30, 2008, the GAAP operating loss includes certain expenses (non-cash) related to SFAS 123R stock option expense and amortization that did not exist for GFA in prior periods. In order to provide a more meaningful comparison of operating performance with prior periods, we have removed those items from the operating basis results set forth below for the three months and six months ended June 30, 2008. Furthermore, we have added the operating expenses of the parent company back to the operating basis results below for the three months and six months ended June 30, 2007, prior to May 21, 2007, as GFA incurred its own operating expenses prior to the date of acquisition and the inclusion of the parent company’s expenses prior to the date of acquisition would make it difficult to compare the operating results period to period. With the information as set forth below, we believe management and stockholders are better able to determine whether or not sales, gross profit or operating income of the acquired business have improved in 2008 compared with prior periods. The operating basis results provided below are intended to assist the reader in comparing the operating performance of the GFA business we acquired, for the periods before and after the acquisition. However, they do not indicate what actual consolidated results would have been had we acquired GFA on January 1, 2007.
The operating basis results should not be viewed in isolation or as a substitution for GAAP results.
32
($ in millions) Add GFA (unaudited) As reported Results prior Operating Form 10-Q (1) To Acquisition Adjustments (2) Basis Three Months Ended June 30, 2008 Net Sales $ 48.0 $ − $ − $ 48.0 Gross Profit 19.9 − − 19.9
% of Net Sales 41.4 % − − 41.4 %
Operating Income (loss) (0.5 ) − − (0.5 ) Incremental expenses included in Operating Income :
Operating Income (Loss) excluding non-cash expenses and parent company pre-acquisition expenses
$ 0.3 $ 12.5 $ 3.1 $ 15.9
% of Net Sales 19.2 %
33
(1) The retrospective application of the change in accounting principle resulted in adjustments to previously reported amounts of $(0.2) million and $(1.7) million to net sales and operating income, respectively, for the second quarter of 2007 and $(0.1) million and $(0.1) million to net sales and operating income, respectively, for the six month period ended June 30, 2007. (2) To remove parent company pre-acquisition expenses from results prior to the acquisition date and to add back certain non-cash expenses included in 2008 which did not exist in 2007. Parent company expenses incurred beginning May 21, 2007 remain included in operating basis results. Three and Six Months Ended June 30, 2008 Compared to Three and Six Months Ended June 30, 2007
Net Sales . Net sales for the second quarter increased 13.1% to $48.0 million in 2008, from $42.4 million in 2007, due to higher prices across almost all categories. The Company increased pricing on its products in June to cover rising costs, following a similar pricing action in February. In addition, shipments of lower weight sizes of its largest selling spreads products began in June, bringing Smart Balance in line with the rest of the industry.
The increase in net sales due to price was partially offset by a 3% decrease in case shipments and higher trade and promotion costs. Increases in case shipments due to new products (extra virgin olive oil spreads, omega-3 enhanced spreads, 50/50 butter blend and milk) and higher sales of cooking oil were more than offset by declines in base spreads and other categories. The decline in volume was related in part to high inventories at retail that needed to be reduced to allow for transition to the new sizes of spreads products.
Market shares for spreads increased versus the prior year for the 26 th consecutive quarter. Market shares for cooking oil increased while shares for peanut butter, popcorn and mayonnaise declined.
For the six months ended June 30, 2008, net sales increased to $98.8 million from $83.0 million in 2007 or 19%, which was driven primarily by price increases and a 4% increase in case volume.
Gross Profit . Gross profit declined $0.6 million to $19.9 million in the second quarter of 2008 from $20.5 million in the same period in 2007 as the impact of higher pricing was more than offset by increases in input costs primarily in commodity raw materials, higher trade and promotion costs, and lower volume. Gross profit as a percent of net sales decreased to 41.4% in 2008 from 48.2% in the second quarter of 2007, due to the timing lag in selling price increases versus input costs increases, and higher trade and promotion costs.
For the six months ended June 30, 2008, gross profit was $42.7 million or 43.3% compared to $40.4 million or 48.7%, for the corresponding period in 2007.
Operating Income less Non-Cash Items . Operating income for the second quarter of 2008 declined $3.3 million to $4.3 million in 2008 from $7.6 million income in 2007 due primarily to higher general and administrative expenses as the Company expanded its organization for growth, increased marketing costs, and the decline in gross profit.
34
For the six months ended June 30, 2008, operating income less non-cash charges decreased $5.0 million to $10.9 million from $15.9
million in 2007. Item 3. Quantitative and Qualitative Disclosures About Market Risk
We are exposed to financial market risks due primarily to changes in interest rates, which we manage primarily by managing the maturities of our financial instruments. We do not use derivatives to alter the interest characteristics of our financial instruments.
We purchase significant amounts of soy, palm and canola oil products to support the needs of our brands. The price and availability of these commodities directly impacts the results of operations and can be expected to impact the future results of operations. We do not engage in any hedging activities; however, the Company may consider hedging oil products in the near future. The agreements we enter into qualify as normal purchases and sales in the normal course of business. Accordingly, the agreements do not qualify as derivatives under SFAS No. 133, “Accounting for Derivative Instruments and Hedging Activities.” Based on the most recent prices for soy, palm and canola oil products, we would have commitments of $20.8 million.
In conjunction with the fixed-rate debt arrangements discussed elsewhere in this report, we entered into $80,000,000 of interest rate swaps on August 16, 2007, which are designed to fix the interest rate of the variable rate debt. Under these swaps, we receive or pay the difference between our fixed-rate interest payments and floating-rate payments based on LIBOR. The effect of this is to convert floating-rate interest expense based on LIBOR into fixed-rate interest expense. The arrangements settle on the last day of each calendar quarter. For the quarter ended June 30, 2008, the Company paid $1,021,222 and received $545,241 with the difference increasing interest expense by $475,981.
We are exposed to market risk from changes in interest rates charged on our debt. The impact on earnings is subject to change as a result of movements in market rates. A hypothetical increase in interest rates of 100 basis points would result in potential reduction of future pre-tax earnings of approximately $0.1 million per year for every $10.0 million outstanding under our first lien credit facility and approximately $0.1 million per year under our second lien credit facility. Our ability to meet our debt service obligations will be dependent upon our future performance which, in turn, is subject to future economic conditions and to financial, business and other factors. Item 4. Controls and Procedures
Conclusion regarding the effectiveness of disclosure controls and procedures . Our management, with the participation of our Chief Executive Officer and Principal Financial and Accounting Officers, evaluated the effectiveness of our disclosure controls and procedures (as defined in Rules 13a-15(e) and 15d-15(e) under the Exchange Act) as of June 30, 2008. Disclosure controls and procedures include, without limitation, controls and procedures designed to ensure that information required to be disclosed by the Company in the reports that we file or submit under the Exchange Act is accumulated and communicated to our management, including our Principal Executive Officer and Principal Financial and Accounting Officers, as appropriate, to allow timely decisions regarding required disclosure. Management recognizes that any controls and procedures, no matter how well designed and operated, can provide only reasonable assurance of achieving their objectives and management necessarily applies its judgment in evaluating the cost-benefit relationship of possible controls and procedures. Based on management’s evaluation of our disclosure controls and procedures as of June 30, 2008, our Chief Executive Officer and Principal Financial and Accounting Officers concluded that, as of such date, our disclosure controls and procedures were effective at the reasonable assurance level.
35
Changes in internal control over financial reporting. During the fiscal quarter ended June 30, 2008, we implemented an enterprise
resource planning system, or ERP system, which should improve our financial reporting by streamlining the flow of information throughout the Company. Other than the implementation of the ERP system, there were no changes in our internal control over financial reporting that has materially affected, or is reasonably likely to materially affect, our internal control over financial reporting.
36
Part II. Other Information Item 1. Legal Proceedings.
As previously reported in the Company’s Form 10-K for the year ended December 31, 2007, on January 14, 2008, Georg Müller filed a Request for Declaration of Invalidity against Registration No. 003902079 for the mark SMART BALANCE before the European Community Trademark Office. On May 26, 2008, the Request for Declaration of Invalidity was dismissed with no effect on the Company’s use of the mark because the filing fee was never paid to the European Community Trademark Office.
As previously reported in the Company’s Form 10-K for the year ended December 31, 2007, on April 4, 2007, Kellogg North America Company filed a Notice of Opposition before the Trademark Trial and Appeal Board opposing our registration application for the “Smart Balance Omega” mark for use with peanut butter, breakfast cereal, cereal based snack foods, oatmeal, processed oats, mayonnaise, salad dressing and tartar sauce. On July 10, 2007, we filed an Answer to the Notice of Opposition. On June 23, 2008, Kellogg North America Company agreed to withdraw the opposition proceeding in exchange for our removing breakfast cereal, cereal based snack foods, oatmeal and processed oats from the registration application. The Opposition was dismissed, without prejudice, by the Trademark Trial and Appeal Board on July 10, 2008.
Other than the items mentioned above, there have been no material changes to the litigation we previously reported under Item 3 in our annual report on Form 10-K for the year ended December 31, 2007. Item 1A. Risk Factors.
An investment in our securities involves a high degree of risk. There have been no material changes to the risk factors previously reported under Item 1A of our annual report on Form 10-K for the year ended December 31, 2007. Item 4. Submission of Matters to a Vote of Security Holders.
On May 21, 2008, the Company held an annual meeting of its stockholders. The annual meeting was held in order to vote on the following matters: Proposal 1 : The board of directors nominated William E. Hooper, Gerald J. Laber and James B. Leighton to stand for re-election at the annual meeting and each of the three director nominees were elected by a plurality of votes cast by shares entitled to vote at the meeting. Therefore, in accordance with the voting results listed below, all three director nominees were re-elected to serve a three-year term and until their successors have been elected and qualified. The votes on this proposal were cast as follows:
Nominee: Votes For: Votes
Withheld: William Hooper 49,109,032 206,295 Gerald Laber 48,922,185 393,142 James Leighton 48,922,410 392,917
37
Proposal 2 : The board of directors selected Ehrhardt Keefe Steiner & Hottman PC to serve as the independent registered public accountants for the Company in 2008. The board of directors directed that the appointment of the independent accountants be submitted for ratification by the shareholders at the annual meeting. Therefore, in accordance with the voting results listed below, Ehrhardt Keefe Steiner & Hottman PC will serve as the independent registered public accountants for the Company in 2008. The votes on this proposal were cast as follows:
Proposal 3 : The board of directors directed shareholders to consider and vote on a proposed amendment to the Company’s Stock and Awards Plan to increase the number of shares available for award by 2,500,000 shares to a total of 12,150,000 shares. In accordance with the voting results listed below, the Company amended its Stock and Awards Plan to increase the number of shares available for award to a total of 12,150,000 shares. The votes on this proposal were cast as follows:
Item 6. Exhibits.
See the exhibit index located elsewhere in this quarterly report on Form 10-Q.
Pursuant to the requirements of the Securities Exchange Act of 1934, the Registrant has duly caused this report to be signed on its behalf by the undersigned, Registrant’s principal financial officer, thereunto duly authorized.
August 8, 2008 SMART BALANCE, INC. (Registrant)
/s/ Stephen B. Hughes Stephen B. Hughes
Chairman and Chief Executive Officer (Authorized officer of Registrant)
/s/ Alan S. Gever Alan S. Gever
Executive Vice President and Chief Financial Officer (Principal financial officer of Registrant)
39
Exhibit Index:
* Incorporated by reference to our annual meeting proxy statement filed with the SEC on April 9, 2008.
10.1 Smart Balance, Inc. Stock and Awards Plan and Amendment No. 1 thereto* 31.1 Certification of Principal Executive Officer Pursuant to Exchange Act Rules 13a-14(a) and 15d-14(a), as adopted pursuant to
Section 302 of the Sarbanes-Oxley Act of 2002 31.2 Certification of Principal Financial Officer Pursuant to Exchange Act Rules 13a-14(a) and 15d-14(a), as adopted pursuant to
Section 302 of the Sarbanes-Oxley Act of 2002 32.1 Certification of Principal Executive Officer Pursuant to 18 U.S.C. Section 1350, as adopted pursuant to Section 906 of the
Sarbanes-Oxley Act of 2002 32.2 Certification of Principal Financial Officer Pursuant to 18 U.S.C. Section 1350, as adopted pursuant to Section 906 of the Sarbanes-
Oxley Act of 2002
40
Exhibit 31.1
CERTIFICATION BY PRINCIPAL EXECUTIVE OFFICER I, Stephen B. Hughes, certify that: 1. I have reviewed this Quarterly Report on Form 10-Q of Smart Balance, Inc.; 2. Based on my knowledge, this report does not contain any untrue statement of a material fact or omit to state a material fact necessary to make the statements made, in light of the circumstances under which such statements were made, not misleading with respect to the period covered by this report; 3. Based on my knowledge, the financial statements, and other financial information included in this report, fairly present in all material respects the financial condition, results of operations and cash flows of the registrant as of, and for, the periods presented in this report; 4. The registrant’s other certifying officers and I are responsible for establishing and maintaining disclosure controls and procedures (as defined in Exchange Act Rules 13a-15(e) and 15d-15(e)) and internal control over financial reporting (as defined in Exchange Act Rules 13a-15(f) and 15d-15(f)) for the registrant and have:
a) Designed such disclosure controls and procedures, or caused such disclosure controls and procedures to be designed under our supervision, to ensure that material information relating to the registrant, including its consolidated subsidiaries, is made known to us by others within those entities, particularly during the period in which this report is being prepared;
b) Designed such internal control over financial reporting, or caused such internal control over financial reporting to be designed under our supervision, to provide reasonable assurance regarding the reliability of financial reporting and the preparation of financial statements for external purposes in accordance with generally accepted accounting principles;
c) Evaluated the effectiveness of the registrant’s disclosure controls and procedures and presented in this report our conclusions about the effectiveness of the disclosure controls and procedures, as of the end of the period covered by this report based on such evaluation; and
d) Disclosed in this report any change in the registrant’s internal control over financial reporting that occurred during the registrant’s most recent fiscal quarter (the registrant’s fourth fiscal quarter in the case of an annual report) that has materially affected, or is reasonably likely to materially affect, the registrant’s internal control over financial reporting. 5. The registrant’s other certifying officers and I have disclosed, based on our most recent evaluation of internal control over financial reporting, to the registrant’s auditors and the audit committee of the registrant’s board of directors (or persons performing the equivalent functions):
a) all significant deficiencies and material weaknesses in the design or operation of internal control over financial reporting which are reasonably likely to adversely affect the registrant’s ability to record, process, summarize and report financial information; and
b) any fraud, whether or not material, that involves management or other employees who have a significant role in the registrant’s internal control over financial reporting.
Date: August 8, 2008 By: /s/ Stephen B. Hughes Stephen B. Hughes Chairman of the Board and Chief Executive Officer (Principal executive officer)
Exhibit 31.2
CERTIFICATION BY PRINCIPAL FINANCIAL OFFICER I, Alan S. Gever, hereby certify that: 1. I have reviewed this Quarterly Report on Form 10-Q of Smart Balance, Inc.; 2. Based on my knowledge, this report does not contain any untrue statement of a material fact or omit to state a material fact necessary to make the statements made, in light of the circumstances under which such statements were made, not misleading with respect to the period covered by this report; 3. Based on my knowledge, the financial statements, and other financial information included in this report, fairly present in all material respects the financial condition, results of operations and cash flows of the registrant as of, and for, the periods presented in this report; 4. The registrant’s other certifying officers and I are responsible for establishing and maintaining disclosure controls and procedures (as defined in Exchange Act Rules 13a-15(e) and 15d-15(e)) and internal control over financial reporting (as defined in Exchange Act Rules 13a-15(f) and 15d-15(f)) for the registrant and have:
a) Designed such disclosure controls and procedures, or caused such disclosure controls and procedures to be designed under our supervision, to ensure that material information relating to the registrant, including its consolidated subsidiaries, is made known to us by others within those entities, particularly during the period in which this report is being prepared;
b) Designed such internal control over financial reporting, or caused such internal control over financial reporting to be designed under our supervision, to provide reasonable assurance regarding the reliability of financial reporting and the preparation of financial statements for external purposes in accordance with generally accepted accounting principles;
c) Evaluated the effectiveness of the registrant’s disclosure controls and procedures and presented in this report our conclusions about the effectiveness of the disclosure controls and procedures, as of the end of the period covered by this report based on such evaluation; and
d) Disclosed in this report any change in the registrant’s internal control over financial reporting that occurred during the registrant’s most recent fiscal quarter (the registrant’s fourth fiscal quarter in the case of an annual report) that has materially affected, or is reasonably likely to materially affect, the registrant’s internal control over financial reporting. 5. The registrant’s other certifying officers and I have disclosed, based on our most recent evaluation of internal control over financial reporting, to the registrant’s auditors and the audit committee of the registrant’s board of directors (or persons performing the equivalent functions):
a) all significant deficiencies and material weaknesses in the design or operation of internal control over financial reporting which are reasonably likely to adversely affect the registrant’s ability to record, process, summarize and report financial information; and
b) any fraud, whether or not material, that involves management or other employees who have a significant role in the registrant’s internal control over financial reporting.
Date: August 8, 2008 By: /s/ Alan S. Gever Alan S. Gever Executive Vice President and Chief Financial Officer (Principal financial officer of Registrant)
Exhibit 32.1
CERTIFICATION
Pursuant to Section 906 of the Sarbanes-Oxley Act of 2002 (Subsections (a) and (b) of Section 1350,
Chapter 63 of Title 18, United States Code) Pursuant to section 906 of the Sarbanes-Oxley Act of 2002 (subsections (a) and (b) of section 1350, chapter 63 of title 18, United States Code), the undersigned officer of Smart Balance, Inc., a Delaware corporation (the “Company”), does hereby certify, to such officer’s knowledge, that: The Quarterly Report on Form 10-Q for the quarter ended June 30, 2008 (the “Form 10-Q”) of the Company fully complies with the requirements of section 13(a) or 15(d) of the Securities Exchange Act of 1934, and information contained in the Form 10-Q fairly presents, in all material respects, the financial condition and results of operations of the Company.
Date: August 8, 2008 By: /s/ Stephen B. Hughes Stephen B. Hughes Chairman of the Board and Chief Executive Officer (Principal executive officer)
Exhibit 32.2
CERTIFICATION
Pursuant to Section 906 of the Sarbanes-Oxley Act of 2002 (Subsections (a) and (b) of Section 1350,
Chapter 63 of Title 18, United States Code) Pursuant to section 906 of the Sarbanes-Oxley Act of 2002 (subsections (a) and (b) of section 1350, chapter 63 of title 18, United States Code), the undersigned officer of Smart Balance, Inc., a Delaware corporation (the “Company”), does hereby certify, to such officer’s knowledge, that: The Quarterly Report on Form 10-Q for the quarter ended June 30, 2008 (the “Form 10-Q”) of the Company fully complies with the requirements of section 13(a) or 15(d) of the Securities Exchange Act of 1934, and information contained in the Form 10-Q fairly presents, in all material respects, the financial condition and results of operations of the Company.
Date: August 8, 2008 By: /s/ Alan S. Gever Alan S. Gever Executive Vice President and Chief Financial Officer (Principal financial officer of Registrant)