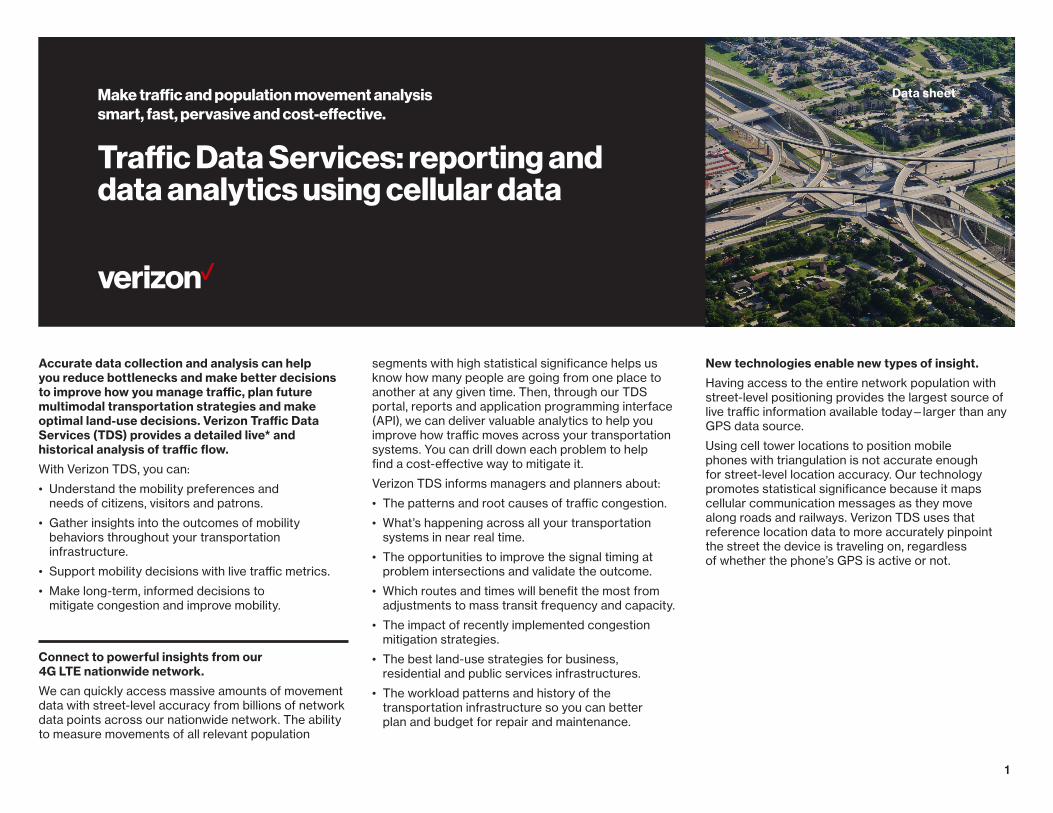
1 Make traffic and population movement analysis smart, fast, pervasive and cost-effective. Traffic Data Services: reporting and data analytics using cellular data Data sheet Accurate data collection and analysis can help you reduce bottlenecks and make better decisions to improve how you manage traffic, plan future multimodal transportation strategies and make optimal land-use decisions. Verizon Traffic Data Services (TDS) provides a detailed live* and historical analysis of traffic flow. With Verizon TDS, you can: • Understand the mobility preferences and needs of citizens, visitors and patrons. • Gather insights into the outcomes of mobility behaviors throughout your transportation infrastructure. • Support mobility decisions with live traffic metrics. • Make long-term, informed decisions to mitigate congestion and improve mobility. Connect to powerful insights from our 4G LTE nationwide network. We can quickly access massive amounts of movement data with street-level accuracy from billions of network data points across our nationwide network. The ability to measure movements of all relevant population segments with high statistical significance helps us know how many people are going from one place to another at any given time. Then, through our TDS portal, reports and application programming interface (API), we can deliver valuable analytics to help you improve how traffic moves across your transportation systems. You can drill down each problem to help find a cost-effective way to mitigate it. Verizon TDS informs managers and planners about: • The patterns and root causes of traffic congestion. • What’s happening across all your transportation systems in near real time. • The opportunities to improve the signal timing at problem intersections and validate the outcome. • Which routes and times will benefit the most from adjustments to mass transit frequency and capacity. • The impact of recently implemented congestion mitigation strategies. • The best land-use strategies for business, residential and public services infrastructures. • The workload patterns and history of the transportation infrastructure so you can better plan and budget for repair and maintenance. New technologies enable new types of insight. Having access to the entire network population with street-level positioning provides the largest source of live traffic information available today—larger than any GPS data source. Using cell tower locations to position mobile phones with triangulation is not accurate enough for street-level location accuracy. Our technology promotes statistical significance because it maps cellular communication messages as they move along roads and railways. Verizon TDS uses that reference location data to more accurately pinpoint the street the device is traveling on, regardless of whether the phone’s GPS is active or not.
Transcript
1
Make traffic and population movement analysis smart, fast, pervasive and cost-effective.
Traffic Data Services: reporting and data analytics using cellular data
Data sheet
Accurate data collection and analysis can help you reduce bottlenecks and make better decisions to improve how you manage traffic, plan future multimodal transportation strategies and make optimal land-use decisions. Verizon Traffic Data Services (TDS) provides a detailed live* and historical analysis of traffic flow.
With Verizon TDS, you can:
• Understand the mobility preferences andneeds of citizens, visitors and patrons.
• Gather insights into the outcomes of mobilitybehaviors throughout your transportationinfrastructure.
• Support mobility decisions with live traffic metrics.
• Make long-term, informed decisions tomitigate congestion and improve mobility.
Connect to powerful insights from our 4G LTE nationwide network.
We can quickly access massive amounts of movement data with street-level accuracy from billions of network data points across our nationwide network. The ability to measure movements of all relevant population
segments with high statistical significance helps us know how many people are going from one place to another at any given time. Then, through our TDS portal, reports and application programming interface (API), we can deliver valuable analytics to help you improve how traffic moves across your transportation systems. You can drill down each problem to help find a cost-effective way to mitigate it.
Verizon TDS informs managers and planners about:
• The patterns and root causes of traffic congestion.
• What’s happening across all your transportationsystems in near real time.
• The opportunities to improve the signal timing atproblem intersections and validate the outcome.
• Which routes and times will benefit the most fromadjustments to mass transit frequency and capacity.
• The impact of recently implemented congestionmitigation strategies.
• The best land-use strategies for business,residential and public services infrastructures.
• The workload patterns and history of thetransportation infrastructure so you can betterplan and budget for repair and maintenance.
New technologies enable new types of insight.
Having access to the entire network population with street-level positioning provides the largest source of live traffic information available today—larger than any GPS data source.
Using cell tower locations to position mobile phones with triangulation is not accurate enough for street-level location accuracy. Our technology promotes statistical significance because it maps cellular communication messages as they move along roads and railways. Verizon TDS uses that reference location data to more accurately pinpoint the street the device is traveling on, regardless of whether the phone’s GPS is active or not.
2
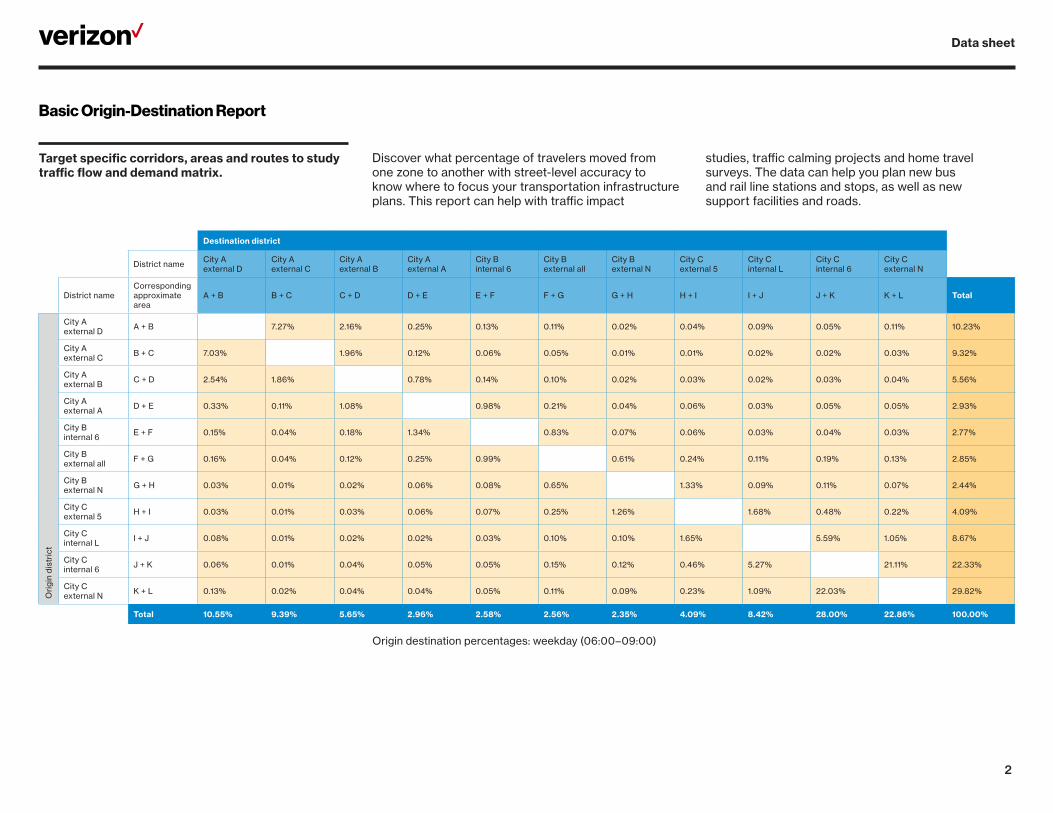
Basic Origin-Destination Report
Target specific corridors, areas and routes to study traffic flow and demand matrix.
Discover what percentage of travelers moved from one zone to another with street-level accuracy to know where to focus your transportation infrastructure plans. This report can help with traffic impact
studies, traffic calming projects and home travel surveys. The data can help you plan new bus and rail line stations and stops, as well as new support facilities and roads.
Data sheet
Destination district
District name City A external D
City A external C
City A external B
City A external A
City B internal 6
City B external all
City B external N
City C external 5
City C internal L
City C internal 6
City C external N
District nameCorresponding approximate area
A + B B + C C + D D + E E + F F + G G + H H + I I + J J + K K + L Total
Ori
gin
dis
tric
t
City A external D A + B 7.27% 2.16% 0.25% 0.13% 0.11% 0.02% 0.04% 0.09% 0.05% 0.11% 10.23%
City A external C B + C 7.03% 1.96% 0.12% 0.06% 0.05% 0.01% 0.01% 0.02% 0.02% 0.03% 9.32%
City A external B C + D 2.54% 1.86% 0.78% 0.14% 0.10% 0.02% 0.03% 0.02% 0.03% 0.04% 5.56%
City A external A D + E 0.33% 0.11% 1.08% 0.98% 0.21% 0.04% 0.06% 0.03% 0.05% 0.05% 2.93%
City B internal 6 E + F 0.15% 0.04% 0.18% 1.34% 0.83% 0.07% 0.06% 0.03% 0.04% 0.03% 2.77%
City B external all F + G 0.16% 0.04% 0.12% 0.25% 0.99% 0.61% 0.24% 0.11% 0.19% 0.13% 2.85%
City B external N G + H 0.03% 0.01% 0.02% 0.06% 0.08% 0.65% 1.33% 0.09% 0.11% 0.07% 2.44%
City C external 5 H + I 0.03% 0.01% 0.03% 0.06% 0.07% 0.25% 1.26% 1.68% 0.48% 0.22% 4.09%
City C internal L I + J 0.08% 0.01% 0.02% 0.02% 0.03% 0.10% 0.10% 1.65% 5.59% 1.05% 8.67%
City C internal 6 J + K 0.06% 0.01% 0.04% 0.05% 0.05% 0.15% 0.12% 0.46% 5.27% 21.11% 22.33%
City C external N K + L 0.13% 0.02% 0.04% 0.04% 0.05% 0.11% 0.09% 0.23% 1.09% 22.03% 29.82%
Determine traffic flow characteristics through specific points at different times of day when congestion is detected.
Find out the percentage of vehicles and passengers from those traveling through a specific road or railway route during specific hours. This sample report shows vehicles that traveled through a specific corridor, which neighborhoods they came from and where they went. Among the key data points that will provide valuable information are:
• How many people actually need to get to a specified city/neighborhood/corridor?
• How many are only passing through and could be re-routed in some other way to relieve congestion?
Data sheet
Time of day (hours)
Cote-Des-Neiges
Le Plateau-Mont-Royal Le Sud-Ouest
Mercier-Hochelaga-Maisonneuve
Outremont Rosemont-La Petite-Patrie
0-3 72% 67% 79% 76% 69% 72%
3-6 55% 65% 55% 74% 38% 68%
6-9 50% 42% 56% 61% 31% 54%
9-12 57% 53% 60% 58% 41% 44%
12-15 66% 61% 70% 71% 72% 63%
15-18 73% 72% 73% 77% 54% 70%
18-21 71% 72% 76% 77% 68% 74%
21-24 65% 79% 80% 80% 70% 74%
Total 64.9% 60.5% 68.2% 68.3% 54.3% 60.0%
Percentage of travelers at a specific time interval and from a specific neighborhood out of total travelers who passed through a select city and didn’t stay there more than two hours
Time of day (hours)
Cote-Des-Neiges
Le Plateau-Mont-Royal Le Sud-Ouest
Mercier-Hochelaga-Maisonneuve
Outremont Rosemont-La Petite-Patrie Total
0-3 136 127 191 114 11 105 684
3-6 113 187 110 343 6 192 951
6-9 725 808 646 1,177 55 1,093 4,504
9-12 1,134 1,329 1,280 1,269 212 1,195 6,419
12-15 1,337 1,442 1,169 1,212 307 1,423 6,890
15-18 1,420 1,560 1,250 1,244 232 1,429 7,135
18-21 916 1,045 1,148 763 136 838 4,846
21-24 583 415 595 357 28 405 2,383
Total 6,364 6,913 6,389 6,479 987 6,680 33,812
Daily number of people who traveled through a select city and didn’t stay more than two hours from each neighborhood
4
Cellular Counting Station Map Report
Track the volume patterns of vehicles traveling through targeted points.
Traffic Data Services can provide details on the volume patterns of vehicles passing through specific points on city streets and highways. After initial calibration with your manual counting tools or temporary sensors, this report displays the number of vehicles per month per sensor. We can alert you when traffic volume reaches a pre-set threshold. This will help you:
• Better plan infrastructure changes or change what you’re measuring, while turning temporary counting events into permanent counting stations.
• Save you the cost of routinely measuring the same roads every couple of years, even if there are no changes.
• Eliminate the cost of implementing permanent counting stations in all key locations.
Data sheet
Virtual counting stations
5
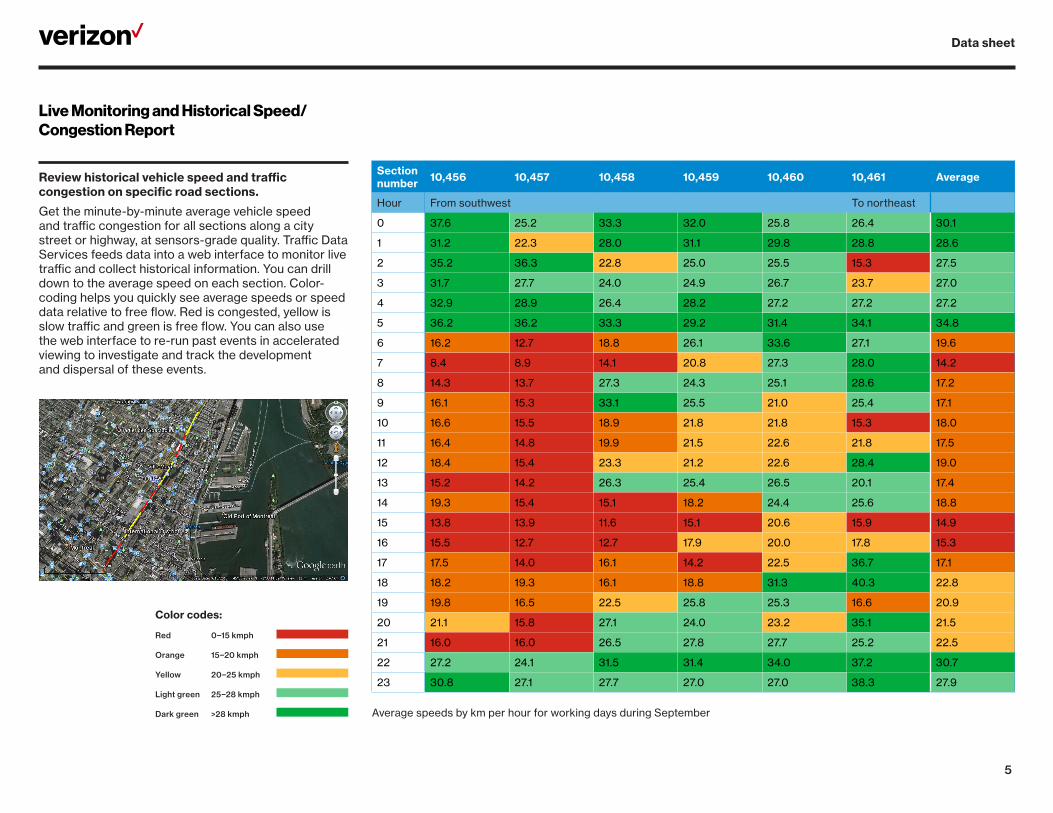
Live Monitoring and Historical Speed/ Congestion Report
Review historical vehicle speed and traffic congestion on specific road sections.
Get the minute-by-minute average vehicle speed and traffic congestion for all sections along a city street or highway, at sensors-grade quality. Traffic Data Services feeds data into a web interface to monitor live traffic and collect historical information. You can drill down to the average speed on each section. Color-coding helps you quickly see average speeds or speed data relative to free flow. Red is congested, yellow is slow traffic and green is free flow. You can also use the web interface to re-run past events in accelerated viewing to investigate and track the development and dispersal of these events.
Data sheet
Average speeds by km per hour for working days during September
Section number 10,456 10,457 10,458 10,459 10,460 10,461 Average
Hour From southwest To northeast
0 37.6 25.2 33.3 32.0 25.8 26.4 30.1
1 31.2 22.3 28.0 31.1 29.8 28.8 28.6
2 35.2 36.3 22.8 25.0 25.5 15.3 27.5
3 31.7 27.7 24.0 24.9 26.7 23.7 27.0
4 32.9 28.9 26.4 28.2 27.2 27.2 27.2
5 36.2 36.2 33.3 29.2 31.4 34.1 34.8
6 16.2 12.7 18.8 26.1 33.6 27.1 19.6
7 8.4 8.9 14.1 20.8 27.3 28.0 14.2
8 14.3 13.7 27.3 24.3 25.1 28.6 17.2
9 16.1 15.3 33.1 25.5 21.0 25.4 17.1
10 16.6 15.5 18.9 21.8 21.8 15.3 18.0
11 16.4 14.8 19.9 21.5 22.6 21.8 17.5
12 18.4 15.4 23.3 21.2 22.6 28.4 19.0
13 15.2 14.2 26.3 25.4 26.5 20.1 17.4
14 19.3 15.4 15.1 18.2 24.4 25.6 18.8
15 13.8 13.9 11.6 15.1 20.6 15.9 14.9
16 15.5 12.7 12.7 17.9 20.0 17.8 15.3
17 17.5 14.0 16.1 14.2 22.5 36.7 17.1
18 18.2 19.3 16.1 18.8 31.3 40.3 22.8
19 19.8 16.5 22.5 25.8 25.3 16.6 20.9
20 21.1 15.8 27.1 24.0 23.2 35.1 21.5
21 16.0 16.0 26.5 27.8 27.7 25.2 22.5
22 27.2 24.1 31.5 31.4 34.0 37.2 30.7
23 30.8 27.1 27.7 27.0 27.0 38.3 27.9
Color codes:
Red 0–15 kmph
Orange 15–20 kmph
Yellow 20–25 kmph
Light green 25–28 kmph
Dark green >28 kmph
6
Micro Origin/Destination and Turning Movement Data Report for signal tuning
Collect and analyze turning movement data at complex intersections.
Measure traffic flow at distributed junctions and roundabouts where manual counting is difficult and automatic number-plate recognition is cost- prohibitive. The report can provide the percentage of turning data to help improve the way you tune and time traffic lights at each intersection. We can continue reporting anytime without having to do any physical work at the intersections. The data can be combined with the typical delay in the junction from each direction to better optimize and later validate the signal tuning results.
Which percentage exited City A in the junction 34.4% 52.0% 58.6% 34.3% 40.9% 44.2%
Which percentage stayed onCity A through the junction 65.6% 48.0% 41.4% 65.7% 59.1% 55.8%
All (including weekends and holidays)
Work days
6:00-10:00
10:00-15:00
15:00-19:00
6:00-19:00
Which percentage entered to City A in the junction 38.9% 55.1% 47.8% 51.1% 51.9% 50.5%
Which percentage arrived onCity A before the junction 61.1% 44.9% 52.2% 48.9% 48.1% 49.5%
Analysis of those arrived at the junction from City A
Analysis of those who traveled on City A after the junction
The entry/exit routes can be visually seen in the above map of City A
Learn more.Contact your Smart Communities business development manager or Verizon Wireless business specialist to discover how our Traffic Data Services can help you make more informed decisions about your transportation systems. Visit verizonenterprise.com/traffic-data-services.
* Data from Verizon TDS is refreshed every 2.5 minutes. Most sensors for real-time traffic data reporting deliver updates every five minutes, and it takes more time to post on the dynamic message signs.


![TRAFFIC DATA PLATFORM AS ITS INFRASTRUCTURE FOR ...€¦ · 2. Airborne traffic data Traffic data from aerial radar or video images [5, 6] (extraction of relevant traffic information](https://static.documents.pub/doc/80x56/5f087e867e708231d42249d2/traffic-data-platform-as-its-infrastructure-for-2-airborne-traffic-data-traffic.jpg)


