33
Smart Grid & WAMS Women in Engineering/ Young Professional opening talk 26/01/2016 Vaishali Rampurkar [email protected]
Smart Grid & WAMS
Women in Engineering/ Young Professional opening talk 26/01/2016
Vaishali [email protected]
Outline of Presentation
Smart GridWhy do we need Smart Grid?What is Smart Grid? Smart Grid conceptual model
Wide Area Monitoring systemsWhat is WAMsWAMS Architecture
Applications of Phasor Measurement Unit (PMU) Concluding Remarks
2
Why Smart Grid?
As the world’s electricity systems face a number of challenges such as New dynamics of future demand and supply Ageing infrastructure Complex interconnected grids Integration of large number of renewable generation sources Need to lower carbon emissions New type of loads such as Electric Vehicles
3
Definition
A Smart Grid is self-healing, enables active participation of consumers,operate resiliently against attack and natural disasters, accommodate allgeneration and storage options, enable introduction of new products,services and markets, optimize asset utilization and operate efficiently,provide power quality for the digital economy.
Source: US Department of Energy
A Smart Grid is an electricity network that can intelligently integratethe actions of all users connected to it – generators, consumers andthose that do both – in order to efficiently deliver sustainable, economicand secure electricity supplies.
Source: European Technology Platform Smart Grids
4
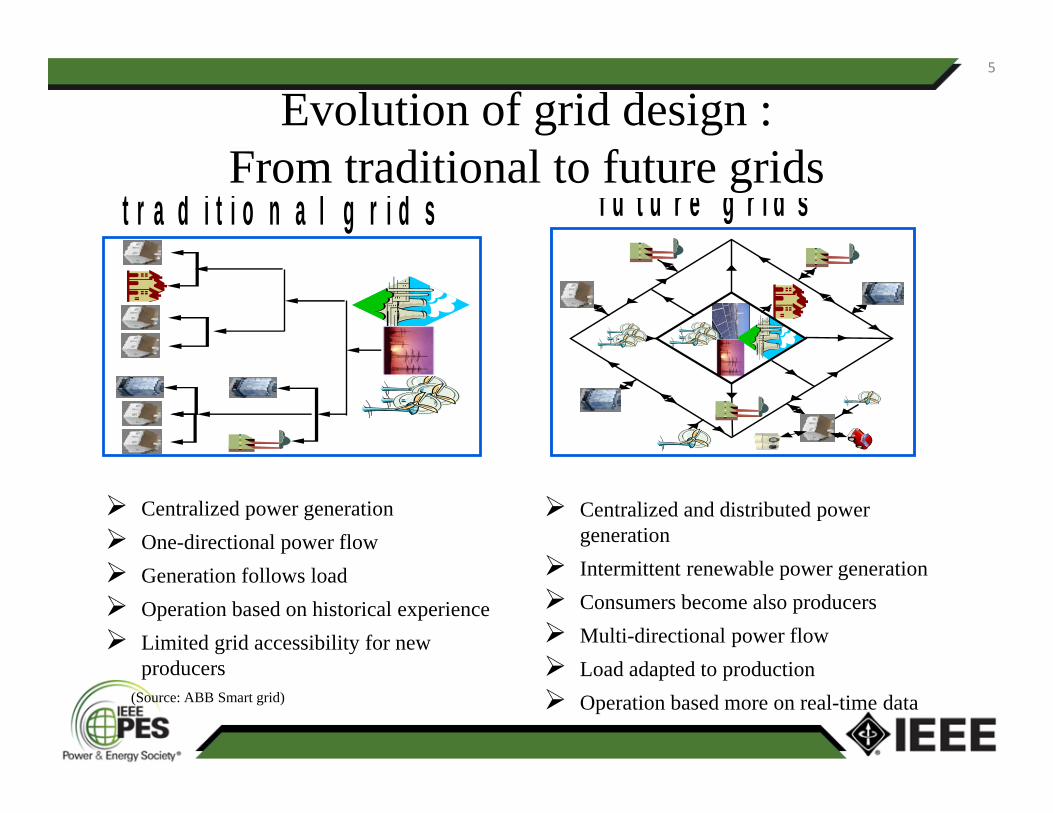
Evolution of grid design :From traditional to future grids
Centralized power generation One-directional power flow Generation follows load Operation based on historical experience Limited grid accessibility for new
producers (Source: ABB Smart grid)
Centralized and distributed power generation
Intermittent renewable power generation Consumers become also producers Multi-directional power flow Load adapted to production Operation based more on real-time data
5
t r a d i t i o n a l g r i d s f u t u r e g r i d s

Smart Grid Conceptual Model
Smart Grid - A large "System of Systems”
Bulk Generation Transmission Distribution Customers Operations Markets Service Providers
(Source : IEEE Smart grid)
6

Bulk GenerationRenewable sources
VariableSolarWind
Non-variableHydroBiomassGeothermalPumpStorage
Non-renewablesourcesNon-variable
Nuclear coal gas.
7
Distribution
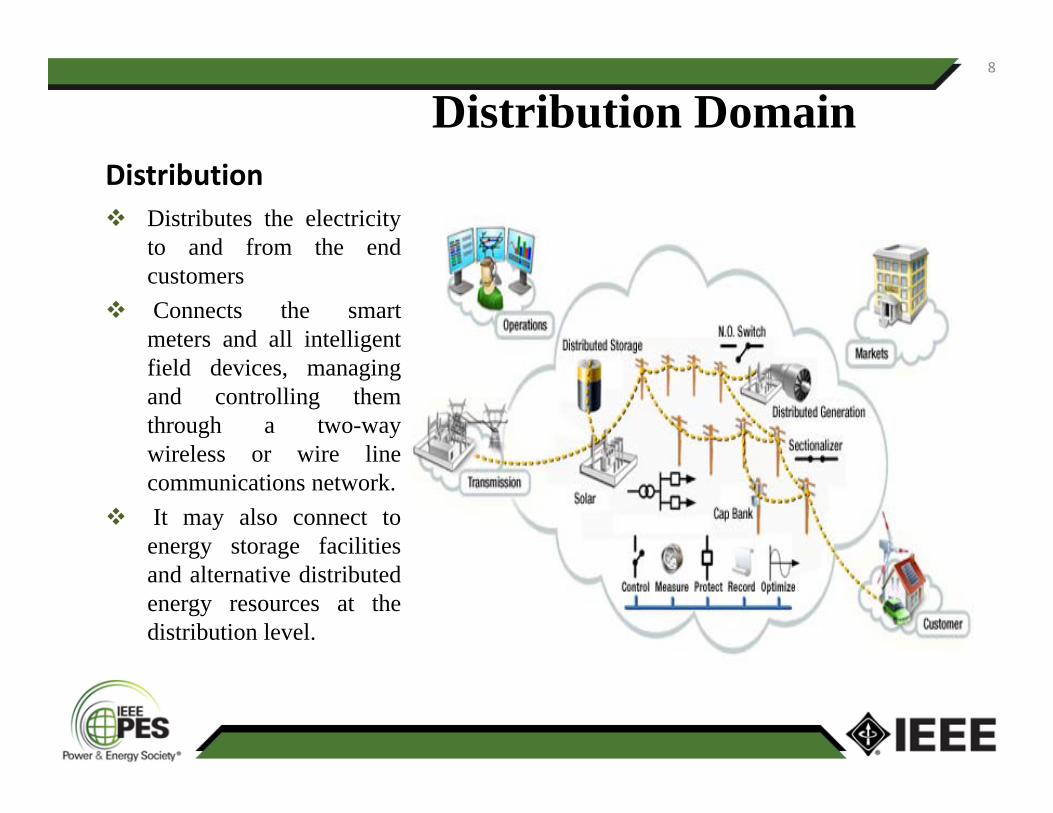
Distribution Domain
Distributes the electricityto and from the endcustomers
Connects the smartmeters and all intelligentfield devices, managingand controlling themthrough a two-waywireless or wire linecommunications network.
It may also connect toenergy storage facilitiesand alternative distributedenergy resources at thedistribution level.
8
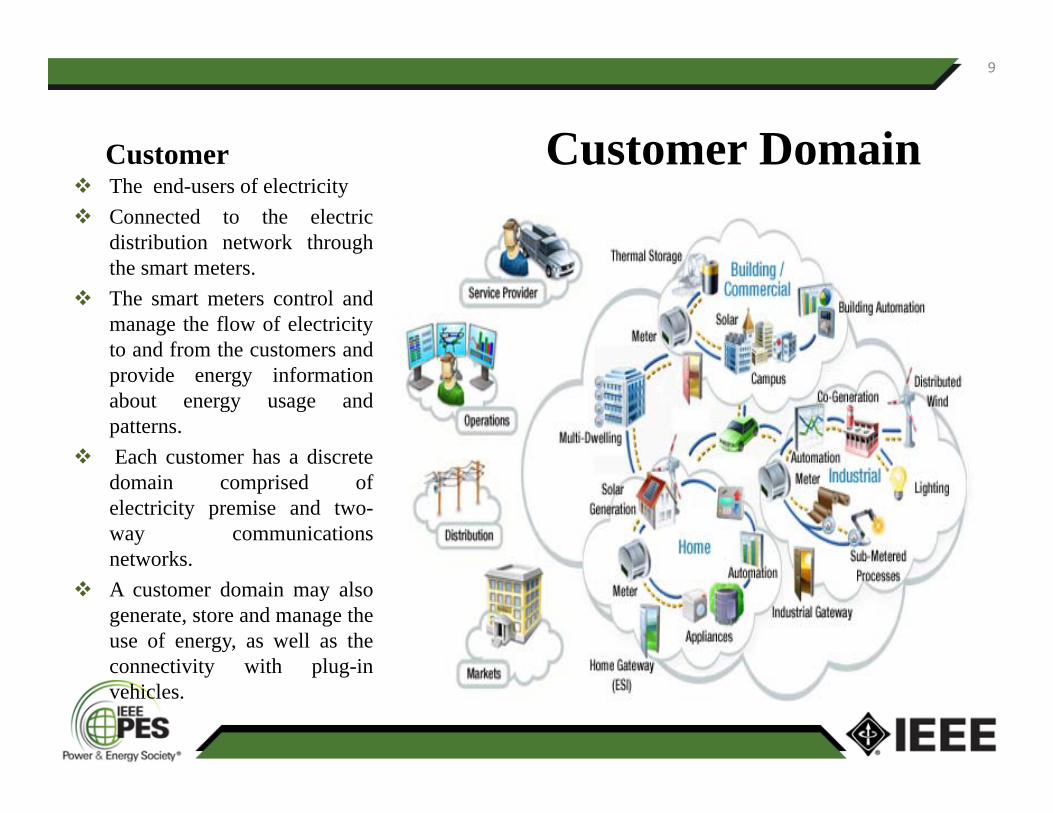
Customer The end-users of electricity Connected to the electric
distribution network throughthe smart meters.
The smart meters control andmanage the flow of electricityto and from the customers andprovide energy informationabout energy usage andpatterns.
Each customer has a discretedomain comprised ofelectricity premise and two-way communicationsnetworks.
A customer domain may alsogenerate, store and manage theuse of energy, as well as theconnectivity with plug-invehicles.
Customer Domain
9
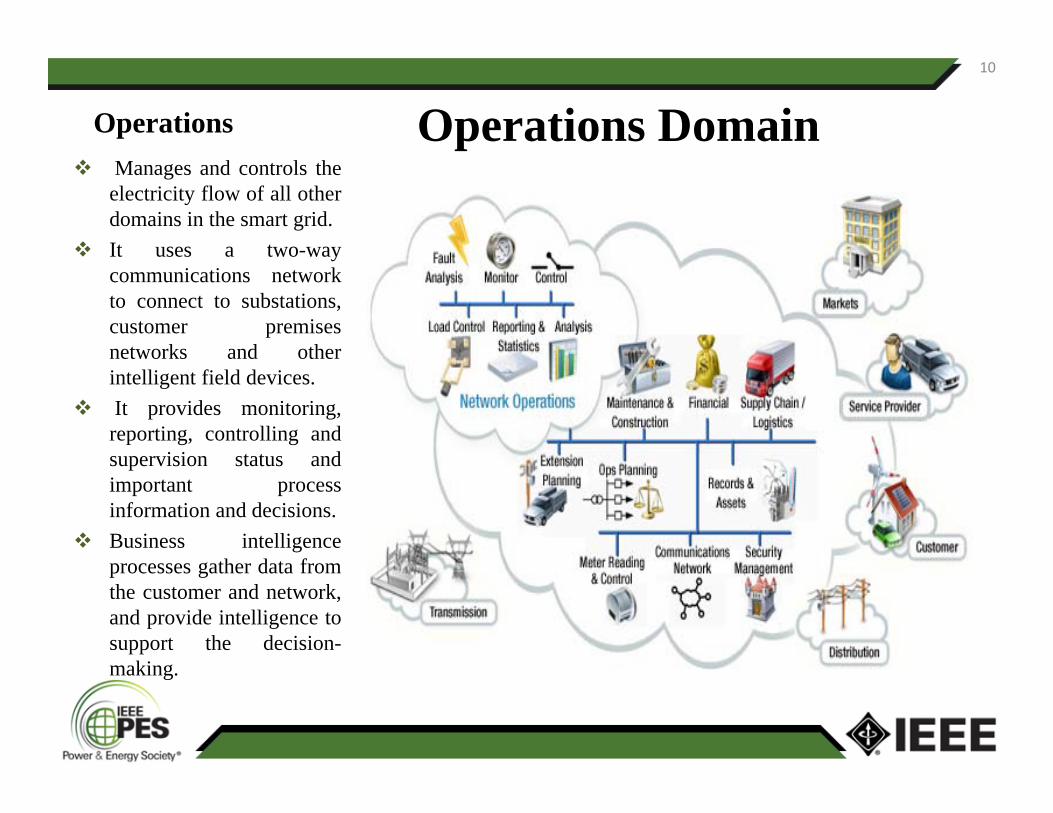
Operations Manages and controls the
electricity flow of all otherdomains in the smart grid.
It uses a two-waycommunications networkto connect to substations,customer premisesnetworks and otherintelligent field devices.
It provides monitoring,reporting, controlling andsupervision status andimportant processinformation and decisions.
Business intelligenceprocesses gather data fromthe customer and network,and provide intelligence tosupport the decision-making.
Operations Domain10
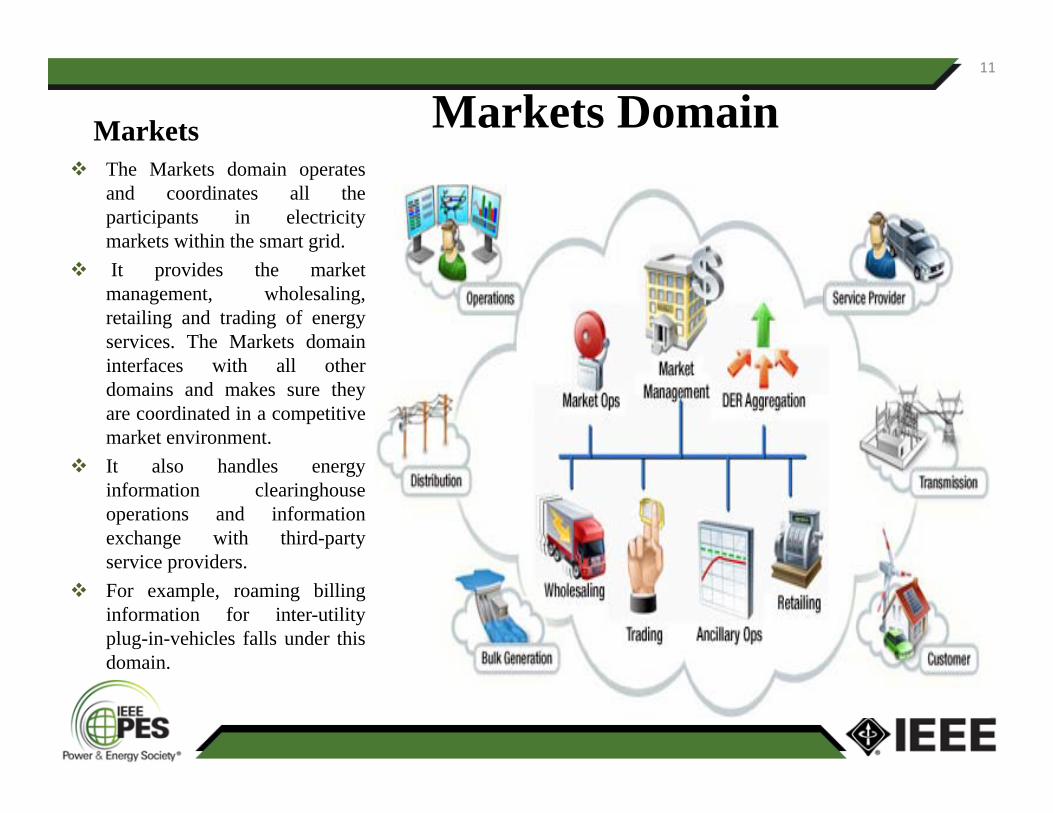
Markets The Markets domain operates
and coordinates all theparticipants in electricitymarkets within the smart grid.
It provides the marketmanagement, wholesaling,retailing and trading of energyservices. The Markets domaininterfaces with all otherdomains and makes sure theyare coordinated in a competitivemarket environment.
It also handles energyinformation clearinghouseoperations and informationexchange with third-partyservice providers.
For example, roaming billinginformation for inter-utilityplug-in-vehicles falls under thisdomain.
Markets Domain11

Service Provider
Smart grid handles all third-party operations among thedomains.
These might include webportals that provide energyefficiency managementservices to end-customers,data exchange between thecustomer and the utilitiesregarding energymanagement, and regardingthe electricity supplied tohomes and buildings.
It may also manage otherprocesses for the utilities, suchas demand response programs,outage management and fieldservices.
Service Provider Domain12
It means everyone has to play their part effectively to make our grid more efficient
13
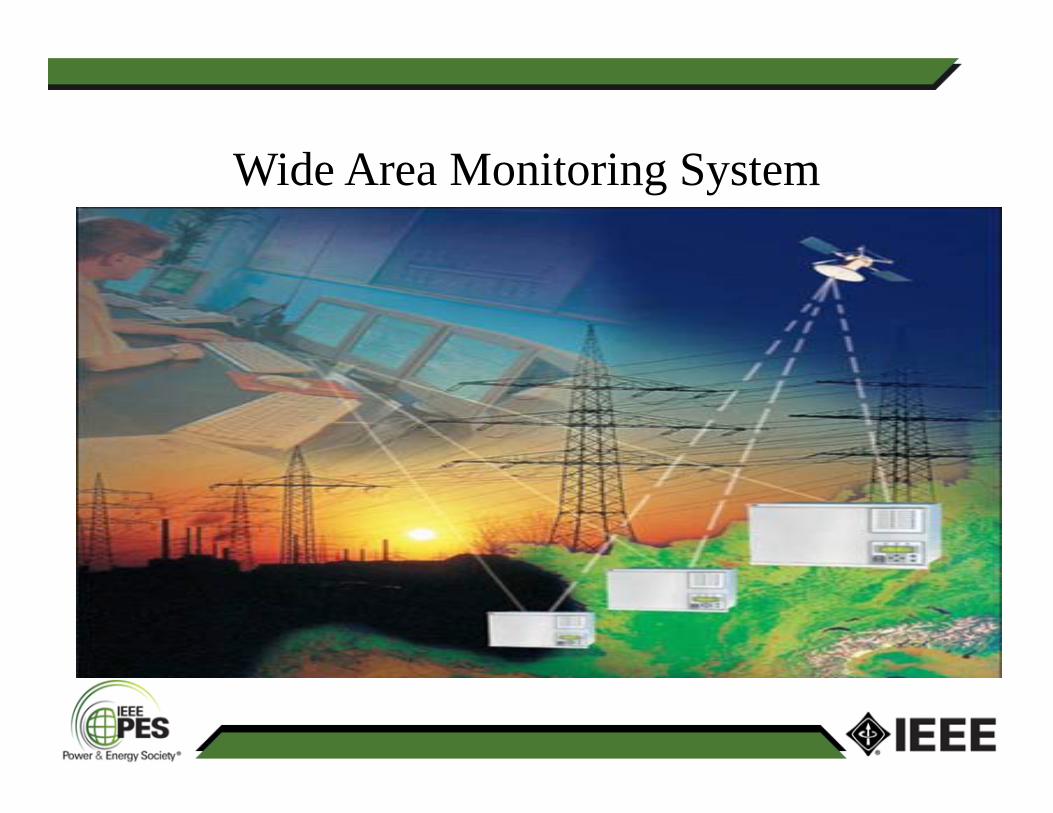
Wide Area Monitoring System

WAMS-Definition
It’s a collective technology to monitor power systemdynamics in real time, identify system stability relatedweakness and helps to design and implement countermeasures.(IEEE)
It is based on Phasor measurement units(PMUs) whichcan deliver precisely time synchronized values of voltageand current phasors and other power system relatedquantities like frequency, ROCOF, breaker positions.
15
Components of WAMS
Phasor Measurement Unit (PMU) Phasor Data Concentrator (PDC) Global Positioning System (GPS for Time
Synchronization of the phasors) Communication channel (Preferably optical fiber cable) Visualization and analysis tools Wide area situational awareness system. Wide area protection and control
16
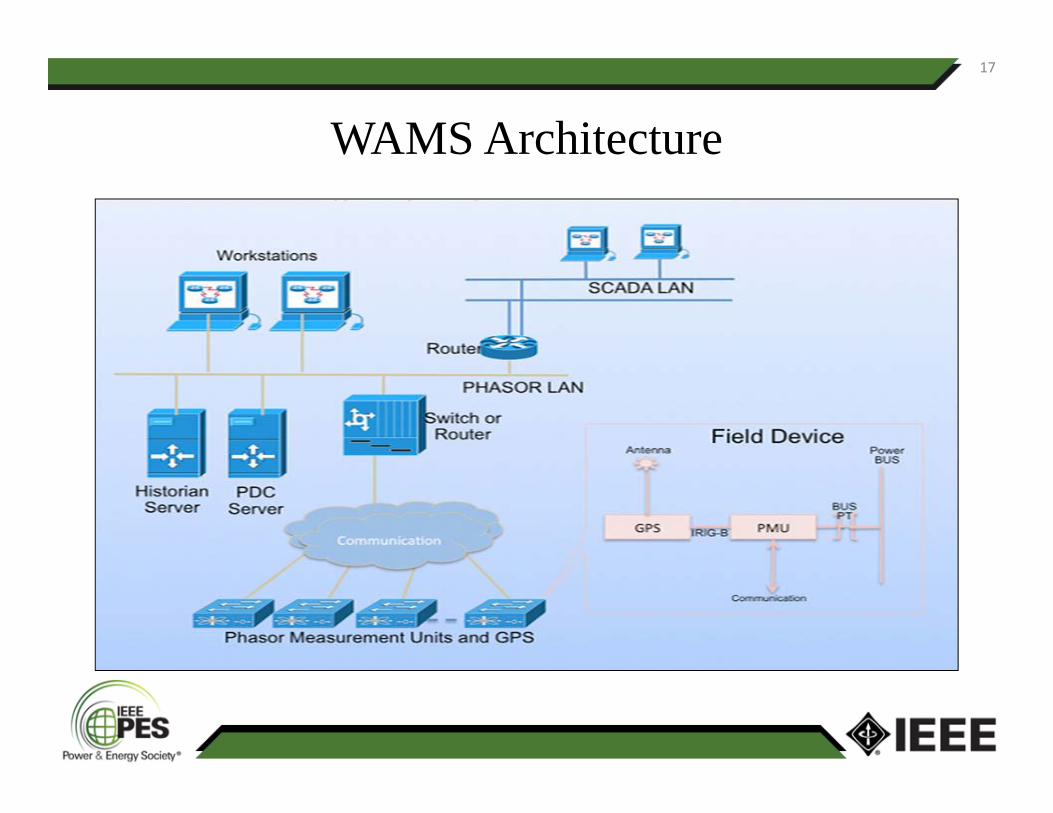
WAMS Architecture
17
Phasor Measurement Unit (PMU)
The Phasor Measurement Unit (PMU) is a Power Systemdevice capable of measuring the synchronized voltage andcurrent Phasor in a Power System.Synchronicity among Phasor Measurement Units (PMUs)
is achieved by same-time sampling of voltage and currentwaveforms using a common synchronizing signal fromthe global positioning satellite (GPS).The ability to calculate synchronized phasors makes the
PMU one of the most important measuring devices in thefuture of power system monitoring and control.
18
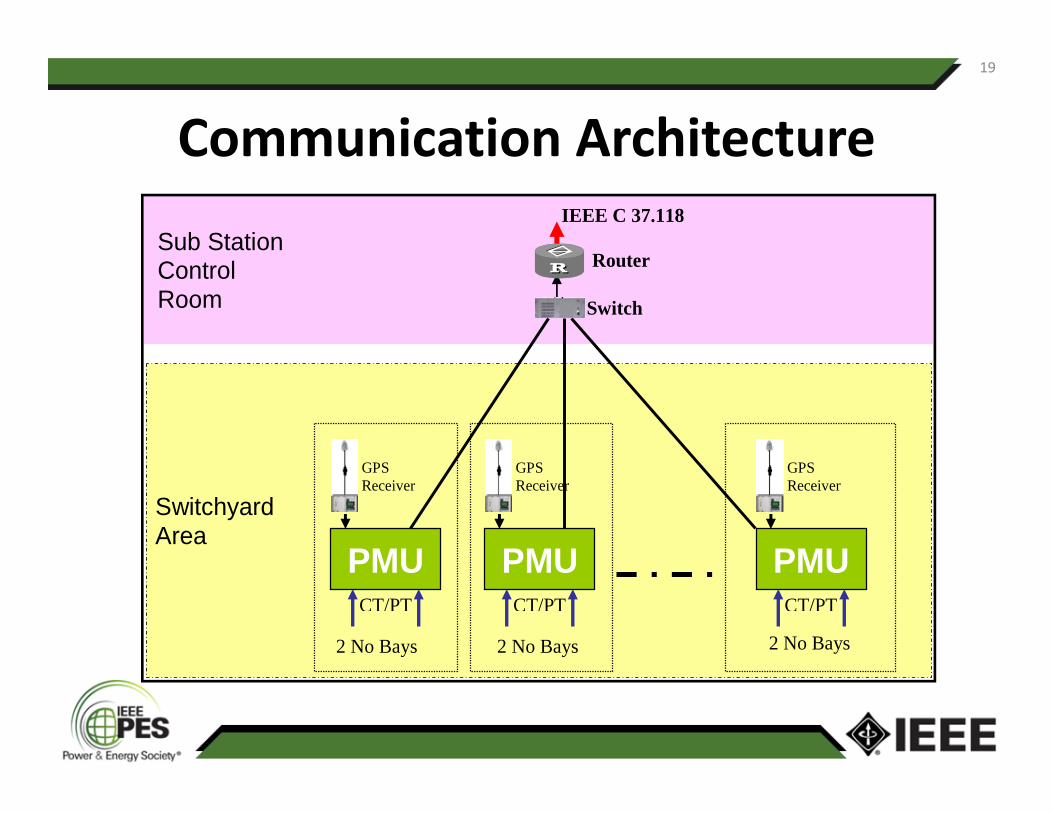
Communication Architecture19
Sub Station Control Room
Switchyard Area
2 No Bays
IEEE C 37.118
PMU
GPS Receiver
CT/PT
PMU
GPS Receiver
CT/PT
PMU
GPS Receiver
CT/PT
2 No Bays 2 No Bays
Router
Switch

Key advantages for Phasor deployment ...
Accurate phase angle measurements independent of frequency variations
Real time synchronized differencesWide area protection Improve grid stability/reliability Minimize transmission congestion Optimize transmission capacity Forecasting grid instability and early warning to prevent
blackouts and cascade collapse
20
PMU Applications
Oscillation detectionFault location identificationFault classificationEvent analysisModel validationSituational awareness
21
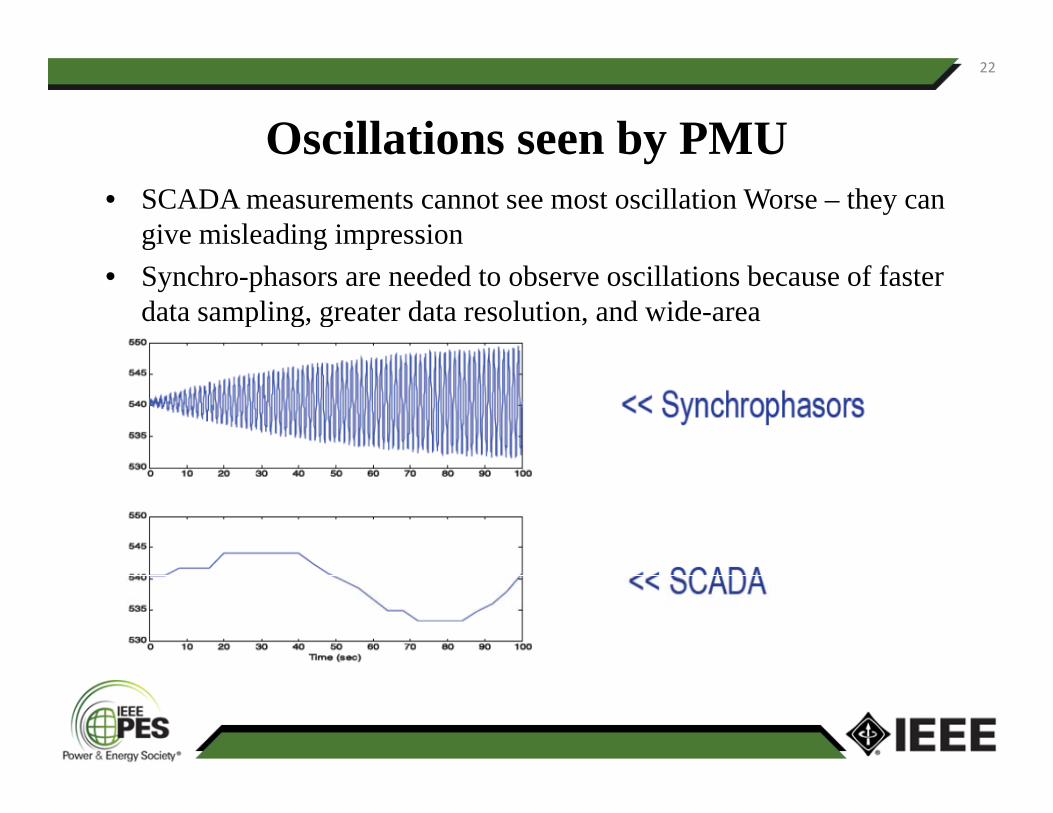
Oscillations seen by PMU• SCADA measurements cannot see most oscillation Worse – they can
give misleading impression• Synchro-phasors are needed to observe oscillations because of faster
data sampling, greater data resolution, and wide-area synchronization
22
PMU APPLICATIONS & ANALYTICSINDIAN POWER SYSTEM
23

Oscillation monitoring and analysis
24
49.55
49.6
49.65
49.7
49.75
49.8
49.85
49.9
49.95
‐0.2
‐0.15
‐0.1
‐0.05
0
0.05
0.1
0.15
0.2
0.25
0.3
22:02:15
.000
22:02:17
.360
22:02:19
.720
22:02:22
.080
22:02:24
.440
22:02:26
.800
22:02:29
.160
22:02:31
.520
22:02:33
.880
22:02:36
.240
22:02:38
.600
22:02:40
.960
22:02:43
.320
22:02:45
.679
22:02:48
.040
22:02:50
.400
22:02:52
.760
22:02:55
.120
22:02:57
.480
22:02:59
.840
22:03:02
.200
22:03:04
.559
22:03:06
.920
22:03:09
.280
22:03:11
.640
22:03:14
.000
22:03:16
.360
22:03:18
.720
22:03:21
.080
22:03:23
.440
22:03:25
.800
22:03:28
.160
22:03:30
.520
22:03:32
.880
22:03:35
.240
22:03:37
.600
22:03:39
.960
22:03:42
.320
22:03:44
.679
22:03:47
.040
22:03:49
.400
22:03:51
.760
22:03:54
.120
22:03:56
.480
22:03:58
.840
Frequency (Hz)ROCO
F(Hz
/sec)
Raipur df/dt Raipur Frequency
Tripping of Raigarh ‐Sterlite II
Oscillation started in systemat 22:02:38.520
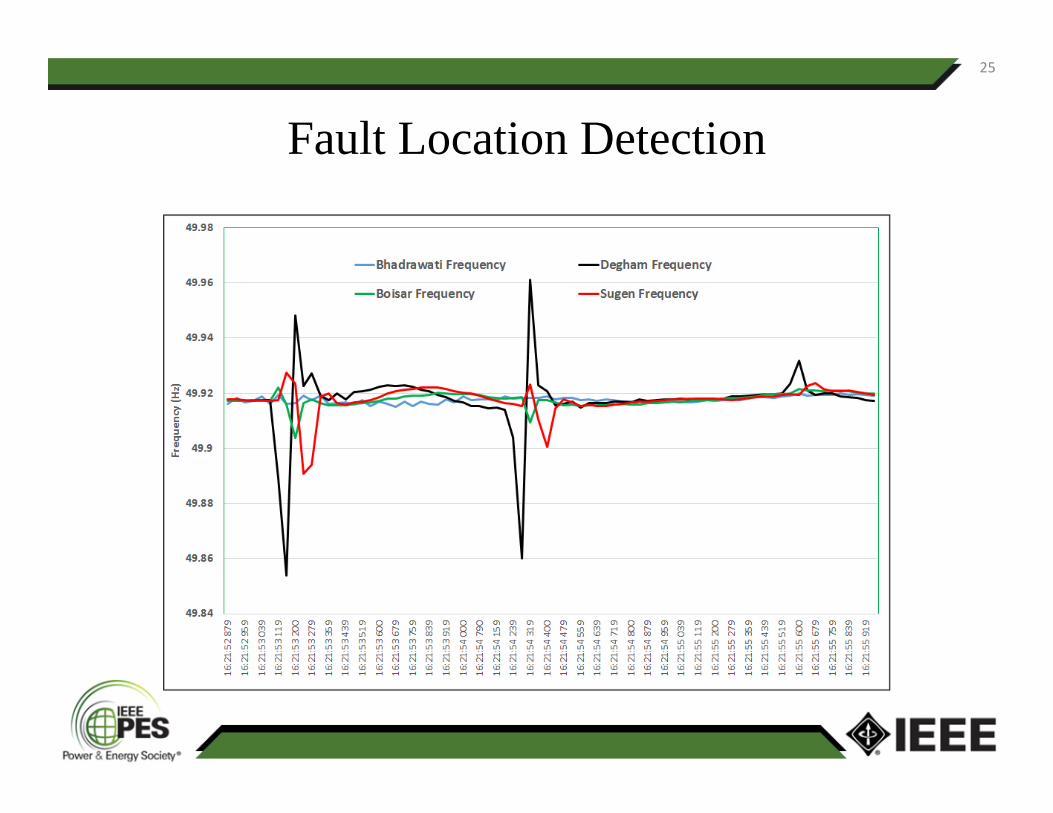
Fault Location Detection
25
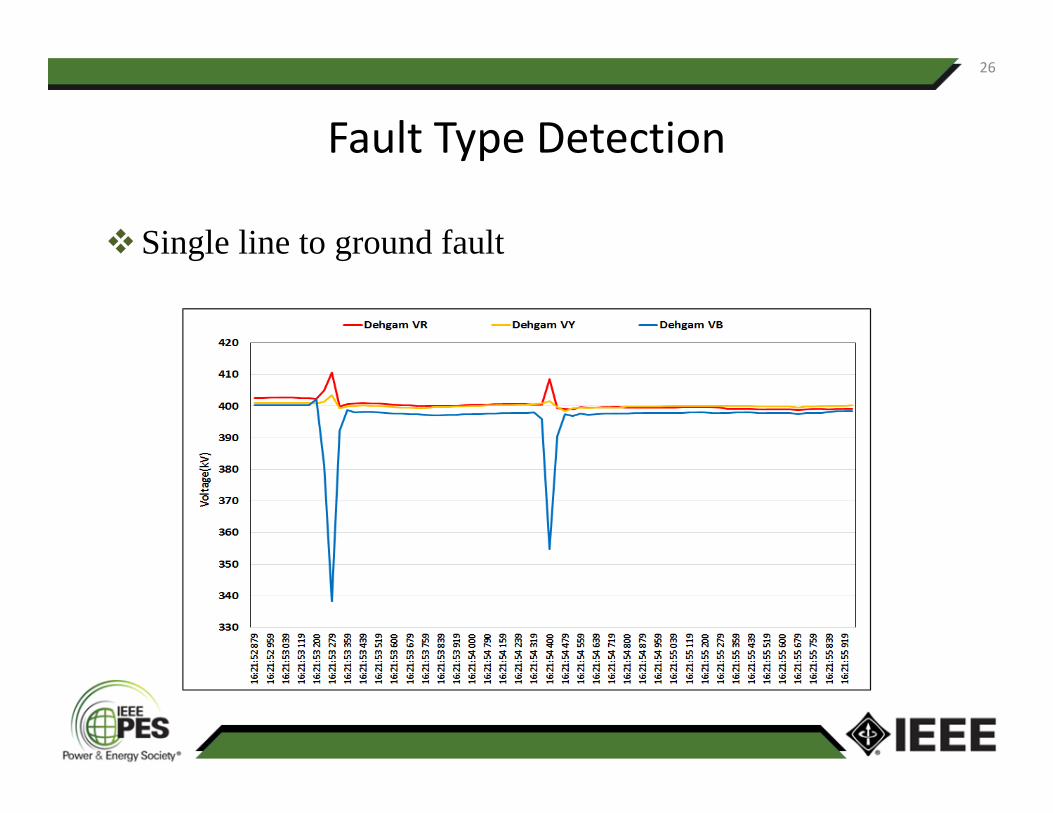
Fault Type Detection
Single line to ground fault
26
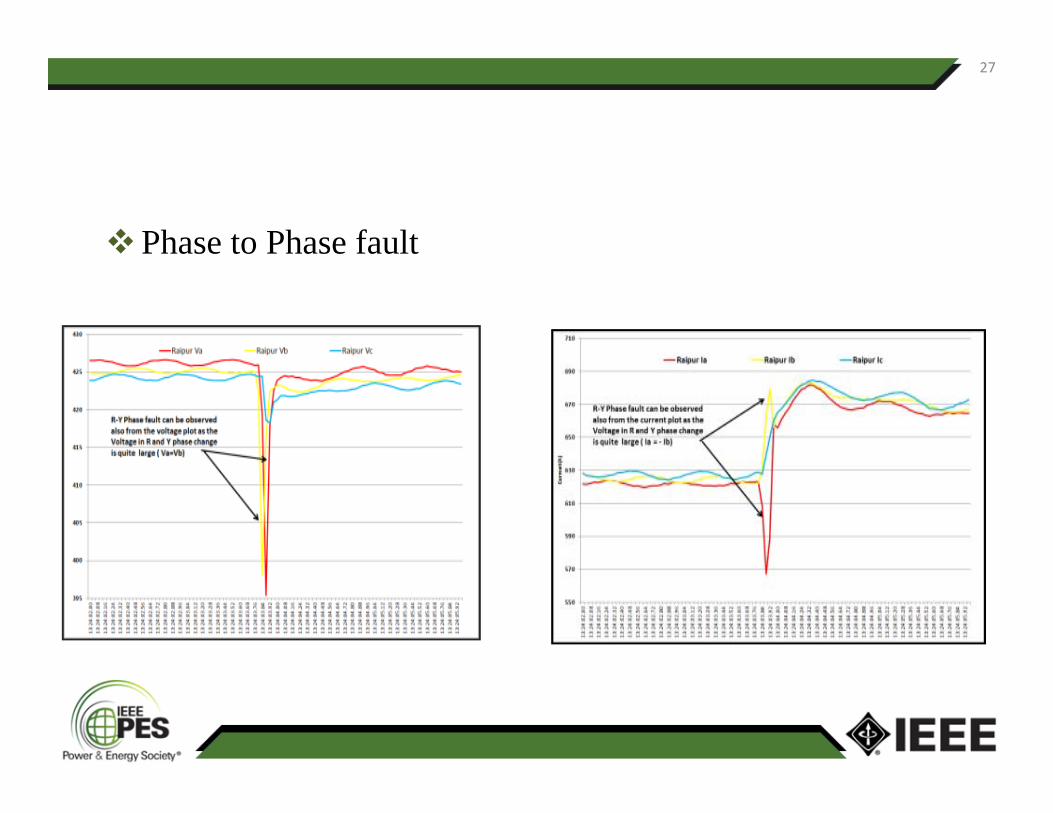
Phase to Phase fault
27
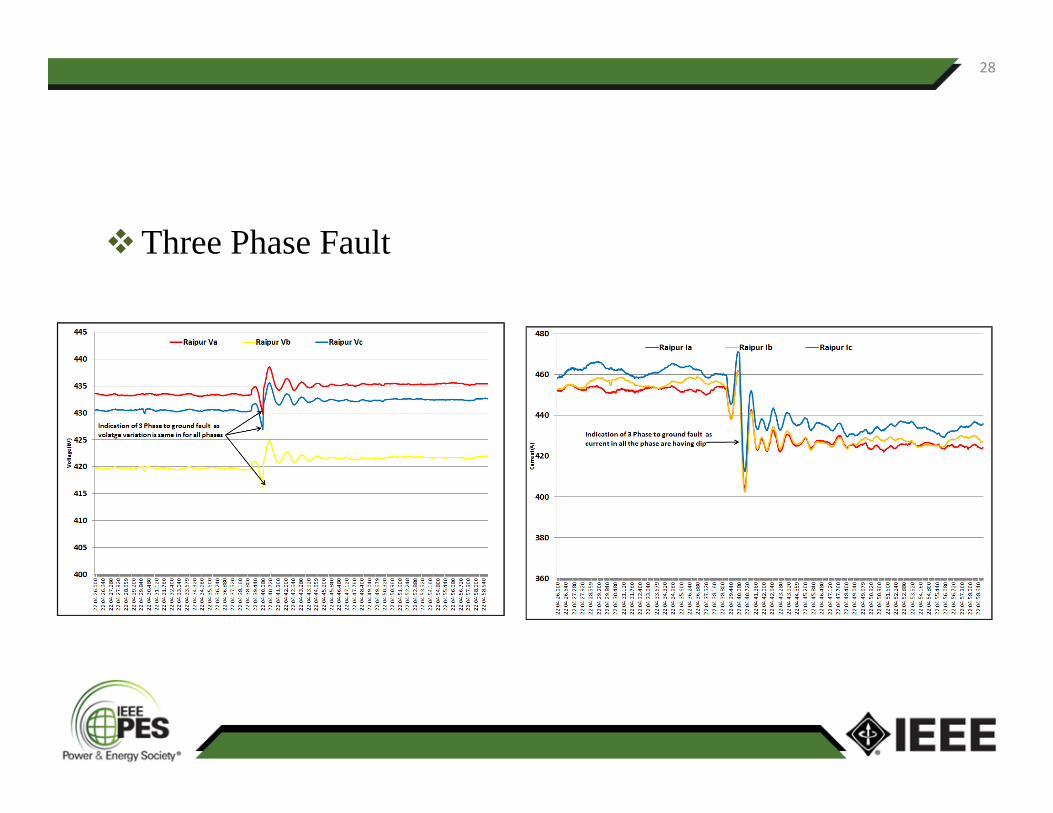
Three Phase Fault
28
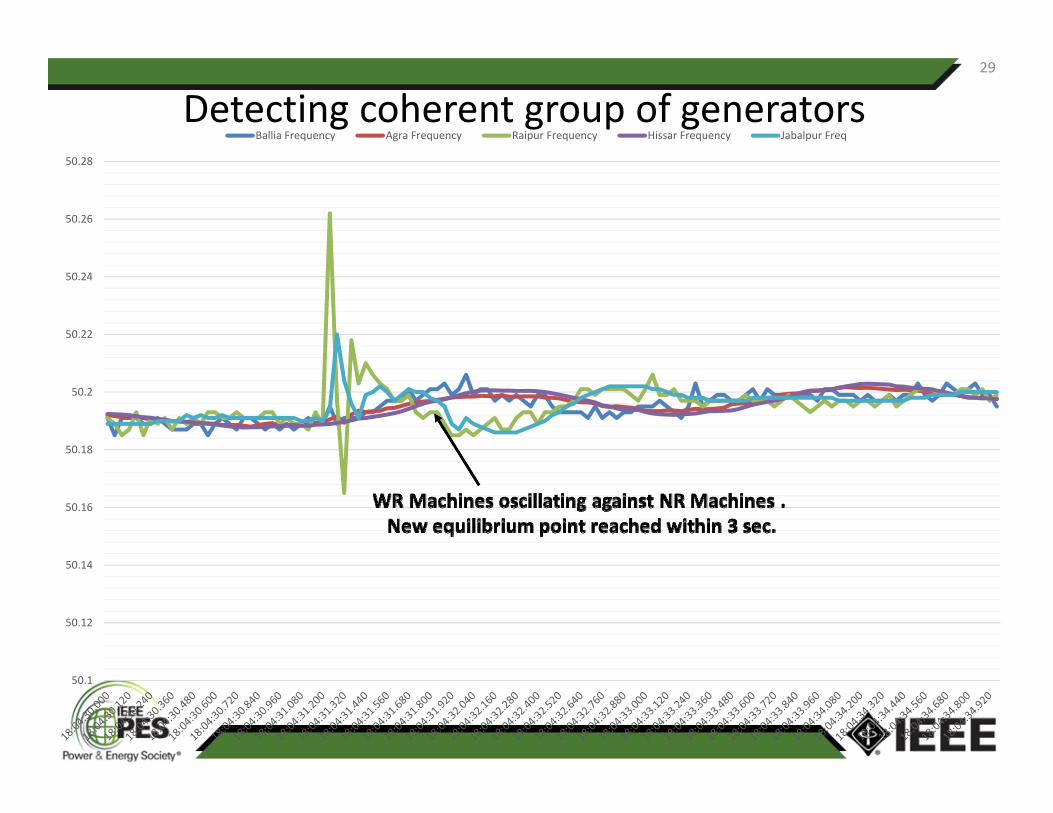
Detecting coherent group of generators
50.1
50.12
50.14
50.16
50.18
50.2
50.22
50.24
50.26
50.28
Ballia Frequency Agra Frequency Raipur Frequency Hissar Frequency Jabalpur Freq
29
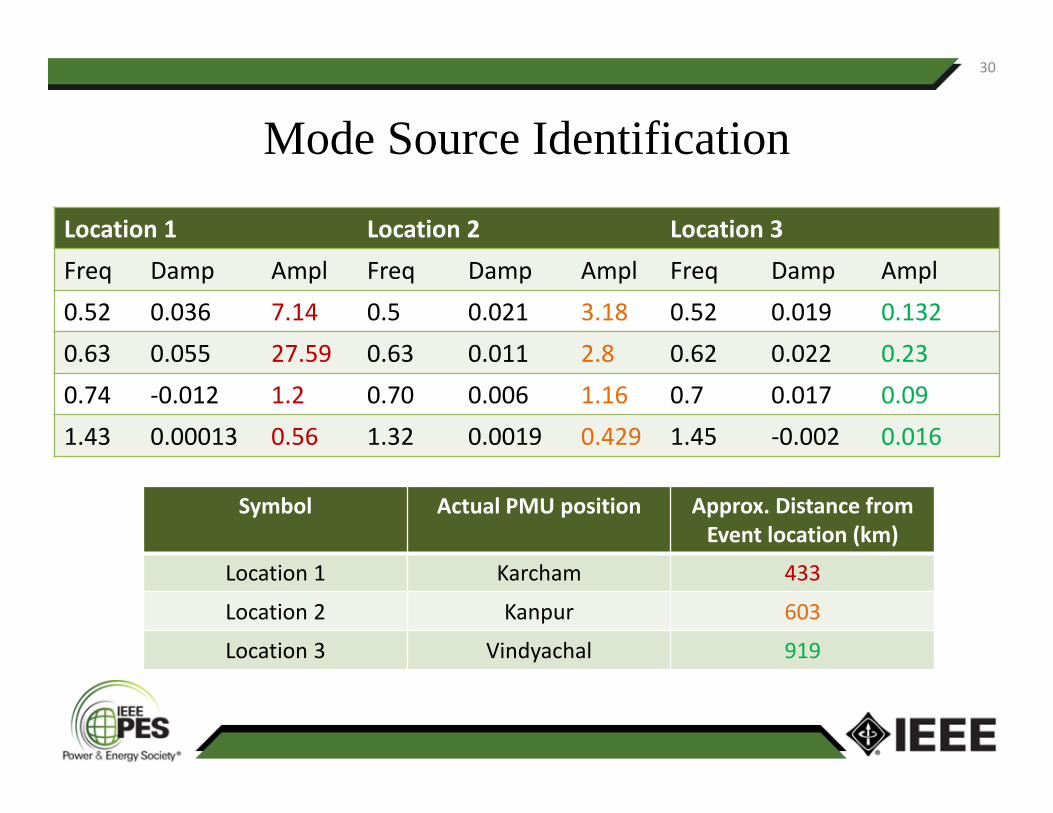
Mode Source Identification
30
Location 1 Location 2 Location 3Freq Damp Ampl Freq Damp Ampl Freq Damp Ampl0.52 0.036 7.14 0.5 0.021 3.18 0.52 0.019 0.1320.63 0.055 27.59 0.63 0.011 2.8 0.62 0.022 0.230.74 ‐0.012 1.2 0.70 0.006 1.16 0.7 0.017 0.091.43 0.00013 0.56 1.32 0.0019 0.429 1.45 ‐0.002 0.016
Symbol Actual PMU position Approx. Distance from Event location (km)
Location 1 Karcham 433
Location 2 Kanpur 603
Location 3 Vindyachal 919

Analysis of Indian grid blackout (PMU measurements)
Inter- area oscillations identified for the grid disturbance case can be used as indicators in-order to avoid such catastrophe in the future.
31
Concluding remarks…
• Smart Grids are prerequisite to reach targets such as environmental, efficient energy and secure supply.
• Implementation of Smart Grids is an evolution of the existing grids.
• Many requirements, like increased efficiency and reliability can be addressed by the ‘Smart Grid’
• Potential applications for synchrophasor technology evolving in parallel will be needed in order to maintain stable operation of the electric power grid of the future.
32

33
Thank you!!!


![[Smart Grid Market Research] Smart Grid Index: November 2012 - Zpryme Smart Grid Insights](https://static.documents.pub/doc/80x56/541402018d7f728a698b47a5/smart-grid-market-research-smart-grid-index-november-2012-zpryme-smart-grid-insights.jpg)


