D3.4 Smart Energy Supply and Demand, Integration of RES, storage, management and Control WP3, Task 3.3 Transition of EU cities towards a new concept of Smart Life and Economy Deliverable due date: M36 – November 2019 Ref. Ares(2019)7391668 - 01/12/2019 THIS DELIVERABLE HAS NOT YET BEEN APPROVED BY THE EC
Transcript
D3.4 Smart Energy Supply and Demand, Integration of RES, storage,
management and Control
WP3, Task 3.3
Transition of EU cities towards a new concept of Smart Life and Economy
Deliverable due date: M36 – November 2019
Ref. Ares(2019)7391668 - 01/12/2019
THIS
DEL
IVER
AB
LE H
AS
NO
T YE
T B
EEN
AP
PR
OV
ED B
Y TH
E EC
Page 2 Page 2 D3.4 Smart energy supply and demand. integration of RES, storage, management and control
Project Acronym mySMARTLife
Project Title Transition of EU cities towards a new concept of Smart Life and Economy
Project Duration 1
st December 2016 – 30
th November 2021 (60 Months)
Deliverable D3.4 Smart Energy Supply and Demand. Integration of RES, storage, management and control
Diss. Level PU
Status Working
Verified by other WPs
Final version
Due date 30/11/2019
Work Package WP3
Lead beneficiary ENH
Contributing beneficiary(ies)
HAM, HAM-SN, HAW, TSY
Task description Report on the integration, performance and optimization of RES and storage energy systems in
the district heating and cooling network and buildings. Definition of the management and control
strategies of the systems.
Date Version Author Comments
07.11.2019 0.2 Doris Willmer (ENH) Final Template, Chapter 1.2, Remarks to Chapter 2.2
2.1 Purpose and target group ........................................................................................................................... 11
2.2 Contribution of partners .............................................................................................................................. 11
2.3 Relation to other activities in the project ..................................................................................................... 12
3. Integration, performance and optimization of RES in the district heating and cooling network and buildings .... 14
3.1 Low-ex District Heating Island .................................................................................................................... 15
4.1.4 Research and Teaching .......................................................................................................................... 23
4.2 Specification of the wind turbines and Battery system ............................................................................... 24
4.3 Measurements and Results ........................................................................................................................ 27
4.3.1 Measurement of the Wind turbines from the test phase ......................................................................... 27
4.3.2 Measurements of the battery storage ..................................................................................................... 28
5. The roll of small-scale PV on Roofs in the Energy transition .............................................................................. 30
5.4 Previous steps and current status .............................................................................................................. 33
5.5.2 Examination of the entire period ............................................................................................................. 41
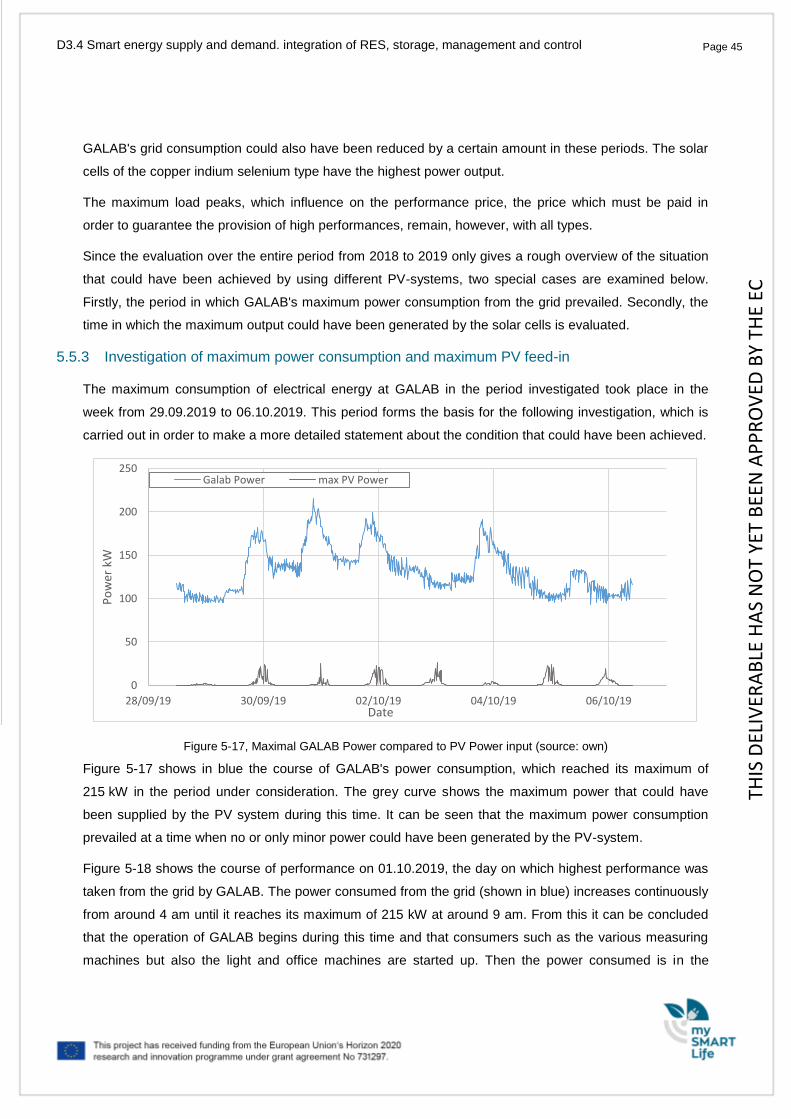
5.5.3 Investigation of maximum power consumption and maximum PV feed-in ............................................. 45
THIS
DEL
IVER
AB
LE H
AS
NO
T YE
T B
EEN
AP
PR
OV
ED B
Y TH
E EC
Page 5 Page 5 D3.4 Smart energy supply and demand. integration of RES, storage, management and control
5.5.4 Discussion of results ............................................................................................................................... 47
6. Current status of the management and control strategies (Action 9) .................................................................. 49
6.3 Current status ............................................................................................................................................. 50
6.5 Next steps ................................................................................................................................................... 53
7.1 Smart home assistant living ........................................................................................................................ 54
7.1.1 Evolution of the Task .............................................................................................................................. 54
7.1.2 Stakeholders involved in this action ........................................................................................................ 56
7.1.3 Advantages and the roles of the different stakeholders ......................................................................... 57
7.1.5 Financing of the implementation ............................................................................................................. 59
7.1.6 Implementation plan ................................................................................................................................ 60
7.1.7 Main challenges during the implementation ........................................................................................... 61
7.1.8 Conclusions and main benefits ............................................................................................................... 62
8. Discussion of the results (till M36) ....................................................................................................................... 68
Page 6 Page 6 D3.4 Smart energy supply and demand. integration of RES, storage, management and control
Table of Figures
Figure 3-1: Electricity power mix of Germany 1st half-year 2019, Source: Fraunhofer.ise ........................................ 14
Figure 3-2, Energy sources for heat consumption, Source: Umweltbundesamt (Federal Environment Agency) ...... 15
Figure 3-3: Storage in construction, source: ENH/Naturstrom ................................................................................... 16
Figure 3-4: CO2-free supply of commercial buildings and residential buildings, source: ENH/Naturstrom ............... 17
Figure 3-5, Project area “Schleusengraben” with the low-ex area “Schilfpark” .......................................................... 18
Figure 3-6, “Schilfpark”-Quarter at “Schleusengraben”, residential (blue), business (green), Fraunhofer (yellow) ... 19
Figure 4-1: left: location wind farm Curslack and the technology center energy campus; right: official corridor map
with the wind turbines ................................................................................................................................................. 22
Figure 4-2: battery storage at the wind farm curslack, source: HAW own ................................................................. 22
Figure 4-3, Overview of the data protocols and the connection between windfarm Curslack and TCEC .................. 24
Figure 4-4: electricity generation of the wind farm Curslack in the test phase ........................................................... 28
Figure 4-5: Active Power Measurement on the battery .............................................................................................. 29
Figure 4-6: state of charge of a battery in container one ............................................................................................ 29
Figure 5-12: GALAB power consumption (source: own) ............................................................................................ 42
Figure 5-13: Use of monocrystalline silicon solar cells (source: own) ........................................................................ 42
Figure 5-14: Use of copper indium selenium solar cells (source: own) ...................................................................... 43
Figure 5-15: Use of cadmium telluride solar cells (source: own) ................................................................................ 44
Figure 5-16: Use of polycrystalline silicon solar cells (source: own) .......................................................................... 44
Figure 5-17, Maximal GALAB Power compared to PV Power input (source: own) .................................................... 45
Figure 5-18: Day of maximal GALAB Power compared to max PV Power (source: own) ......................................... 46
Figure 5-19, GALAB Power compared to maximal PV Power input (source: own) .................................................... 47
Figure 6-1: mySMARTLife Open Urban platform with its architecture parts and its integration ................................. 50
THIS
DEL
IVER
AB
LE H
AS
NO
T YE
T B
EEN
AP
PR
OV
ED B
Y TH
E EC
Page 7 Page 7 D3.4 Smart energy supply and demand. integration of RES, storage, management and control
Figure 6-2: Landing page with anomaly detection status ........................................................................................... 51
Figure 6-3: Status of Electricity House Connection .................................................................................................... 51
Figure 6-4: Status of Photovoltaic system .................................................................................................................. 52
Figure 6-5: Status of Combined Heat and Power Plant.............................................................................................. 53
Figure 7-1: Location of the Bergedorf-Bille retirement complex at Leuschnerstraße 83a-f nearby the main
mySMARTLife project area in Hamburg-Bergedorf, source: FHH-Atlas. ................................................................... 55
Figure 7-2: Impressions of the retirement complex at Leuschnerstraße 83a-f and a sample floor plan of a 2-room
Figure 7-3: Scheme of stakholders involved in the implementaton of the smart home systems, source: Borough of
Bergedorf, own source. ............................................................................................................................................... 57
Figure 7-4: Example of a smart home set from casenio, source Casenio.................................................................. 59
Figure 7-5: Information event at a local community centre of the housing cooperation, source: Borough of
Figure 7-11: system functionality of multi metering system ........................................................................................ 66
THIS
DEL
IVER
AB
LE H
AS
NO
T YE
T B
EEN
AP
PR
OV
ED B
Y TH
E EC
Page 8 Page 8 D3.4 Smart energy supply and demand. integration of RES, storage, management and control
Table of Tables
Table 2-1: Contribution of partners ............................................................................................................................. 11
Table 2-2: Relation to other activities in the project .................................................................................................... 12
Table 4-3, Technical specifications Battery System ................................................................................................... 27
Table 5-1: Specification of the PV-plant Kampweg .................................................................................................... 35
Table 5-2: Specification of the PV-plant Ochsenwerder ............................................................................................. 37
Table 5-3: Specification of the PV-plant Organic Bakery ........................................................................................... 38
Table 5-4: Specification of the PV-plant laboratory Schleusengraben ....................................................................... 41
Table 10-1: Solar irradiation data Hamburg Demonstration Site of potential Analysis .............................................. 72
THIS
DEL
IVER
AB
LE H
AS
NO
T YE
T B
EEN
AP
PR
OV
ED B
Y TH
E EC
Page 9 Page 9 D3.4 Smart energy supply and demand. integration of RES, storage, management and control
Abbreviations and Acronyms
Acronym Description
BEST Building Energy Specification Table
CHP Combined Heat and Power
DC direct current power
ENH EnergieNetz Hamburg eG (beneficiary from Germany)
GFA Gross-floor-area
GDP Gross domestic product
HAM Hamburg (beneficiary from Germany)
HAW Hamburg University of Applied Sciences (beneficiary from Germany)
kWp Kilo Watt peak (possible power of PV-plants)
mySMARTLife Transition of EU cities towards a new concept of Smart Life and Economy
PV Photovoltaic
RES Renewable energy sources
SMGw Smart Meter Gateway
SNH Stromnetz Hamburg (beneficiary from Germany)
TRL technological readiness level
TSYS T-Systems (beneficiary from Germany)
THIS
DEL
IVER
AB
LE H
AS
NO
T YE
T B
EEN
AP
PR
OV
ED B
Y TH
E EC
Page 10 Page 10 D3.4 Smart energy supply and demand. integration of RES, storage, management and control
1. Executive summary
The main objective of mySMARTLife project is the definition of an Innovative Urban Transformation
Strategy from today's energy and mobility situation to a sustainable and intelligent city that functions well
and comfortably without fossil fuels. This requires thinking different and implementing new ways to meet
the challenges of modern and mobile lifestyle. The answers can be divided into the following topics:
Energy saving and the promotion of efficient energy use
Energy generation from renewable sources such as the sun and wind
Replacing fossil fuels with RES electricity, hydrogen and biogas
Intelligent control and steering strategies
The actions of mySMARTLife in Hamburg are divided into three main areas: energy, mobility and
communication. This final report of Month 36 focusses on the energy part. It describes the development
and the state of the demonstration of smart energy production and supply together with the integration of
RES, storage, management and control in the urban city transformation.
A special challenge for Hamburg was the implementation of the low-ex district heating. The innovative
combination of different energy sources for a CO2-free heating solution of the new buildings should be in
technical readiness level (TRL) 8 as “the first of its kind” in the independent real estate market. This
approach has failed because the investor and building owner has opted for the cheapest form of energy
supply which is currently available to him. In an alternative plan, Hamburg has managed to use a number
of the innovative solutions in other combinations.
The windfarm of the HAW, connected to big power storages, is also integrated in the smart energy
concept of Hamburg-Bergedorf. This includes the periphery of the urban area.
Small PV-systems on suitable roofs of the district are supporting the energy transition in Hamburg with
direct power supply to the residents and users of the building. Wherever economically and physically
possible, the self-consumption quota should be increased by using a battery-storage.
To support (elderly) residents and to become aware of the personnel energy consumption the part of
smart energy interventions is completed by the management and control strategies as well as innovative
buildings with smart home assistants and smart metering.
Deviating from the interim version (M24), the tasks "Smart Heating Islands in Retrofitting (KON)" and
"Smart Heating Islands in Retrofitting (KON)" were assigned to Deliverable 3.3 with a focus on energy
distribution and consumption.
THIS
DEL
IVER
AB
LE H
AS
NO
T YE
T B
EEN
AP
PR
OV
ED B
Y TH
E EC
Page 11 Page 11 D3.4 Smart energy supply and demand. integration of RES, storage, management and control
2. Introduction
2.1 Purpose and target group
This deliverable provides an overview of concepts for energy production and storage as planned,
developed and implemented in the project. Different aspects of a possible future energy system for the
smart city are partially tested in real life during the project. The report contains a description of the
planning and decision-making process as well as a technical description of the developed solutions for
interested follower cities and a professional audience.
The present deliverable is structured as follows:
Chapter 2: describes possible district heating and cooling networks regarding integration, performance
and optimization of RES. The innovative low-ex district heating system was not implemented in the project
due to an investor's decision, but was presented due to the extensive planning in the project and the
possible significance for city heating. The core element "ice storage", combined with a PV-system, is
analysed in Chapter 4.6.
Chapter 3: shows the role of large RES infrastructures, such as large-scale wind turbines in combination
with energy storage systems.
Chapter 4: shows the role of small-scale PV-plants on roofs and storage systems in buildings. In addition,
the possible support of an innovating air condition handling with a PV-plant is stated.
Chapter 5: gives an overview of the definition of the management and control strategies for the energy
production, especially RES in relation to energy consumption.
Chapter 6: shows how new innovative assistant tools, such as “smart homes” and “smart metering”, could
be a part of a future smart building
Chapter 7: completes this deliverable with the conclusion, a review of the main challenges and a look
forward to the final implementation
2.2 Contribution of partners
The following table depicts the main contributions from participating partners in the development of this
deliverable.
Table 2-1: Contribution of partners
THIS
DEL
IVER
AB
LE H
AS
NO
T YE
T B
EEN
AP
PR
OV
ED B
Y TH
E EC
Page 12 Page 12 D3.4 Smart energy supply and demand. integration of RES, storage, management and control
Participant short name
Contributions
ENH
Citizen cooperative with members supporting energy transition in Hamburg and developing
electricity direct delivery concepts; overall lead and development of main structure of the
deliverable; writing of sections 2.1, 4, the conclusion in chapter 7, assembling the parts and
first review
HAM Coordinator of mySMARTLife in Hamburg; writing of the introduction and describing living in
smart homes. Chapter 1.1, 1.3, 6.1
HAW University real laboratory for energy efficiency and RES. Operating the large-scale wind
turbines; writing chapter 3 and 4.4.3
SNH Operating the power grid Hamburg and measuring electricity power consumption; writing
chapter 6.2
TSY Developing the urban platform and defining energy control strategies; writing chapter 5
2.3 Relation to other activities in the project
This deliverable is allocated in task 3.3 “Smart energy supply and demand” and describes the results of
subtask 3.3.1 “District heating and cooling improvements”, subtask 3.3.2 “Load management through
energy-storage strategies and renewables”, subtask 3.3.3 “Cooling storage management”, 3.3.4
“Integrated renewable energy generation on building level”, subtask 3.3.5 “Integrated renewable energy
generation on district level” and subtask 3.3.6 “Smart energy control in smart heating islands”. As the
subtask 3.3.7 “Grid to vehicle strategies” is more of a mobility intervention, it will be reported in its own
deliverable D3.7 “Mobility monitoring solutions”.
For chapter 4 (small PV-systems on rooftops), the concept of electricity tenant power supply is developed
and presented in detail in WP 8 (Communication, Dissemination and Exploitation), deliverables 8.2 and
8.3 (a market analysis and business road-map).
This deliverable provides an overview of the evolution of the actions and the technical description of smart
energy interventions in the project area of Hamburg-Bergedorf. Therefore, this deliverable is connected to
D3.1, the baseline information of the demonstrator area and to D3.2 and D3.13, the simulation models, as
well as to D3.3, the report on retrofitted actions and new buildings.
Table 2-2: Relation to other activities in the project
Deliverable Number Contributions
D3.1 This deliverable provides the baseline information of Hamburg demonstrator
area.
THIS
DEL
IVER
AB
LE H
AS
NO
T YE
T B
EEN
AP
PR
OV
ED B
Y TH
E EC
Page 13 Page 13 D3.4 Smart energy supply and demand. integration of RES, storage, management and control
D3.2 and D3.13 This deliverable provides the description of the baseline report of Hamburg
and the simulation models of the building stock, energy systems,
transportation and urban infrastructure.
D3.3 Report on retrofitted actions and implemented actions new buildings
including RES and storages in Hamburg
D8.2 Technology and market supervision activities / Market analysis
D8.3 Report on business cases and business models / Business road-map
THIS
DEL
IVER
AB
LE H
AS
NO
T YE
T B
EEN
AP
PR
OV
ED B
Y TH
E EC
Page 14 Page 14 D3.4 Smart energy supply and demand. integration of RES, storage, management and control
3. Integration, performance and optimization of RES in the district heating and cooling network and buildings
While the energy transition in the section of electricity power production with renewable energies is
already well advanced, the fossil-free and, thus, not climate damaging heat generation is still in its infancy.
For this reason, particularly innovative and promising solutions have been planned for heat generation.
The overall objectives of this concept are the optimization and the integration of RES in the district
temperature management of business and residential building to find new ways of heating and cooling in
the city development. The conceptual approach should use the partial new construction within urban
conversion areas as a nucleus for the transformation primary of urban housing districts. The networking of
actors at district level (between the municipalities, public and private companies, citizens and civil society)
should enable the implementation of the technically innovative energy concept.
Figures 2-1 and 2-2 compare the difference in the share of renewable energies between electricity power
production and heat generation.
Figure 3-1: Electricity power mix of Germany 1st half-year 2019, Source: Fraunhofer.ise
nuclear brown coal lack coal gas waterpower biomass wind solar
Electricity power mix of Germany 1st half-year 2019
RES
THIS
DEL
IVER
AB
LE H
AS
NO
T YE
T B
EEN
AP
PR
OV
ED B
Y TH
E EC
Page 15 Page 15 D3.4 Smart energy supply and demand. integration of RES, storage, management and control
Figure 3-2, Energy sources for heat consumption, Source: Umweltbundesamt (Federal Environment Agency)
3.1 Low-ex District Heating Island
3.1.1 Task description
In Zone 1, the new construction area called the “Schleusengraben”, a high innovative concept based on
the combination of diverse sources of RES should provide an autarky heat supply completely without
fossil energy.
The low-ex heating network included in Zone 1 should provide heat at very low temperatures as a heat
source for the heat pumps. Heat is provided by using an ice storage system in combination with heat
pumps to provide additional heat in winter and cooling in summer. The underground ice storage allocates
large amounts of energy reserves due to the high energy release of the water, when it changes the
aggregate phase from fluid to solid and vice versa. During the heating period flow temperatures are
between 30°C and 0°C and return temperatures between 10°C and -5°C. Due to the low temperatures,
isolation of the heat pipes is not necessary. The return flow is preferably heated in the solar thermal plant.
If the temperature in the ice storage is below 0°C, the return flow will be heated by the heat pump of the
ice storage. The total storage capacity of the 3,000 m³ of ice comprises approximately 500 MWh capacity.
The geothermal ambient temperature together with ambient heat from the “Schleusengraben” river and
Development of heat consumption with energy source in Germany
coal oil fossil gas electricity long distance heat RES
THIS
DEL
IVER
AB
LE H
AS
NO
T YE
T B
EEN
AP
PR
OV
ED B
Y TH
E EC
Page 16 Page 16 D3.4 Smart energy supply and demand. integration of RES, storage, management and control
the cooling water in summer are used to regenerate the ice storage. Cooling is supplied with a cold-water
grid.
Figure 3-3: Storage in construction, source: ENH/Naturstrom
During summer, when excess solar heat is available, heat can be transferred directly to the consumer at
flow temperatures around 50°C. The low-ex district heating will provide a heat source for the smartly
controlled heat pumps of each single building, comprising an area of 30,000 m² of conditioned area. Heat
pumps and buffer tanks are connected to the overall smart management system, which is connected to
the electricity market place.
The heat pumps are preferentially running on self-consumption PV-electricity. The PV-plants would be
equipped with electrical power storage in each building. This would enable a smooth load management
and running the heat pumps especially at times in the evening, when heat is needed and sunshine is
missing. The storage would also be connected to the intelligent energy management system. The
storages would be charged and discharged according to the demands of the heat pumps and based on
prediction software for demand and solar energy production forecast.
On suitable roofs, innovative hybrid PV-plants for simultaneous production of solar heat and electricity
power should be mounted. They should be combined with small wind turbines on the roof tops to
maximize the use of the higher wind speed caused by the building itself.
An optional buffer tank in 13 x 5 m³, total capacity 1,950 kWh, would be installed in 79 buildings of the new
construction area for an adequate load balancing of the heating network. If the heating network needs
additional energy, the buffer tanks will be loaded with heat powered by excess electricity from wind power
plants or from the optionally installed biomass / biogas driven CHP-plant.
As a supplementary innovative solution, the industry waste heat from the Fraunhofer "IWES" test bench
for wind turbines should be used and fed into the low-ex district heating grid. The following diagram shows
the schematic structure of the system.
THIS
DEL
IVER
AB
LE H
AS
NO
T YE
T B
EEN
AP
PR
OV
ED B
Y TH
E EC
Page 17 Page 17 D3.4 Smart energy supply and demand. integration of RES, storage, management and control
Figure 3-4: CO2-free supply of commercial buildings and residential buildings, source: ENH/Naturstrom
3.1.2 The impact and the frame of the intervention in a smart city
The “Schleusengraben” district was planned as a real laboratory of energetically sustainable urban
development, related to the elaborate testing of a transferable overall energy concept for existing and
conversion districts of German cities using the example of Hamburg-Bergedorf (120,000 inhabitants).
In the context of the planning and implementation of a low-ex heating concept, the potentials and
obstacles of a CO2-free energy supply at district level are examined here. The overall concept pursues a
systemic approach in project structure and project procedure, which deals with technical, socio-economic,
legal and institutional challenges of planning and practical implementation in an interdisciplinary and
transdisciplinary manner. The results will be passed on to other municipalities and adapted to their
framework conditions. The project shall answer the following general questions:
Technically: How innovative could low-ex networks be realized in the city development?
Socio-economic: What are the obstacles and how can these be overcome?
Legally: Which are the legal limits for the planning and operation of low-ex district heating networks?
Transfer: What are the barriers to transferability (in Hamburg and other municipalities) and how can these
be reduced?
Integration into Hamburg urban development
HP=Heat-Pump
THIS
DEL
IVER
AB
LE H
AS
NO
T YE
T B
EEN
AP
PR
OV
ED B
Y TH
E EC
Page 18 Page 18 D3.4 Smart energy supply and demand. integration of RES, storage, management and control
The population of the Free and Hanseatic City of Hamburg will continue to grow until 2030 (Statistikamt
Nord 2015). The city of Hamburg relies on sustainable, inward urban development (FHH 2014a). The city
is aiming for a more efficient use of land within the existing development landscape and a promotion of the
energy transition, nature and climate protection (FHH 2015, 2014a). Three goals are crucial for the
Hamburg energy transition: Increasing energy efficiency, expanding and refurbishing existing energy
networks, including heat supply, and expanding renewable energies (FHH 2014b). The aim of the urban
planning at “Schleusengraben" district is to convert the district, shaped by trade and industry in recent
centuries, into a lively urban district (Mecanoo Architects et al., 2010).
In this way, the development areas along the “Schleusengraben” river are a reference point for the climate
protection concept of the Hamburg-Bergedorf district.
“Schilfpark” quarter as the nucleus of an energetically sustainable urban development
Figure 3-5, Project area “Schleusengraben” with the low-ex area “Schilfpark”
The "Schilfpark" quarter (see Figure 3-6) is situated in the southern area of the “Schleusengraben” district.
Here are about 310 residential units on approximately 34,000 m² GFA and office buildings and space for
crafts and research with about 30,000 m ² GFA in development.
This is the Hamburg area for the energy interventions regarding the new construction buildings of the EU
mySMARTLife project. The development planning is containing a cold local heating network with storage,
fluctuating sources and demand side management for a network-friendly operation. As regenerative
energy sources, PV hybrid and domestic waste water would be used in the “Schilfpark” quarter basically.
In addition, a solar thermal system, a pressurized waste water line, surface water, a main Bergedorf waste
water line and a waste heat from an industrial test block (Fraunhofer, see Figure 3-6) would be used as
THIS
DEL
IVER
AB
LE H
AS
NO
T YE
T B
EEN
AP
PR
OV
ED B
Y TH
E EC
Page 19 Page 19 D3.4 Smart energy supply and demand. integration of RES, storage, management and control
heat sources. The heat pumps would be driven electrically by solar power and wind power from the roofs
of the new buildings.
Figure 3-6, “Schilfpark”-Quarter at “Schleusengraben”, residential (blue), business (green), Fraunhofer (yellow)
3.1.3 Prerequisites
For implementing the low-ex three levels of prerequisites are required: technical, legal and cooperation
with investors.
The technical requirements are given in principle. Photovoltaic is now a standard technology. Ice storage
tanks have also been used successfully for years, for example at the “GALAB” laboratory (see chapter
4.6), a local life science company, in Hamburg-Bergedorf. Heat pumps are already part of the proven
technology. The use of hybrid PV-plants and small wind turbines on buildings is more difficult. The special
feature of the “Schilfpark” quarter is the integration and smart control of all techniques to achieve a CO2-
free heat supply. The difficulty of a hybrid PV-plant is that a PV panel produces more electricity power, the
lower the temperature is. For this reason, a smart control and management must ensure a constant
current of water for cooling the hybrid modules. Wind turbines of all sizes are available on the market, but
the efficiency of small wind turbines is hardly foreseeable in the rough surface of a city.
Legally, the permissibility of land spanning islands with heat and electricity production and district self-
consumption needs is clarified. The electricity power supply is limited to buildings in the direct
neighbourhood.
Most recently, large parts of the project rely on the cooperation of investors who build the houses. This
implies a high degree of risk for the project, if investors are unwilling to assemble an innovative but more
THIS
DEL
IVER
AB
LE H
AS
NO
T YE
T B
EEN
AP
PR
OV
ED B
Y TH
E EC
Page 20 Page 20 D3.4 Smart energy supply and demand. integration of RES, storage, management and control
expensive heating technology for climate protection, but decide to implement a cheap solution. Exactly
this point led to failing of the low-ex district heating in mySMARTLife.
3.1.4 Previous steps and actual Status
ENH has dealt intensively with the innovative concept of the hybrid PV and small wind turbines.
Unfortunately, the whole intervention depends on the decision of the investor. ENH has been engaged in
intensive negotiations with the investors of the new residential and commercial buildings to convince them
of the innovative concept of combining several kinds of renewable energy. However, at least the investors
decided against the low-ex temperature district heating with Bio-methane CHP as well as solar energy and
preferred a cheap standard heating system based on cheap natural gas heating solutions. Such an
innovative system, as planned, cannot match up with the low costs of a gas-fired heating plant and public
funding.
Heat pumps were planned to be part of the low-ex district heating concept in order to regulate the heat
temperature within the buildings. In addition, Hybrid PV was supposed to produce additional heat as well
as the power to run the heat pumps. In sunless times the heat pumps of the low-ex heating would be
provided with power by the wind turbines. The combination of locally installed wind turbines and hybrid PV
to compensate the power used by the heat pumps on hot sunny days, would be the innovative and
performance-enhancing way for a well-balanced and completely fossil-free heat and power plant. The
combination distributes the hot water for use and thus ensures the cooling of the modules for an efficient
power production.
ENH examined intensively the possibility of the use of wind energy by small wind turbines in the building
area. This included a screening of the usable wind strengths, the average and the maximum wind speed.
In addition, a market analysis of the producers of wind turbines and suitable small-wind turbines was
carried out.
The analysis of the overall situation after the final rejection of the low-ex heating shows that the
implementation of the small wind turbines is no longer meaningfully. In addition, the investor refuses to
use his roofs to install RES in any form. So, this whole intervention cannot be addressed.
3.1.5 Conclusion
As described above, the implementation of such an innovative and carbon-free heating solution instead of
standard is much more expensive and more complicated in maintenance. It needs an investor highly
committed in climate protection to realize such purposes. The Hamburg consortium has developed an
alternative plan for innovative heating islands, which, as a new and innovative technology, stores
hydrogen in the natural gas network and uses it with a high level of admixture with natural gas in CHP
plants. This action is described in Deliverable 3.3.
THIS
DEL
IVER
AB
LE H
AS
NO
T YE
T B
EEN
AP
PR
OV
ED B
Y TH
E EC
Page 21 Page 21 D3.4 Smart energy supply and demand. integration of RES, storage, management and control
4. Large scale Wind Turbines and Storage Energy Systems
4.1 Action overview
According to the DoA, the University of Applied Sciences (HAW) Hamburg has built a wind farm close to
the Technology Center Energy-Campus (TCEC) at “Schleusengraben”, located in Zone 1 (Action 17). A
large-scale battery is also installed at the wind farm (Action 20). The integration of the battery is part of a
larger research project in which the city of Hamburg together with the federal state of Schleswig-Holstein
demonstrate key technologies for the energy turnaround. The respective project (“NEW 4.0”) is to be
funded by the German federal government. The large-scale battery is used for direct power consumption
from the wind turbines and for the area's ability to react to fluctuations in the wind farm's power
generation. In mySMARTLife, load management and decentral storage will be implemented, in the form of
a combined virtual power plant (VPP) together with the wind farm and this large battery system in order to
deliver ancillary services to the power grid.
4.1.1 The wind farm Curslack
The aim is to broaden the understanding of specific issues of wind energy production, plant operation, and
grid integration as well as electricity storage. The laboratories of the TCEC offer the ideal opportunity to
integrate the real operation of wind turbines into applied research as well as practical training of students,
e.g. through learning projects for technical and commercial management. In addition, there is an ideal
platform for practice-oriented research and development. The combination of laboratory and test field
(wind farm) is innovative and unique in Germany.
4.1.2 Wind Farm
In the district Bergedorf a wind farm was created. The wind farm Curslack is located one kilometer from
the Technology Center Energy Campus (TCEC) of the CC4E of HAW Hamburg at the “Schleusengraben”
area in project zone 1. The wind farm consists of four wind turbines with a capacity of 2.4 MW and one
wind turbine with a capacity of 3 MW. Overall, the output is 12.6 MW. All wind turbines are from Nordex
Modelltyp N117. The wind farm is connected to the 110/10 kV transformer station. The wind farm is
projected to generate 35 GWh per year and thus cover the electricity demand of around 15,000
households in the district Bergedorf per year. The wind farm is financed by private investors with an
investment of approx. 20 Mio. €.
THIS
DEL
IVER
AB
LE H
AS
NO
T YE
T B
EEN
AP
PR
OV
ED B
Y TH
E EC
Page 22 Page 22 D3.4 Smart energy supply and demand. integration of RES, storage, management and control
4.1.3 Large-scale battery
The combination of wind turbines and a local battery improves the network efficiency and the marketing
possibilities of fluctuating generation from renewable energies and could be demonstrated at the wind
farm Curslack. The realization is a joint project of Vattenfall, Nordex Energy GmbH and the Competence
Center for Renewable Energy and Energy Efficiency (CC4E) of the HAW and is part of the project
“SINTEG NEW 4.0”. The battery consists of lithium-ion batteries, as they are used in electric cars and
comply with the latest technology.
Battery and wind farm feed electricity into the public grid as one system. In real operation, the power
supply from the wind farm and the battery should be optimized. In the research project “NEW 4.0”
innovative possibilities for ancillary services, such as the instantaneous reserve as a very fast frequency-
response reserve, are being tested. In addition, the system provides control energy to compensate for
Figure 4-1: left: location wind farm Curslack and the technology center energy campus; right: official corridor map with the wind turbines
Figure 4-2: battery storage at the wind farm curslack, source: HAW own
THIS
DEL
IVER
AB
LE H
AS
NO
T YE
T B
EEN
AP
PR
OV
ED B
Y TH
E EC
Page 23 Page 23 D3.4 Smart energy supply and demand. integration of RES, storage, management and control
short-term fluctuations in the grid frequency. This should be avoided, as far as possible, shutdowns of
wind turbines in network overload.
The main three cases during the SINTEG-project NEW 4.0 will be investigate:
Instantaneous reserve
At the first moment of a frequency deviation, the instantaneous reserve makes an important contribution to
hold frequency. The instantaneous reserve is available to the conventional power plants by using
inherently rotating masses. The inertia torque of the generators stabilizes the frequency without additional
efforts. In the future, conventional power plants will be taken from the grid. Therefore, alternative or
supplementary solutions for a sufficient amount of instantaneous reserve are needed. The use of this
battery, to deliver instantaneous coverage, is to be further investigated in the project “NEW 4.0” as well as
recommendations for a legal framework to show off a business model.
Primary Control power
The primary control power is intended to regulate short-term load changes. Companies, who offer this
ancillary service, must secure that the maximum power is reached within a maximum of 30 seconds and is
available for at least 15 minutes. The activation of the primary reserve is affected by the frequency
deviation. The primary reserve provider measures the grid frequency independently at the place of
production or consumption and reacts immediately to the change in grid frequency. Temporal losses, such
as through communication links, are avoided and cause quick compensation. The entire control range of
the primary control power is in a control band of 49.8 and 50.2 Hz. From a frequency of 49.99 or 50.01 Hz,
the activation begins and the provider is obliged to counteract the frequency.
Reactive power
The reactive power is required for the operation of electrical distribution or transmission networks. It is
influenced by the behaviour of users of the power grid (including reference customers, generating
facilities) and the resulting reactive power behaviour of the components of the grid (e.g., lines,
transformers). The investigation will show to what extent a hybrid park can deliver reactive power by using
wind turbines and battery. Reactive power is currently not a market in Germany, because it will be
provided by the conventional power plants. Due to the future reduction of conventional power plants and
the predictable need for reactive power possible regulations should be analysed.
4.1.4 Research and Teaching
During the project period, 5 wind turbines, a battery storage and a wind measuring mast were built. For
further research, 4 wind turbines were equipped with GPS Rovers and 2 wind turbines were equipped with
LiDAR systems. The GPS rovers are used to determine the exact position of the gondola. The LiDAR
(light detection and ranging) system measures the horizontal wind speeds. The information can be used to
THIS
DEL
IVER
AB
LE H
AS
NO
T YE
T B
EEN
AP
PR
OV
ED B
Y TH
E EC
Page 24 Page 24 D3.4 Smart energy supply and demand. integration of RES, storage, management and control
gain information on wind turbulence. In addition, a supervisory control and data acquisition (SCADA)
system for the wind farm was set up.
Figure 4-3, Overview of the data protocols and the connection between windfarm Curslack and TCEC
Figure 4-3 shows the data connection of the wind farm to TCEC systems. The data connection between
the wind farm facilities to the SCADA system is via the communication protocol Profinet (battery storage)
and Modbus TCP.
A HAW server is also realized on the wind farm. The SCADA system and the HAW server are connected
over switches and communicate via HTTP. The HAW Server collected and stored the data from the GPS
Rover, LiDAR, wind measuring mast, battery and the wind turbines. To get the data from the HAW server,
a WLAN bridge is connected to the HAW Switch. The WLAN bridge couples two networks together and
the connection will be realized by a router and a repeater. The bridge side of the TCEC is directly
connected to the HAW Network.
4.2 Specification of the wind turbines and Battery system
The technology readiness level (TRL) of the task would have to be set at 9 for the wind-turbines and 8 for
the battery. The following table shows the specification of the wind turbines from the wind farm Curslack.
THIS
DEL
IVER
AB
LE H
AS
NO
T YE
T B
EEN
AP
PR
OV
ED B
Y TH
E EC
Page 25 Page 25 D3.4 Smart energy supply and demand. integration of RES, storage, management and control
Page 47 Page 47 D3.4 Smart energy supply and demand. integration of RES, storage, management and control
Figure 5-19, GALAB Power compared to maximal PV Power input (source: own)
Figure 5-17, Figure 5-18 and Figure 5-19 show that GALAB's power drawn from the grid can be reduced if
the PV systems feeds in. However, the feed-in curves of the solar cells and those of the withdrawn power
are not congruent in time. This means that the maximum output from the grid is already withdrawn before
the PV output feds in. This means that the cost-intensive and grid-intensive power peaks cannot easily be
reduced using a PV-system. A temporal flexibilization of the power generated by the PV system would be
necessary to effectively operate peak shaving.
5.5.4 Discussion of results
It can be concluded that the use of a PV-system at GALAB would indeed lead to a reduction in the output
taken from the grid. In this way, the required output of the entire building can be temporarily reduced by up
to almost 33 kW. However, these load reductions as a result of the PV feed-in do not occur at the same
time as the load peaks of the consumption. A reduction of the grid-loading and costly power peaks would
therefore not be possible by the sole use of a PV-system.
For example, a battery storage could be used to temporarily store the energy fed in by the PV-system and
restore it at a later point in time in order to effectively shave peaks, which means to cut peak loads.
Another possibility would be to reduce peak loads by shifting the load, for example by switching on
consumers at different times. If the large energy demand of GALAB is distributed over the periods in which
electricity from the PV system is fed in, the grid load and energy costs can be reduced.
Further investigations would have to be carried out to determine to what extent the two described variants
are possible. Whether all systems must be available at the same time or whether there is potential for
flexibility. Whether it is therefore possible to connect certain consumers with a time delay. The use of
various additional systems, such as battery storage or future charging stations for electric vehicles, would
also have to be critically scrutinized and investigated. The potential flexibility of the ice storage system
0
50
100
150
200
250
05/05/19 07/05/19 09/05/19 11/05/19 13/05/19
Leis
tun
g kW
Datum
Galab Power max PV Power resulting Power
THIS
DEL
IVER
AB
LE H
AS
NO
T YE
T B
EEN
AP
PR
OV
ED B
Y TH
E EC
Page 48 Page 48 D3.4 Smart energy supply and demand. integration of RES, storage, management and control
used by GALAB should not be overlooked. In addition, it would have to be investigated how great the
energetic and monetary effects of such a load shift or load reduction by the PV-system and other
additional systems would be. These open questions will be investigated in the further course, especially in
the monitoring phase of the project.
THIS
DEL
IVER
AB
LE H
AS
NO
T YE
T B
EEN
AP
PR
OV
ED B
Y TH
E EC
Page 49 Page 49 D3.4 Smart energy supply and demand. integration of RES, storage, management and control
6. Current status of the management and control strategies (Action 9)
6.1 Task Deskription
The objective of action 9 (Smart Energy Control in Smart Heating Islands) is the development of an
innovative energy controller concept which will smartly control the different, in the district installed energy
resources (e.g. CHP, PV, batteries, ice storage, heat pumps) to enable a local energy management
aiming at a (as far as possible) CO2 neutral energy supply within the area. One use case from this
concept, here power and energy balancing on different levels (building to building level, quarter to quarter
level), shall be implemented on the urban platform. The goal is, to maximize the use of locally generated
energy within the neighbourhood instead of feeding it into the public grid. For management and
controlling, a system-prototype is used and the task has to be classified in TRL 7.
Due to the current lack of available energy data sources from public or private buildings (as of 18.10.2019)
we connected different facilities of the HAW University Energy Campus Building with the goal to monitor
energy consumption and production, calculate and analyse trends and also create forecasts, thus
supporting a power and energy balancing of a smart building in maximizing locally generated energy.
6.2 Prerequisites
Prerequisite for implementing the use case is the availability of the energy resources (installed within the
newly constructed buildings) and, which is quite important, the agreement of the different stakeholders
(data owners) to grant access to the data and to provide an interface to the data. The fact, that the most
energy resources will be installed by parties, not part of the consortia, was always a risk. In the facilities of
the Energy Campus, there are various energy sources available. For the mySMARTLife project, we have
chosen three of the various energy sources available: Combined heat and power (CHP) plant,
photovoltaic and mains. All of these facilities provide their current data sets via an MQTT-Broker. MQTT
clients are able to subscribe to the topic of interest and get afterwards updates as soon as new data are
produced in the technical facility.
The mySMARTLife Open Urban Platform consists of three parts: The Hamburg Urban Data Hub, the T-
Labs Urban Data Core and the protocol gateway connecting both parts. Both platform parts, Hamburg
Urban Data Hub and T-Labs Urban Data Core, have MQTT connectors acting as clients. They subscribe
to the regarded MQTT-URLs of the energy facilities, get the data and store it in their attached databases.
THIS
DEL
IVER
AB
LE H
AS
NO
T YE
T B
EEN
AP
PR
OV
ED B
Y TH
E EC
Page 50 Page 50 D3.4 Smart energy supply and demand. integration of RES, storage, management and control
Figure 6-1: mySMARTLife Open Urban platform with its architecture parts and its integration
6.3 Current status
Energy data should be the same in both parts of the mySMARTLife Platform, in Hamburg and at T-Labs.
So, it can be proofed that both sides are working properly and the SensorsThings API-to-oneM2M
Gateway (as described in D3.5) as the connection between both platform parts is stable.
Currently, Hamburg Urban Data Hub as well as Deutsche Telekom/T-Labs Urban Data Core are
connected to the HAW Energy Campus and testing via crosscheck, whether both platform parts are
displaying exactly the same data. It is thus ensured that the integration of both architecture parts works
stable and correct.
Figure 6-2: Gateway service test: Both sides get data via the Gateway service
THIS
DEL
IVER
AB
LE H
AS
NO
T YE
T B
EEN
AP
PR
OV
ED B
Y TH
E EC
Page 51 Page 51 D3.4 Smart energy supply and demand. integration of RES, storage, management and control
Furthermore, we developed a user interface displaying information from the installed energy resources,
namely from the electricity house connection, the photovoltaic system and the combined heat and power
plant. The user can click on each of these three tiles to see the detailed status. The landing page (Figure
6-2) also shows the result of the Open Urban Platform´s basic anomaly detection system, which
continuously executing a system health check and alarms in case any anomalies found.
Figure 6-2: Landing page with anomaly detection status
The Electricity House Connection (Figure 6-3) indicates the current power delivered via mains from the
regional energy provider. The CHP-plant tile shows whether the local plant is in operation and how much
energy is generated and how much electricity is purchased from the electricity grid. Furthermore, current
effective power, current reactive power and current apparent power are shown. The energy consumption
of the current day and the entire year is displayed, and also the mains frequency and the used voltage.
Figure 6-3: Status of Electricity House Connection
The Photovoltaic System status (Figure 6-4) shows whether the photovoltaic plant is in operation, what is
it the current throughput and reactive power of the plant, how much power generated in the given day and
since the installation of the plan. Also, it shows the monthly CO2 and cost savings for the given day, the
given month and for the given year. Finally, the current temperature and solar radiation power - radiant
energy currently emitted by the sun from such nuclear fusion reaction which creates electromagnetic
THIS
DEL
IVER
AB
LE H
AS
NO
T YE
T B
EEN
AP
PR
OV
ED B
Y TH
E EC
Page 52 Page 52 D3.4 Smart energy supply and demand. integration of RES, storage, management and control
energy - is displayed, too. Using these two variables, the system is even able to create predictions, which
can be useful information in terms of planning the usage of the non-renewable type of energy sources in
the next couple of days.
Figure 6-4: Status of Photovoltaic system
The CHP-plant status (Figure 6-5) shows whether the CHP-plant is currently in operation, if it was and for
who long it was in operation mode. The current generation of electrical and thermal power and the sum of
the generation during the day are depicted. Also, it shows how much energy need to be drawn from the
grid and how much energy created with that and how much savings resulted from it in a given day, month
and year.
THIS
DEL
IVER
AB
LE H
AS
NO
T YE
T B
EEN
AP
PR
OV
ED B
Y TH
E EC
Page 53 Page 53 D3.4 Smart energy supply and demand. integration of RES, storage, management and control
Figure 6-5: Status of Combined Heat and Power Plant
6.4 Key Findings
The mySMARTLife action 9 is about innovative controller concepts and Smart Energy Control in Smart
Heating Islands. The initial idea was to use the different energy sources that are installed in the district.
This was not possible because stakeholders outside the consortium did not permit access to the data
sources. Therefore, we have chosen the facilities of the HAW University Energy Campus as data source.
It is possible to process energy data by using open IoT standards like MQTT, SensorThings API and
oneM2M. The dedicated energy sources publish their data in MQTT. The mySMARTLife Open Urban
Platform orchestrates and publishes the data via OGC SensorThings API as well as oneM2M data sets.
The exemplary application above shows the innovative usage of the data for local energy generation.
Energy is produced respecting actual consumption and weather conditions, all by using open standardized
IoT protocols. Furthermore, the whole setup is also used to proof the successful integrations of different
architecture parts to a stable and reliable mySMARTLife Open Urban Platform. Everything is up and
running at the end of the implementation phases.
6.5 Next steps
The next step is to get the required data from the Hamburg Urban Data Hub via the protocol gateway
services instead of getting them directly from the Energy Campus. This will be done by the end of the
mySMARTLife implementation phase. So, we are able to provide KPIs about the platform integration in
terms of gateway availability, downtime, throughput etc. for the monitoring phase of the project.
THIS
DEL
IVER
AB
LE H
AS
NO
T YE
T B
EEN
AP
PR
OV
ED B
Y TH
E EC
Page 54 Page 54 D3.4 Smart energy supply and demand. integration of RES, storage, management and control
7. Innovative Buildings
One main objective of the mySMARTLife project is the introduction of smart energy solutions. In the
previous chapters different solutions for the generation of renewable energies are presented combined
with strategies for a smart integration into the supply system of individual buildings, quarters or even larger
areas, which is the case when grid services are considered. The following chapter focuses on different
aspects of smart energy. With the implementation of a smart home assistant system and the roll out and
installation of different modern measuring systems, the demand side in the topic of smart energy is
covered in Hamburg within muSMARTLife too. The smart home system is implemented in retirement
apartments and is combined with a care service. This combined approach adds an additional social
aspect to the concepts of smart homes that not only allows conclusions regarding the functionality of the
implemented technology.
Another aspect that is already addressed in the smart home action, but even more in the smart metering
actions, is the idea to raise awareness regarding the personal energy consumption. The visualisation of
energy demands is a key measure for this. Once the demand is visualised it is can easier to connect the
personal energy consumption with the different actions in the household and eventually reduce the energy
consumption. Different metering technologies were planned to be introduced in the project area in
Hamburg-Bergedorf within mySMARTLife. Despite the efforts of the project partners, due to reasons that
could not be influenced not all technologies can be installed within the project duration for reasons beyond
their control.
7.1 Smart home assistant living
Against the background of a steadily aging society in Germany and in many parts of Europe, the smart
home solution implemented in mySMARTLife focuses on two main aspects: to offer helpful services for
elderly people in their daily life and to control and reduce the energy consumption of their main electricity
consumers in their apartments. Furthermore, with the integration of household services, offered by trained
people from outside of the regular labor market, a social aspect was integrated to provide an integrative
approach to this intervention.
7.1.1 Evolution of the Task
From the start of the project, several meetings with local investors and housing companies have been
conducted with the aim to promote the installation of smart home systems. The first attempt of the action
was an implementation of smart homes at the new buildings in project zone 1, the “Schleusengraben
area”, as a technical upgrade or service for possible tenants. Different aspects of smart home solutions
have been discussed, like systems with deep integration in the buildings infrastructure. These should have
helped to reduce energy consumption of households or included systems to organize community aspects,
THIS
DEL
IVER
AB
LE H
AS
NO
T YE
T B
EEN
AP
PR
OV
ED B
Y TH
E EC
Page 55 Page 55 D3.4 Smart energy supply and demand. integration of RES, storage, management and control
such as car sharing or load management for e-cars. But none of the investors with ongoing housing
developments were interested to install these systems and to bear the costs for the installation in their
already good selling apartments.
Furthermore, some serious difficulties regarding the Hamburg budget law occurred. Since the installation
of smart home systems in private apartments of citizens is not the ordinary task of the authorities, there
were some barriers to implement this action for the Borough of Hamburg-Bergedorf as a public authority.
The Hamburg budget law does not allow the Boroughs to grant subsidies to house owners or to grant
technical products directly.
Thus, in 2018 a new approach for this action has been developed. Together with a local housing
cooperative, the “Bergedorf Bille housing cooperation”, a new use case, with smart assistant systems for
their elderly tenants, was identified and developed. Moreover, the “Sprungbrett Hamburg gGmbH”, a local
company experienced in care services for elderly people, as a part of their labour marked activation
activities, was called in and integrated in this action as the stakeholder. They agreed to buy and
implement the smart home systems as partner within the mySMARTLife project.
With the approval of the 2nd Amendment in 2019 the “Sprungbrett Hamburg gGmbh” was integrated in the
project as a new third linked party. The planning and actual implementation of the action could start in a
short term in summer 2019.
Figure 7-1: Location of the Bergedorf-Bille retirement complex at Leuschnerstraße 83a-f nearby the main mySMARTLife project area in Hamburg-Bergedorf, source: FHH-Atlas.
THIS
DEL
IVER
AB
LE H
AS
NO
T YE
T B
EEN
AP
PR
OV
ED B
Y TH
E EC
Page 56 Page 56 D3.4 Smart energy supply and demand. integration of RES, storage, management and control
The first apartments, in which the smart home systems are to be installed in are part of the retirement
complex by the housing cooperative Bergedorf Bille in the Leuschnerstraße 83a-f (Figure 7-1). The
complex includes 81 apartments which have from 1.5 to 3 rooms with a living area between ca. 50 to 79
m². A standard 2-room apartment comprises a living area of about 59 m² (see Figure 7-2).
Figure 7-2: Impressions of the retirement complex at Leuschnerstraße 83a-f and a sample floor plan of a 2-room apartment, source: Bergedorf-Bille
7.1.2 Stakeholders involved in this action
After the adjustments of this action, the partners involved are now:
the Borough of Bergedorf as the initiator,
the housing cooperation “Bergedorf Bille”, which offers the contact to the tenants (their members),
the company “Sprungbrett Hamburg”, which will do the implementation of the system in the
apartments and offer the households services
and the company “casenio” for the technical support and deployment of the data and
communication platform.
Figure 7-3 provides an additional overview of the tasks of the individual stakeholders.
THIS
DEL
IVER
AB
LE H
AS
NO
T YE
T B
EEN
AP
PR
OV
ED B
Y TH
E EC
Page 57 Page 57 D3.4 Smart energy supply and demand. integration of RES, storage, management and control
Figure 7-3: Scheme of stakholders involved in the implementaton of the smart home systems, source: Borough of Bergedorf, own source.
7.1.3 Advantages and the roles of the different stakeholders
The advantages for the tenants, the elderly people, are a gain of security and an expansion of
independency in their homes. Sensors, such as the stove control, windows control and the help button,
can be interconnected so that certain control and response schemes can be set up in the smart home
system that for example should prevent the stove being left on unattended. Additionally, the system
should allow a better overview of the main energy consumers in the apartments. The goal is to enable the
elderly people to stay in their apartments and familiar environment as long as possible which is also
helpful for the relatives. This should be achieved in the combination of the smart home system and the
services offered by caretakers, the household helpers.
The advantages for the housing cooperative are a surplus of security for their apartments (building stock),
a new service for their members (marketing and social benefits) and, because of the reduction of
movements of residents, a decrease of relocation costs.
For the company “Sprungbrett Hamburg”, the household helpers are a new employment possibility to
integrate people from outside of the regular labor market into the market again. This is one part of
THIS
DEL
IVER
AB
LE H
AS
NO
T YE
T B
EEN
AP
PR
OV
ED B
Y TH
E EC
Page 58 Page 58 D3.4 Smart energy supply and demand. integration of RES, storage, management and control
Sprungbretts (re-)activation activities. The installed tablet offers a communication possibility for the elderly
people.
For the City of Hamburg, the advantage is the gain of social connections and it is a new approach to deal
with some problems of the demographic chance in Germany towards an older society.
7.1.4 Technical description
The housing cooperative “Bergedorf Bille”, owner of approx 9,200 apartments and is willing to implement
this action together with the project mySmartLife and has chosen the technical solution offered by the
company “casenio”. This company is experienced in smart home systems for elderly people. The system,
which is to be implemented here offers different services for the residents or their relatives such as:
Smart living: intelligent light control, heating control, control of electronical appliances, functions
for energy measurement, special functions when the person leaves the apartment.
Security functions: protection against burglary, detection of water damages, fire detection, warning
if the stove was forgotten to switch off the stove.
More communication: information direct on the display, like news, dates, reminders for the
garbage collection, contact to the caretakers.
Integration of new business cases possible: additional offers of nursing services, arranging of
room services, offers of telemedicine, online supermarkets.
It is a self-sufficient system with a home central, a tablet and linked sensors. No conversion measures,
internet access or mobile phone are needed. The partners select the basic package from a list of possible
components. In view of the limited resources available, this system should consist of a series of sensors,
which would allow the installation of as many systems as possible, while providing real benefits for the
residents. Against the background of limited funding, this system should comprise a number of sensors
that both enable the installation of as many systems as possible and at the same time, mean a real gain
for the residents. Furthermore, the layouts of possible apartments have been analysed to calculate the
right number of sensors. The components, which have been chosen for the package, are:
3 socket adapters for energy measurements and control
2 multisensory (temperature, air humidity)
THIS
DEL
IVER
AB
LE H
AS
NO
T YE
T B
EEN
AP
PR
OV
ED B
Y TH
E EC
Page 59 Page 59 D3.4 Smart energy supply and demand. integration of RES, storage, management and control
1 stove control with temperature measurement
2 radiator thermostats incl. temperature measurement and digital display
The TRL of the smart home system needs to be considered as 9. This system, as it is used here is
already available on the market and used in similar environments. Yet, with the combination of a care
system, as it is done in mySMARTLife in Hamburg-Bergedorf, the TRL is below 9. After the system is
installed in the households, it needs to be evaluated, whether this combination is beneficial and also
practicable for the residents. Then the partners decide if they will pursue this approach beyond the
project’s duration and transfer this system to other areas or modify it, so that other user groups can be
addressed as well. The following picture shows an example package with a display, a motion detector,
alarm buttons and more.
Figure 7-4: Example of a smart home set from casenio, source Casenio
The visualisation of the largest energy consumers in the households, such as the TV, fridge or washing
machine, should help to raise the awareness regarding the own domestic energy consumption and
eventually lead to an energy-saving user behaviour. Moreover, automated control settings, which can be
selected with the different sensors and controllers should help to lower the energy demands, when certain
devices will be turned off or when the heater is lowered once the residents leave the apartment. These
automated settings should also help to increase the security of the residents, whereas an alarm message
can be sent to relatives or other people when some pre-set incident happens, e.g. the apartment door was
not opened for a certain amount of time or the like.
7.1.5 Financing of the implementation
The purchase of the first systems will be paid with funding of the mySMARTLife project (about 1,500 € per
apartment), only the installation of the stove control from an electrician is paid by the housing cooperative.
THIS
DEL
IVER
AB
LE H
AS
NO
T YE
T B
EEN
AP
PR
OV
ED B
Y TH
E EC
Page 60 Page 60 D3.4 Smart energy supply and demand. integration of RES, storage, management and control
The training of the household helpers is paid with national labour market funding. The hours of services for
the elderly people can be paid by their insurance when they have care level 1. Otherwise they have to pay
for the services on an hourly basis.
7.1.6 Implementation plan
The implementation of the action is still ongoing. After the Amendment, which included the reorganization
of this intervention, was approved, the responsible partners started directly with the implementation. Since
the Bergedorf Bille housing cooperative maintains a very good and direct contact to their cooperative
members, some suitable housing estates with nearly exclusively senior living could be identified and the
tenants be addressed.
When the elderly residents were addressed, it was ensured, that this was done via the established
channels and formats of the housing cooperative. This was done in order to avoid any possible fears of
the new technology. Altogether, by October 2019, two information events were accomplished, in a
neighbourhood meeting place of the cooperative, additional smaller events are planned for the following
months. At the first meeting on 22/08/2019, 81 tenants were invited and 17 people attended the event, of
whom 14 households expressed interest in a smart home system. At the second event on 08/10/2019,
335 tenants were even addressed and 48 tenants appeared, 32 households expressed interest.
Figure 7-5: Information event at a local community centre of the housing cooperation, source: Borough of Bergedorf.
In the next step, the tenants who have expressed interest are contacted and consulted separately by the
partner Sprungbrett. A date for the installation of the system is agreed upon together.
During the information events the tenants were also informed, that this measure is part of an EU research
project and that during the monitoring phase the collected energy data of the consumers will be evaluated
anonymously by the project. They were further informed that the HCU as well will address the users of a
THIS
DEL
IVER
AB
LE H
AS
NO
T YE
T B
EEN
AP
PR
OV
ED B
Y TH
E EC
Page 61 Page 61 D3.4 Smart energy supply and demand. integration of RES, storage, management and control
smart home system, in the context of a social acceptance study. The approval of these two research
points is a prerequisite for such a smart home system.
After the first information phase, the installation of the systems in the individual apartments begins. There
is a fixed division of labour: The plug-in sensors will be set up by employees of the partner Sprungbrett,
the company casenio will integrate the central data platform for the smart home systems. The installation
of the stove control is carried out by electricians commissioned by the building cooperative.
In addition, the partner Sprungbrett has opened an office close to the area, in order to coordinate the
services of the caretakers and to establish this office as a first service centre for the smart home systems.
The general technical support, however, will be still provided by the company casenio. A schematic
overview of the development and implementation with the different partners involved can be seen in
Figure 7-6.
Figure 7-6: Development and implementation scheme of the smart home action with the main contributions by the stakeholders (source: Borough of Bergedorf, own source).
7.1.7 Main challenges during the implementation
Some difficulties and challenges in the coordination and implementation of this action were caused by the
late approval of the amendment, as described above. Due to the budgetary problems to grant the
subsidies, it only was possible to start with the action, after the approval of the amendment and with the
inclusion of the new partner Sprungbrett (SPB) in June 2019.
With regards to the technical implementation, the high installation costs have been a major obstacle for
many systems which were initially examined. Systems, which are permanently installed in apartments
usually require a deep technical intervention in the house infrastructure, in particular by installing sensors
in the wall or by the required replacement of fuse boxes and electricity meters. Whereas some systems
also require a special wiring which is usually done alongside the electric wiring in new constructions.
These installations must be carried out by electricians, which extremely rise the costs for the apartment
THIS
DEL
IVER
AB
LE H
AS
NO
T YE
T B
EEN
AP
PR
OV
ED B
Y TH
E EC
Page 62 Page 62 D3.4 Smart energy supply and demand. integration of RES, storage, management and control
owner. In addition, there is a high expenditure of time and a stressful construction phase for the tenant. A
further problem with the installation of smart home systems in existing buildings, is that the old apartments
usually have a wide variety of electrical infrastructure and are not uniform, which contains another cost
risk. Many apartments still have outdated wiring systems or fuse boxes that need to be replaced by the
owner, before a smart home system can be installed. At the same time, the housing cooperative is
demanding standards for technical equipment that should be installed (e.g. CE label, VDE label). Yet, not
all suppliers on the market have their products tested or certified at the different testing institutes.
Because of the reasons mentioned above, the partners of this intervention have decided to use a plug-in
system that avoids many of these problems. In addition, the installation and the removal of the systems is
very flexible. So large, cost-intensive interventions in the building infrastructure can be avoided and the
risks for the partners involved or the residents is minimised in case the system needs to be removed.
7.1.8 Conclusions and main benefits
The main aim of this action is to lower the barriers for landlords and tenants, to promote the dissemination
of smart home systems as a future infrastructure in the smart city. With the focus on the age group of
senior citizens and the integration of the everyday helpers into this technical action, a smart contribution to
the problems of an ageing society in Germany became a further focal point.
It has shown that the focus on a specific use case (smart homes for elderly people) was very useful during
the implementation of the action. At the same time, however, it needs to be recognized that this area does
not represent a typical field of action for the administration, as a citizen's home is a protected area. This
focus group made it even more important to lower the complexity of the system that should be installed.
The field of smart homes includes a large number of different possible systems and applications. The pre-
selection of a basic package, which was put together by the project partners who partly have extensive
experiences working with elderly people, reduced the complexity of the system and hence helped to
reduce communication efforts and accelerate the implementation.
Since the most parts of European cities are already built and will only be used further in the future, the use
of easy-to-install systems (Plug-In and Plug-Out) is an important success criteria. The existing housing
stock can thus be used more flexible and will be technically upgraded. The seniors can stay longer in their
familiar social environment and the number of moves between apartments can be reduced.
Furthermore, the integration and close coordination of the cooperative have proven to be helpful and have
contributed significantly to the successful implementation of the action. The cooperative supplied
important insights to its tenant’s structure and referred to the problem of the constantly aging members.
With their good contact to their members and well-established communication channels, they have
contributed significantly to the marketing of the systems and have achieved a high resonance among the
THIS
DEL
IVER
AB
LE H
AS
NO
T YE
T B
EEN
AP
PR
OV
ED B
Y TH
E EC
Page 63 Page 63 D3.4 Smart energy supply and demand. integration of RES, storage, management and control
cooperation members. Due to that, high expenditures for advertising, to address the tenants and to
convince them to install such a system, which is normally a problem, was avoided here.
In the following months, the monitoring will show whether the elderly residents will see the smart home
system as a benefit for their everyday life and if it will have an impact on their energy consumption. A
reduction is expected through an increased awareness of the own domestic energy consumption through
the visualization of the large consumers and better control of the heating and ventilation. In general,
however, the topic of smart homes is an interesting topic in the project, whereas this is one of the few
areas where citizens are in direct contact with smart infrastructures.
7.2 Smart metering
7.2.1 Implementation of modern measuring devices and in-house Visualization
In the project area 2,000 smart metering systems (modern measuring devices) will be installed in the
project area. The modern measuring device is the latest technology for counting electricity consumption.
So, this task is on the TRL 8. The basis for the introduction of modern measuring equipment is the law on
the digitization of the energy transition. The German legislator wants to achieve the goals of the energy
transition with the introduction of modern measuring equipment. An important goal of the energy transition
is the improvement of energy efficiency. The modern measuring device enables a more conscious use of
energy. The former technology only allowed reading the current count. In addition to the current power
consumption, the modern measuring system also shows the daily, weekly, monthly and annual electricity
consumption values of the last 24 months. The use of an interface via optional adapter is possible.
Although the technology is very new, modern measuring equipment is already available from
manufacturers are available from the manufacturer since May 2018. So more than 2000 modern
measuring systems have been ordered by Stromnetz Hamburg. A quality-assuring incoming goods
inspection was carried out and the measuring instruments were released for installation. Subsequently,
the orders to change the measuring equipment were created and arranged from conventional to modern.
Between October 2018 and April 2019, more than 2,000 conventional electricity meters were replaced by
modern measuring equipment in the project area.
THIS
DEL
IVER
AB
LE H
AS
NO
T YE
T B
EEN
AP
PR
OV
ED B
Y TH
E EC
Page 64 Page 64 D3.4 Smart energy supply and demand. integration of RES, storage, management and control
Figure 7-7: the display of the modern measuring device, source: SNH
There was no deviation from the original plan for action 10. The budget was required for the following: 1.
For the technical staff, to test the modern measuring equipment. 2. For the use of logistic personnel, to
ensure procurement and to negotiate supply contracts. 3. For the deployments of operational staf,f to drive
roll-out planning for modern measuring equipment in the project area. 4. For the use of field staff, to
exchange conventional measuring technology on site with modern measuring equipment
The technology of the in-house Visualisation via the modern measuring system is shown below:
Figure 7-8: technology of the in-house Visualisation, source: SNH
THIS
DEL
IVER
AB
LE H
AS
NO
T YE
T B
EEN
AP
PR
OV
ED B
Y TH
E EC
Page 65 Page 65 D3.4 Smart energy supply and demand. integration of RES, storage, management and control
Figure 7-9: Short-time and Long-time History, source: SNH
The modern measuring device has a data interface for the customer. Via an adapter, consumption data
can be read out via the data interface with a computer / mobile phone. The adapter makes it possible to
read out current measurement data from electricity meters, store them and transmit them in IP format. The
readout adapter is attached to the infrared interface of the meter and has a fixed LAN cable for connection
to an IP network. Via an integrated web server, which can be addressed via LAN, the recorded
measurement data can be downloaded and settings made. Power is supplied via the supplied power
supply. The maximum resolution is in the second range.
As an alternative to the web interface, the current energy consumption can be tracked at any time with the
free app “Strokomo!”. Data received via the DvLIR, is processed as consumption histories and clearly
displayed. The data is not accessable to the servers of Stromnetz Hamburg GmbH. It is a pure in-house
visualization.
The adapter for in-house visualization was developed in cooperation with Stromnetz Hamburg GmbH and
Device GmbH. More than 200 adapters were installed from December 2018 to March 2019 for customers
in the project area.
The budget for the in-house visualisation was required for the use of technical staff for the development of
the adapter with cooperation partner Device GmbH. Also, for the internal staff to install the adapters at
customers and to carry out a first briefing.
This action allows inhabitants of the project zone to visualize their consumption and so allow them to
reduce consumption by changing their consumption behaviour. Further, latest technology is being
implemented in the project zone.
7.2.2 Implementation of advanced measuring systems in the project area
It was planned to implement 500 advanced measuring systems in the project area. This technology is in
the test level and to score in the TRL 4. The picture below gives an idea how the system would look like.
THIS
DEL
IVER
AB
LE H
AS
NO
T YE
T B
EEN
AP
PR
OV
ED B
Y TH
E EC
Page 66 Page 66 D3.4 Smart energy supply and demand. integration of RES, storage, management and control