1 Project Number: AEE Smart Recloser Circuit Breaker A Major Qualifying Project Report: Submitted to the Faculty of the WORCESTER POLYTECHNIC INSTITUTE In partial fulfillment of the requirements for the Degree of Bachelor of Science By Alex Velez ________________________ Mahir Ugurtan Derman _________________________ Date: April 30 th , 2015 Approved By: ______________________________ Professor Alexander E. Emanuel, Advisor
Transcript
1
Project Number: AEE
Smart Recloser Circuit Breaker
A Major Qualifying Project Report:
Submitted to the Faculty of the
WORCESTER POLYTECHNIC INSTITUTE
In partial fulfillment of the requirements for the
Degree of Bachelor of Science
By
Alex Velez ________________________
Mahir Ugurtan Derman _________________________
Date: April 30th, 2015
Approved By:
______________________________
Professor Alexander E. Emanuel, Advisor
2
Abstract
The goal of this MQP was to implement a microprocessor controlled circuit breaker device to
prevent persistent faults within a system. The microprocessor via the associated Hall Effect sensor
constantly monitors the system for instant increase in current and determines whether to open or
close the main relay. Sudden and excessive increase in current causes the smart circuit breaker to
open while gradual and minor increases are ignored. The smart circuit breaker is to close only
when the fault is cleared. The device functionality was tested and demonstrated using theoretical
simulations.
3
Acknowledgements
We would like to thank Professor Emanuel for his patience and dedication to our education here
at WPI. Without his guidance and expertise many things would not have been possible. Special
thanks goes to Professor Orr and to the ECE community for their support. Last, but not least, an
honorable mention for Nathaniel Jefferson of the RBE/ECE community and his help with
troubleshooting.
4
Executive Summary
As we have come to rely upon electricity more in our everyday lives, it is important that we do
everything we can to protect it. One common method for protecting electronic components is a
circuit breaker. This project takes the standard circuit breaker one step further.
The scope of our project was to create a circuit breaker designed to trip, detect faults, and reclose
only after a fault has cleared. This is to be done primarily with a relay, an ACS750 current sensor,
and an Arduino. The central idea for the project is that the Arduino can be programmed to perform
these functions.
The relay serves as a switch. While closed, the main line is stable. After the occurrence of a
fault, the switch opens to prevent excessive current flow. While the switch is open current instead
passes through a test loop. The test loop includes a 1MΩ resistor and the ACS750 current sensor.
The resistor mitigates the current while the current sensor is used to monitor the current.
The current readings are fed to the Arduino which is programmed with a threshold value. If the
threshold value is surpassed, then the Arduino will signal the relay to remain open. It will continue
to do this until the fault has either been cleared or clears on its own. When the fault has cleared the
current will return to a stable level and no longer exceed the threshold. At this time the Arduino
will signal the relay to then reclose.
5
Table of Contents
Table of Contents Abstract ......................................................................................................................................................... 2
Table of Contents .......................................................................................................................................... 5
Table of Figures ............................................................................................................................................. 7
3. Problem Statement ................................................................................................................................. 15
4. Design and Approach: ............................................................................................................................. 16
4.1.2 Main Line:................................................................................................................................... 18
4.1.3 Network Circuit and Fault replication: ....................................................................................... 18
4.1.4 Current Measurement and Threshold Detection: ..................................................................... 19
4.1.5 Test Loop and Voltage Threshold Detection: ............................................................................. 20
5. Detailed Circuit Description and Simulations: ........................................................................................ 21
5.1 Main Lines: ........................................................................................................................................ 21
5.1.1 Network Circuit and Replicating Fault: ...................................................................................... 23
Parts List .................................................................................................................................................. 51
Three Phase AC ........................................................................................................................................... 12
Network of houses/loads in Tibet. .............................................................................................................. 19
Main Lines. .................................................................................................................................................. 21
Network Loads and the Fault. ..................................................................................................................... 23
Stages of Current ........................................................................................................................................ 24
Current Sensor. ........................................................................................................................................... 26
AC Coupling Circuit...................................................................................................................................... 26
Input vs. Output on the amplifier. .............................................................................................................. 29
Rectifier and Peak detector. ....................................................................................................................... 29
AC to DC conversion. ................................................................................................................................... 30
Transient analyses on Rectifier. .................................................................................................................. 30
System Current with No Fault. .................................................................................................................... 31
Main Line Voltage with No Fault. ................................................................................................................ 32
Voltage Delivered to the Network with No Fault. ...................................................................................... 32
System Current with Fault. ......................................................................................................................... 33
Voltage Delivered to the Network with Fault. ............................................................................................ 34
Test Loop Circuit ......................................................................................................................................... 35
Detailed Test Loop ...................................................................................................................................... 36
Voltage Through Test Loop ......................................................................................................................... 37
Voltage Through Network ........................................................................................................................... 38
Network Voltage without Fault .................................................................................................................. 39
Test Loop Load Current ............................................................................................................................... 39
Network Current No Fault........................................................................................................................... 40
Arduino Mega ............................................................................................................................................. 41
Block Diagram for the Microprocessor. ...................................................................................................... 43
8
1. Introduction
Electricity is essential to the world we live in today. Our reliance upon electronics and electronic
devices has increased at an alarming rate since Edison’s invention of the light bulb. Due to the
benefits from the advancement of electronics and technology it is unlikely that our society will
forfeit them. It is because of this dependence that our aim is to make our electrical systems as
efficient, safe, and consistent as possible.
What is a circuit breaker? A circuit breaker is an electromechanical device that functions like a
switch. This switch determines whether or not current will be allowed to flow and without current
there can be no power. In hazardous situations such as storms a power line may be knocked down
due to strong gusts or fallen trees. If conductors are struck by lightning, clash together, or cross
each other on the ground, then a short circuit can be created. A short circuit is when current begins
to follow a path that was not intended. This is problematic because the conductors themselves will
have little resistance and be unable to prevent high levels of current from flowing. This is where a
circuit breaker becomes useful. If any excessive current is entering your circuit, then the circuit
breaker will trip. This means the circuit breaker switch will flip open and not allow any current to
flow. No current means no more power on the feeder line. The disadvantage is that a utility
company will not know when a fault along a power line has cleared. A technician would be needed
to assess the situation and any damage that occurred.
What makes a circuit breaker smart? What if the circuit breaker knew when the fault had cleared
and could switch closed again? The goal of our project is to program a microprocessor that can
successfully detect and analyze faults within the circuit and reclose when it is safe. This will
remove the need to have it taken care of manually.
9
2. Background
The way our modern power distribution was established requires the implementation of power
lines to carry current from the point of generation to the point of consumption. On occasion an
abnormal current in a line can occur due to a short circuit. This is known as a fault. Faults can be
problematic for both a utility responsible for supplying power and the client that would like to
receive power. To maintain a consistent and reliable distribution system a smart recloser may be
implemented across a feeder line to detect a persistent fault and protect against it. Once voltage
has been transformed down to safer levels for a consumer to use it is divided amongst a network
of consumers. The cables that carry current for the network to function are called feeder lines.
Each feeder line is representative of a connection to a home or business that some power is being
given to.
2.1 Power Distribution Systems
A complete power distribution system has a method for power generation, power transmission,
and power distribution. Power generation is usually done at a plant by the means of burning fossil
fuels such as natural gas, coal, and oil. Nuclear is also used as well. The primary method of
generation is to produce steam and turn a turbine with it. The physical work done by the steam is
converted into electrical energy. The electrical energy is put through a device known as a
transformer before it reaches transmission lines.
A transformer is typically made of a metal core with wire windings wrapped around it. The core
consists of a primary and secondary used to transmit the energy by a process of electromagnetic
induction. Depending on the turns ratio you can step up or step down the voltage. The turns ratio
10
is the ratio of windings from the primary to the windings on the secondary. For example, if the
primary has 100 windings and the secondary has 10 windings, the voltage will be stepped down at
a ratio of 10:1. Conversely, you can step up the voltage if the turns ratio was 1:10 where the
secondary had ten times the number of windings. This principle applies for any ratio.
Figure 1 Transformer
All power distribution systems will step the voltage up after it is generated to be carried along
high power transmission lines. This is done because it is more efficient and less costly. The
transmission lines are many miles in length and have quite a bit of resistance to them. The
relationship for power dissipation, 𝑃 = 𝐼2 ∗ 𝑅, demonstrates that transmitting high current would
not be an efficient method. The losses due to dissipation from high currents are exponential. While
losses using a high voltage method are still notable, it is the most commonly preferred method for
long distance power transmission. Typical high voltage transmission lines carry 138kV or 230kV
using a three-phase system.
11
Figure 2 Transmission lines
A single-phase AC power distribution system would require the use of two conductors; the
positive and negative lines. A three-phase AC system would require only one additional conductor
and provide three times the power. Naturally the power is transmitted in a sinusoidal fashion where
the signal alternates from a peak positive voltage to a peak negative voltage. To do this, they
utilized three-phases of the signal where they are shifted such that the positive peak of each is
always occurring in a constructive manner.
Power transmission is typically done in three-phase for economical purposes. A three-phase
system involves using three separate conductors to carry alternating current across transmission
lines. The frequency and voltage of each line is the same, however, any given conductor will be a
third out of phase from the other two. It is common to have a phase shift of 0°, 120°, and 240°.
Due to the shift, the three phases do not interfere and detract from one another such that maximum
power will be provided at any instant (Hingorani, 2002). An example is shown below.
12
Figure 3 Three Phase AC
Each signal is produced at the same frequency which is typically 60Hz. The voltage of each
conductor is equal. By shifting when each one occurs we are able to produce three times the amount
of power as we can with a single-phase system.
2.2 Types of Faults
Under ordinary conditions power system lines and equipment carry normal voltages and currents
which helps the system operate safely. A fault is a change in the normal current where an imbalance
results in an excessive amount of current. A current larger than what the equipment is rated for can
be damaging so it is necessary to use protection devices such as relays and circuit breakers to
prevent this. The two main instances of faults are symmetrical and asymmetrical (Agarwul, 2013).
2.2.1 Symmetrical Faults
Symmetrical faults occur infrequently, but when they do the damage to electrical equipment is
very severe. The disturbance of a symmetrical fault affects each of the three phases equally. To
analyze symmetrical faults is an easy process and is done by taking each phase individually. The
13
information gathered will tell you the current capacity of your circuit breaker, the proper relay to
use, and what protective switchgear should be rated (Agarwul, 2013).
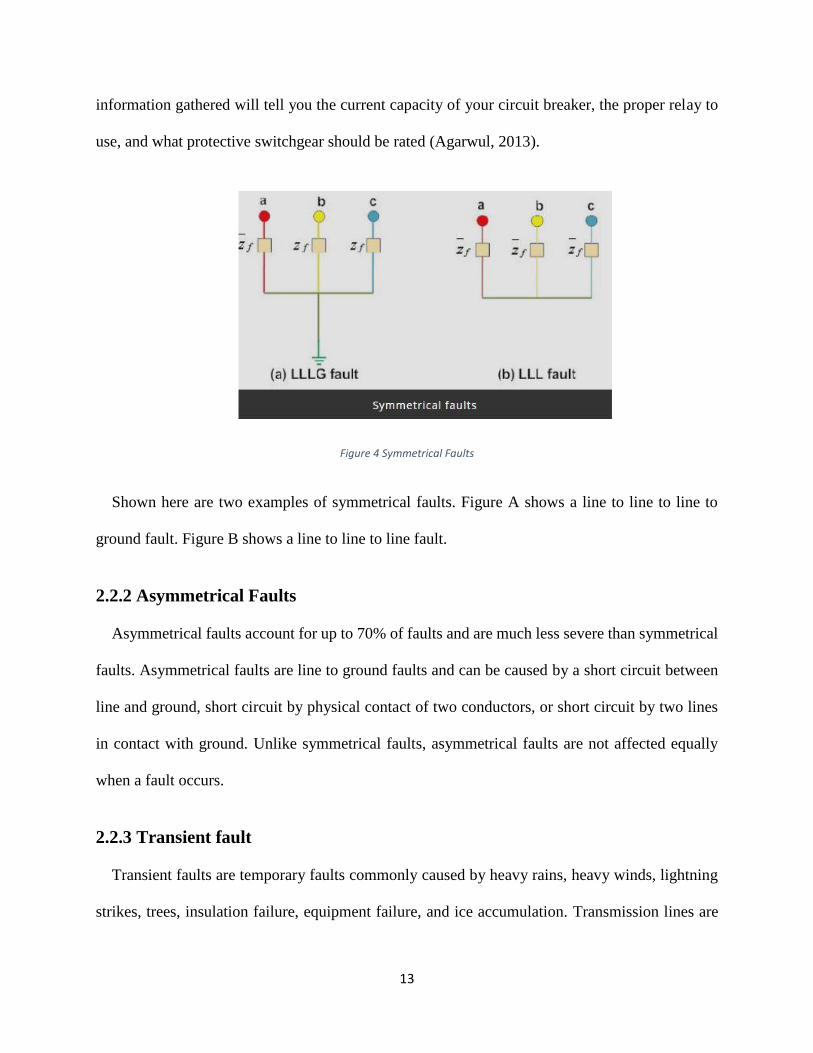
Figure 4 Symmetrical Faults
Shown here are two examples of symmetrical faults. Figure A shows a line to line to line to
ground fault. Figure B shows a line to line to line fault.
2.2.2 Asymmetrical Faults
Asymmetrical faults account for up to 70% of faults and are much less severe than symmetrical
faults. Asymmetrical faults are line to ground faults and can be caused by a short circuit between
line and ground, short circuit by physical contact of two conductors, or short circuit by two lines
in contact with ground. Unlike symmetrical faults, asymmetrical faults are not affected equally
when a fault occurs.
2.2.3 Transient fault
Transient faults are temporary faults commonly caused by heavy rains, heavy winds, lightning
strikes, trees, insulation failure, equipment failure, and ice accumulation. Transmission lines are
14
stranded or braided inside to prevent eddy currents. If poorly manufactured or if damaged it is
possible for a short circuit to occur (Horowitz & Hill, 1989).
2.2.4 Persistent Fault
For a situation in which a fault across the feeder line is not clearing you have a persistent fault.
This type of fault will not go away on its own. Causes of this are damaged lines or equipment
failure. Persistent faults are more likely to occur with underground power lines which are typical
for urban use. They are very expensive to implement per mile but remove many problems that
overhead transmission lines have. Underground power lines mostly suffer from persistent faults
due to the shielding that protects them. It is not likely for a transient fault to occur (Paolone,
Petrache, Rachidi, Nucci, & Rakov, 2005).
15
3. Problem Statement
Being that a fault can occur at any moment it is vital for any utility company to carefully monitor
their systems and have a timely response. Without a proper response the problem could worsen
and lead to further downtime. The traditional circuit breaker succeeds in protecting an electrical
circuit, but fails when it comes to enabling the system again. This requires someone to manually
reset the breaker to protect against the next fault.
In normal operation the voltage and current are stable for each feeder line. The ideal distribution
is setup such that only a feeder line currently experiencing a fault is disabled. This will allow all
other feeder lines to remain in operation and deliver electricity. Once a fault appears on a feeder
line the smart recloser will automatically open. While the smart recloser is open no current will
flow and it will only reclose once the fault has disappeared. A regular recloser is programmed to
attempt closing after a set amount of time before it must be reset manually. There is no guarantee
that the fault has cleared while the standard recloser is attempting to restore power. A smart
recloser will monitor the current within the circuit and only reclose once safety is guaranteed.
16
4. Design and Approach:
In this section a block diagram is introduced. The block diagram follows the essentials parts that
allow the main circuit to work. Each segment is explained in detail by theoretical calculations and
simulation results.
4.1 Overall Design:
Quick overview of the complete schematic.
Figure 5 Complete Schematic
17
4.1.1 Block Diagram:
Figure 6 Block Diagram
The current coming from the main line passes through the current sensor. For the current
measurement block, a Hall Effect sensor is utilized. The Hall Effect sensor outputs the level of
current passing through it with a proportional voltage value which is small. This small voltage is
then amplified by an op-amp, rectified with a diode bridge, and fed to the microprocessor. The
microprocessor governs disconnect, test loop, voltage threshold detection, and re-connect blocks.
To begin, the Arduino is encoded to receive response from the Hall Effect sensor. That response
tells the Arduino that the current threshold has been exceeded. The Arduino sends a signal that
triggers the relay to disconnect the main line, and current must then flow through the large 1MΩ
resistor of the test loop. This resistor is in place to diminish the current enough so that it will not
harm the electronics in the circuit, but will remain large enough to be measured. A step down
transformer is connected in parallel to this large resistor to lower the voltage to a level which the
Arduino can safely operate. The Arduino compares this voltage to its preset threshold. If the
threshold voltage is reached, it sends the signal to the relay to re-connect the circuit.
18
4.1.2 Main Line:
The smart circuit breaker is intended to be connected directly to a distribution line. Using an
actual distribution line as a main feeder line for the smart circuit breaker would be the best for
most accurate results. However as a safety measure, a scaled down version of a distribution line is
constructed for the prototype unit. All voltages and currents are limited to be in a safe range for
everyone involved in this project and its demonstration.
Figure 7 Step-down Transformer
To replicate a distribution line in a small scale, a step down transformer shown in Figure 6 is
used to lower the voltage to a safe level. A resistor and an inductor is added in series to replicate
the internal resistance and inductance of the distribution line.
4.1.3 Network Circuit and Fault replication:
The main line encompasses a network of loads or feeder lines. These are subsystems within the
main system. They each have a resistance. These resistances are parallel to each other, therefore,
they receive the same voltage. However, the current flow is proportional to their resistance. These
19
resistances can be the combination of loads introduced by the general household electronics in a
typical home. Feeder lines serve a network of houses such as the one seen in the Figure 7 below.
To build a circuit that models a distribution network each respective load is represented with a
resistor and inductor in series.
Figure 8: Network of houses/loads in Tibet.
A part of this circuit is replicating the fault introduced to the system. A fault subsystem is
connected in parallel to the loads within the network circuit. The fault subsystem has a very small
resistor and an inductor in series to a relay. The relay is controlled by an Arduino. The Arduino
turns the relay on and off at various times to replicate transient and persistent faults. For persistent
faults the microprocessor holds relay closed for a duration of time. The smart circuit breaker in
this situation holds its own relay open to disconnect the main line from the network circuit.
4.1.4 Current Measurement and Threshold Detection:
In order to detect if there is a fault within the system, the current flowing though the main line
should be monitored. For this, the main line is directed through a current sensor. The current sensor
reports current levels to the microprocessor. The microprocessor compares the values to the set
threshold value which this system shouldn’t exceed. If the threshold value is reached, the
microprocessor sends the control signal to disconnect the main line. This action is carried out by a
20
relay within the system. As long as the current through the smart circuit breaker is within
acceptable values or a sudden increase isn’t detected, the microprocessor will keep the circuit
connected. If a current spike is detected or the current levels exceeds the threshold, the
microprocessor will disconnect the circuit.
4.1.5 Test Loop and Voltage Threshold Detection:
A test loop circuit is introduced to the smart breaker to detect if a fault is still present in the
system even after the main line is disconnected from it. As explained in the previous section, the
current measurement and threshold detection circuits disconnect the main line from the network
when a fault is detected. In this situation the current flow through the system is also interrupted.
The current sensor would read zero current flow which would be well below the current threshold
value. This would result in closing the relay by the microprocessor. The test loop and the smart
algorithm in the microprocessor avoid this action to be carried out.
The microprocessor would hold the relay open and look at the voltage threshold detection
results. In order to get an accurate detection for whether the fault is still within the system or it has
cleared it, a very large resistor is connected in parallel to the relay. Since the relay is open in
presence of a fault, all the current would be force to flow through this very large resistor. In result
of this, the current flow is vastly limited but still present for a detection mechanism to operate.
Through a step down transformer which is connected in series to this large resistor, the
microprocessor can read the stepped down voltage through this large resistor. The stepped down
voltage is needed in order to keep the voltage range within the microprocessor specifications. The
microprocessor then would compare it to its voltage threshold value. If the threshold is reached, it
would send the re-connect signal to the relay for it to close.
21
5. Detailed Circuit Description and Simulations:
This section gives a detailed description for each component of the smart circuit breaker.
Mathematical expressions associated with this system are used to calculate essential values such
as voltage and current thresholds. In additions, various simulations are implemented to better
explain findings.
5.1 Main Lines:
Main lines are responsible for transferring power to the network. As explained in the
introduction they can be many miles long. Although small, there is an internal resistance and also
inductance due to AC source. These are represented by a .1mH inductor and .1mΩ resistor in the
schematic below.
Figure 9: Main Lines.
The above schematic is the electrical representation of a simple system. A voltage divider
configuration can be easily recognized from this representation. Main line’s low resistance allow
most of the power to be delivered to the network. Here the network is represented by a single 250Ω
22
resistor and a 6.25mH inductor. These values are the summation of all the loads connected to each
other in the network. The fault is also present in this schematic. The fault is represented by a switch
Key=B and the fault line has a very small resistance and inductance attached to it. Their values are
.1mΩ and .1mH respectively. Since the fault and the network are connected in parallel to each
other. The total resistance is much smaller than the network resistance of 250Ω.
𝑇𝑜𝑡𝑎𝑙 𝑅𝑒𝑠𝑖𝑠𝑡𝑎𝑛𝑐𝑒 =250Ω 𝑥 0.0001Ω
250Ω + 0.0001Ω= 0.0001Ω
Equation 1: Resistors in Parallel.
𝑇𝑜𝑡𝑎𝑙 𝐼𝑛𝑑𝑢𝑐𝑡𝑎𝑛𝑐𝑒 =6.25𝑚𝐻 𝑥 0.0001𝐻
6.25𝑚𝐻 + 0.0001𝐻= 0.0002𝐻
Equation 2: Inductors in Parallel.
Above equation explains two resistors connected to each other in parallel. Total inductance is
also much smaller due to inductors being connected in parallel. Since the internal resistance of
the main lines and the total resistance of the network when a fault is introduced are equal, the
power is distributed equally which brings the network voltage to half. Total resistance of the entire
system is also much smaller which increases the total current in the system. The lag in the voltage
and significant increase in the current can be damaging to the electronics within this system and it
is not desired. The switch Key =A in the schematic represents the smart circuit breaker. In such
situation, the smart circuit breaker would simply disconnect the network from the main lines to
protect the electronic equipment from the excessive current and low voltage. The supply voltage
for the prototype unit is scaled down to 12V. This is a safe voltage for laboratory environment. A
10Ω resistor is also attached to the supply to limit the current to less than 1.2A.
23
5.1.1 Network Circuit and Replicating Fault:
The network is basically all the electronics the main lines are supplying power to. All of the
electronics are connected in parallel therefore they each receive the same voltage. Each load in the
network has an associated resistance and inductance to it. Since they are all connected in parallel,
each additional load decreases the total resistance and inductance which in turn increases the
current through the network. When excessive number of loads are connected to the same network,
maximum safe level of current is reached and the circuit breaker protecting the network trips. The
smart circuit breaker can also detect sudden increases that are within safe levels. These sudden
spikes can also damage electronics. For the prototype unit a network of 4 subsystems are
constructed. The subsystems are consisted of a 1kΩ resistor and a 25mH inductor. These
subsystems are connected in parallel to each other as shown below.
Figure 10: Network Loads and the Fault.
24
5.1.2 Fault:
A fault can be a short occurring within the network or total current through the network
exceeding the maximum current limit of the breaker as explained in the previous section. Similar
to the subsystems in the network, the fault is consisted of a resistor and an inductor. Their values
are significantly lower since the type of fault being replicated here is a short. Key=B controls the
fault. For the prototype application, a microprocessor controlled relay is utilized to create this fault
in different frequencies and duration.
Figure 11 Stages of Current
Figure 10 depicts three distinct stages of current with respect to time. Here, the stable main line
current is shown in the first third of the figure. In the second segment the current increases sharply
to 3kA until the circuit breaker trips. Once the circuit breaker trips you can see the current
decreases quickly to zero. This is because the circuit breaker disconnected the main line of the
circuit.
5.2 Current Measurement and Threshold Detection:
The smart circuit breaker relies on sensing current levels to detect faults within the system. As
explained in the previous sections, a fault can be the total current in the system exceeding the
25
breakers limits or a short which introduces very low resistance to the network. This low resistance
causes the current to spike in the system. The threshold for the current is the limit of the breaker.
Typical breaker limits are 15A, 20A, 30A, 40A, 50A and 300A. The prototype circuit’s limit is
1A since most of the components used are rated 1.5A or less.
5.2.1 Hall Effect Sensor:
The current measurement is done by a current sensor. The sensor reports the current values to
the microprocessor. For the current sensing part, an Allegro ACS750 Hall Effect sensor is used for
the prototype.
Figure 12: Allegro ACS750SCA-100.
The ACS750 is connected in series with the main lines. The ACS750 measures the current
passing through its terminals and outputs a voltage proportional to it. If the current value increases,
the voltage at the output increases accordingly.
The ACS750 has 5 pins. Pin 1 is the voltage supply and requires 5V DC. A filter capacitor is
recommended to use between Pin 1 and 2. A 0.1µF Capacitor is adequate for this filtering as
suggested by the schematics below which was obtained from the specifications sheet of this current
26
sensor. Another filter capacitor is also suggested between Pin 2 and 3 which are the ground and
Signal out.
Figure 13: Current Sensor.
Pin 4 and 5 are where the current flows through. This sensor is connected in series to the main
lines. The system current enters Pin 4 and comes out of Pin 5. The signal output Pin 3 has an offset
voltage of 2.5V. The below AC coupling circuit attached to its output can remove this offset.
Figure 14: AC Coupling Circuit.
When the system is operating in normal conditions, the total current flowing through the system
is calculated to be 461mA. The 10Ω resistance in the equation is the current limiting resistor in the
supply voltage. When a fault is introduced to the system the total current increases to 1.2A as
calculated in the equation below.
27
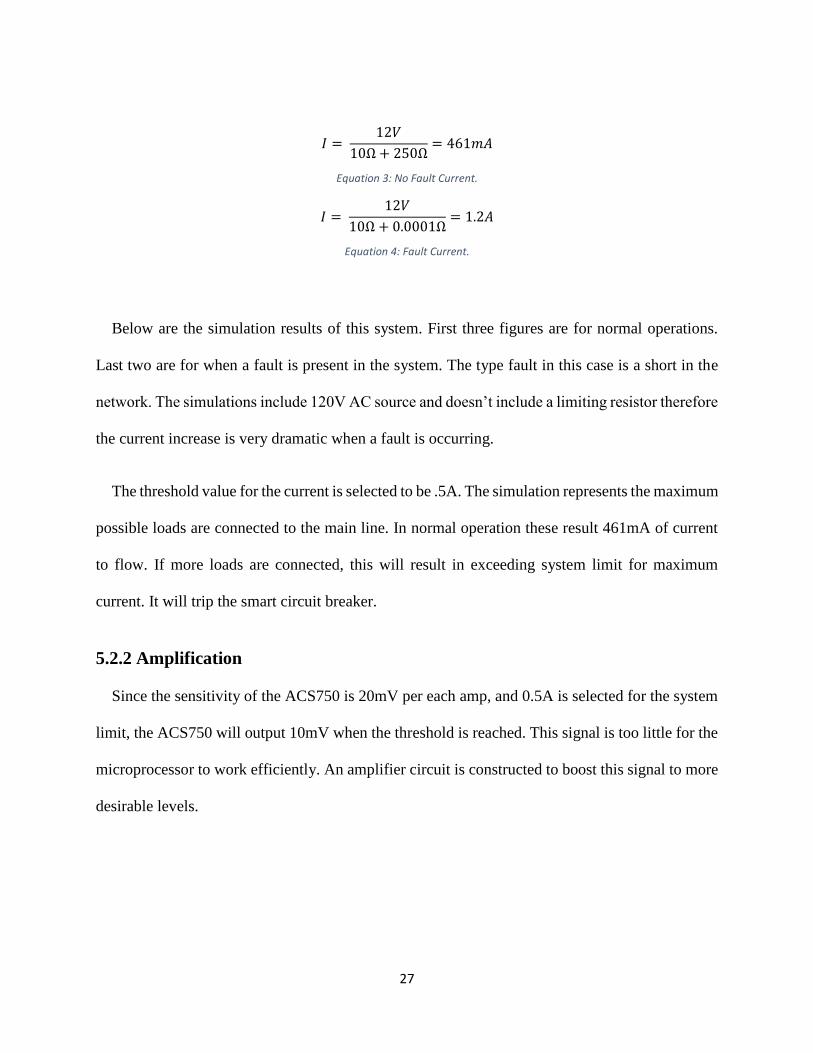
𝐼 = 12𝑉
10Ω + 250Ω= 461𝑚𝐴
Equation 3: No Fault Current.
𝐼 = 12𝑉
10Ω + 0.0001Ω= 1.2𝐴
Equation 4: Fault Current.
Below are the simulation results of this system. First three figures are for normal operations.
Last two are for when a fault is present in the system. The type fault in this case is a short in the
network. The simulations include 120V AC source and doesn’t include a limiting resistor therefore
the current increase is very dramatic when a fault is occurring.
The threshold value for the current is selected to be .5A. The simulation represents the maximum
possible loads are connected to the main line. In normal operation these result 461mA of current
to flow. If more loads are connected, this will result in exceeding system limit for maximum
current. It will trip the smart circuit breaker.
5.2.2 Amplification
Since the sensitivity of the ACS750 is 20mV per each amp, and 0.5A is selected for the system
limit, the ACS750 will output 10mV when the threshold is reached. This signal is too little for the
microprocessor to work efficiently. An amplifier circuit is constructed to boost this signal to more
desirable levels.
28
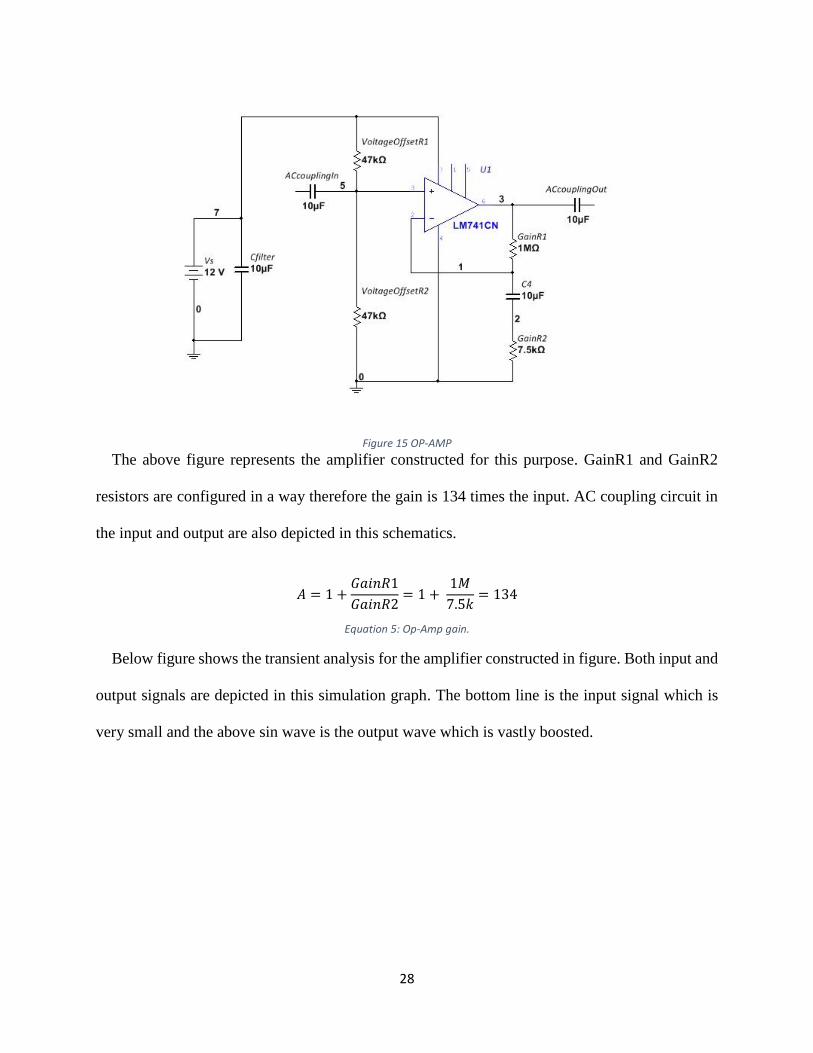
Figure 15 OP-AMP
The above figure represents the amplifier constructed for this purpose. GainR1 and GainR2
resistors are configured in a way therefore the gain is 134 times the input. AC coupling circuit in
the input and output are also depicted in this schematics.
𝐴 = 1 +𝐺𝑎𝑖𝑛𝑅1
𝐺𝑎𝑖𝑛𝑅2= 1 +
1𝑀
7.5𝑘= 134
Equation 5: Op-Amp gain.
Below figure shows the transient analysis for the amplifier constructed in figure. Both input and
output signals are depicted in this simulation graph. The bottom line is the input signal which is
very small and the above sin wave is the output wave which is vastly boosted.
29
Figure 16: Input vs. Output on the amplifier.
The output rides on an offset of approximately 6V. This is removed with the AC coupling
capacitor connected in series in the output. This signal is still an AC signal. For more desirable
results it is converted to DC before fed into the microprocessor. The output signal is fed into a
rectifier and a peak detector shown below in figure. RB154 Rectifier Bridge is used on this circuit.
Figure 17: Rectifier and Peak detector.
30
Below figure and shows the transient analysis of this circuit. The AC signal is converted to DC
within the first cycle. The output signal has a very little ripple. The peak detector in this circuit
will hold the peak value for a brief period for the microprocessor to make correct determinations.
Figure 18: AC to DC conversion.
Figure 10 below shows the transient analysis for the AC to DC conversion in current vs. time.
Figure 19: Transient analyses on Rectifier.
31
5.2.3 Simulations:
Multiple simulation results are provided in the below section. Both no fault and fault scenarios
are investigated.
Figure 20: System Current with No Fault.
In the figure above, the system operates in normal conditions. The high resistance and
inductance value of the network increases the Thévenin equivalent of this system therefore keeping
the system current in acceptable levels. The graph above indicates an average current of
approximately 660mAP-P which is 466mARMS in the system during normal operating conditions.
The simulation result matches with the no fault current calculation in the above paragraph.
32
Figure 21: Main Line Voltage with No Fault.
Another important parameter to pay attention to is the voltage loss within the main line. The
main lines have very little resistance and inductance comparing the load. The above graph shows
there is nearly zero voltage drop within the main lines. Although the above graph is scaled down
to millivolt levels, the voltage line shows nearly flat on zero volts. This means that most of the
voltage drop occurs in the load which also means that nearly all the power is delivered to the load.
Figure 22: Voltage Delivered to the Network with No Fault.
33
The above concurs that almost entire voltage drop occurs across the load which is approximately
170VP-P or 120VRMS. Since both the resistance and voltage drop across the load is known, the
apparent power dissipated on the load can be easily calculated to be 57.6VA
𝑆 =𝑉2
𝑅(𝑉𝐴)
Equation 6: Apparent Power.
𝑃 =𝑉2
𝑍(𝑊)
Equation 7: Real Power.
𝑆2 = 𝑃2 + 𝑄2
Equation 8: Relationship among Real, Apparent and Reactive Power.
Total inductance value of the network is 6.25mH. The source frequency is 60Hz therefore jwl
for the inductor is 2π60 (.00625H) = j2.35. Total resistance ZLoad is 250+j2.35 which is 250.011Ω
and 0.53 degrees. The real power for the load is 57.57W using equation 6. Reactive power can be
calculated using equation 7 below which is 1.86VAR.
Figure 23: System Current with Fault.
34
It can be seen the above figure that current through the system increases dramatically when a
fault is introduced. In normal conditions the peak current was 660mA and in fault situation it is
nearly 3kA. Above simulation was done without the 10Ω limiting resistor in the supply. Without
the 10Ω limiting resistor in the voltage supply, the Thévenin equivalent of the system is calculated
to be .1mΩ which results this very high current. With the 10Ω limiting resistor, the Thévenin
equivalent would be 10.0001Ω therefore the system current would be approximately 1.2A as
calculated equation 4.
Figure 24: Voltage Delivered to the Network with Fault.
The voltage across the load is dramatically reduced opposed to increased current value. In this
simulation, selected resistance inductance values for internal resistance of the main lines match
calculated load resistance and inductance during fault. This results the voltage drops equally spread
between the load and main lines. It can be seen in above figure 10 that the voltage across the load
is reduced to half. The other half of the voltage drop occurs within the main lines.
35
5.2.3 Test Loop and Threshold Detection:
Together with the increased current and reduced voltage on the load during fault is not a
desirable outcome which can damage electronics that operate on the same system. The smart
circuit breaker detects this undesirable outcome and disconnect the load from the main lines. The
main feature that makes this breaker a smart circuit breaker is its ability to continue monitor the
system whether the fault has cleared the system or still persisting. In order to do this, the current
is reduced and limited to safe levels which won’t harm any electrical equipment on the system.
This allows certain voltage drops within the system and these voltage drops can be analyzed to
determine whether a fault is still persisting.
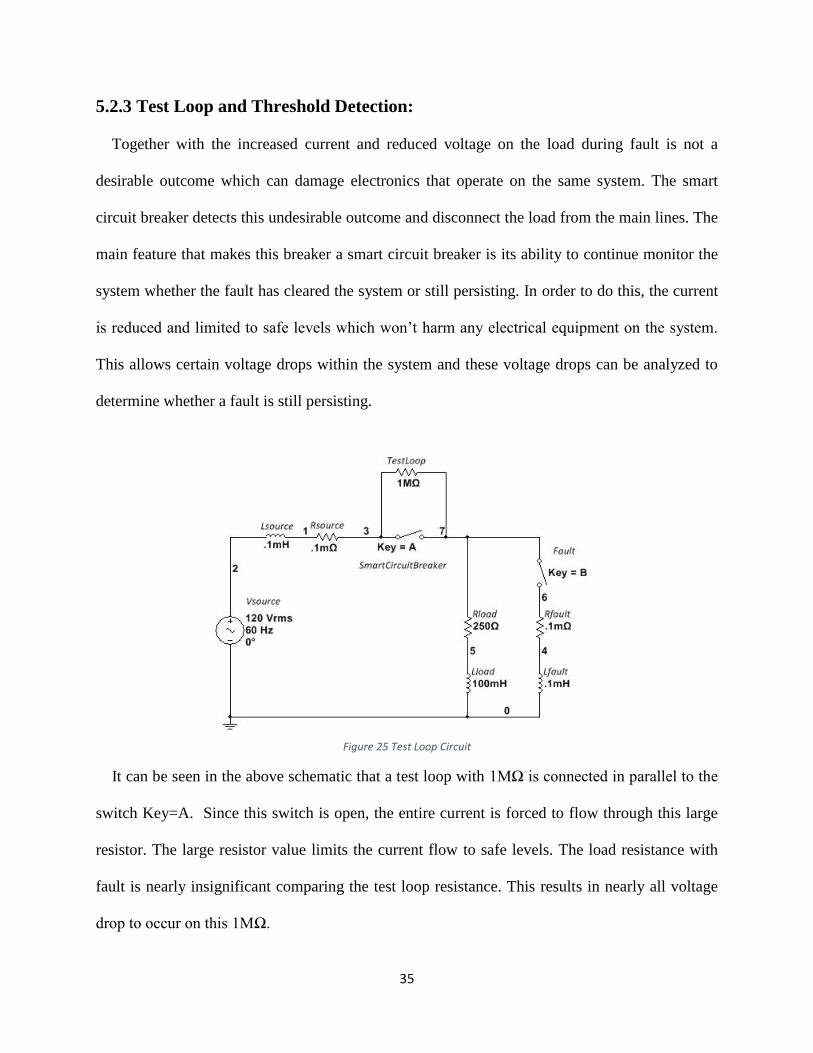
Figure 25 Test Loop Circuit
It can be seen in the above schematic that a test loop with 1MΩ is connected in parallel to the
switch Key=A. Since this switch is open, the entire current is forced to flow through this large
resistor. The large resistor value limits the current flow to safe levels. The load resistance with
fault is nearly insignificant comparing the test loop resistance. This results in nearly all voltage
drop to occur on this 1MΩ.
36
Figure 26 Detailed Test Loop
Above figure 12 shows more detailed schematics for the test loop. 1MΩ resistor is connected in
parallel to the switch. Almost entire voltage drop occurs on this resistor therefore connecting the
microprocessor directly across this resistor would result damaging the microprocessor. This
voltage must be reduced to safe levels first. A 40 to 1 winding ratio coil is connected in parallel to
bring the voltage to safe levels. 120VRMS is the expected voltage value across the resistor since the
load resistance with fault is insignificant. 40 to 1 ratio will bring this to 3VRMS. This signal is an
AC signal. To get more accurate results, a rectifier is used to convert this AC signal to DC. The
RB154 bridge rectifier is used for this task. It can tolerate peak voltages of 280V and peak current
of 1.5A. The simulations and calculations show that this circuit will not exceed 1.2A and 170V.
This DC signal is then fed into a peak detector circuit shown in the figure. The peak detector will
hold the peak DC value for a brief period for the microprocessor to make accurate readings.
37
5.2.4 Voltage Threshold Detection:
The main principle for the test loop to work is detecting the voltage drop across the 1MΩ resistor
and comparing it to a preset threshold. As mentioned earlier, the 1MΩ resistor is too large
comparing to the rest of the resistance of the system. Nearly entire voltage drop should occur here.
Therefor the voltage threshold should be a value very close to 120VRMS.
Figure 27 Voltage Through Test Loop
Figure 13 shows the simulation results for the voltage drop across 1MΩ in the test loop. On the
prototype this value is approximately 17VP-P since a 12VRMS supply is used instead of a 120VRMS.
In the prototype 1MΩ resistor is split into 400kΩ and 600kΩ resistors in order to divide this voltage
into a small voltage which can then be suitable to use with the microprocessor. This action was
done with a 40 to 1 winding ratio coil in the simulation. Since the prototype voltage is much closer
to the microprocessors 5V limit, a voltage divider is a simpler approach. The rectifier circuit is
connected in parallel to the 400kΩ resistor which would have approximately 4.8V of the total
voltage drop on the combined 1MΩ resistance. The rectified and peak detected signal would be
then digitized in the microprocessor board.
38
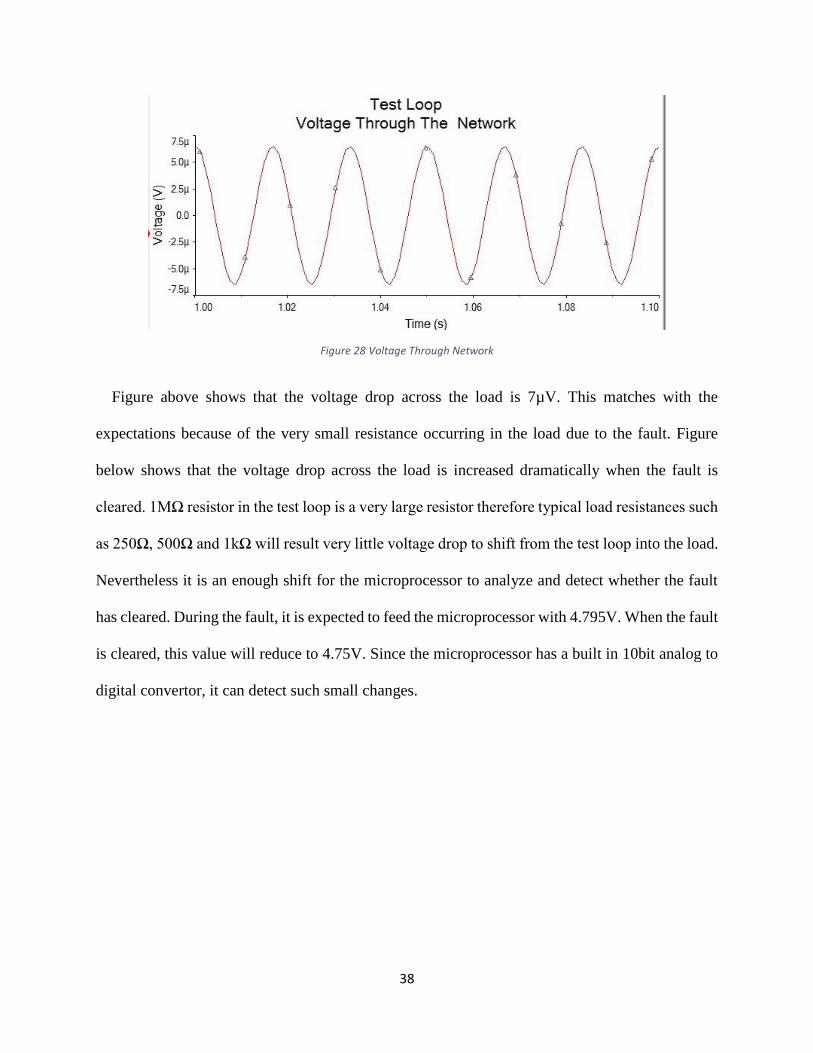
Figure 28 Voltage Through Network
Figure above shows that the voltage drop across the load is 7µV. This matches with the
expectations because of the very small resistance occurring in the load due to the fault. Figure
below shows that the voltage drop across the load is increased dramatically when the fault is
cleared. 1MΩ resistor in the test loop is a very large resistor therefore typical load resistances such
as 250Ω, 500Ω and 1kΩ will result very little voltage drop to shift from the test loop into the load.
Nevertheless it is an enough shift for the microprocessor to analyze and detect whether the fault
has cleared. During the fault, it is expected to feed the microprocessor with 4.795V. When the fault
is cleared, this value will reduce to 4.75V. Since the microprocessor has a built in 10bit analog to
digital convertor, it can detect such small changes.
39
Figure 29 Network Voltage without Fault
Below two graphs figure and figure are representing the current relation with the fault. When
the fault is introduced, the current in the system is 40nA and when the fault clears the current in
the system is 160µA. At this time, the smart circuit breaker is expected to connect the main lines
with the load and deliver full power to the load.
Figure 30 Test Loop Load Current
The increase in current in the system is dramatic once the fault is cleared. It is nearly 400 times
less current once the fault is removed.
40
Figure 31 Network Current No Fault
The simulations also prove that such detection system is possible and very feasible. A test
current has to be introduced to the system which is done on the simulation and prototype through
1MΩ test loop resistor. Since the voltage drops across the loads including internal resistance of
components and main lines are distributed proportional to their value, this can be used to detect
fault even if the loads are disconnected from the main lines. Detecting the voltage drop across the
loop resistor and comparing it to the reference is the simplest and highly accurate way of detecting
fault.
5.3 Microprocessor:
Initially we began testing with an MSP430 F5529 USB launch pad and ACS712 current sensor.
Testing did not go well and there was possible damage to the MSP430 and ACS712 sensor.
Changing to an Arduino Mega processor and ACS750 current sensor makes our goal a little easier
to obtain. The MSP430 may have more functionality than the Arduino, however, it would also be
a little more difficult to program. With the Arduino IDE it is much easier to produce results with
more simplified programming.
41
With analog inputs directly from the circuit the Arduino can read values from the ACS750
current sensor. The Hall-Effect sensor in the ACS packaging allows it to sense the current flowing
through the circuit. The Arduino has an on-board analog to digital converter (ADC) to translate
the analog value inputs into a digital output. The digital output of the microprocessor controls the
relay in the circuit. If the digital output is logic high, then the relay will be toggled open. If the
digital output is logic low, then the relay will remain closed. By analyzing the current within the
circuit with the ACS750 and feeding that information through the Arduino it is possible to
automatically open and reclose.
Figure 32 Arduino Mega
The Arduino is usually at rest in a low power state until current exceeds the threshold value.
This causes an interrupt service routine (ISR) to wake the processor up and restore it to a normal
power state. While operating in its normal power state it continues to monitor the current by
reading the analog input from the sensor. Once the current value returns below the threshold the
Arduino will output a signal to the relay to reconnect the main line. A software delay is encoded
so that the initial reconnection will not trip the breaker.
42
5.3.1 Block Diagram:
Below is the digital logic of the microprocessor explained with a block diagram. The circuit is
divided into two separate loops to provide the Arduino with two conditions. The first loop is the
primary loop containing the main line in which the system is stable. Once a fault has been detected
and the breaker trips, then the main line is disconnected and the secondary loop is entered. The
secondary loop is used to analyze the current so that the microprocessor knows when to reclose.
Both the secondary loop and current sensor are assigned a unique pin location on the Arduino.
For example, A0 and A1 may be used. Pin A0 may be used to read from the secondary loop (test
loop) while pin A1 is used to read values from the current sensor. The comparators evaluate the
input values of pins A0,A1 and then output a digital logic value to the microprocessors logic gates.
In this case, an OR gate is appropriate.
The comparator is given a standard voltage value as a reference. If the value read by the pin is
greater than the reference, then it will output a value of 1 for logic high. If the input voltage value
to the pin is less that Vref, then a digital value of 0 or logic low is applied. We calculated our Vref
values to correspond with the voltage values in our circuit for the conditions where a fault is present
and fault is not present. These values establish a threshold for the Arduino. It will respond
accordingly when the input values are either within the given range or exceed the given range.
43
Figure 33: Block Diagram for the Microprocessor.
5.3.2 Voltage Threshold Detect:
The voltage threshold is detected by comparing the voltage drop across the 1MΩ test loop
resistor to a predefined voltage reference. Since almost entire voltage drop should occur on this
large resistor, the reference value should be very close to the supply voltage which is 12V. On the
simulations the supply voltage is 120V therefore the threshold value differs. 12V supply voltage
is stepped down to 4.8V using a voltage divider with a 600kΩ and 400kΩ (1MΩ in series).
Simulations show that when the fault is cleared the voltage drop across 1MΩ (400kΩ for the
microprocessor feed) is reduced. The simulations show that it is typical to have this voltage
decreased to under 4.65V. The reference voltage is set at 4.70V. During the fault the voltage drop
across the 400kΩ resistor is about 4.78V. When the fault clears it is less than 4.70V which will
trigger the comparator to send logic high to the OR gate in the microprocessor.
44
5.3.3 Current Threshold Detect:
The current threshold works similarly to voltage threshold. However instead of tapping to the
test loop resistor directly, a current sensor reading is used. Simulations show that with maximum
loads, the system current is less 500mA. Therefore the predetermined current threshold is 500mA.
If more loads are added to the system, it will trigger the breaker to trip. Since a short will cause a
much higher current, it will also trip the breaker.
5.3.4 Or Gate Logic:
The OR gate logic is primarily how the Arduino will command the relay. There are four possible
situations that the Arduino can be given. If the inputs to both comparators A and B are greater than
Vref, then both comparators will output a value of 1 to the OR gate. This will result in an output of
1. If A receives an input value greater than Vref and B does not, then A will output 1 and B will
output 0. This will result in an output value of 1. The only instance where the output will be 0 is
when A and B both output 0. Any time the OR gate outputs a value of 1 it indicates that there is
currently a fault in the system and the relay will be triggered to open the line.
OR GATE
A B O
1 1 1
1 0 1
0 1 1
0 0 0 Table 1: The logic for the microprocessor
45
6. Conclusion
Our MQP team was not able to successfully construct a functional smart recloser prototype.
Theoretical simulation proved that the circuit design should work, but time constraints and
troubleshooting did not allow for an actual version to be completed. The prototype is a small scale
model of a circuit breaker intended for an overhead power distribution systems. A short term goal
would be to create a functional circuit breaker. Certain newer parts and equipment could produce
a more accurate device. Part of our roadblock was making the Arduino code operate properly.
What makes the smart recloser such a great tool is how dynamic it can be and the potential to adapt
to new demands. The code can be modified to include additional features.
As far as the software is concerned you may be able to include a method of calculating the slope
of the current to determine if the rate at which it is changing indicates a fault. This way, the circuit
breaker would be more refined in detecting faults. For example, if it is an off-peak hour for power
consumption and a fault appears on one of the feeder lines. Due to such a small current being
drawn, the fault current of the feeder line may not be enough to trip a breaker for that network. A
quick solution to this is to have a circuit breaker on every line, but that may not be the most cost-
effective. Some ideas are to first take the working prototype and then attempt to build one that will
scale for overhead power lines. After that has been implemented you can think about how it would
need to be serviced. Perhaps a battery cell could be used to power it or maybe even a solar
extension would be a good idea. A photovoltaic panel would be a sustainable way to keep it in
operation. Also consider that the circuit breaker could wirelessly transmit information back to a
distribution company that maintains those lines and could signal for a technician if necessary.
46
Appendix
PSpice Simulation Code
Main line including source, resistance of the power lines, and transformer:
V 1 0 sin(0 28.2 60 0 0 0)
Rwire 1 2 1u
L1 2 0 12m IC=0
L2 3 0 6m IC=0
K L1 L2 0.998
Switch for the main line controlled via voltage pulse: