32
Public Infrastructure Investment in the 2000s: Lessons from the ‘Perfect Storm’ Joe Branigan Senior Research Fellow SMART Infrastructure Facility, UOW SMART Seminar Series 5 February 2015
| Date post: | 15-Jul-2015 |
| Category: |
Economy & Finance |
| Upload: | smart-infrastructure-facility |
| View: | 121 times |
| Download: | 2 times |

Public Infrastructure Investment in the
2000s:
Lessons from the ‘Perfect Storm’
Joe BraniganSenior Research Fellow
SMART Infrastructure Facility, UOW
SMART Seminar Series
5 February 2015
Outline
• Overview of Infrastructure Cost Drivers Study
• How public infrastructure investment works in Australia
• Overview of public investment in the 2000s – the ‘Perfect Storm’
• Public policy lessons from the ‘Perfect Storm’…
• The 2010s…Why has it become more difficult to manage pressures on ourpublic infrastructure?
• What can we do about it?
Poor infrastructure decisions have a high opportunity cost and can be a long-term drag on the economy’s productivity.
Gary Banks (2012)
SMART Infrastructure Cost Drivers Study
• The aim is to understand what factors have driven the rise in public infrastructure costs over the past 15 years
• We examine a database of road and rail projects (case studies) supplied by the Queensland, NSW and Victorian governments
• We look for trends over time
• We benchmark similar projects across jurisdictions
• Important work…
3
What the Productivity Commission recommended
• The Australian Government should fund the development andongoing implementation of a detailed benchmarking framework formajor infrastructure projects in Australia – in transport, electricity,water, gas and social infrastructure.
• The provision of data to support the benchmarking frameworkshould be a requirement attaching to all Australian Governmentfunding for major infrastructure projects.
• This ongoing benchmarking must be seen to be independent of bothgovernment and industry influence and also be seen as technicallyrobust and credible.
RECOMMENDATION 9.2
4

How it all works
5
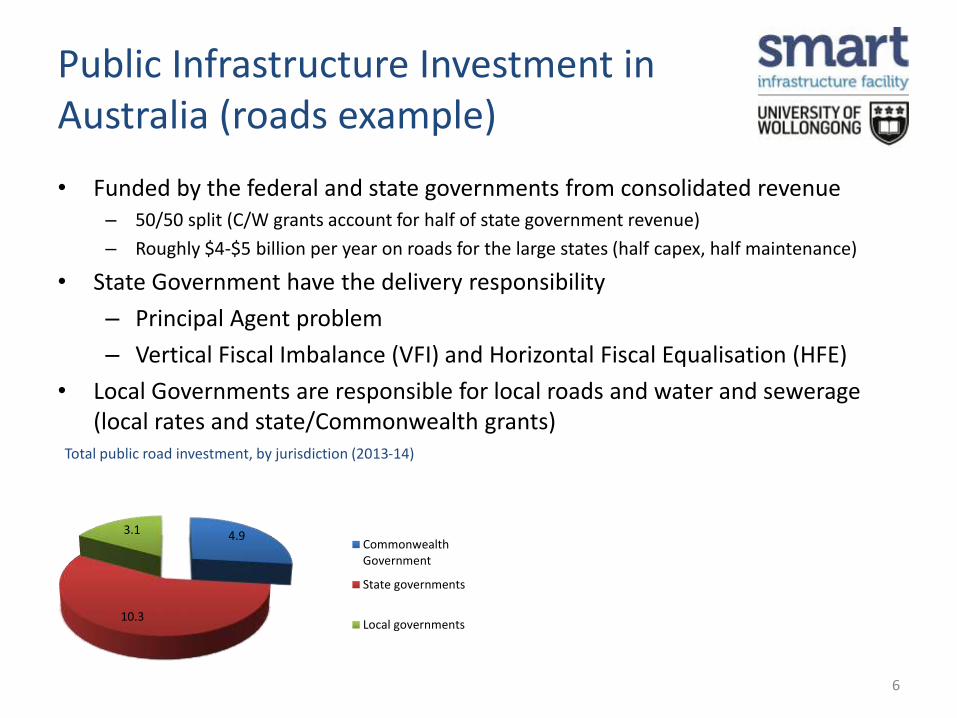
Public Infrastructure Investment in Australia (roads example)
• Funded by the federal and state governments from consolidated revenue– 50/50 split (C/W grants account for half of state government revenue)
– Roughly $4-$5 billion per year on roads for the large states (half capex, half maintenance)
• State Government have the delivery responsibility
– Principal Agent problem
– Vertical Fiscal Imbalance (VFI) and Horizontal Fiscal Equalisation (HFE)
• Local Governments are responsible for local roads and water and sewerage (local rates and state/Commonwealth grants)
6
4.9
10.3
3.1
Total public road investment, by jurisdiction (2013-14)
CommonwealthGovernment
State governments
Local governments

The Perfect Storm
7

The 2000s – the ‘Perfect Storm’
• Economic reform progress in 80s and 90s
– Corporatisation of inefficient public utilities
– Fiscal restraint
• 2000s - A boom decade
– Mining boom (2003-2011)
– Electricity rebuild (mid-2000s, post Somerville I)
– Drought proofing (late 2000s)
– Response to GFC (2008-09 to 2010-11)
– The rise of the Mega Project
– Increased urban density
– More red and green tape
8

The mining boom
• Mining boom increased competition for inputs used in majorinfrastructure projects
– In economic terms, as export prices rose, the opportunity cost of usingthose inputs for say urban transport projects or for desal plantsincreased
• But once launched, the projects were not scaled back, even when theircosts spiralled out of control
• So to shift scarce resources from non-mining to mining uses, input priceshad to rise even more
9
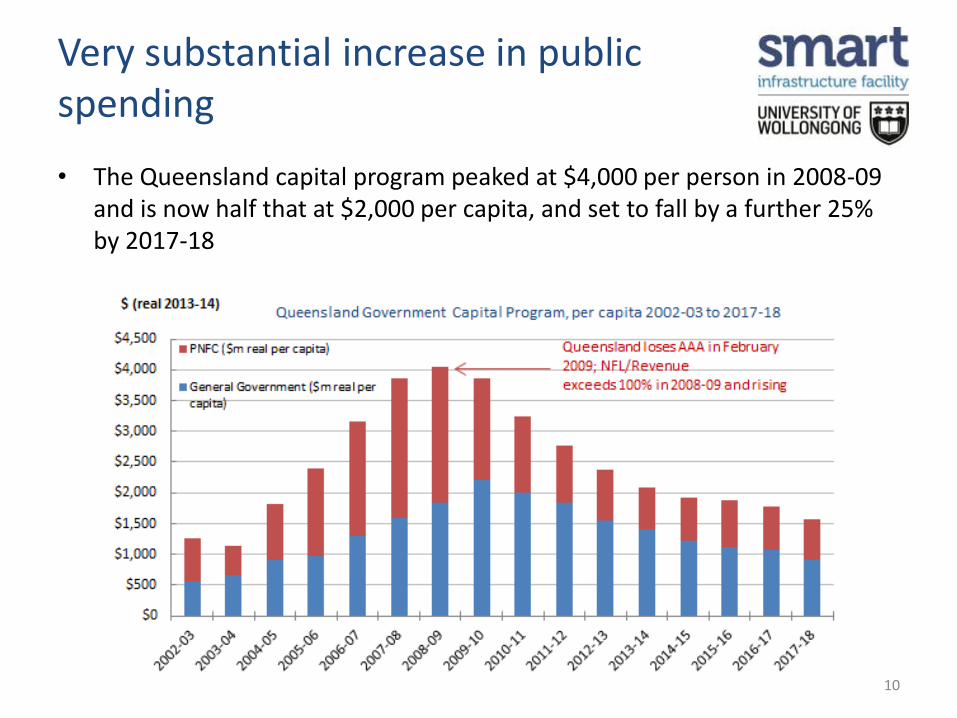
Very substantial increase in public spending
• The Queensland capital program peaked at $4,000 per person in 2008-09 and is now half that at $2,000 per capita, and set to fall by a further 25% by 2017-18
10

High input growth in the 2000s was not match by a corresponding growth in output
• Productivity has declined since 2003-04
– Ramp-up in mining boom investment without corresponding increase in output, but benefits from production boom now
– Very poor performance in EGWWS, mothballed desal plants, over-spec NEM, roads with few cars
11

Mega projects
• The ‘Mega-Project’ has become more popular in recent years– Major road and rail tunnels, water grids, NBN
– Politically popular, little downside to a grand promise
• Significantly higher risk compared with incremental approach– Because these projects were 'one of a kind', their costs and patronage inherently
difficult to predict, and very vulnerable to forecasting error
– But once launched, mega projects proved impossible to turn around, and displaced lessvisible, but often no less important, incremental or de-bottlenecking projects
• $10b Cross River Rail is a fiscal bullet dodged– $5 billion BaT tunnel
12
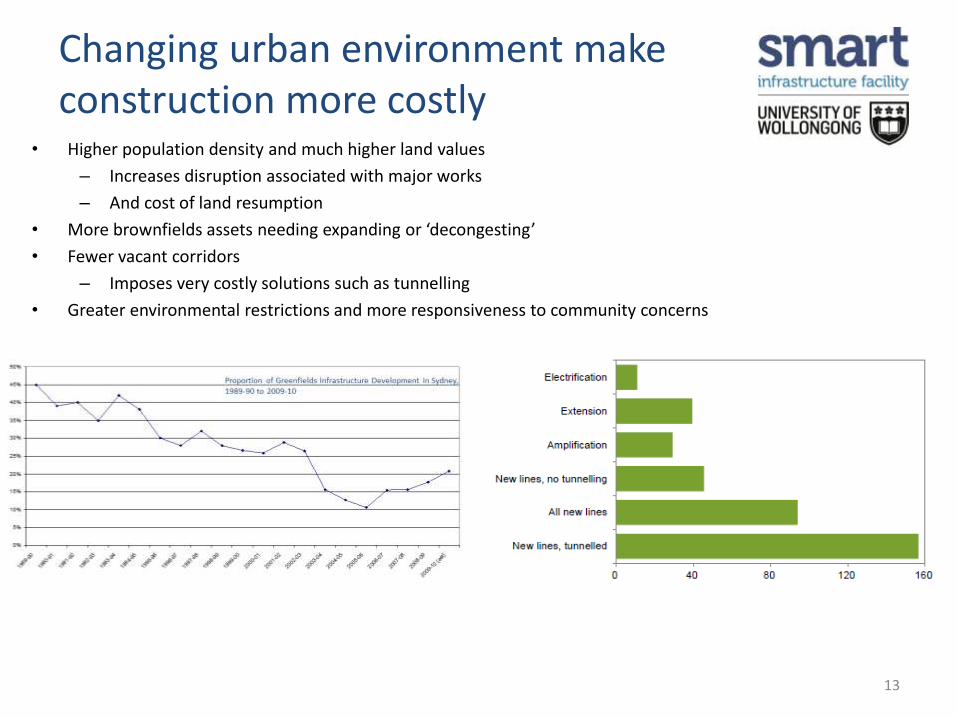
Changing urban environment make construction more costly
• Higher population density and much higher land values
– Increases disruption associated with major works
– And cost of land resumption
• More brownfields assets needing expanding or ‘decongesting’
• Fewer vacant corridors
– Imposes very costly solutions such as tunnelling
• Greater environmental restrictions and more responsiveness to community concerns
13
Structural factors - Technical standards
• Bespoke engineering (NSW rail)
– Successive build of trains has seen progressively increasing demands insystems requirements, which in some areas have then been built intothe technical standards.
– Generally, off the shelf products do not meet these requirements andso this means each new train must be designed from scratch to meetthe NSW standards of the day.
• Bespoke engineering (Qld roads)
– ‘Queensland Only’ standards set by Roadtek made constructions costsneedlessly high.
– Were removed by the Newman Government early in its first term.
14

Structural factors – Environmental, Planning and Design requirements
• EPBC Act
– Onus of proof to say environment won’t be harmed in any way
• Some EIS submissions run into thousands of pages and take years toassess
• Some progress at Commonwealth-State interface to reduceduplication
• Planning delays through 2000s
– Backlog in Queensland lead to delays of several years
– Approval times have been halved as a result of sensible streamliningreforms
• Design requirements
– Tendering process means designs in triplicate (eg. Toowoomba SecondRange Crossing)
– PC recommended Government purchase/owns the designs so resourcecosts not wasted
15
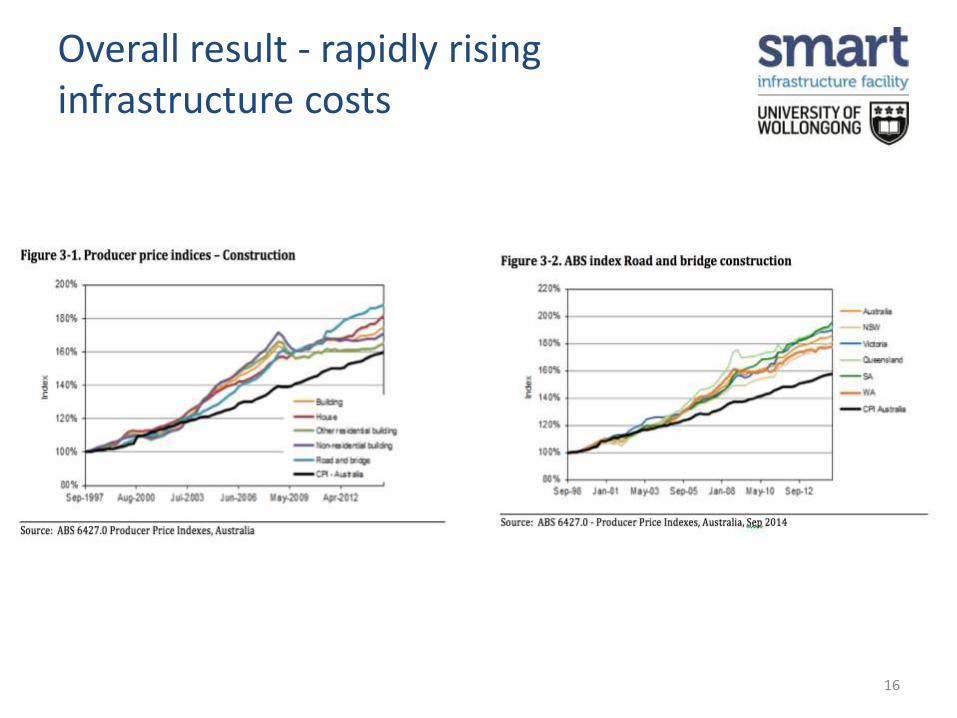
Overall result - rapidly rising infrastructure costs
16

Where to from here?
17
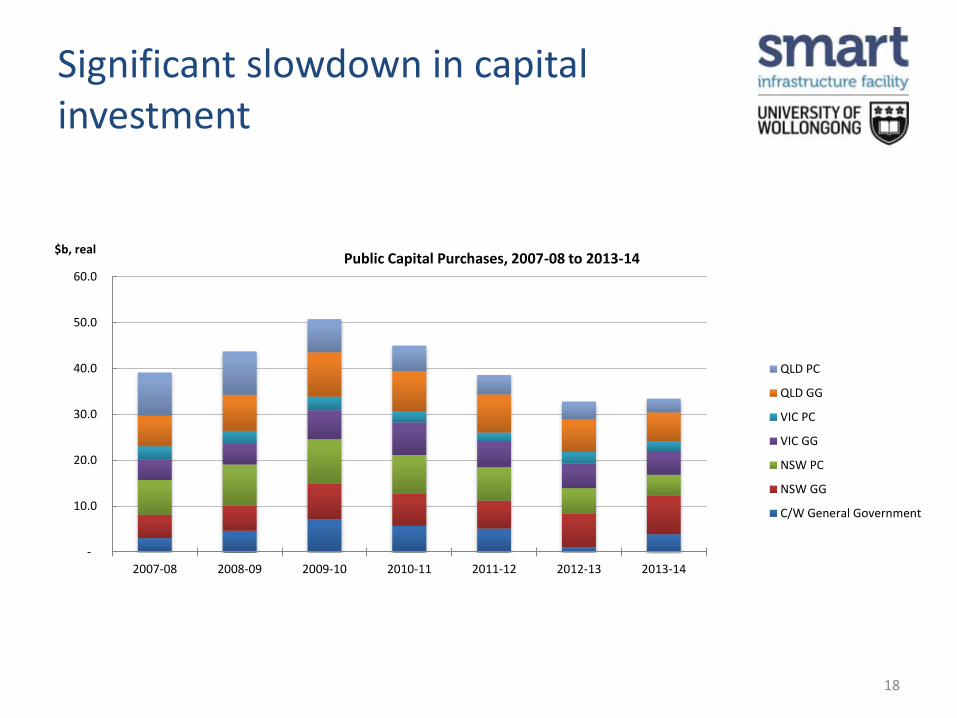
Significant slowdown in capital investment
18
-
10.0
20.0
30.0
40.0
50.0
60.0
2007-08 2008-09 2009-10 2010-11 2011-12 2012-13 2013-14
$b, realPublic Capital Purchases, 2007-08 to 2013-14
QLD PC
QLD GG
VIC PC
VIC GG
NSW PC
NSW GG
C/W General Government
Asset recycling
• It is sensible for governments to:– Exit activities which nowadays can be better financed and managed by
the private sector (e.g. running electricity networks), and
– Concentrate fiscal resources on activities in which the public sector has a comparative advantage (such as planning and managing urban road networks).
• The gain to the community depends on:– Properly structuring the asset disposals, so as to get greater efficiency
in assets being disposed of, and
– Properly select and manage the projects which the disposals help finance.
19

Lessons from the Perfect Storm
20
Create and sustain options through better planning
• Our political masters require a ‘Needs Analysis’ – they want to be sure theproposal isn’t the latest popular thought bubble emanating either from within thedepartment or in the public domain.
• Setting the overall service delivery objectives and the fiscal envelope are necessaryconditions to undertake a sensibly bounded needs analysis.– This is what Cabinet needs to make sensible choices between well considered options.
• Project prioritisation framework is vital and DSDIP has done some valuable workhere
– Business cases alone fail to properly set broad priorities
– Broad CBA is best…what’s the objective and what’s the least cost way toachieve it
– MCA suffers from a number of flaws, including susceptibility to subjective bias
• Clear objectives then guide better planning, including corridor selection andreservation
21
Better Manage Demand
• Cannot continue to try to satisfy forecast demand – an impossible taskwith no end
• Congestion manages demand, but has high social costs
• Pricing must be cost reflective and responsive to peaks– New technologies allow for this
• Road pricing must begin to untangle cross-subsidies between privatevehicles, public transport and freight– Heavy vehicles now closer to ‘paying their way’ via the NHVR
– PT is still heavily subsidised with barely 20% cost recovery of just opex
– Private vehicles face a mix of ‘free’ and tolled roads at point of use
22

Incremental is beautiful
• Institutional bias towards the ‘mega-project’
– Political factors• Ribbon cutting
• Fallacy of not properly costing uncertainty and not properly valuing flexibility
– Infrastructure Australia and inexorable rise of Commonwealth co-funding
– Capital recycling
Create offsetting biases – higher hurdles for larger projects, requirement in all projects to identify incremental alternatives, requirement to identify options for adapting project in the event of adverse cost or patronage
shocks, and
Use planning to create lower cost, incremental options for the future – e.g. through innovative corridor reservation strategies, which structure reservations in line with value of the option they give government
23
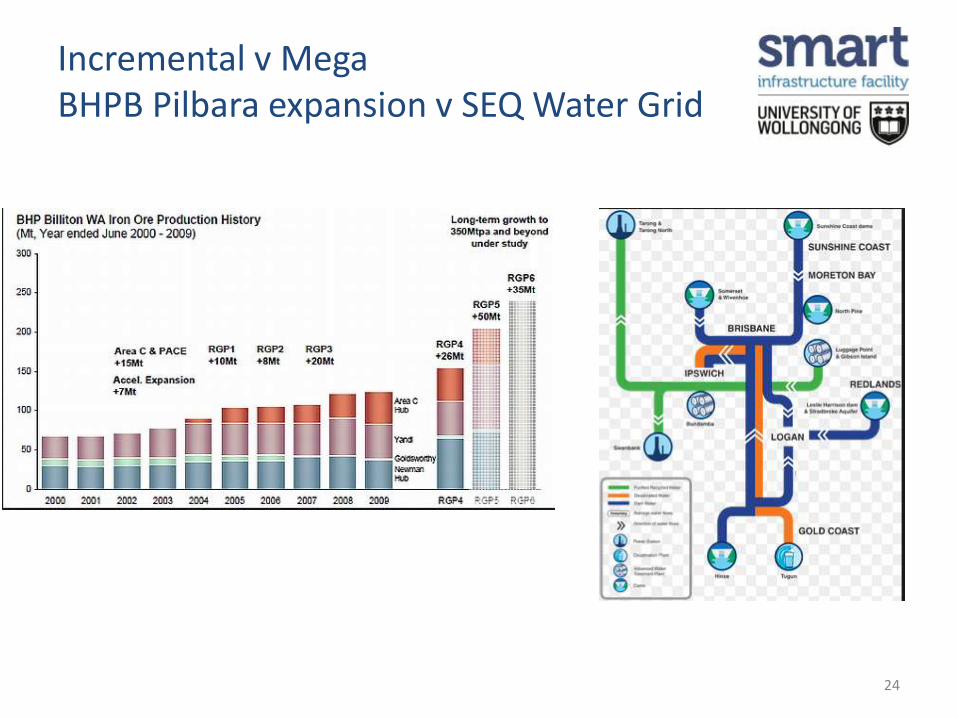
Incremental v MegaBHPB Pilbara expansion v SEQ Water Grid
24

Institutional reform to focus on accountability and transparency
• How to get from A to B– Set customer-focussed network objectives (service delivery)– Make sure every asset is on a balance sheet that someone is
responsible for disclosing and managing– Corporatise remaining public assets such as the road network– Utilise private sector, but ensure risk is shared properly
• More nuanced risk allocation• Budget constraints will lead to better capex/opex trade-off• Emphasis on portfolio of assets and lifecycle approach
– Project prioritisation framework must work within a set budgetconstraint over the forward estimates
Queensland’s Infrastructure Prioritisation Framework Tool:Key objective is to move away from a bottom-up approach which is leading to too many business casesbeing developed by agencies without sufficient regard for Government’s long term strategy forinfrastructure investment or whole of government fiscal constraints.
25

Summary I
• Infrastructure investment is a cost, not a benefit; a means not an end.
• Our processes for project prioritisation and selection are poor.
– We need to think more carefully about benefits.
• Our funding models are unsustainable.
– We need to think more carefully about the financial sustainability of large public infrastructure projects.
“Without appropriate price signals, quality investment decisions will not be made. And present price signals are far from appropriate. The risks of making large infrastructure investment decisions in such an information-poor environment are very great.”
Ken Henry 2005
26

Better priority setting
Better incentives
Better governance
• Less focus on major ribbon cutting
• More use of well-targeted ‘pinch point’ interventions
• Improved life cycle management
• Ensure assets have ‘owners’ whose returns depend on life-cycle performance
• Improve contracts to better align risk, effort and reward
• Use prices or shadow prices to signal costs
• Clarify roles of Commonwealth/State bodies
• Better align analysis methodologies
• Greater transparency at all stages
• Improve public/private balance
27
Summary II – what can be done?

Thank you
28
Joe Branigan
Senior Research Fellow
SMART Infrastructure Facility
+61 439 015 314
Henry Ergas
Professor, Infrastructure Economics
SMART Infrastructure Facility
+ 61 419 239 710

Additional Slides
30
31
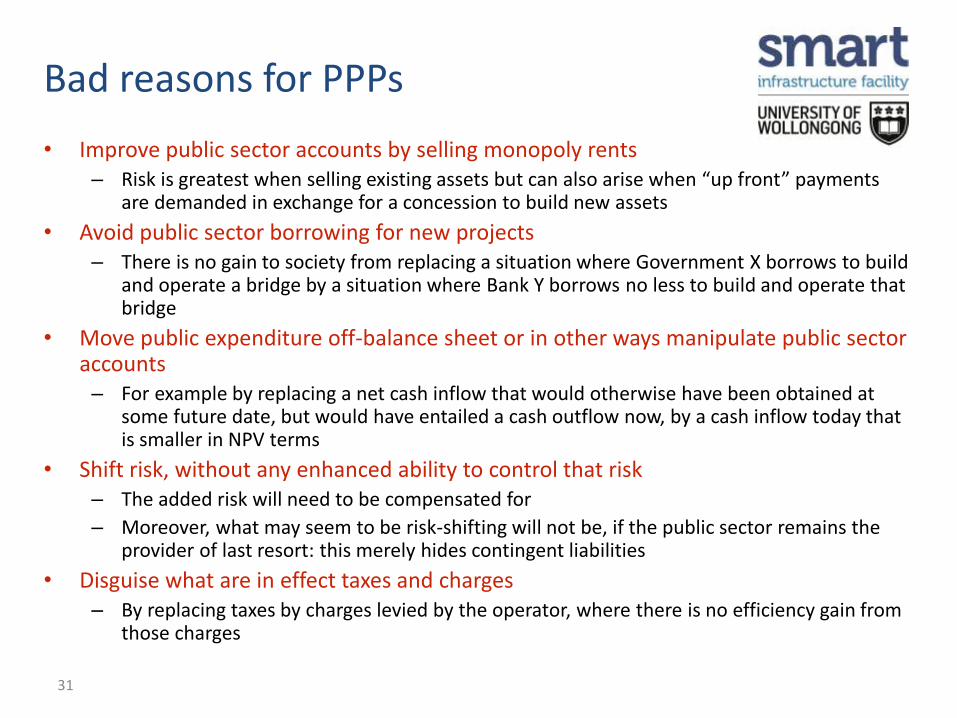
• Improve public sector accounts by selling monopoly rents– Risk is greatest when selling existing assets but can also arise when “up front” payments
are demanded in exchange for a concession to build new assets
• Avoid public sector borrowing for new projects– There is no gain to society from replacing a situation where Government X borrows to build
and operate a bridge by a situation where Bank Y borrows no less to build and operate that bridge
• Move public expenditure off-balance sheet or in other ways manipulate public sector accounts– For example by replacing a net cash inflow that would otherwise have been obtained at
some future date, but would have entailed a cash outflow now, by a cash inflow today that is smaller in NPV terms
• Shift risk, without any enhanced ability to control that risk– The added risk will need to be compensated for
– Moreover, what may seem to be risk-shifting will not be, if the public sector remains the provider of last resort: this merely hides contingent liabilities
• Disguise what are in effect taxes and charges– By replacing taxes by charges levied by the operator, where there is no efficiency gain from
those charges
Bad reasons for PPPs
32
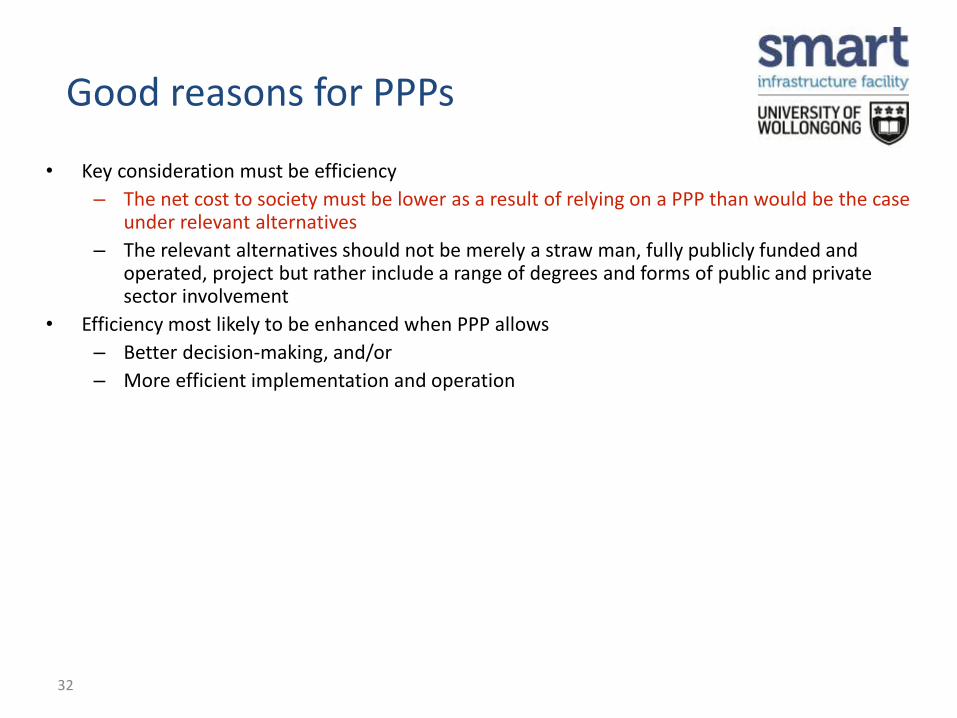
• Key consideration must be efficiency
– The net cost to society must be lower as a result of relying on a PPP than would be the case under relevant alternatives
– The relevant alternatives should not be merely a straw man, fully publicly funded and operated, project but rather include a range of degrees and forms of public and private sector involvement
• Efficiency most likely to be enhanced when PPP allows
– Better decision-making, and/or
– More efficient implementation and operation
Good reasons for PPPs


