Technical Report For: Smarter Not Harder Improving Labour Productivity in the Primary Sector A Joint Dairy InSight (DairyNZ) and Sustainable Farming Fund Project 1 June 2005 to 30 June 2007 30 April 2009 Report Prepared By: Geoff Taylor Louise van der Sande Rachel Douglas DairyNZ
Transcript
Technical Report For:
Smarter Not Harder Improving Labour Productivity in the Primary Sector
A Joint Dairy InSight (DairyNZ) and Sustainable Farming Fund Project 1 June 2005 to 30 June 2007
30 April 2009 Report Prepared By: Geoff Taylor Louise van der Sande Rachel Douglas DairyNZ
Smarter Not Harder: Improving Labour Productivity in the Primary Sector Page i
Executive Summary This document is the final technical report for the project titled “Smarter Not Harder; Improving Labour Productivity in the Primary Sector”. The project was jointly funded by Dairy InSight (now DairyNZ) and the Sustainable Farming Fund to investigate labour productivity in the agricultural sector, using dairy farms as a case study. What is Labour Productivity? Labour productivity crudely defined as outputs divided by hours worked. In the long run increasing productivity is seen as critical to improving the standard of living of New Zealanders. Increased productivity of individuals theoretically leads to greater net revenue per person, which allows for increased wages and greater disposable income. Historically the dairy industry has been focussed on increasing outputs with individual businesses left to grapple with managing time inputs. However, the business environment is changing and time inputs are becoming a greater concern. Why is Labour Productivity Important? Historical trends and future labour forecasts suggest that the demand for people to work on dairy farms will increase, while the availability of people who are willing to work on-farm will decrease. The two main divers are the increasing reliance on paid staff compared to family labour, which has traditionally been the mainstay of the industry, and competitiveness of the dairy industry as an employer, which affects the ability of farmers to attract staff to fill the increasing number of positions. Over the last 20 years the number of people on farm has stayed reasonably steady but paid staff, as distinct from family labour, have increased from approximately 5,000 to 18,000 people. Recruiting people to work in the industry has been increasingly difficult and immigrant labour on temporary work visas has formed a growing part of the work force. A significant part of the difficulty arises from the perceived competitiveness of the dairy industry as an employer, with long hours and low pay being seen as the norm. In actual fact the dairy industry pays very competitive wages, but hours are longer than the average for a majority of farm staff, which results in lower hourly rates on a comparable basis. The time requirement from staff is one of the most significant issues employers will need to address to be competitive. To maintain profitable, sustainable and competitive businesses in the face of these challenge farm owners will be forced to either:
• Maintain current operations by doing more of the work themselves, which means they have to rationalise tasks on farm to manage their own time, or
• Redesign the job and associated terms and conditions to broaden the appeal of a career on-farm, which will require employers to manage time requirements of staff.
Smarter Not Harder: Improving Labour Productivity in the Primary Sector Page ii
Scope In response to the drivers identified above this project examines labour productivity from the time perspective. Time can be managed in the business by eliminating tasks, shifting the timing of the labour requirement to even out demand, or reducing time required to complete tasks. The focus of this project is on reducing time, primarily by reducing wasted time. Poor workplace design, work processes, people management and a lack of worker motivation all result in wasted time and decrease the productivity of the business. People management and worker motivation have been addressed through other means, such as the HR and Compliance Toolkits and the Certificate in Rural Staff Management and therefore workplace design and work process are the focal points of the project. The project was broken into the following components:
Time use study This part of the project draws on work study method to investigate aspects of workplace and process design that impact on time requirements on farm. To do this an appropriate method for collecting farm information had to be designed and piloted. Capturing on farm innovation It is recognised that farmers have a wealth of ideas that can help people work smarter not harder. This part of the project aimed to capture farmer innovation. Raising awareness of labour productivity To make an impact in the farming population the level of awareness around labour productivity had to be raised to it into focus.
Current Performance Existing measures of labour productivity are unclear and in conflict with industry goals in many cases. For example, cows per full time equivalent is a labour productivity measure commonly used in the industry. To improve this measure a farmer could drop the number of full time equivalents and force the rest to work harder, an approach that would negatively impact the image of farming. This project recommends the following measures are used to provide an overview of labour productivity:
Hours/Cow Much of the work on farm is cow related. Use of this metric requires the industry to consider how that time allocation per cow can be driven down.
Cows milked/Person milking/Hour of milking Milking is the single largest use of time on a dairy farm. This measure is a proxy for milking efficiency. Turnover of farm staff
Smarter Not Harder: Improving Labour Productivity in the Primary Sector Page iii
Turnover represents a cost to farmers in terms of direct recruitment costs as well as lost productivity as a new employee comes to grips with the farm business and as they wind down once they have decided to leave.
Estimates of current performance are provided in the table below. The level of estimation required when collating this information reflects the lack of focus on time inputs, which is complicated by the need for time use information that is not typically available from farmers. The data also show a low level of improvement in these indicators over time. Year 2000 2007 Case Study
Farms Hours per cow1 20 19 15.2 Cows milked / person / hour of milking2 70 80 100 Turnover3 30% 28% N/A4 Time Use on Farm – Case Studies Because the project was a pilot, the approach to investigating time use on farm was to case study 20 farms. Using a work diary methodology, participants recorded their time usage against predefined activity codes throughout the year. The data collected was entered into a database and analysed for variation. The reasons for variance were investigated by interviewing the farmers involved. The farms chosen for the case study were similar in size and operational structure to minimise variation due to factors other than workplace and process design, the two focal points of the study. The farms that most closely match these criteria were owner operator properties of approximately 200 cows. The farms were selected from Taranaki and Waikato. The 12 month data collection period commenced in March 2006 and concluded February 2007. The method was designed to provide an overview of time usage on farm and was piloted within a small section of the industry to test its usability. The method was easy to use but somewhat labour intensive. With slight modifications it could be easily adapted by farming businesses to monitor their time inputs. Total time usage Prior to the case studies it was hypothesised that there would be a high degree of variation in time usage due to the low level of focus in this area. This proved to be correct. The data collected during the pilot study identified a two fold difference in the time required to operate similar sized businesses. This suggests there is opportunity for individual farmers to redesign the way they work to establish more time efficient systems and processes. On average the participant group required 3,170 hours/year to operate their farm, across all staff members. This ranged from 2,075 hours to 4,776 hours, a difference of 2,701 hours or
1 Estimated from Dexcel Profit Watch data, based on the assumption that one full time equivalent equals 2,400
hours of work 2 Estimated from anecdotal evidence collected form farmers 3 Estimated from Statistics NZ Linked Employer-Employee Database 4 As owner operated farms turnover of staff is not applicable
Smarter Not Harder: Improving Labour Productivity in the Primary Sector Page iv
130 %. This is equivalent to 15.2 hours/cow compared to the industry average of 19 hours per cow. It could be reasonably assumed that hours invested in the farm would be rewarded with greater output. This did not prove to be the case. Kilograms of milksolids per hour worked (kgMS/hr) averaged 23 kgMS/hr worked for the 12 month period, ranging from 34 kgMS/hr to 15 kgMS/hr, a difference of 19 kgMS/hr or 127%. At a farm level there was little indication as to what was driving time inputs on farm. There was no definite relationship between time usage on farm and parameters such as herd size, farm area, or size of farm dairy, which had been expected to drive time requirements. Hours per person On average, full time workers in the study worked a total of 1,960 hours in a 12 month period. The maximum total hours worked for a full time equivalent in this study was 2,913 hours and the minimum 1,276 hours, a difference of 1,637 hours or 128%. On average this is substantially less than the 2,400 hours which is considered to be the industry norm for a full time equivalent. The average hours worked by full time New Zealand employees are 1,826, according to Statistics NZ. The average hours recorded by the farmer case study participants are 7% above the New Zealand average, and at the extreme 60% above the average worker. Surprisingly, just over 50% of the people in the study who would be considered full time workers recorded fewer hours than the average New Zealander. On a weekly basis the majority of study participants averaged between 40 and 50 hours per week. The seasonality of the industry does mean that at certain times of the year people do work very long hours. A number of the study participants recorded working in excess of 70 hours a week during busy periods. These peak loads were balanced out by reduced workloads in quieter periods when total hours recorded on the farm dipped below 20 hours per week. The hours recorded during the study are less than expected and contrary to the popular perception of farming being defined by long hours. These farmers do enjoy the great lifestyle that farming holds forth as a reason to come and work on farm. However, as well established owner-operated businesses, the case study farms are a small sub-sample from the industry. It would be dangerous to generalise this finding across all farm operations. Time usage by task The participant group recorded how their total time was divided between six major predetermined task groupings. The results are shown in the graph below.
Smarter Not Harder: Improving Labour Productivity in the Primary Sector Page v
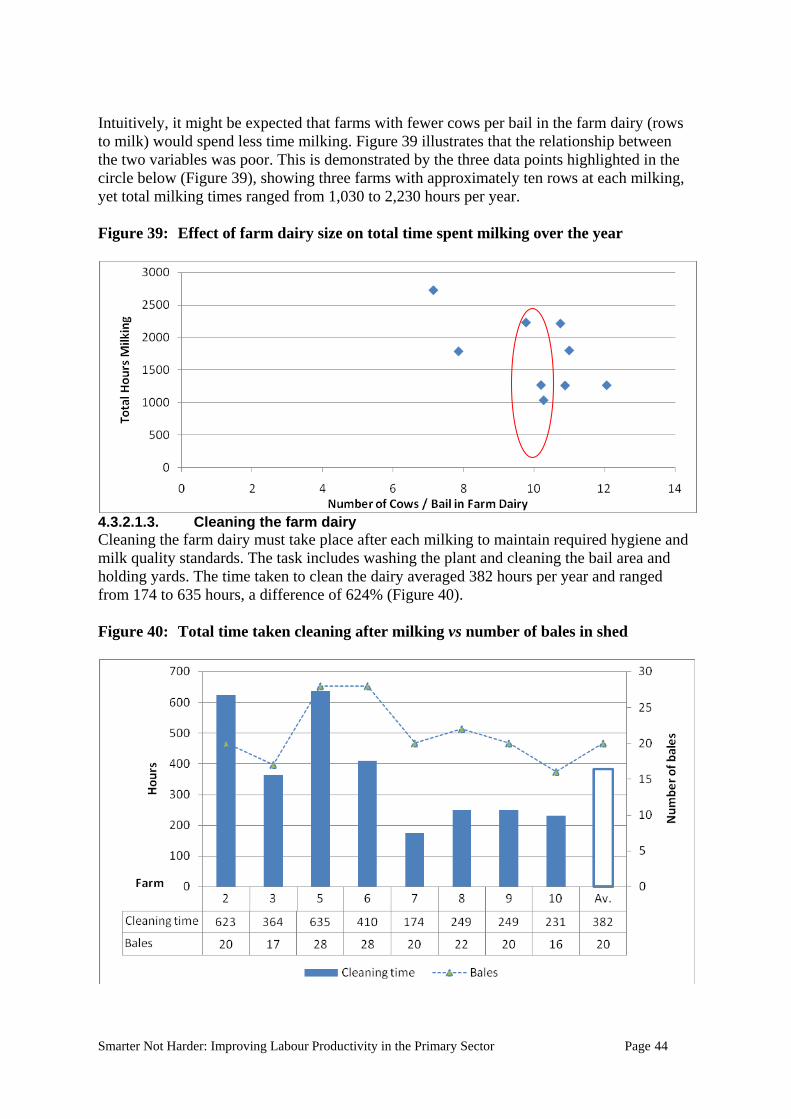
Milking is the major time requirement in all farming businesses and varied between using 46% and 68% of time, which in actual hours equates to between 1,050 and 2,900 per annum, a difference of 176%. Due to the magnitude of time involved in milking it should be a primary area of focus for driving improvement. The size of farm dairy and number of cows did not sufficiently explain the variation in time input for milking, but the type of dairy did to a certain extent. Farm dairies that required two people effectively doubled milking time. In some cases this was a choice couples made to work together and in others the design of the farm dairy (workplace) was poor and it physically required two people to milk. The one other task area that demonstrated a slight relationship to over all time use was in feed tasks related to supplementary feeding in higher input systems. It was evident that where individual farms took longer to milk they took longer for all other tasks as well. There were no clear reasons for the increased time use, other than the choice of farming couples to work together. It should be noted that people do things for a variety of reasons, not all of them to optimise the efficiency and profitability of their farming business. Those reasons must be acknowledged, but not used as an excuse. Farmers should be in a position where they consciously make decisions and understanding the impact of those decisions. Valuing people’s time Labour has an economic cost that farmers often choose to ignore. This study provides the opportunity to quantify that cost. Based on what paid staff would have to be paid to operate the farm, hourly rates can be calculated to range between $12.56/hr and $28.92/hr. At the upper end, this is in line with the rate a mid level professional earns; however at the lower end it is minimum wage. It could be argued that time is under-rewarded where a second person is employed and that there is an opportunity cost to them working on farm if they could earn more working off-farm. Reducing time inputs on farm This part of the project also gathered a wealth of ideas from case study participants and observation of practice to provide a starting point to help other farmers meet the benchmarks. While the ideas have been collected on small farms many of them can effectively be generalised across the industry onto larger farms. Many of these ideas may seem small and insignificant on their own, however, when they are consolidated into efficient systems significant time savings can be achieved.
Smarter Not Harder: Improving Labour Productivity in the Primary Sector Page vi
DairyNZ also secured the rights to the book “111 Ideas to Improve Milking” by Jan Fox. This well respected book provides a wide range of easy-to-implement ideas to improve the milking process and reduce time inputs. It has been reproduced on the DairyNZ website (www.dairynz.co.nz). As milking accounts for approximately 57% of time on-farm, all ideas to help speed the process are valuable. Impact of the manager on labour productivity The time sheeting exercise provided a benchmark of the absolute time for each task that could be achieved if desired. It should also be noted that labour productivity is relative measure. Perhaps the biggest influence on labour productivity is the skill of the primary decision maker. A skilled farmer will generate more output per hour of input simply through making better decisions. These individuals are also one of the most important factors determining the productivity of the team around them, through their investment in farm infrastructure, the policies they set in place, and the way they manage their people on a day-to-day basis. Capturing-On Farm Innovation Capturing on-farm innovation was achieved in the main through the “Smarter Not Harder” Innovations Competition, which provided a valuable opportunity to engage the farming community on the subject of innovation and labour productivity. The competition was run in 2006 and 2007 and the “Supreme Winner” for each year was:
2006 Charles Nimmo – Whiteboard While the white board is not a new invention, the design and way in which Charles was using it on farm was innovative. The system helps to enhance communication between staff on the farm improve job performance. The innovation was widely recognised Charles was able to use the exposure gained from the competition to help launch his whiteboard design as a commercial product.
2007 Peter West – Milking plant wash down system Peter used cow ear tags to number the steps in the plant wash down process in his farm dairy, providing a visual cue for the team to follow, catering to different people’s needs. Plenty of people have the process written on a wall but Peter took it a step further and by using the ear tags was able to effectively link the described process and to plant itself. Once again this is a very simple system.
Capturing innovation is a challenging process as people tend to look for the next “big thing”, a “widget” that will change their life. In reality innovation more often occurs in small steps and it may be a widget but equally it may be a system or process improvement. This was emphasised by the ideas for reducing time input throughout the time use study and in the entries to the competition. Each idea may seem to present only a small opportunity on its own but cumulatively the effect can be large. In order to share the ideas gained through the competition a “tips and ideas” page was set up on the DairyNZ (www.dairynz.co.nz) website allowing farmers to view all the ideas. Raising Awareness of Labour Productivity
Smarter Not Harder: Improving Labour Productivity in the Primary Sector Page vii
A number of approaches to raising awareness about people productivity have been used over the period of the project, including:
• Defining measures for use in relation to labour productivity within other DairyNZ activities, for example DairyBase, the dairy industry benchmarking tool.
• Media articles (in particular in the Dairy Exporter). • The “Smarter Not Harder Innovation Competition”. • “Smarter Not Harder” hints and tips on the DairyNZ website. • On farm audits of people productivity during discussion groups • Conference papers at both SIDE and Dairy3
Raising awareness and getting people to focus on the issue of labour productivity has been challenging throughout the duration of the project and continues to be. The primary issue is the continuing farmer focus on cows and grass, which is reinforced by the media, advisory services and other sources of information provided to them. Defined programmes such as MilkSmart are likely to help increase the focus on productivity. MilkSmart is an adaptation for the New Zealand market of “Cow Time” the Australian benchmarking tool for the milking processes. It is an important first step to increase focus on the issue of labour productivity. It has been recommended that a wider labour productivity study forms phase two of MilkSmart. Following the collation of the final report a comprehensive extension plan will be developed to capture and extend the learning from the findings of this project. This can only happen because the “Smarter Not Harder” project has built a level of awareness and body of knowledge on labour productivity within the industry, which did not previously exist. Summary The Smarter Not Harder project has provided an excellent launching pad for the topic of labour productivity in the dairy industry:
• The pilot study has tested a robust form of data collection, which allows individual businesses to benchmark their time usage on farm.
• The method can be easily adapted for other farming types, enabling other industries to build a labour productivity focus.
• The benchmarks from the time use study are available for use by other farmers, although it is acknowledged that a wider study is required to provide relevant benchmarks across all farm infrastructures and locations.
• The ideas that emerged as ways to innovate and reduce time usage across both the time use study and innovations competition provide excellent starting points for farmers to address their time usage.
• A level of awareness and body of knowledge on labour productivity has been built within the industry that did not previously exist and is contributing to programmes such as MilkSmart, which is currently under development.
The drivers that led to the initiation of this project have not changed significantly, if anything the need for a focus on labour productivity has increased. Value will continue to be extracted from the results of this project for some time to come.
Smarter Not Harder: Improving Labour Productivity in the Primary Sector Page viii
2.1. What Is Labour Productivity? .................................................................................... 1 2.2. Why is Labour Productivity Important to the Future of the New Zealand Dairy
Farmer? ...................................................................................................................... 4 2.2.1. Increasing Scale of New Zealand Dairy Farms.................................................. 4 2.2.2. Aging Dairy Farm Workforce Demographics.................................................... 6 2.2.3. Changing Labour Composition on Farms .......................................................... 6 2.2.4. Low Unemployment........................................................................................... 7 2.2.5. Changing Work Force Demographics................................................................ 8 2.2.6. Competition for People ...................................................................................... 9 2.2.7. Reduced Accessibility of Dairy Farm Ownership............................................ 11 2.2.8. Implications for People on Farms .................................................................... 11
2.3. Labour Productivity = People Performance............................................................. 12 3. Potential Labour Productivity Measures and Current Industry Benchmarks........... 13
3.2. Recommended Measures ......................................................................................... 22 3.3. Current Industry Benchmarks .................................................................................. 22
4. Time Use Study on Farm ......................................................................................... 24 4.1. Objectives................................................................................................................. 24 4.2. Method ..................................................................................................................... 24
4.3. Results ...................................................................................................................... 26 4.3.1. Case Study Farm Overview.............................................................................. 26 4.3.2. Time Use Break Down by Task ....................................................................... 36
Smarter Not Harder: Improving Labour Productivity in the Primary Sector Page ix
4.4. Discussion ................................................................................................................ 56 4.4.1. Time Use on Farm............................................................................................ 56 4.4.2. Method Development ....................................................................................... 64
4.5. Conclusion................................................................................................................ 67 5. Capturing On Farm Innovation ................................................................................ 68
6. Raising Awareness of Labour Productivity ............................................................. 72 6.1. Objectives................................................................................................................. 72 6.2. Method ..................................................................................................................... 72 6.3. Discussion ................................................................................................................ 72
6.3.1. Unclear value of labour productivity................ Error! Bookmark not defined. 6.3.2. Focus of the farming media.............................................................................. 73 6.3.3. Advisory service competencies ........................................................................ 73 6.3.4. Commercialisation............................................................................................ 73 6.3.5. Importance of packages.................................................................................... 74
8.1. Appendix 1: Initial Data Collection Form ............................................................... 78 8.2. Appendix 2: Example Time Sheet ........................................................................... 89 8.3. Appendix 3: Task Groupings ................................................................................... 90 8.4. Appendix 4: Farmer Diary ....................................................................................... 96 8.5. Appendix 5: Benchmarking Tool............................................................................. 98
Smarter Not Harder: Improving Labour Productivity in the Primary Sector Page 1
1. Introduction This document is the final report for the project titled “Smarter Not Harder; Improving Labour Productivity in the Primary Sector.” The project investigated issues surrounding labour productivity in the agricultural sector, using dairy as a case study. The major work streams were:
1. Time use study on farm, 2. Capturing on farm innovation, and 3. Raising awareness of the labour productivity issue.
The project ran between 1 June 2005 and 30 June 2007 by DairyNZ Ltd and was jointly funded by the former dairy industry-good agency, Dairy InSight (66%) and the Sustainable Farming Fund (33%). The Human Capability in Agriculture and Horticulture Working Group and Meat and Wool New Zealand provided support to DairyNZ in their funding application. Meat and Wool New Zealand aim to use the learning from the dairy industry case study to apply to their own sector.
2. Background
2.1. What Is Labour Productivity? Labour productivity is a partial productivity measure often used as a proxy for measuring productivity at the national or aggregate level. It can be used at the level of an economy, industry or individual company. It is defined as unit of output per unit of labour input. At a national level it is calculated as:
Labour Productivity = Gross Domestic Product Total Hours Worked
(output) (input)
However, this calculation over simplifies labour productivity, which is more complex due to the interactions of:
• Physical Capital • Natural Resources • Technological knowledge • Human Capital
In farming, an example of physical capital is the investment in the latest machinery which allows greater apparent labour productivity, without the potential of the worker changing. Natural resources, such as the quality of land or frequency of rainfall, also affect outputs without worker input. Technological knowledge contributes the latest know how, for example the way in which feeds are mixed to balance the animal’s ration. Human capital is the ability of the person to effectively combine all these factors to maximise output. Nettle (2002) described labour productivity as incredibly difficult to measure as it was essentially the error when all the other factors of productivity had been accounted for.
Smarter Not Harder: Improving Labour Productivity in the Primary Sector Page 2
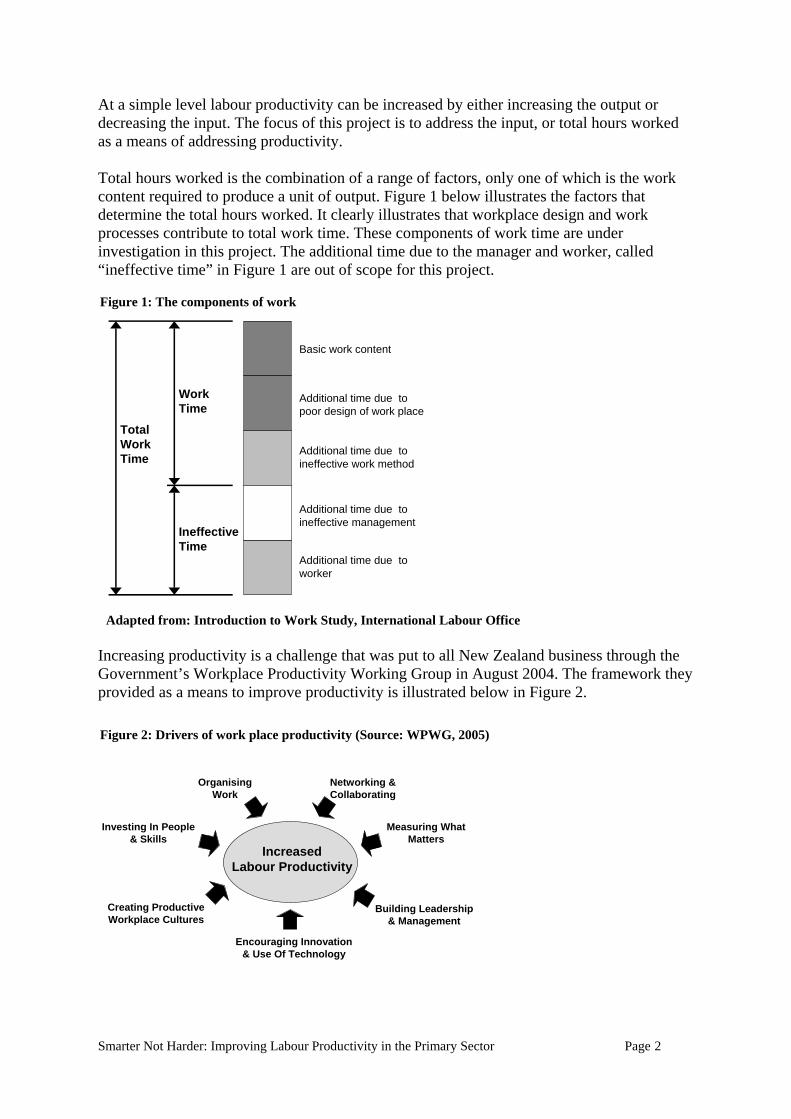
At a simple level labour productivity can be increased by either increasing the output or decreasing the input. The focus of this project is to address the input, or total hours worked as a means of addressing productivity. Total hours worked is the combination of a range of factors, only one of which is the work content required to produce a unit of output. Figure 1 below illustrates the factors that determine the total hours worked. It clearly illustrates that workplace design and work processes contribute to total work time. These components of work time are under investigation in this project. The additional time due to the manager and worker, called “ineffective time” in Figure 1 are out of scope for this project.
Increasing productivity is a challenge that was put to all New Zealand business through the Government’s Workplace Productivity Working Group in August 2004. The framework they provided as a means to improve productivity is illustrated below in Figure 2.
Additional time due to poor design of work place
Ineffective Time
Work Time
Total Work Time
Basic work content
Additional time due to ineffective work method
Additional time due to ineffective management
Additional time due to worker
Increased Labour Productivity
Building Leadership & Management
Measuring What Matters
Networking & Collaborating
Organising Work
Investing In People & Skills
Encouraging Innovation & Use Of Technology
Creating Productive Workplace Cultures
Figure 1: The components of work
Adapted from: Introduction to Work Study, International Labour Office
Figure 2: Drivers of work place productivity (Source: WPWG, 2005)
Smarter Not Harder: Improving Labour Productivity in the Primary Sector Page 3
This framework has been mapped across the components of work in Figure 1 in Table 1 below. Table 1: Relationship between productivity drivers and components of work Component of Work Productivity Driver
Basic work content • Measuring what matters
• Investing in people and skills
Additional time due to poor design of work place
• Measuring what matters
• Organising work
• Innovation and use of technology
• Networking and collaborating Work Time
Additional time due to ineffective work method
• Measuring what matters
• Organising work
• Investing in people and skills
• Innovation and use of technology
• Networking and collaborating
Additional time due to ineffective management
• Building leadership and management
• Measuring what matters
• Creating productive workplace cultures
• Investing in people and skill
• Networking and collaborating Ineffective Time
Additional time due to worker
• Creating productive workplace cultures
• Organising work
• Investing in people and skill
The clear message from Table 1 is that labour productivity is not the product of single inputs, but the result of an integrated system within the workplace where people play a critical role. Research has been completed in the on-farm agricultural sector looking at what is termed the ineffective component of work. It has been shown that this component of work time is strongly related to the relationship between the employer and employee, which is found to be highly transactional rather than relational (Gardner & McLeish, 2008). This means employers are less likely to invest in their employees and the employees are less likely to be fully engaged in the role. Initiatives such as the HR Toolkit and the Agriculture ITO’s
Smarter Not Harder: Improving Labour Productivity in the Primary Sector Page 4
Certificate in Rural Staff Management focus on improving management and therefore discretionary effort from the employee. The focus of this project is on the work time component, as described in the Table 1 above. In many industries this is well understood and documented using classic work study methodologies such as time and motion studies, allowing the employer to optimise the work environment to improve work time productivity drivers. There is no such data available on “work time” on-farm in the New Zealand agricultural sector. This information is needed to better understand the problem and design appropriate interventions.
2.2. Why is Labour Productivity Important to the Future of the New Zealand Dairy Farmer?
The project was initiated in response to an expected decline in the availability of people to staff the nation’s dairy farms. This expectation is the result of a number of demographic and societal trends that have emerged within New Zealand’s workforce over the past 20 years. These trends include:
• Increasing scale of New Zealand dairy farms • An aging farm workforce • Increases in paid labour and a reduction of family labour on dairy farms • Low unemployment • A reduced labour force • Increased competition for people • Reduced accessibility of dairy farm ownership
Each of these trends is discussed below and the case made that improvement in labour productivity, specifically the input of time, is fundamental to improvement in overall dairy industry productivity.
2.2.1. Increasing Scale of New Zealand Dairy Farms Over the last two decades there has been a marked growth in the scale of New Zealand dairy farms. The increase in scale has resulted from an increase in cow numbers combined with a diminishing number of herds. Over the period 1974 to 2007 there has been a 39% reduction in the number of herds to 11,346, and a 213% increase in herd size to 351 cows. (see Figure 3 below). Much of the increase in farm scale has been achieved without a significant shift in the total number of people employed in the industry. Technology has allowed the average farming family to greatly expand the number of cows they milk with a similar number of staff. Over the last two decades the number of cows milked per full time equivalent has staff member (FTE) increased from 75 to approximately 120. It has remained fairly static at this level over the last five to seven years and FTEs per farm have increased to deal with the additional number of cows. This coincided with the average herd size reaching approximately 240 cows, suggesting this is the upper limit for the average farming family before they employ additional people to assist in operations.
Smarter Not Harder: Improving Labour Productivity in the Primary Sector Page 5
Figure 3: Trend in the number of herds and average herd size for the 1976-2006 season (LIC Dairy Statistic, 2005-06. http://www.lic.co.nz)
Figure 4: Trend in the number of full time equivalent staff members employed on
farm relative to average herd size - 1985 to 2005 (Dexcel Profit Watch Data, 2005)
Figure 4 illustrates that farmers have historically been working “smarter and not harder” with the help of technology. The challenge for DairyNZ is to see this continue and to unlock what has become a fixed relationship in cows per FTE.
Smarter Not Harder: Improving Labour Productivity in the Primary Sector Page 6
2.2.2. Aging Dairy Farm Workforce Demographics Like the rest of the country’s population, the dairy workforce is aging, as illustrated in Figure 5 below. The age group 45 years and older is showing a definite increase as a percentage of the total workforce as is the age group 15 to 19 years. This is likely to reflect owners stepping back from milking the cows and supplementing their operational labour with young people. Perhaps the greatest concern to the industry is the significant decline since 1991 in people aged 25 to 35 years. The reason for this decline is unclear but likely to be a combination of fewer young people staying in the industry as their employment choices increase, and people choosing to exit the industry as they find their opportunities for career progression become limited. The industry must address this trend. There are two key approaches available; one to redesign work to suit the older demographic, or two, to redesign the workplace to be more attractive to a new segment of the workforce, so that more “young” people are attracted to the industry. Figure 5: Age distribution, dairy farmers/dairy farm workers - 1991, 1996, 2001, and
2006. (source: www.maf.govt.co.nz)
2.2.3. Changing Labour Composition on Farms The total labour requirement in dairy farming has remained at a relatively stable level over the past ten years (Dexcel Profit Watch Data, 2005), however, the composition of the people doing the work has changed significantly. Figure 6 illustrates that the total unpaid labour (owner-operator and family) employed on farm has steadily decreased by an overall 25% since 1997 from around 20,000 to 15,000 FTE, while at the same time paid labour has increased dramatically from 8,000 to over 15,000 FTE, an increase of more than 87%. At the farm level, the total number FTE per farm has increased 26% from 1.87 to 2.35 FTE (see Figure 4) over the nine years to 2005. This increase has followed the trend toward larger
Smarter Not Harder: Improving Labour Productivity in the Primary Sector Page 7
farm units, which have increased in area by 45% over the same period. The slower rate of increase (26% compared to 45%) indicates that efficiencies in the use of people’s time are being gained. During this period family labour per farm has reduced 12% from 1.33 to 1.17 FTE. Paid labour on the other hand has risen from 0.54 FTE to 1.18 FTE, a 118% increase. Figure 6: Labour force on dairy farms and trends for family and paid labour
contribution for the industry (Dexcel ProfitWatch, 2004/05).
The growing demand for paid labour is predicted to increase at a steady rate due to influences such as an aging farm owner population wanting to step back from milking, increasing herd size and an increase in multiple herd ownership. This is problematic in that the availability of people to work on farms has been tightening over the last decade and the reputation of the industry for the way it treats its workers is such that people are discouraged from entering (UMR, 2007). The tightening supply of people available to work on farm challenges the industry to maintain existing workloads across fewer people, or redesign the role to be more attractive to people, encouraging them to come and work on farm. In both cases this will mean working smarter not harder. The alternative “silver bullet” scenario is that people are replaced by technology, enabling farmers to replace labour. Technology may form part of the answer, however, this scenario ignores the opportunity to increase time use efficiency through refining existing processes and practices.
2.2.4. Low Unemployment The number of people wanting to work on-farm is low. New Zealand is currently experiencing record low unemployment rates which are forecast to continue (Figure 7). At the time of writing unemployment is close to an all time low at 3.6% and workforce participation close to an all time high at 68%. This means there are fewer people actively looking for work resulting in intense competition for good staff and increasing labour costs.
Smarter Not Harder: Improving Labour Productivity in the Primary Sector Page 8
Figure 7: New Zealand labour force participation and unemployment figures for the period 1986 through 2008 (Statistics NZ; www.stats.govt.nz, 2009)
2.2.5. Changing Work Force Demographics Labour force and population projections from Statistics New Zealand indicate that the demographics of the future workforce will also change (Tables 2 & 3). The available workforce is expected to age and there will be a marked increase in non-European ethnic groups. Over the next 15 years any significant growth in the work force is expected to be in the 45 years + age groups. It will therefore be important to identify how workplace design can be changed to attract potential workers in the future. For example, some of the physical work that is a feature of the dairy system will need to be engineered out of daily work to allow an older workforce to participate. Table 2: Projected Labour Force (x1000) in New Zealand (Neild, 2006) Age Grouping (years) 15-24 25-44 45-64 65+ Total 2006 372 941 784 61 2,157 2011 386 915 887 74 2,262 2016 386 910 946 90 2,331 2021 381 921 971 102 2,376 2026 378 945 952 118 2,392 The increase in ethnicity will challenge farmers to manage a more diverse work force. There is a significant opportunity to increase time use efficiency through people management
Smarter Not Harder: Improving Labour Productivity in the Primary Sector Page 9
practices that lead to greater staff engagement. The changing ethnicity will require employers and managers to be more aware of the needs of other cultures to achieve this aim. Table 3: New Zealand population projections for 2016 (Neild, 2006)
Population Projections (000 people) Age Group 2006 2016 0-14 yrs 878 22% 842 19%15-39 yrs 1,433 35% 1,430 32%40-64 yrs 1,304 31% 1,486 33%65+ yrs 511 12% 690 16%Total 4,126 4,448 Ethnicity European 3,074 73% 3,218 63%Maori 586 14% 716 17%Pacific Island 262 6.2% 376 8%Asian 272 6.5% 573 12%
2.2.6. Competition for People Results from a study completed by UMR Research on behalf of DairyNZ in December 2007 show that the public image of work on dairy farms is one of being boring, repetitive with long hours and poor pay, few days off, a lack of mentally stimulating work and a job that requires little technical knowledge. Clearly this is not an industry that will attract people in a tight labour market! The attractiveness and competitiveness of a job when unemployment is low is important, simply because people have a choice as to where they work. Essentially every employee has to be lured from another workplace – competitiveness counts, and current perceptions of the industry are not helping in this regard. For example, long hours and little time off are often quoted as deterrents to people entering or remaining in the industry (UMR, 2007). To judge the competitiveness of the industry three simple indicators have been investigated:
1. Hours worked 2. Rostered time off 3. Wages
2.2.6.1. Hours of Work Department of Labour figures show that in the year to June 2006, people classified as full-time workers, worked the hours detailed in Table 4. Equivalent figures for the dairy industry are difficult to determine, as hours worked in the industry are poorly quantified, with little meaningful data collected or published. However, one survey indicated 64% of the people employed on dairy farms worked more than 50 hours per week (Tipples et al., 2004). This compares poorly to the general work force where 83% of full time staff work less than 50 hours per week. If employees are to be attracted to the industry dairy farming must look at ways to become more competitive. Developing work practices that reduce the hours of work, yet achieve the same business outcomes has to be a high priority for the dairy industry.
Smarter Not Harder: Improving Labour Productivity in the Primary Sector Page 10
Table 4: Hours worked by full time workers across all industries (Department of Labour, June 2006)
Hours Worked Per Week Percentage of Full Time Workers
(>35 hrs/wk) Less than 40 hours 44% Exactly 40 hours 26% 41 to 49 hours 13% 50 hours or more 17%
2.2.6.2. Time off Time off is another employment condition identified as important. A survey of employers (Table 5) showed that 40% of employees on dairy farms are given three or more days off per fortnight while 15% are given just two to three days per month. Most other industries offer two days off every week, sometimes on rosters. Clearly, time off is an employment condition where the dairy industry is not competing favourably at present. Table 5: Time off provided by farmers (Dairy InSight Publication, Employment
Health Assessment, 2005). Time off provided Percentage of farmers 3 or more days off per fortnight 40% 2 days off per fortnight 30% 2 days every third weeks 15% 2 to 3 days per month 15% 2.2.6.3. Wages Wages paid in the dairy industry have become more competitive over the last decade and the average dairy farm wage is now on par with the national average wage, once non-cash items are accounted for. However, because the dairy farm worker is typically working 2,600 hours (50 hrs/wk for 52 wks) compared to the “average worker” at 2,080 hours (40 hrs/wk for 52 wks) hourly rates are 25% below the national average. This reflects a number of factors, such as:
• The age and stage of the current workforce, which is dominated by younger workers who are typically paid less,
• The attitude of the industry toward staff, who tend to be seen as a cost rather than an investment.
If the industry is to attract the type of people it needs, this basic level of competitiveness must be addressed. Working “smarter not harder” to achieve the same outputs from less time is one way of redressing the balance. Cutting 25% of hours out of the annual dairy calendar for an employee will achieve this outcome. The question is – “can it be done?”
Smarter Not Harder: Improving Labour Productivity in the Primary Sector Page 11
2.2.7. Reduced Accessibility of Dairy Farm Ownership Perhaps the most commonly offered reason to join and stay in the dairy industry is the opportunity to own your own farm and work for yourself. The trade off for this preferred future has always been some sacrifice early in your career; long hours and hard work for minimal wages in order to get started on the ladder. This has certainly acted as an effective incentive in the past, however, the structure of the industry has changed and this “promise” has become less realistic. Dairy industry proponents suggest that life has changed little, it was always hard to attain ownership and it still is. But what has changed is that in the last 30 years the industry has increased the number of employees by a factor of three to approximately 15,000 and at the same time decreased the number of farms available for ownership by 40% to 11,500. Alternative structures have emerged, such as equity partnerships that allow people to own part of a farm. However, this seems to be a different value from the notion of outright ownership. The rights and wrongs of this debate are a dinner time favourite among dairy farmers, but one truth remains, farm ownership is relevant to a much smaller proportion of people in today’s dairy farm workforce. People are asking for a good job today, not the promise of something that may or may not eventuate in the future. Therefore addressing the terms and conditions of the job, to be more competitive is important for attracting staff in the future. This means the industry will have to learn to do more with fewer hours in the day.
2.2.8. Implications for People on Farms The current employment situation is not exclusive to the agricultural sector and is affecting New Zealand as a whole. There appears to be little light at the end of the tunnel; although the current economic climate is expected to result in a short term increase in unemployment, the long term forecast is for sustained labour constraints in the agri-sector. Historical figures and labour forecasts suggest that to maintain a profitable, sustainable and competitive business farm owners will have to address the trade-off outlined below:
• Maintain current operations by doing more of the work themselves, or • Redesign work tasks and terms and conditions to be more attractive and competitive,
ensuring that farmers can recruit the calibre of staff required.
Both these options benefit the employer and the employee, allowing time inputs to be reduced without compromising output, and should be a critical part of the response to the challenges outlined earlier. They will require finding ways of working smarter so that the physical aspects and existing time constraints that dictate the shape of the job can be overcome to broaden the demographic of the potential work force available to work in the industry. This requires a fundamental shift in the way the industry frames jobs on dairy farms. The current thought pattern accepts that the job of dairy farming has a defined shape, look and feel. As an industry we promote that paradigm and recruit people to come and work within those confines. The alternative frame is that as an industry we redesign the job to be more
Smarter Not Harder: Improving Labour Productivity in the Primary Sector Page 12
appealing to a wider part of the working population, as illustrated in Figure 8. This is likely to be the best long term strategy. Figure 8: Current and potential industry framing of dairy farm jobs
The first steps to identifying what can be done to improve labour productivity are to measure current performance and define targets. Employers must be able to answer questions such as:
• Where do people spend their time in my business? How do the majority of farmers divide their time into certain tasks and is my business on par with the majority?
• Is the business and workplace set up to optimise staff input? Is the infrastructure of the farm adequate and efficient?
• How could I deploy staff and get the same results? Is the management of the staff adequate?
• What processes could I improve to reduce time requirements? In order to answer these questions we need to examine the nature of the work and the influence of factors such as farm infrastructure, farming process, staff training and skills as well as mechanisation. Above all, this has to be done in a sustainable manner as workers ultimately have a wide range of choices as to where they work. Understanding how to work smarter and not harder will mean a reduction in the long and physically demanding hours typical of this industry. By working smarter we may also decrease risk of workplace injury, another major issue in dairy farming. If all this can be achieved without sacrificing productivity, New Zealand dairy farmers will establish a sustainable competitive advantage relative to the rest of the world as well as enhancing the appeal of the industry to potential farm workers.
2.3. Labour Productivity = People Performance Labour productivity has evoked negative connotations within the industry that need to be addressed. Industry participants have wrongly perceived that a drive to increase productivity could be mistaken as a push to work people on farms harder than they already work. Given the industry already has a reputation for long hours, this perception must be avoided. This concern is likely to be the result of previous attempts to describe productivity in the industry based on full time equivalents (FTE) working on farm. In this case, the number of hours a FTE worked was not considered. Therefore a worker could spend more hours at work to increase productivity.
Working Population Working Population
Current Industry Frame Required Frame?
Smarter Not Harder: Improving Labour Productivity in the Primary Sector Page 13
To avoid this confusion DairyNZ has coined the phrase “People Performance” to use when discussing labour productivity issues.
3. Potential Labour Productivity Measures and Current Industry Benchmarks
The first step in managing performance is to measure it. As discussed earlier, labour productivity can be a complex measure, and one of the aims of this project was to suggest a number of measures that can be used to benchmark and monitor progress towards improving labour productivity. A range of possible measures were investigated, with historical trends and current benchmarks supplied. Recommendations for future measures are made.
3.1. Potential Measures A study into the economic indicators suitable for measuring labour productivity was commissioned from the DairyNZ Economics Group. A number of possibilities were identified:
1. Average number of cows per full time equivalent (FTE5) 2. Labour cost per kilogram of milksolids 3. Average milksolids produced per person 4. Average number of cows milked per person milking per hour of milking 5. Staff turnover 6. Wages 7. Animal indicators
3.1.1. Cows / FTE Cows/FTE is not technically an output/input measure it is therefore not strictly an economic productivity measure. Nonetheless, its benefits include the following:
• It is relatively easy to measure, • Historical performance is documented, • It is independent of herd size (and therefore does not need additional scaling to allow
benchmarking), • It has a high correlation with labour-related costs and is therefore an indirect measure
of cost efficiency. The current industry position is illustrated in Figure 9 below. In the seven year period up to the end of 2005 average Cows/FTE remained static at around 120 cows per person. At the standard FTE allocation of 2,400 hours per FTE equates to 20 hours per cow.
5 An FTE has been set with a nominal value of 2,400 hours per 12 month period. This equates to an average of 46 hours per week.
Smarter Not Harder: Improving Labour Productivity in the Primary Sector Page 14
Figure 9: Cows / FTE for the NZ dairy industry - 1985 to 2005 (Dexcel Profit Watch,
2005)
The emergence of larger farms has been suggested to increase the labour efficiency in the dairy system. However, Figure 10 below shows this is not the case, with a very low correlation evident between farm size (peak cows milked) and Cows/FTE. This figure shows that economies of scale have not been achieved with respect to people on-farm. Figure 10: Cows / FTEvs peak cows milked for the NZ dairy industry - 2005/06
(Dexcel Profit Watch, 2005)
The Cow/FTE metric has the potential to drive the wrong behaviour. Using FTE as a part of the equation often results in confusion between FTE and head count, i.e. one person is considered to be one FTE. As described previously an FTE is defined as 2,400 hours of work. This is an assumption made due to a lack of robust information on hours worked. At an industry level this assumption may not lead to significant distortion, however, at the level of the individual farm there is significant impact.
Smarter Not Harder: Improving Labour Productivity in the Primary Sector Page 15
Reported working hours by individual farmers and farm workers (a head count of one) range from 2,000 hours per year up to and beyond 3,000 hours per year, yet all consider themselves to be a FTE. This variation illustrates the intrinsic flaw in asking farmers for FTE estimates. For the same production levels, of for example 50,000 kgMS, the productivity of the farmer working 3,000 hours/year is 16.7 kgMS/hour worked and 25 kgMS/hr for the person working 2,000 hours a year. This difference of 50% represents a significant difference in time use efficiency. Assuming the individual adequately values their time, the additional 1,000 hours could be used for other activity. As a result of the confusion, farmers may try to improve this metric by asking their team (FTE) to work longer hours, a move that may well lower the total productivity of the business. Given the definition of 2,400 hours as an FTE, the measure could be rearranged to focus on hours per cow. Historic progress, based on the assumption one FTE is equivalent to 2,400 hours, is illustrated in Figure 11 below. Figure 11: Hours / Cow for the NZ dairy industry – 1985 to 2005 (Dexcel ProfitWatch,
2005)
Using hours worked in the equation, rather than FTE provides a more robust measure that is less confusing to farmers. The focus becomes hours worked and to try and improve the metric employers and managers will be forced to focus on reducing hours. This will help them to work smarter not harder and drive competitiveness.
3.1.2. Labour Cost / Kilogram of Milksolids This measure is one of input cost rather than productivity. It is an adjusted measure that includes an allowance for unpaid labour contributed by the farming family. Figure 12 below, indicates that labour and production have remained well correlated over time, with a slight trend downwards leading up to 2005. As was demonstrated above Cows/FTE has remained static over the last decade, so therefore this decrease is due to a continued increase in milksolids per cow and per hectare, rather than any increase in people efficiencies.
Smarter Not Harder: Improving Labour Productivity in the Primary Sector Page 16
This is a troublesome measure in many ways for an industry that has a questionable record with people management. In many respects it sends the wrong messages to farmers, that people are a cost to be minimised, rather than an investment from which a return can be generated. Trying to optimise costs at, for example, $1/kgMS needs to be examined in the context of the entire people system on the farm. Figure 12: Labour cost per kilogram of milksolids, including unpaid labour
adjustment, for the NZ dairy industry – 1985 to 2005 (Dexcel Profit Watch, 2005)
3.1.3. Milksolids / FTE This measure meets the technical requirement for a productivity measure. It has similar benefits to those outlined above and is highly correlated with Cows/FTE. The two measures are linked in that Milksolids/FTE is the product of Cows/FTE and Milksolids/Cow and can therefore be increased by increasing either or both of these. Therefore, at the farm level, it may not matter which of Cows/FTE or Milksolids/FTE is used although Milksolids/Cow is impacted by more factors than labour alone. Historically, Milksolids/FTE (see Figure 13 below) has increased steadily as per cow production has risen. This is due to a range of factors, including but not limited to labour productivity. Given that it is unfair to attribute all (or even most) of the milksolids increase per cow to increased labour productivity, Cows/FTE appears to be a better national measure than Milksolids/FTE.
Smarter Not Harder: Improving Labour Productivity in the Primary Sector Page 17
Figure 13: Milksolids / FTE for the NZ dairy industry - 1985 to 2005 (Dexcel Profit
Watch, 2005)
As discussed with respect to Cows/FTE a key assumption made above is that one FTE is equal to 2,400 hours of work over the year, not one person. To reduce this confusion kgMS/hour worked is a better measure of productivity than Milksolids/FTE, as it is more directly focussed on the time input. Figure 14 below illustrates that kgMS/hour worked has steadily increased, although once again this is largely due to increases of per cow production. Figure 14: Milksolids / hour worked for the NZ dairy industry - 1985 to 2005 (Dexcel
Profit Watch, 2005)
Smarter Not Harder: Improving Labour Productivity in the Primary Sector Page 18
3.1.4. Cows Milked / FTE / Hour Approximately 50% of People’s time on farm is associated with milk harvesting operations. It is therefore prudent to look at a measure that is focussed on this aspect of time use as small gains here can be relatively significant. While no national data set is available to calculate this measure, a sample of data from a small Canterbury exercise carried out by Dexcel Consulting Officers in 2002 is available and shown below in Figure 15. This measure provides benefit for both the employer and employee, although the balance will be determined by how the employer chooses to capitalise on productivity improvements in this area. Figure 15: Cows milked / person / hour from a sample of Canterbury Farms in 2002
Results show a significant variation in outcomes depending on farm size. Reasons for this are likely to relate to the age and type of farm dairy, level of automation and choices as to the number of people participating in milking. This suggests that benchmarks for the measure need to be clustered to be specific to the size of farm, herd and farm dairy.
3.1.5. Staff Turnover Staff turnover, or the inverse, staff retention rates are commonly used by organisations as an indicator of labour productivity. Satisfied employees are likely to devote higher levels of discretionary effort at work, resulting in higher levels productivity. When staff turnover is high, it follows that productivity is likely to be low. Within the context of individual New Zealand dairy farms, it is more common for measures of tenure to be used, for example “years of service”. Turnover is an umbrella metric that is the outcome of a wide range of workplace conditions and employment practices, including:
• Leadership and management skill of the employer • Terms and conditions of employment • Training provided
Smarter Not Harder: Improving Labour Productivity in the Primary Sector Page 19
• Farm infrastructure • The fitness for purpose of existing plant and equipment • Policy framework • Systems and processes • State of the labour market and availability of alternative employment
These factors form what DairyNZ refers to as the “work environment”, where the organisation has a strategic investment focus to improve the quality of the working environment. Gardner and McLeish (2008) scoped the impact of employment practice on farm productivity and concluded that the major factor affecting labour productivity is retention of staff on farm. The authors found no hard assessment of the cost and benefits returned during an employment agreement; however a lifecycle analysis can be used to describe this as illustrated in Figure 16 below. Areas of investment (A.1) and risk (A.4) are described as:
• Looking for, advertising and assessing prospective employees (A.1); • Going through the formal recruitment phase (including interviews, negotiations,
down time before staff are available) (A.1); • Preparing the farm for the new recruit (including accommodation, reworking team
members responsibilities) (A.1); • Induction onto farm (including preparing the facilities for the new employee) (A.1); • New employee training and the establishment phase of getting the employee settled
into the team environment (A.2); • Production risk / actual cost in removing / losing existing staff (A.4).
Figure 16: Employment lifecycle
EmploymentInvestment begins(A)
(B)Induction TrainingShows results
(D)Employment ends
Employee decidesTo leave
(C)
Recruitment Total Employment Period
Productivity return to coverEmployment Investment
Period of Effective Employment
A.1
A.2
A.4
EmploymentInvestment begins(A)
(B)Induction TrainingShows results
(D)Employment ends
Employee decidesTo leave
(C)
Recruitment Total Employment Period
Productivity return to coverEmployment Investment
Period of Effective Employment
A.1
A.2
A.4
Smarter Not Harder: Improving Labour Productivity in the Primary Sector Page 20
Of concern is the current high level of turnover of farm staff in the dairy industry, suggesting that many farm workers do not spend long enough on-farm to gain the skills required to become productive. Anecdotally, one third of staff move out of the industry every year and turnover, or length of service, is on average less than one year, with 50% of employees having been in their current position for one year or less. Figure 17 demonstrates the greater occurrence of staff turnover in dairy farming compared with industry in general. In addition to tenure-type measures, which are lag indicators, lead indicators are also required. Lead indicators can relate to staff satisfaction levels as well as intentions to remain on a particular farm or within the dairying industry. Minimal data has been reported on such measures.
Figure 17: Staff turnover in the dairy industry vs. all industries (Statistics NZ, 2008)
3.1.6. Wages It can be argued that relative pay rates of people in the agricultural industry reflect productivity. Figure 18 demonstrates that wages have been rising steadily over time. Figure 18: Average wage for a farm worker in New Zealand 1988 to 2006
Smarter Not Harder: Improving Labour Productivity in the Primary Sector Page 21
However, compared to industry in general, wages reported to Inland Revenue for dairy farming are 34% lower on average (Figure 19). Wages in the dairy sector are comparable with other parts of the agricultural industry and have risen at a marginally higher rate over the last seven years (Figure 19). In their national wage survey, Federated Farmers report the average dairy wage, including non-cash benefits, is now on par with the national average wage at approximately $44,000. However, when this is calculated on an hourly rate, dairy wages are still approximately 40% below the national average hourly rate. Figure 19: Quarterly earnings of NZ dairy farm workers compared to general
agricultural workers and all industry from September 1999 to September 2006 (Statistics NZ, LEED Database, 2008)
Assuming that rising labour productivity is reflected in rising wages, the gap between wages in the dairy industry and other industry would be expected to narrow over time.
3.1.7. Animal Indicators A wide range of animal indicators are postulated to act as indicators of labour productivity. It is argued that highly productive labour is more likely to be attentive to animal needs and proactive in preventing disease and ensuring good animal performance. Possible indicators may include:
• Incidence of lameness • Incidence of clinical mastitis • Empty rates
Currently, there is no data is available to corroborate this argument.
Smarter Not Harder: Improving Labour Productivity in the Primary Sector Page 22
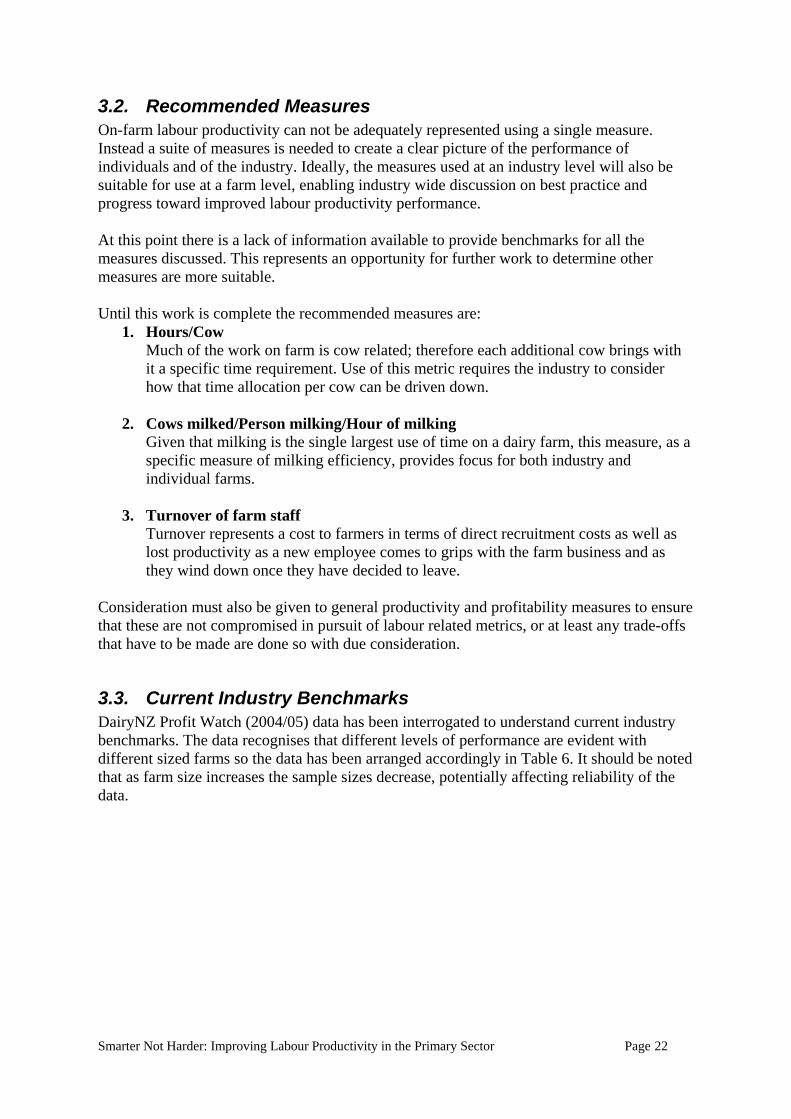
3.2. Recommended Measures On-farm labour productivity can not be adequately represented using a single measure. Instead a suite of measures is needed to create a clear picture of the performance of individuals and of the industry. Ideally, the measures used at an industry level will also be suitable for use at a farm level, enabling industry wide discussion on best practice and progress toward improved labour productivity performance. At this point there is a lack of information available to provide benchmarks for all the measures discussed. This represents an opportunity for further work to determine other measures are more suitable. Until this work is complete the recommended measures are:
1. Hours/Cow Much of the work on farm is cow related; therefore each additional cow brings with it a specific time requirement. Use of this metric requires the industry to consider how that time allocation per cow can be driven down.
2. Cows milked/Person milking/Hour of milking
Given that milking is the single largest use of time on a dairy farm, this measure, as a specific measure of milking efficiency, provides focus for both industry and individual farms.
3. Turnover of farm staff Turnover represents a cost to farmers in terms of direct recruitment costs as well as lost productivity as a new employee comes to grips with the farm business and as they wind down once they have decided to leave.
Consideration must also be given to general productivity and profitability measures to ensure that these are not compromised in pursuit of labour related metrics, or at least any trade-offs that have to be made are done so with due consideration.
3.3. Current Industry Benchmarks DairyNZ Profit Watch (2004/05) data has been interrogated to understand current industry benchmarks. The data recognises that different levels of performance are evident with different sized farms so the data has been arranged accordingly in Table 6. It should be noted that as farm size increases the sample sizes decrease, potentially affecting reliability of the data.
Smarter Not Harder: Improving Labour Productivity in the Primary Sector Page 23
Table 6: 2004/05 dairy industry benchmarks for labour productivity Farm Description Indicative Ranges*
Peak Cows Milked
Effective Area (Ha)
Milksolids (kg)
Full Time Equivalent
Labour Cows/
FTE Hours/
Cow Ha/ FTE kgMS/ FTE kgMS/ Hr $/kgMS
Top 25% 126 28 50 41,079 17 1.27 152 61 50,127 1.5 Average 106 25 42 34,485 14 1.07
Source: 2004/05 DairyNZ Profit Watch Data *NOTE: The analysis is based on quartile analysis to demonstrate the range of performance. There is no adjustment for profitability.
These averages are derived from a small number of data sets and therefore will be less robust than the data for the smaller herd sizes which have a larger number of farms contributing to the benchmark data.
Smarter Not Harder: Improving Labour Productivity in the Primary Sector Page 24
4. Time Use Study on Farm The changing nature of dairy farming and the work force available to staff dairy farms presents challenges to farm managers to redesign work to be more time efficient. The challenges and implications are outlined in Section 2.2. The first step in being able to reengineer the workplace is to understand how time is used in the business of farming. The majority of farm businesses do not even keep time sheets telling them how long they worked, let alone details of how they allocated time between tasks. This part of the “Smarter Not Harder Project” set out to develop a practical method for gathering such data and to establish a baseline of information for further investigation.
4.1. Objectives The objectives of the time use study were: • To develop and test a method for collecting information on farmer time allocation • To use this as a method for measuring labour productivity • To obtain information on the labour input on a sample of dairy farms in the Taranaki and
Waikato regions.
4.2. Method Dairying was used as a case study, to determine a work-study methodology that has application across all sectors of the New Zealand agriculture industry. Development of the methodology included the following steps:
• Review of existing work-study method used on dairy farms in other countries, • Development and testing of work-study method, • Pilot of work-study method on large scale.
4.2.1. Review of existing work-study method A large scale work-study has been completed in Ireland and other smaller scale studies have been completed in Demark and Australia. Interviews of the project leaders were used to understand the best approach to the study, the problems they encountered and how they solved them. This has been incorporated into the method outlined below
4.2.2. Work-study method Objectives of the method development included:
• To understand the time devoted to tasks carried out on-farm on a daily basis, • To identify the range of times taken for each task and investigate why these
differences occur, • To understand distribution of time spent working through the day and throughout the
year, • To benchmark the number of hours and FTE actually worked.
The process followed with the case study farmers is outlined below:
Smarter Not Harder: Improving Labour Productivity in the Primary Sector Page 25
• An initial data collection sheet was used to profile each farm’s resources (see
Appendix 1). This information was later used to interpret the data recorded on timesheets.
• Farmers completed a timesheet on a daily basis to log time against tasks. A paper based time sheeting approach was chosen for data collection due to its simplicity. (see Appendix 2) Tasks were recorded according to a predefined set of definitions, which grouped tasks under 25 categories. (see Appendix 3)
• The timesheet was augmented by a farmer diary (see Appendix 4) where participants recorded unusual events that may have led to time use patterns that were out of the ordinary. Once again this information was used to interpret the data recorded.
• DairyNZ entered the data from the timesheets into an Access database for future interrogation. The data was entered fortnightly and the farms were examined for variation.
• Where significant variation existed, the initial data collection sheets were interrogated and the farmers were interviewed by the regional coordinator to understand the reasons for the differences. The regional coordinators were employed to carry out a liaison role and to encourage farmer cooperation throughout the exercise.
4.2.2.1. Test of work-study method Following initial development, the method was tested on a small scale with four local dairy farms. The farmers were asked to provide feedback on the ease of recording data and the task groupings, noting anything that was missing. The trial was carried out over a two week period and based on this feedback the method was reviewed and minor changes were made. 4.2.2.2. Large scale pilot of work-study method The revised method was piloted with a wider group of 20 farmers. This pilot phase was the main data collection period for the study, from February 2006 to January 2007. 4.2.2.3. Selection of the group The group of pilot farmers was selected to reduce variation in the results due to factors other than workplace design and work method. Measuring inefficiencies in work due to individual motivation or poor management were considered to be outside the scope of the project and ability of the method. The following criteria were used:
• Farm size of approximately 200 cows. A uniform size enabled comparison of differences due to labour productivity rather than differences in scale.
• Owner operators. It was assumed that owner operators were likely to have a greater level of interest in the performance of the farm, and therefore more uniform levels of motivation.
• Land resource with similar potential. This enabled the study to focus on time input for various tasks without the distraction of production output.
• Demonstration of good documentation skills, which would be required for record keeping during the study.
• Located in Waikato or Taranaki to give some geographic spread and increase credibility with industry.
Smarter Not Harder: Improving Labour Productivity in the Primary Sector Page 26
4.3. Results This section presents the findings from the data collected in the pilot of the data collection method. The collection process was initiated on 20, however farm drop-out and gaps in data resulted in the study concluding with nine sets of useable data. The reasons for this and possible solutions will be discussed later in this section. The results are presented as an overview in the first instance followed by detailed breakdown of tasks on farm.
4.3.1. Case Study Farm Overview Farms that provided complete data sets are summarised in Table 7 below: Table 7: Farm summary table
kgMS/ha 1174 1171 966 1160 1255 939 1041 1121 636kgMS/cow 312 388 301 396 439 312.4 324 357 277Shed Type H H H R R H H H HNo of Bales 20 17 28 28 20 22 20 16Contour F F F F F F F F RSystem 4 3 2 4 4 2 1 4 1Milking Frequency TAD TAD TAD/
OAD TAD TAD TAD TAD/OAD TAD OAD
Key: R Rotary H Herringbone F Flat R Rolling System 1 All grass self contained System 2 Feed imported to system is either dry cow grazing or supplement fed to dry
cows System 3 Feed imported to extend lactation (typically autumn) & fed to dry cows
(includes dry cow grazing) System 4 Feed imported and used at both end of lactation and for dry cows (includes dry
cow grazing) System 5 Feed imported and fed out all year, supplement is usually greater than 35% of
total feed (includes dry cow grazing) TAD Twice-a-day milking OAD Once-a-day milking TAD/OAD Twice-a-day milking before Christmas and once-a-day following
Smarter Not Harder: Improving Labour Productivity in the Primary Sector Page 27
Total Time On average the participant group of farmers required 3,170 hours to operate their farm, across all staff members, during the 12 month data collection period (March 2006 to February 2007). This ranged from 2,075 hours for Farm 8 through to 4,776 hours for Farm 5. This is a difference of 2,701 hours or 130 %. Figure 20: Total work hours per farm for 12months (Feb 06-Jan 07)
Total time is plotted against total milksolids production in Figure 21. The presumption may be that those farmers spending more time on the farm are getting better results. Figure 21 suggests this is not the case. Production indices will be investigated in more detail later in this section. Figure 21: Total work hours compared to production per farm
Smarter Not Harder: Improving Labour Productivity in the Primary Sector Page 28
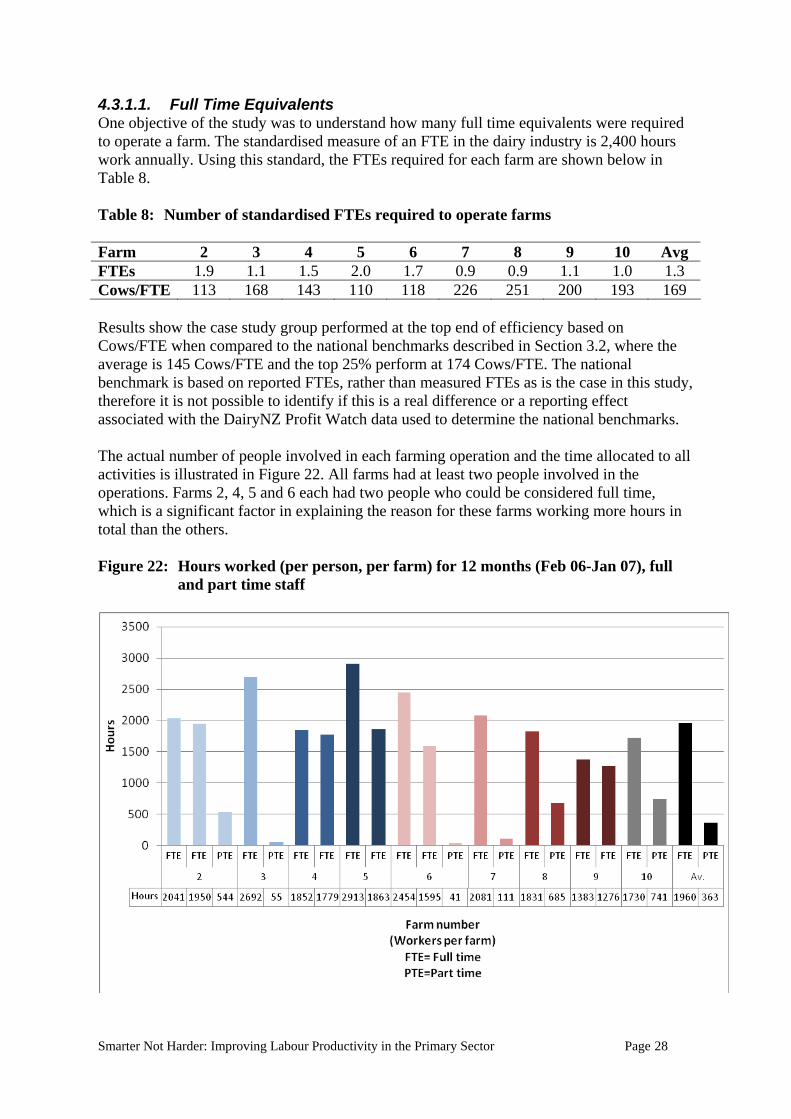
4.3.1.1. Full Time Equivalents One objective of the study was to understand how many full time equivalents were required to operate a farm. The standardised measure of an FTE in the dairy industry is 2,400 hours work annually. Using this standard, the FTEs required for each farm are shown below in Table 8. Table 8: Number of standardised FTEs required to operate farms Farm 2 3 4 5 6 7 8 9 10 Avg FTEs 1.9 1.1 1.5 2.0 1.7 0.9 0.9 1.1 1.0 1.3 Cows/FTE 113 168 143 110 118 226 251 200 193 169 Results show the case study group performed at the top end of efficiency based on Cows/FTE when compared to the national benchmarks described in Section 3.2, where the average is 145 Cows/FTE and the top 25% perform at 174 Cows/FTE. The national benchmark is based on reported FTEs, rather than measured FTEs as is the case in this study, therefore it is not possible to identify if this is a real difference or a reporting effect associated with the DairyNZ Profit Watch data used to determine the national benchmarks. The actual number of people involved in each farming operation and the time allocated to all activities is illustrated in Figure 22. All farms had at least two people involved in the operations. Farms 2, 4, 5 and 6 each had two people who could be considered full time, which is a significant factor in explaining the reason for these farms working more hours in total than the others. Figure 22: Hours worked (per person, per farm) for 12 months (Feb 06-Jan 07), full
and part time staff
Smarter Not Harder: Improving Labour Productivity in the Primary Sector Page 29
On average, full time workers in the study worked a total of 1,960 hours in a 12 month period. The maximum total hours worked for a full time equivalent in this study was 2,913 hours (Farm 5) and the minimum 1,276 hours (Farm 9). This is a difference of 1,637 hours or 128%. Both farms have a total of 220 cows, therefore scale can be eliminated as a reason for the significant difference in working hours. Figure 22 also demonstrates the difficulty with estimating FTEs. Table 9 shows the “standardised” number of FTEs (total hours / 2,400 hrs/FTE) compared with the way total FTEs are estimated based on Figure 22. Table 9: Number of standardised FTEs compared to observed FTEs Farm 2 3 4 5 6 7 8 9 10 Standardised FTEs 1.9 1.1 1.5 2.0 1.7 0.9 0.9 1.1 1.0 Observed FTEs 2.25 1.1 2 1.75 2 1.1 1.4 2 1.3 Farm 9 provides the most extreme example of variation, where standardised FTEs are significantly lower than those the farmer estimates. From the farmers’ point-of-view they consider both people are working full time jobs and therefore estimate FTE requirements for the farm at two FTEs. This grossly overstates the actual input of labour on the farm, which on a standardised basis is only 1.1 FTEs. This example illustrates the importance of measuring time input rather than using estimates at a farm level. 4.3.1.2. Hours per Week Hours per week is one of the areas where the dairy industry is considered to be uncompetitive compared to other work places. Figure 23 shows hours per week and per farm in total, and per FTE. Hours worked/week averages 62 hours per farm and ranges from 41 hours/week for Farm 8 through to 92 hours/week for Farm 5. This is a difference of 51 hours/week or 126%. Hours per FTE on the other hand, range between 40 and 50 hours per week for all farms. This is far more competitive than might have been thought, with “long hours” being one of the common reasons for leaving jobs in the industry. However, the case study farms are a small sub-sample from the industry. They are owner operators on well established farms and it would be incorrect to generalise this finding across all farm operations.
Smarter Not Harder: Improving Labour Productivity in the Primary Sector Page 30
Figure 23: Average time worked per week in total and per FTE for 12months (Feb 06-
Jan 07)
4.3.1.3. Seasonality of Work Hours per week, on average across the year, is shown in Figure 23 to be 48 hours per FTE. However, there is a component of seasonality that is not taken into account in this analysis as dairy farming work is unevenly distributed through the year. Figure 24 illustrates how workload varies by season, peaking in October at 95 hours/week in total or 71 hours/week/ FTE. Figure 24: Average hours worked by farmers per week, per month, (Feb 06-Feb 07)
Smarter Not Harder: Improving Labour Productivity in the Primary Sector Page 31
The maximum and minimum hours vary in a similar way to the average, meaning the variance is evenly distributed. There is significant difference between the average weekly working hours, the maximum and the minimum. In October for example, the maximum hours worked were 143 and the minimum 55 per week. This is a difference of 88 hours worked per week, or a 159%. 4.3.1.4. Hours Worked per Cow Hours worked/Cow has been suggested as a measure of over all labour productivity. As illustrated in Figure 25 the participant group worked, on average, 15 hours per cow for the 12 month period. The range of results extended from 9 hours for Farm 8 through to 22 hours for Farm 5, a difference of 12 hours or 135%. Figure 25: Hours worked per cow
The national average in 2004/05 (Dexcel Profit Watch 2005) was 18 hours/cow with the top 25% only working 14 hours/cow. Once again the case study group is operating at the upper end of national performance scale. It could be reasonably assumed that hours invested per cow might register in production indices. Figure 26 however, suggests that hours worked per cow has only a weak relationship with either per cow or per hectare production.
Smarter Not Harder: Improving Labour Productivity in the Primary Sector Page 32
Figure 26: Total hours per cow compared to milksolid production indicies
4.3.1.5. Hours Worked per Hectare The two major drivers of production are farm area and number of cows milked. Results show that hours worked per cow do not seem to be highly correlated to total hours and neither does hours per hectare. On average the participant group worked 47 hours/ha for the 12 month period, ranging from 31 hours for Farm 8 through to 78 hours for Farm 2, a difference of 48 hours or 156%. Once again the variability exhibits a similar pattern to total hours worked, suggesting that farm area is not a major determinant of total hours worked. Figure 27: Hours worked per hectare of land
Smarter Not Harder: Improving Labour Productivity in the Primary Sector Page 33
Hours worked per hectare did not reflect in production per hectare either. Figure 28 illustrates that MS/ha and hours/ha vary independently of each other. Figure 28: Hours worked per hectare vs kilograms of milksolids produced per hectare
4.3.1.6. Kilograms of Milksolids per Hour Worked Kilograms of milksolids per hour worked (kgMS/hour) provides an accurate measure of efficiency. Figure 29 shows that on average the participant farms produced 23 kgMS/hr worked for the 12 month period, ranging from 34 kgMS/hr for Farm 8 through to 15 kgMS/hr for Farm 2, a difference of 19 kgMS/hr or 127%. The farms that produced the most kgMS/hr are also those that spend less total time, less time per cow and less time per hectare on farm operations. This suggests that there is also significant opportunity to rationalise time spent on-farm without compromising productivity.
Smarter Not Harder: Improving Labour Productivity in the Primary Sector Page 34
The case study farms show mixed performance compared to 2004/05 averages estimated from Dexcel Profit Watch, which show average performance of 20 kgMS/hr for this sized property with performers in the top 25% achieving 23 kgMS/hr. The picture emerging is that no single variable is driving time input on farms. The variability that is evident suggests that there is significant opportunity to rationalise time spent on-farm without compromising productivity.
Smarter Not Harder: Improving Labour Productivity in the Primary Sector Page 35
Figure 29: Kilograms of milksolids produced per hour worked
Smarter Not Harder: Improving Labour Productivity in the Primary Sector Page 36
4.3.2. Time Use Break Down by Task The participant group recorded how their total time was divided between six major task groupings as listed below.
• Milking • Animals • Feed • Repairs and maintenance • People • Office
A breakdown of the tasks included in these groupings is described in the following section. An overview of the groupings can be found in Appendix 3. The average time use for each task is illustrated below in Figure 30, with the majority of time (57%) spent milking and over 10% of time spent on each of three further activities; animals, feeding and repairs and maintenance. Figure 30: Percentage of time devoted to each task grouping
The way in which time is proportioned for each farm is illustrated in Figure 31.
Smarter Not Harder: Improving Labour Productivity in the Primary Sector Page 37
Figure 31: Percentage of time devoted to each task grouping per farm
Although milking, for example, looks fairly similar across all farms when compared on a percentage basis, the figure hides the true extent of the differences between farms. Figure 32, illustrates the fact that there are some significant differences in the actual amount of time spent on different tasks. Farm 5 for example, spends almost three times longer on milking than does Farm 8. The variability of time devoted to each task and reasons for this will be investigated in more depth in the following section of this report. Figure 32: Time devoted to each task grouping
Smarter Not Harder: Improving Labour Productivity in the Primary Sector Page 38
Smarter Not Harder: Improving Labour Productivity in the Primary Sector Page 39
4.3.2.1. Milking On average, milking accounts for 57% of all time spent on the farm (Figure 30). It is the major consumer of time in all farming businesses and varied between using 46% and 68% of time, which in actual hours equates to between 1,050 and 2,900 per annum. To understand exactly where time was being spent, the milking task was further divided into the four sub-tasks illustrated in Figures 33 and 34:
• Herding cows to milking • Milking • Cleaning the farm dairy • Herding cows after milking
Figure 33: Time devoted to each milking-related task for a twelve month period
(Feb 06 -Jan 07)
Smarter Not Harder: Improving Labour Productivity in the Primary Sector Page 40
Figure 34: Milking: Percentage of total hours spent at each task
Results show that the time devoted to miking tasks is not related to either cow numbers or milksolids production per cow as is illustrated in Figure 35, where Farm 8 has the lowest total milking time and one of the highest per cow production figures (324 kgMS/cow). Figure 35: Total hours spent at each milking task vs number of cows and kgMS per
cow
Smarter Not Harder: Improving Labour Productivity in the Primary Sector Page 41
4.3.2.1.1. Herding cows to milking Results illustrated in Figure 36 suggest large herds do not necessarily take longer to reach the dairy than smaller herds. Farms with shorter herding times demonstrated all or some of the following features:
• Wide gateways exiting the paddock, • An absence of trees along the raceway so cows did not stop for shade or have to
walk on a muddy race resulting from shading, • Wider raceways with no restrictions to slow cows’ movement, • Cows travelled in one block and did not have to cross a road which requires them to
be held and often a second person to help across the road, • Raceways without steep crowns that force the cows into single file atop the crown, • Fewer sharp corners in the race meaning cows do not stall when changing direction, • A direct entry for the cows into the dairy, rather than a sharp turn off the race, • A solid wall close to the entry of the dairy to direct cows toward the parlour, • A collecting yard that is large enough to accommodate all cows, • A farm dairy that is centrally located within the farm boundaries, thus reducing the
average walking distances, • Use of an automatic gate latch to allow cows to walk to the dairy on their own,
reducing the person time required in herding, • In the case of Farm 10, once a day milking and therefore half the herding time, • The use of practices to reduce cow lameness, including:
o Smooth race surfaces, o Well drained raceways, o Foot baths to keep stones off the holding yard.
Figure 36: Time spent herding cows to milking vs cow numbers
Smarter Not Harder: Improving Labour Productivity in the Primary Sector Page 42
4.3.2.1.2. Milking Farms with shorter milking times (illustrated in Figure 37) demonstrated the following features: • A large farm dairy relative to the size of the herd (i.e. fewer cows per milking cluster
resulting in fewer rows), • Only one person involved in milking (the farm that spends most time milking in total has
shorter milking times, but because two people have to be in the shed total time is higher),
• An exit gate that can be opened from anywhere along the pit, • No drenching carried out in the farm dairy, • Use of automatic teat sprayers, • A remotely operated automatic backing gate so the milker did not have to get into the
cow yard, • Cow drafting operated from within the milking pit, • Smooth cow flow (resulting from factors related to shed design, milker behaviour,
milker routine and animal behaviour), • Milking once per day,
o Farm 8, milked once a day after Christmas when the cows got down to 1.0kgMS/cow,
o Farm 10 milked once a day most of the season, hence a lower proportion of milking times.
Figure 37: Total hours spent milking vs milksolids produced per cow and cow
numbers
Smarter Not Harder: Improving Labour Productivity in the Primary Sector Page 43
The two case farms that spent the most time on milking-related activities are the only farms in this study with rotary sheds, both 28 bail sheds. This result challenges the common belief that rotary sheds reduce milking time relative to herringbone sheds. The longer time to milk in rotary sheds is because to two milkers are required, one at cups-on and one at cups-off. The benefit of a rotary shed is realised with larger herds where two or more people would be required to milk. In herds of approximately 200 cows a one-person herringbone shed would be more efficient. Figure 38 isolates milking time during peak production. Over this period the time spent milking on each farm is more consistent than at other times of the year. This is reflective of the business of the period with mating underway. Figure 38: Total time spent milking per day at peak month
Smarter Not Harder: Improving Labour Productivity in the Primary Sector Page 44
Intuitively, it might be expected that farms with fewer cows per bail in the farm dairy (rows to milk) would spend less time milking. Figure 39 illustrates that the relationship between the two variables was poor. This is demonstrated by the three data points highlighted in the circle below (Figure 39), showing three farms with approximately ten rows at each milking, yet total milking times ranged from 1,030 to 2,230 hours per year. Figure 39: Effect of farm dairy size on total time spent milking over the year
4.3.2.1.3. Cleaning the farm dairy Cleaning the farm dairy must take place after each milking to maintain required hygiene and milk quality standards. The task includes washing the plant and cleaning the bail area and holding yards. The time taken to clean the dairy averaged 382 hours per year and ranged from 174 to 635 hours, a difference of 624% (Figure 40). Figure 40: Total time taken cleaning after milking vs number of bales in shed
Smarter Not Harder: Improving Labour Productivity in the Primary Sector Page 45
Those farmers who demonstrated faster cleanup times had some or all of the following systems in place: • As part of their routine they completed much of the yard clean up while the last row was
being milked, • An automated milking plant wash down system, • An automated wash down system, as simple as tipper drums through to flood washing or
a “dung buster” on the backing gate to wash down the yard as the gate is returned to starting position,
• Sprinklers or some other means of keeping the yard wet during milking, • Used the dairy for milking only once a day (Farm 10) It was noted that in the case of one farm, with a new dairy, where great care was taken to maintain its cleanliness, significant time was added to the cleanup process.
Smarter Not Harder: Improving Labour Productivity in the Primary Sector Page 46
4.3.2.1.4. Herding cows after milking In general, time spent herding cows after milking was minimal because cows walk back to the paddock on their own and are then shut in rather than having a person follow behind them (Figure 41). Significantly longer herding times resulted when 1.) A part of the herd was held back for supplementary feeding following milking and was then pushed back to the paddock, 2.) Cows had to cross a road way and were therefore held back and supervised while they crossed. Figure 41: Total time herding after milking vs cow numbers
Smarter Not Harder: Improving Labour Productivity in the Primary Sector Page 47
4.3.2.2. Animals On average work with animals accounts for 13% of all time spent on the farm (Figure 30). This category reflects the time allocated to animal work aside from time spent during milking. For example, where a cow was treated during milking it would be reflected in the milking task category. Coding included:
• Calving • Calf rearing • Animal health work • Breeding • Other
Figure 42 describes the way in which tasks were split on different farms. The time spent on animal work was dominated by calving and calf rearing (see Figure 43), tasks that are both driven by cow numbers, i.e. one cow will usually mean one calf. Despite this there was not a high correlation between number of cows and time spent on animal related activities. Replacement rates were similar across all farms and did not explain the differences either. Figure 42: Animals: Total time devoted to each animal related task vs number of cows
and kilograms of milksolids produced per cow
Time spent on animal related tasks was cross-tabulated with the number of cows and production per cow to investigate how well stock numbers explained time spent on animal tasks and whether or not increased time spent on such tasks resulted in better animal production. Cow numbers did not explain allocation of animal related tasks, with significant variance evident. Hours per cow on animal health ranged from 1 hour through to 3.2 hours. Neither did increased time spent on animal health result in better production per cow. The difference between Farms 4 and 7 illustrates this finding. Both produce similar MS/cow but Farm 7 devotes approximately half the time to animal related tasks.
Smarter Not Harder: Improving Labour Productivity in the Primary Sector Page 48
Figure 43: Animals: Percentage of total time devoted to each animal related task
The results did not highlight any obvious patterns to explain the variation in performance, with the exception of the farms where couples worked together. These farms took longer on average across all task groupings. A range of practices were suggested by case study participants as ways to manage time allocated to animal focussed tasks. These ideas are presented below. 4.3.2.2.1. Calving
• Develop a calving emergency kit and leave it in the paddock. • Walk the cows and calves through the shed to separate springers and calved cows.
4.3.2.2.2. Calf rearing
• Have well set up pens with swinging gates and water troughs to facilitate easy handling.
• Use electric pumps where possible. Quad motorbikes often have 12volt adapters allowing the pump to travel everywhere.
• Prevention is the best cure. Use antibacterials to prevent disease. • Use ramps to eliminate lifting.
4.3.2.2.3. Breeding It was generally agreed there were few time-saving short cuts in this area due to its importance in the farming system. Many of the farmers were prepared to spend more time during this period observing the cows to make sure they got it right. 4.3.2.2.4. Animal health
• Use of an in-line dispenser to eliminate the necessity for other drenching. • Have adequate stock handling facilities, for example a race and head-bail.
4.3.2.2.5. Other stock work Feedback in this category was difficult to collate or compare as the range of stock work was very different on each farm.
Smarter Not Harder: Improving Labour Productivity in the Primary Sector Page 49
4.3.2.3. Feed On average, work with feed also accounts for 13% of all time spent on the farm (Figure 30). Coding categories included the following:
Figure 44 below describes the way in which tasks were split on different farms. The time spent on feed related tasks was dominated by break feeding and supplements (see Figure 45). Figure 44: Total time devoted to each feed related task vs hectares of milking platform
Feed tasks are influenced more significantly by farm area, than cow numbers. Farm area, however, seems to be a poor explanation of time allocation for feed tasks until time spent on supplement is removed from the equation. Once supplement is removed, the results show all the farms spent approximately 200 hours per year on feed tasks. The effect of supplement feed is investigated further below.
Smarter Not Harder: Improving Labour Productivity in the Primary Sector Page 50
Figure 45: Percentage of total time devoted to each feed related task
4.3.2.3.1. Supplement The effect of supplement in extending time required in feed-related tasks was marked (Figure 46). It was expected that Farms 2, 5, 6 and 9, which identified themselves as System Four (“feed supplement at shoulders of season”) would spend more time in feeding out supplement. This was indeed the case with Farms 2 and 5 but Farm 9 in particular did not significantly increase hours. Figure 46: Total time devoted to supplementing vs. cow numbers and kilograms of
milksolids produced per cow.
Smarter Not Harder: Improving Labour Productivity in the Primary Sector Page 51
The hours required to feed supplement can be dramatically reduced by the use of in-shed feeding systems. Such systems are expensive and often require the input of relatively expensive feed through them, such as grain or pellets. The emergence of palm kernel expeller (PKE) has resolved the feed cost issue and these systems are now a viable alternative. If it were assumed the entire difference in time feeding supplement between Farm 9 and Farm 5 was due to the use of an in-shed feeding system, a total of 300 hours could be saved. At $30/hour this is a $9,000 saving in time, which can be considered a return on investment in the system. When the milksolids production relative to time input for feeding was considered, no clear pattern emerged from the study data. The investment of significant additional time in feeding did not appear to have a positive impact on milksolids production. Other ideas suggested by the case study farmers to reduce time required for feeding out included:
• Having the right machinery for the job (some farmers claimed that silage pits and wagons were more time efficient than bales).
• Having two tractors available (one for loading and one for towing the silage wagon saved time).
• A well constructed silage pit with room for parking, turning and loading. • Feeding cows at the shed on a feed pad to reduce to time carting to the cows during
the milking season. • At certain times of the year, feeding out two to three days worth of feed at a time can
be more efficient than doing the job daily.
Smarter Not Harder: Improving Labour Productivity in the Primary Sector Page 52
4.3.2.3.2. Break feeding The time allocated to break feeding was the other significant contributor to total feeding time. The variation is illustrated below in Figure 47. Farms that spent more time on this task seemed to simply carry out more break feeding, there were no discernable explanations as to how to carry out the task more quickly. Figure 47: Total time devoted to break feeding vs kilograms of milksolids produced
per cow and hectares of land
The answer to reducing time spent break feeding is to do less of it. The main influences on this were:
• Subdivision of the farm and the number of paddocks available to the manager. • Use of 24-hour grazing, which means that paddocks do not have to be divided if they
are too big for 12-hour grazing.
Smarter Not Harder: Improving Labour Productivity in the Primary Sector Page 53
4.3.2.4. Repairs and Maintenance On average, repairs and maintenance accounts for 11% of all time spent on the farm (Figure 30). Coding included the following:
• Effluent management • Weed Control • General repairs and maintenance
Figure 48 describes the way in which tasks were split on different farms, in all cases dominated by activities classified as “general repairs and maintenance” (R&M). These tasks are largely driven by farm area, with most farms devoting similar amounts of time to the task. The nature of “general” R&M means it is difficult to further break down exactly where time was spent. Figure 48: Total time devoted to each repair & maintenance task vs hectares of
milking platform
The farms that devoted less time to R&M tasks tended to be well established farms that had the farm well “under control”. Farmers noted a preference for preventative maintenance to avoid unplanned “crises”. Such crises can be disastrous during the peak work times of the season, particularly during calving. Other observations from the group included:
• Use of effective effluent pond systems (significantly reduce the amount of time required on R&M and can shift the time requirements onto contractors).
• Having a good stock of spares with a disciplined replacement policy. • An R&M kit on a carry-all or a trailer that can be hitched up and put to work
immediately. • A tidy and ordered workshop to find things quickly. • Minimal waste areas on the farm to attracted weeds and require attention. • Winter weed spraying to reduce the amount of spot spraying required.
Smarter Not Harder: Improving Labour Productivity in the Primary Sector Page 54
4.3.2.5. People On average, only 1% of all time spent on the farm is spent with people (Figure 30). Coding included the following:
• Staff • Upskilling
At an average of 28 hours per year, time spent in this area is negligible. Figure 49 illustrates the way in which tasks relating to people were split across the different farms, dominated by upskilling, or personal development. The other category, staff management, is understandably low given that these farms are largely operated by the owner with some part time assistance. The allocation of time spent on personal development seems to be driven by personal preference rather than any reason related to farm area, number of cows, or production. Neither did the stage in a person’s farming career impact uniformly. It may be expected that younger people would devote more time to upskilling, however it was some of the most established farmers who devoted the most time to this area. One possible explanation is that higher levels of attainment in previous education drive higher participation in personal development activity (unconfirmed by this study). Figure 49: Total time devoted to people related tasks
Smarter Not Harder: Improving Labour Productivity in the Primary Sector Page 55
4.3.2.6. Office work On average, 5% of all time spent on the farm is completing office work, including:
• Administration • Planning • Record keeping
Figure 50 illustrates the breakdown by farm, dominated by administration and followed by time spent planning. Figure 50: Total time devoted to each office related task
Planning, which consumes on average 36 hours/farm/year does not seem to influence efficiency (kgMS/hr) or production levels (kgMS/ha). Intuitively, more time spent planning would be expected to reflect in these indices however, the poor relationship suggests that operation of the farm becomes a matter of routine, rather than something that is re-evaluated and re-planned on an annual basis. Administration, which averages 115 hours per farm involved tasks around compliance and financial administration. Ideas as to how less time can be spent on administration include:
• Use of a computer and cashbook system for record keeping. • Minimising the number of suppliers to reduce paper work. • Setting a date to deal with all administration requirements in one sitting, where
possible.
Smarter Not Harder: Improving Labour Productivity in the Primary Sector Page 56
4.4. Discussion
4.4.1. Time Use on Farm The ‘Smarter Not Harder’ project is aimed at building an understanding of how time is used on farm so that improvements in labour productivity in the primary sector can be achieved. By understanding typical patterns of time usage, establishing benchmarks and raising awareness, the project aims to encourage dairy farmers evaluate the structure of their working time and restructure their workplace to provide more time to increase productivity and/or facilitate a better work-life balance for themselves and their staff. Increasing productivity is critical to raising living standards of New Zealand dairy farmers and the nation as a whole in the long term. Creating a work environment that offers an excellent work-life balance is critical to attract potential workers into the industry more readily and to retain workers already in the industry. The data collected during the pilot study illustrated that there is considerable variation in the time that people are taking to carry out tasks on dairy farms, even on farms of similar size. The case study group was chosen for the similarities in their farm size and infrastructure, in theory, to ensure the basic work content of the job would be similar across all farms and additional time could be attributed to either work place design or work method (see Figure 51). The ineffective time was expected to be a small component of total work time, due to the manager being the primary worker in the business.
Additional time due to poor design of work place
Ineffective Time
Work Time
Total Work Time
Basic work content
Additional time due to ineffective work method
Additional time due to ineffective management
Additional time due to worker
Figure 51: The components of work
Adapted from: Introduction to Work Study, International Labour Office
Smarter Not Harder: Improving Labour Productivity in the Primary Sector Page 57
4.4.1.1. Hours of Work The Organisation of Economic Co-operation and Development (OECD) stated, according to information provided via the Statistics New Zealand quarterly labour force survey (www.stats.govt.nz), that in 2006 the average full time New Zealander was working a total of 1,826 hours over a twelve month period. This study found that on average, full time dairy farmers work a total of 1,950 hours per year, and at the upper limit work 2,913 hours a year (Figure 22). This is on average, 7%, and up to 60% more than the average New Zealander worker works in other industries across the same period of time. The hours recorded on-farm are, on average, substantially less than the 2,400 hours which is considered to be the industry norm for a FTE, contrary to the popular view of farming that long hours are the norm. The seasonality of the industry does mean certain times of the year require very long hours, with a number of people recording working in excess of 70 hours a week during busy periods. However, in this typically owner–operated business, these peak loads were balanced out by quieter periods. More surprising was the number of FTEs working less than 1,826 hours. Eight out of 15 people who were considered FTEs were recorded as working under the national average. This data highlights that for many well established, small scale farm owners there is truth in the claim that farming offers a great lifestyle. This is unlikely to be the norm across the industry, with many staff reporting hours well in excess of 2,400 per year. Hours of work are a key area of competitiveness when it comes to attracting staff. The data does demonstrate significant variation in the time taken to carrying out similar tasks on comparable farms, highlighting the opportunity to redesign operations and therefore reduce the hours worked to improve this aspect of competitiveness. 4.4.1.2. Components of Work The design of the case study aimed to identify ways to reduce time use on-farm, to allow re-allocation of time to other tasks or to improve work-life balance. The areas or components of work, where it was expected efficiencies could be gained (Figure 51) were:
• Design of the workplace • Design of work process • Worker attitude / motivation
4.4.1.2.1. Workplace design Opportunities to gain efficiencies in the area of workplace design were numerous. For example, the practice that clearly increased time spent on farm tasks was the involvement of two people, usually the farm owners, in the day-to-day operation of the farm. In two cases, inefficiencies were driven by the design of the rotary farm dairy, which required two people to be involved in milking. Rotary farm dairies can be designed to enable just one person to cope with the milking task, therefore allowing any other people to direct their time toward other tasks. A redesign of these workplaces could optimise the dairy for milking with only one person and significantly reduce time requirements, by up to 20%. Other examples where workplace design has significant potential to reduce time spent on tasks include:
• Width of farm races and race surfaces (impacting on walking speeds),
Smarter Not Harder: Improving Labour Productivity in the Primary Sector Page 58
• The level of subdivision (impacting the amount of break feeding required), • Use of in-dairy feeding systems (to reduce time required feeding out).
4.4.1.2.2. Design of work process Potential efficiencies to be gained through design of the work process were hard to isolate with the methodology used. A more rigorous time in motion study would be required to identify differences in work process; however the potential to reduce time through process is significant and does exist. This is best illustrated in the milking area. There were a number of similar farm sized farm dairies with similar sized herd that still varied significantly in time required for milking. Part of the reason for variance will be related to workplace (farm dairy) design, but process is also a significant contributor. For example leaving the dairy to move the cows into the bail area frightens cows and adds time to milking. This particular example illustrates the close linkage between workplace design and work process. The chosen production system, which can be considered as part of work process design, also seemed to have a minor impact on time use. Supplement feeding in particular, was an area where time inputs increased for higher input feeding systems. The additional time invested in this activity did not appear to be adequately repaid in terms of additional overall productivity. The impact of feeding regimes on time must be considered when farmers and advisors are completing cost-benefit analysis on such systems. Other opportunities are likely to exist through work process in the way that jobs are designed. Take for example, a farm that milks 20 rows of cows. The job could be designed so that one person does job, or so that two people share the job between them. Where one person does the whole job they are likely to lose attention and take longer, where as two people sharing the job are likely to perform the task in less total time. This can offset workplace design to some extent. The size of farms in this case study means this remains supposition, but highlights the opportunity to transfer the approach to farm of other sizes. 4.4.1.2.3. Worker attitude / motivation The case study methodology does not allow for analysis of attitude and motivation, in the design it had been assumed to be reasonably uniform. This may be true but personal choice has definitely affected the time inputs on some farms. As highlighted earlier, the choice to have two people involved in the operation, when it can clearly be managed by one person, is costly in terms of time and overall time efficiency. From a simple time usage point of view, there is a clear opportunity to reduce time input through more efficient division of labour. In a fact based analysis of these two-people operations, they are performing poorly on labour productivity scores. However, the social dynamic is impossible to take into account and these couples have chosen to work together for their own reasons and are likely to gain intangible benefits from the partnership, which may include motivation through working in a team, or a better attitude toward work because working together provides much needed human contact during the day. 4.4.1.3. Approaches to Reducing Time During the study there were a number of plausible suggestions elicited from participants as to how time inputs could be reduced. These can be loosely classified into:
Smarter Not Harder: Improving Labour Productivity in the Primary Sector Page 59
• Eliminating the task • Reducing time required • Shifting the timing of the labour requirement to even out demand
The classic example of eliminating a task was the elimination of teat washing in the New Zealand industry, which saved a lot of time during milking. Such opportunities do not seem to exist as an industry, but undoubtedly will on an individual farm basis. Contracting out certain tasks is another way of achieving this, as contractors usually bring a level of expertise or technology that means the job is completed more quickly. Yet another alternative is to substitute labour with capital, such as investment in automated milking technology. The work study method used provides opportunity to develop a focus on reduction of time inputs on-farm. Adopting a continuous improvement philosophy to work methods and work processes will allow businesses to identify time saving opportunities, although this can be a complex exercise. More simply, writing down systems and training staff in those systems is likely to provide immediate results and save time. Transferring time is difficult to achieve in a seasonal biological system where things have to happen without delay, however simple opportunities do exist. Investment spent training the team on farm processes is likely to result in time saved during busy periods. Preventative maintenance is another task that can shift time demand away from the peak periods and avert unplanned crises. 4.4.1.4. Milking as a Focal Point The milking process accounted for 57% of farmers’ total working hours across the year (Figure 30). As discussed previously, time spent milking was influenced by the number of people required to be involved in the process. In support of this finding, O’Brien et al (2006) contend that milking systems of the future should be geared toward a one person operation for the purposes of saving time. The data demonstrates that even in one person sheds there was significant variation in time spent milking, indicating opportunity to streamline the process. Inefficiencies appear to be primarily a result of poor infrastructure restricting flow of cows within the dairy or on the way to the dairy. Farm dairies that lack simple automation systems, such as motorised backing gates, appear to be the least efficient operations. The level of variation in milking time suggests it is an area where efficiencies can be gained and should be prioritized to identify improvements. This is emphasized by the fact that a 10% reduction in milking time will have a 5.7% reduction in total time, compared with a 10% reduction in feed time that results in only a 1.3% reduction in total time. Having identified this opportunity, DairyNZ is undertaking an adaptation of the Australian “Cow Time” programme, which is due out late in 2009, to address efficiency of the milking process. 4.4.1.5. The Manger as a Factor of Labour Productivity Perhaps the biggest influence on labour productivity is the skill of the primary decision maker. A skilled farmer will generate more output per hour of time input simply through making better and faster decisions. These individuals are also one of the most important factors determining the productivity of the team around them, through their investment in
Smarter Not Harder: Improving Labour Productivity in the Primary Sector Page 60
farm infrastructure, the policies they set in place, and the way they manage their people on a day-to-day basis. As the employment environment determines the amount of discretionary effort an employee will contribute to the business, the first and most important thing farmers can do to maximise productivity and profitability is to make sure that they, as individuals, are not the limiting factor. They need to stay up-to-date with the latest in farm and people management practices and continue to seek out new and innovative ways of operating the farm. This could mean getting involved in discussion groups, talking with peers, talking with people outside the industry, enrolling in training or hiring the expertise of a farm manager or advisor. 4.4.1.6. Valuing People’s Time Labour has an economic cost that farmers often choose to ignore and this study provides the opportunity to quantify that cost. To employ the people required to run the farms in this study, all of similar size, would have an economic cost of approximately $60,000 per year. For each farm we can approximate an hourly rate based on known hours and the known cost of employing a manager to do the job. The results are shown in the Table 10 below. Table 10: Effective hourly rate for labour input based on $60,000 as commercial
As is expected, based on the hours-worked variation between farms, hourly rates range between $12.56/hr and $28.92/hr. At the upper end, this is in line with the rate a mid level professional will be earning6, however at the lower end it could be argued that labour is under-rewarded as the current minimum wage is $12.50/hr so the second person contributing to the hours could earn more working off-farm. Obviously there is personal choice in the way people choose to structure their workforce and economic cost is only one of the factors considered in the equation. Farm economics can also be examined from a self sufficiency point-of-view. Can the farm justify the labour input? To investigate this each farm was assigned an assumed standard operating profit of $105,0007 (after interest but before labour adjustment), given that all the farms are of similar size and production. Labour was then deducted8, based on an hourly rate to investigate the effect on the bottom line. The results are summarised in Table 11. 6 Assuming a professional earns $70,000 salary and works an average of 45 hours per week for 52 weeks, the
average hourly rate equates to $29.90/hr. 7 Based on 65ha producing 1,100kgMS/ha at $5.30 /kgMS including stock income. Farm working expenses
were assumed to be 60% of gross revenue and interest 13% of gross revenue. 8 The first hours up to 2,600 (50 hrs/wk for 52 wks) have been designated a management rate of $30/hr, with
the balance assigned to an assistant at $15/hr.
Smarter Not Harder: Improving Labour Productivity in the Primary Sector Page 61
Smarter Not Harder: Improving Labour Productivity in the Primary Sector Page 62
Table 11: Effective hourly rate for labour input based on $60,000 as commercial
1Manager charged at $30/hr for all hours to 2,600 (50 hrs/week at 52 weeks) 2Additional labour charged at $15/hr for all hours above 2,600 3Assumes valuation of $3.5 million for going concern Table 11 demonstrates that if people’s time was assigned a fair economic value, many of the farms would barely be operating at breakeven point. In general people’s time (labour) seems to be undervalued in economic calculations carried out on farm. Farmers, especially owner-operators, reason that they have to do something with their time. Farm owners will also argue that capital gain is their reward. This belief is however incorrect; capital gain is the reward for the risk that they assume for investing in the business, while reward to management has to be considered separately. In the case studies there is a difference of $48,390 (78%) between the highest and lowest “wage bill”. This represents an opportunity cost regarding what could the people be doing with their time other than running the farm. Could other activities provide a higher return? Unfortunately, this ambivalence toward time can drive incorrect economic decisions and means that it is challenging to get farmers to focus on labour as an input to productivity. Any drive toward improved labour productivity must always consider that people do a lot of things for non-economic reasons as we are not as rational as economic theory assumes. However, personal choice should not be accepted as an excuse for low productivity either. People need to be aware of the choices and the trade-offs they are making. There is sufficient evidence in this study, through grouping even the high performing farms, that there is still significant variability in time allocation to tasks, suggesting efficiencies can be gained. 4.4.1.7. People’s Time Comes in Chunks In the dairy industry, unless you are fortunate enough to live close to a population centre, it is difficult to employ people on a casual basis and only use them as and when required. Instead people tend to be employed for large chunks of their time, predominantly full time, to cover periods of the season where workload is higher. As a result there is often minimal
Smarter Not Harder: Improving Labour Productivity in the Primary Sector Page 63
flexibility to adjust staffing levels to meet seasonal requirements. The exception to this may be the farming family where part time assistance can be obtained from family members. This lack of flexibility is likely to mean it is almost impossible to capture the entire economic benefit of reducing time inputs. This does not mean that an effort to reduce time inputs is any less important to the farming business. Optimising time input offers the people on the farm flexibility and potentially a better work-life balance. This will be an important competitive factor for the industry in the future. 4.4.1.8. Applicability of Results Across Industry The case study farmers represent a particular segment of the industry. They are small owner operated farms in established farming areas. It is therefore not appropriate to apply the results here across the entire dairy industry in terms of absolute numbers. Generalisations can be made around the factors that helped farmers to reduce time in general, for example; an appropriately sized farm dairy, well organised systems, well maintained farms, plant and machinery. This approach has merit in generating discussion within the industry about time use efficiencies, acknowledging the discussions are likely to be more valuable among farms of similar size and structure. In the case studies, farm location did not seem to influence time use, however where regional differences exist in management requirements (for example, winter crop feeding in Southland), farm location will also be important to generate relevant comparisons. 4.4.1.9. Limitations This project was not intended to provide a statistical analysis of time use on farm; it is simply a case study of a number of farms. The method used to collect information does have some inherent flaws, including;
• Self-reporting, • Motivation that often wavered, • Recording often completed a considerable time after the task was carried out thus
reliance on recollection of activity and timing during the day, • Adequate capture of the contribution of contractors to the system, • The level of labour substitution by capital investment.
More accurate targeting of participants could have helped to reduce some of these inconsistencies and provide more accurate data, however recruiting farmer participants is in itself challenging and was managed successfully in this study. Users of the information presented this study should be mindful of the effects of these limitations on data integrity.
Smarter Not Harder: Improving Labour Productivity in the Primary Sector Page 64
4.4.2. Method Development One of the objectives of this study was to develop a method for data collection for use in future work studies. Experience during this project suggested that a number of changes are needed to the existing method. The pilot data collection period indicated the method was effective; however the pilot was only trialled for a period of two weeks. Once it came to scaling the method to the full study there were deficiencies encountered, primarily around maintaining participant motivation throughout the course of the 12 month data collection period. Issues to address include:
• Frequency of data collection • Recording system • Farmer support • Farmer payback
4.4.2.1. Frequency of Data Collection It proved very difficult to maintain farmer interest in collecting data on a daily basis, evidenced by the drop out rate of farm workers. The study started with 20 farmers involved and ended with 9 useable sets of data. Those who dropped out tended to do so within the first three months, primarily because the requirement to record information daily proved too much of a burden. The study was designed as a daily collection for two main reasons: 1. Coverage.
Due of the nature of dairy farming, sporadic work events occur throughout the season. If the method only sampled work during the year it was feared that events, such as silage harvesting, could easily be missed and therefore the ability to describe a dairy season would be compromised.
2. To understand total work. Due of the seasonal nature of dairy farming, the predominance of owner operators and the tendency for employees to be engaged on a salaried basis there is little information available to describe the total hours dedicated to operating a dairy farm. Once again, if a sampling time-use method had been used it was feared this picture would be compromised as farmers workloads can vary on a day-to-day and week-to-week basis throughout the year.
The small scale pilot period failed to uncover this issue as it was only two weeks in duration. Within the nine sets of useable records, gaps in data collection appear regularly, meaning that analysis has involved some averaging. The accuracy of recording the data can also be called into question, with timesheets from individuals appearing to be remarkably similar at times. With respect to the two requirements noted above, the accuracy of both is likely to have suffered to some extent. Given the problems with maintaining accurate data collection it is suggested that moving to a periodic sampling protocol would be unlikely to substantially affect the integrity of the results. The spacing between samples and the period of each sample must be considered.
Smarter Not Harder: Improving Labour Productivity in the Primary Sector Page 65
The timing of the sampling could occur on a fixed calendar date or it may vary depending on the seasonal timing of activity. For example data collection may be set for the first week of August to capture what is happening over calving or it may be set at two weeks following the planned start of calving so that peak work load is compared. The first option provides easier administration of the project but does not account for regional variation in farming activity. Ideally, the seasonal variation should be taken into account so that accurate comparisons can be made. The duration of data sampling should also be further considered. A similar study carried out in Ireland (O’Brien, 2006) collected measurements for a three day period on a monthly basis. Three day collection periods are unlikely to be sufficient in New Zealand due to the variance in work carried out over weekends compared with week days. In this study hours per person during the week were approximately ten hours per day, dropping to five hours per day over the weekend. This pattern may be less distinct on large farms operating roster systems. However, the difference between week day and weekend hours could lead to significant inaccuracies where a three-day sampling regime was extrapolated over long periods. The ideal sampling protocol in a New Zealand context is collection of information across a seven day period. 4.4.2.2. Recording Systems The data collection method required the farmer participants to record the time they spent on various tasks on a paper-based timesheet, with data entry completed by a third party at a later date. (See Appendix 2 for an example of the data collection sheet.) This meant that the data entry was not easily portable as paper can get soiled out on the farm. Therefore, farmers often completed the timesheet at the end of each day, introducing errors in accurate recollection of time usage. Alternatives to a paper-based system should be investigated for future projects of this nature, including:
1. Dictaphone Allows voice recording of event timing. This could then be translated by the farmer to a timesheet or entered directly by a support person. Most mobile phones have a voice recording device.
2. PDA or handheld computer Allows direct data entry into database saving on double handling. The Irish experience suggests that the technical support required for this approach is significant.
3. Mobile phone Similar to a PDA or handheld computer a mobile can allow for direct data entry as people go about their daily tasks, as the phone is usually carried by the user. Given the prevalence of mobile phones in today’s society this may well be the best alternative, however technical support requirements are likely to be high.
4. GPS monitoring This potentially requires very little input from the farmer participant, increasing the likelihood that accurate collection will occur. It would allow the movements of the participants to be tracked over the farm but only provides gross data, for example, if
Smarter Not Harder: Improving Labour Productivity in the Primary Sector Page 66
the person is tracked to their dwelling this method would fail to record whether they are taking time off or doing some office work.
With a more periodic sampling of farmer activity the paper timesheet, perhaps augmented by a voice recorder, is likely to be most effective. The periodic sampling should reduce farmer fatigue sufficiently to provide accurate results. 4.4.2.3. Farmer Support The farmer support component of the method is critical. In this case we used a regional coordinator to provide the support, which included motivating and encouraging farmers to completing the forms. Even with a more automated data collection system, the support required will remain high. 4.4.2.4. Farmer Payback Persistence in data collection is likely to have been greater if there was a more direct payback available to farmers. This is difficult to address. Attempts were made to provide payback through discussion groups involving the farmer participants. During these events data collected was presented to farmers and discussed with respect to what was happening at the time. Unfortunately this did not offer enough value for a large proportion of the group, which was indicated by the difficulty in getting them to attend. 4.4.2.5. Limitations The method developed and piloted was adequate for collecting gross trends in work time between farms, and as a result could be used for benchmarking time use between farms. The inclusion of the initial data collection form also provided information related to farm infrastructure that allows us to investigate aspects of workplace design, for example the impact of the size of the farm dairy on total milking time. However, the historic nature of data input and monitoring meant that the opportunity to observe the process related reasons for differences in performance had usually passed due to the seasonal nature of dairy farming. The data collection method was not suited to detailed analysis of tasks that would lead to definition of work process and determination of recommendations. A more focussed project would need to be developed to do this, where specific issues were investigated. The fundamentals of this approach would be useful in a more detailed study but additional elements would need to be introduced. In particular the frequency of involvement in the farms would also need to be increased so that observations could be made in real time.
Smarter Not Harder: Improving Labour Productivity in the Primary Sector Page 67
4.5. Conclusion Data collected during the pilot study showed that there is considerable variation in the time that people are taking to carry out tasks on dairy farms. This variability suggests there is opportunity to further pursue a work study method to understand the differences and redesign workplaces and work processes to improve time efficiency. The data in the case studies was collected in a microcosm of the farming community and results can not be generalised across the entire industry, except to say that significant variation in time allocation to various tasks is likely to exist across all farm classes. To effectively address this issue, work study programmes would be required to gather together farms of similar sizes and structures and repeat a revised version of this study. Regional differences may also need to be addressed in some cases. The major opportunities identified in the case studies are related to redesign of the workplace to allow reallocation of people’s time. This is primarily around milking, which accounts for approximately 57% of farmer’s time. The method developed and piloted worked effectively for collecting time usage information at a gross level, and was adequate for understanding workplace design issues when combined with a level of expert analysis. It was not suited, however, to understanding work at a process level or the differences in individual motivation and attitude. Sustaining data collection for long periods of time was difficult and excluded a large proportion of the case study farmers from completing the study. To engage with a wider group of farmers, a shortened data collection period, possibly around specific activity on farm, will be beneficial. With minor changes the method could be used by a wide range of people to collect information as a benchmark for further conversation in a farm improvement setting. As such, it has value in introducing the concept of people productivity to farmers and forms a platform on which a more detailed discussion of people productivity can be structured.
Smarter Not Harder: Improving Labour Productivity in the Primary Sector Page 68
5. Capturing On Farm Innovation The second part of the “Smarter Not Harder” project was to investigate innovation on-farm. It is recognised that innovation occurred most frequently among “users” of a system or technology, rather than through a laboratory experiment or similar. Much of this innovation goes unnoticed by the wider business community as the innovators themselves often do not realise they have something unique. Where they do recognise this, the possibility of commercialising the innovation or other competitive pressures often mean that the innovation remains in confidence. In the absence of a commercial opportunity there is often no effective way of disseminating such innovation. It is likely that the dairy industry has a wealth of innovation buried on farm that could add value to other farming businesses. The difference in the dairy industry compared to other sectors is the existence of an industry good body that can take on the role of identifying and disseminating innovation. Through this project DairyNZ has taken a more active role in identifying and sharing innovation.
5.1. Objectives • Capture ideas from farmers that help them to work “smarter not harder”. • Share those ideas with other farmers. • Raise awareness of people-productivity on farms.
5.2. Method Capturing on-farm innovation was achieved in the main through the “Smarter Not Harder” Innovations Competition. The competition was operated in partnership with the Dairy Exporter, calling on farmers to contribute their innovative ideas that help them to work “smarter not harder”. The competition was divided into four categories with winners selected in each category to go forward and compete for the “supreme” award. The categories were:
Sponsorship was obtained from third parties to provide prizes for each of the categories and the supreme award, and to offset competition costs. The competition winners were invited to an awards evening where they were presented with their prizes and had the opportunity to mix with other winners, farmers and industry personnel. The competition was promoted through the Dairy Exporter, the agents of the sponsors and the DairyNZ Consulting Officers. Publicity was created around the “working smarter not harder” theme, which facilitated the introduction of the people productivity concept as well as promotion of the competition.
Smarter Not Harder: Improving Labour Productivity in the Primary Sector Page 69
5.3. Results The competition was run in the April to June time period in both 2006 and 2007, and while it was only scheduled to run once under the funding agreement, the involvement of external sponsors allowed the competition to be repeated. The “Supreme Winner” for each year was:
2006 Charles Nimmo – Whiteboard While the white board is not a new invention, the way in which Charles was using it on farm was novel. In essence he had mimicked a work planning system that may be found in any factory and returned it to its roots on a blackboard. The system helps to enhance communication between staff on the farm and help them more easily determine their own schedule. This results in improved job performance and frees Charles to make sure the right things are being done on the farm. The fact this was novel in the industry reflects a low focus on people systems in the past as a result of predominantly family-run farms and small teams. As farm size increases so does the size of the team required to operate it and the need for a system to organise people and work.
2007 Peter West – Milking plant wash down system Peter used cow ear tags to number the steps in the plant wash down process in his farm dairy, providing a visual cue for the team to follow. Plenty of people have the process written on a wall but Peter took it a step further and by using the ear tags was able to effectively link the described process and to plant itself. Once again this is a very simple system. It helps Peter to ensure that the job is done effectively using a variety of cues that will appeal to different people. Overall he has increased the likelihood of improved performance.
The competition winners were all featured in a story by the Dairy Exporter. The competition was also widely picked up by the general press, especially local newspapers in the winners’ regions. In order to share the ideas gained through the competition a “tips and ideas” page was set up on the DairyNZ website allowing farmers to view all the ideas. The tips and ideas can be found at www.dairynz.co.nz. DairyNZ was also fortunate enough to secure the rights to the book “111 Ideas to Improve Milking” by Jan Fox. This well respected book provides a wide range of easy-to-implement ideas to improve the milking process. As milking accounts for approximately 50% of time on-farm (Figure 30), all ideas to help speed the process are valuable. Extension of the “smarter not harder” message was also achieved through speaking slots at national dairy conferences, SIDE and Dairy 3. Approximately 500 farmers were involved in
Smarter Not Harder: Improving Labour Productivity in the Primary Sector Page 70
workshops looking at what people productivity means for the industry and introduced to the competition winners and ideas website. The winner in 2006, Charles Nimmo, has also used the exposure gained from the competition to launch his idea as a commercial product. This was assisted by a newspaper article that prompted a local businessman to contact Charles and help him to develop the idea. Charles has also developed and sold a number of other innovations over the last 24 months. The competition has given him the confidence to pursue these ideas. In many respects the ultimate test of a successful competition is the retention of sponsors from year-to-year. The competition has successfully retained three out of five sponsors; Fil, Waikato Milking Systems and AgITO. All have been unanimous in their support of the concept. In fact, Waikato Milking Systems has developed and marketed one of the winning innovations and the AgITO have taken another to use as a core concept in their milk harvesting courses.
5.4. Discussion Many farmers and advisers have reported that they struggle to identify innovation because they consider the things they are looking at are commonplace. This highlights that innovation is difficult to identify on-farm. However, there is anecdotal evidence to suggest that people are looking for innovation in the wrong places. The focus of the search for innovation has often been to look for the major changes to the system, the equivalent of the next rotary cowshed. Innovation can be defined as any new practice or technology that gets used in a business. Innovation may occur in the form of a management practice, business model, business structure, support process, or supply chain. The productivity framework (see Figure 7) suggests that innovation around people leadership and development is likely to have impact for a business, suggesting that dairy farmers need to concentrate more in this area, rather than on the production system alone which has traditionally held the greatest attention. Innovation can be thought of on a scale from incremental (e.g. a new time sheeting system) through to radical (e.g. the rotary cowshed). Innovation is more likely to be small and incremental than radical. And as Figure 52 suggests, incremental innovation can have just as much impact over time. In many ways it is far more important than radical innovation and has been referred to as “sustaining innovation”, simply because it keeps the business viable until such time as the less frequent, radical innovation occurs. It is also has high chances of success and low levels of uncertainty, compared to radical innovation which is often capital intensive and presents high risk for an organisation (Christensen, 2002; Hamel, 2002).
Smarter Not Harder: Improving Labour Productivity in the Primary Sector Page 71
Figure 52: Innovation can be expressed on the scale from radical to incremental
Incremental innovation can be considered to be continuous improvement, a mindset that needs to be fostered in the dairy industry through looking at all aspects of the farm system. The capability of people to lead discussion in this area needs to be enhanced across the industry, from farmer to influencer.
5.5. Conclusion The “Smarter Not Harder” competition provides a valuable opportunity to engage the farming community on the subject of innovation and people productivity. It has proved difficult to sustain due to the requirement for sponsorship, but should be run again in the future. The extension and adoption networks within the industry need to be influenced to look more widely than the production system for innovation, in particular they need to look at the people systems in the business as a source of innovation. The winners of the competition in both years have been people enabling tools rather than technological widgets.
5.6. Acknowledgements Thanks must go to the Dairy Exporter for the part they played in getting the competition off-the-ground and their on-going support, and to the sponsors who played a vital role in the success of the competition:
• FiL New Zealand • Agriculture ITO • Bosch Irrigation
• Waikato Milking Systems • Vestigo Dairy Management Systems • PETA Enterprises
Prog
ress
Time Time
Prog
ress
Radical Innovation
IncrementalInnovation
Smarter Not Harder: Improving Labour Productivity in the Primary Sector Page 72
6. Raising Awareness of Labour Productivity The third part of the “Smarter Not Harder” project was aimed at raising awareness of labour productivity, or people performance, as an issue on dairy farms.
6.1. Objectives • To use the findings of the “Smarter Not Harder” project to generate awareness and
discussion of labour productivity on-farm.
6.2. Method A number of approaches to raising awareness about people productivity have been used over the period of the project, including:
• Media articles (in particular in the Dairy Exporter). • The “Smarter Not Harder Innovation Competition”. • “Smarter Not Harder” hints and tips on the DairyNZ website. • On farm audits of people productivity during discussion groups (see Appendix 5) • Conference papers at both SIDE and Dairy3.
Following the collation of the final report a comprehensive extension plan will be developed to capture the learning and create momentum in the industry. The study on its own provides a starting point from which to launch, but due to its small scale and the small size of the case studies it is limited in generalising across the spectrum of situations encountered in the dairy industry.
6.3. Discussion Extension of the message from the “Smarter Not Harder” Project has proved to be challenging. A number of small and successful initiatives have taken place but there has been no systemic response to people performance. There are a number of factors that have been observed during the term of this project that are influencing the extent to which the key messages are dispersed. These factors include:
• Unclear value of labour productivity • Focus of the farming media • Advisory service competencies • Commercialisation • The importance of packages
6.3.1. Unclear Value of Labour Productivity It has not been until the collation of this report that we are able to place a value proposition around labour productivity. We have known that variation exists in the amount of time that people take to complete tasks on-farm, but the extent of the variation has been hidden, and it is now explicit.
Smarter Not Harder: Improving Labour Productivity in the Primary Sector Page 73
6.3.2. Focus of the Farming Media The farming media in the past have been a more sympathetic conduit of information between research and development and the farmer, enabling farmers to follow and track different studies. Farmers would often follow the progress of such projects and draw insights and conclusions (correct and incorrect) along the way. There still appears to be demand for such a media service, especially among the leading farmers who avidly seek new information. We attempted to generate a regular column on the project but failed as it was not seen as news worthy. Today the media have a far greater emphasis on putting a face to a story and finding an angle, rather than acting as an extension tool. This is not a criticism of the media, merely a reflection on their changing drivers. The project enjoyed a good relationship with the Dairy Exporter through the Innovations Competition, however there does seem to be the opportunity for a more technically focussed publication to fill a gap that many farmers miss.
6.3.3. Advisory Service Competencies There is a structural deficiency in the advisory services provided to farmers regarding people productivity issues, and people in general. It can be argued this is both a cause and a market response to the attention that farmers devote to people issues in general. Historically advisors have been recruited into the sector based on their technical proficiency in cows and grass management, the area of greatest demand from farmers. Alternatively they emerge from a farming background and generate consultancy business based their perceived ability as a farmer, which is reflected in production and to a lesser extent profit. There are virtually no advisors competent in offering advice on the farming system and the way in which it interacts with people. Pockets of advisors exist with specialities such as recruitment and selection or performance management, however the scope of this issue is much wider and requires a professional conversant in production systems, farm business, and human resource management with the ability to successfully integrate those disciplines. Advisory skills in this area must be developed to enable the industry to answer the challenges ahead. This applies to both industry good and commercial services.
6.3.4. Commercialisation Commercialisation is a valid and perhaps the most successful driver of awareness. Where an entrepreneur can commercialise a new service or technology they have a vested interest in its success. This approach has pros and cons as not every product has the purchaser’s best interests at heart. It has been pleasing to observe the commercial successes that have come out of the “Smarter Not Harder” Innovation Competition. The inaugural winner, Charles Nimmo, is now commercially producing his whiteboard for use by other farmers. Peter West’s (2007) tagging system for the milk plant has been widely adapted and used on-farm and was to be included in the Agriculture ITO’s “Licence to Milk” programme as a tool to reduce errors.
Smarter Not Harder: Improving Labour Productivity in the Primary Sector Page 74
6.3.5. Importance of Packages A New Zealand adaptation of “Cow Time”, an Australian programme aimed at helping dairy farmers to better manage milking and reduce milking times, is due to be launched. This programme, to be known as MilkSmart, is being eagerly anticipated by farmers. The level of anticipation is due to the fact that milking represents 50% to 60% of the time input on the case study farms and therefore there are significant gains to be made. The programme is also being eagerly anticipated because farmers can identify with it, they know what it is, how it relates to their business and can understand the potential value to their business. This second point is critical. A broad extension drive around labour productivity is less likely to be successful because the success factors that are found in MilkSmart are harder to define and harder for farmers to identify with. Traditional approaches to extension provide little feedback along the way to understand the impact of the message. Wrapping the message around a product or service is a powerful means to understand the impact of the message because the package will either be used by farmers or not. Both results are helpful in evaluating progress and feed decision making.
6.4. Conclusion To ensure the “Smarter Not Harder” project has longevity it is recommended that it become an extension of the “Milk Smart” programme. Milking accounts for 50% of time use on-farm, and should therefore be the first focus as small gains have a relatively large impact on total time use on farm. However, the approach used in this programme will build a strong foundation for investigation of other tasks. Mechanisms to integrate aspects of people performance into advisor training must also be investigated to help promote a more rounded view of farm performance. Traditional media and conference engagements should not be ignored as a part of the solution, but can not be relied upon as a complete solution to the problem of raising awareness.
Smarter Not Harder: Improving Labour Productivity in the Primary Sector Page 75
7. References Baumol, W.J., Blinder, A.S., Gunther, A.W., Hicks, J.R.L. (1988). Economics Principles and Policy, Australian Edition. Marrickville, New South Wales. Harcourt Brace Jovanovich Group (Australia) Pty Limited. Gardener, B., McLeish, P. (2008) Dairy Farm Labour Productivity Scoping Report. Unpublished. Introduction to work study. 3rd ed. International Labor Office, Geneva, 1992. Mankiw, N.G. (2004). Principles of Economics (3rd Ed.) Mason, Ohio. Thomson South Western. Nettle, R.A. (2002) Labour productivity, innovation and technology: economic, social and technical viewpoints and their relevance to dairy farming. A brief overview of some relevant literature. Unpublished. O’Brien, B., Gleeson, D., O’Donovan, K., Ruane, D., Kinsella, J., Mee, J.F., Boyle, L. and McNamara, J. (2006) Labour Efficiency On Farm. Retrieved from www.teagasc.ie/research/reports/dairyproduction/5193/eopr-5193.pdf New Zealand Government Department of Labour Workplace Productivity Project Team. (2005) Workplace productivity tool box. New Zealand Government Ministry of Economic Development and Treasury. (2005.) Growth Through Innovation: Economic Development Indicators. Retrieved from www.gif.med.govt.nz/aboutgif/indicators-2005
Smarter Not Harder: Improving Labour Productivity in the Primary Sector Page 76
Smarter Not Harder: Improving Labour Productivity in the Primary Sector Page 77
8. Appendix
78
8.1. Appendix 1: Initial Data Collection Form
79
Smarter Not Harder Improving People Productivity in the Dairy Sector Initial Data Collection Farm Name:
Owners:
Location:
Nearest town:
Distance to the nearest town:
Dexcel Project Coordinator
Person supplying data:
Position on Farm:
Date
Farm Area Attach a farm map if available Total Area (check rates statement if unsure)
Waste Area (tracks, races, drains & buildings)
Drystock Area (area dedicated to drystock)
Milking platform (Total Area – Waste Area – Drystock Area = Milking Platform)
Farm System - Which description below best describes the farm system? System Tick
1 All grass self contained
2 Feed imported to system is either dry cow grazing or supplement fed to dry cows
3 Feed imported to extend lactation (typically autumn) & fed to dry cows (includes dry cow grazing)
4 Feed imported and used at both end of lactation and for dry cows (includes dry cow grazing)
5 Feed imported and fed out all year, supplement is usually greater than 35% of total feed (includes dry cow grazing)
Farm Facilities Using the farm map provide sketch of building & facility layout with a description of the use of each building, eg cattle yards, haybarn or implement shed/calf rearing shed Farm Dairy Shed type Herringbone / Rotary
Number of bails
If Herringbone Swing over / Double up
High-line / low-line
If Herringbone can front gate be operated from anywhere in the pit?
Opened only / Closed only / Both
Building construction Solid wall / Open air
Yard Shape Circular / Rectangular
Width of entry to yard metres
Yard area metres2
Can all cows fit in yard? YES / NO
Backing Gate Motorised / manual
Milking Plant
Plant Manufacturer
Cleaning system
Milk Storage
Vat / Silo
Capacity litres
In place cleaning system? YES / NO
Teat spray method (Tick)
Hand held pressure sprayers
Droppers in shed
Auto teatsprayer in exit race
Exit race Width metres
Drafting facilities (YES / NO)
Yard Wash-down method (Tick) Hose
Volume flush
Tipper drums
84
Farm Subdivision Number of paddocks
Average paddock size ha
Range in paddock sizes Tick
Uniform size
Little variation
Large variation
Number of troughs per paddock (Average)
Number of gates per paddock on to race (Average)
Are there gates between all paddocks? Yes / No / Mostly Walking distances Attach Farm map if available
Position of farm dairy Central / Front / Back
Distance to furtherest paddock metres
Contour % of Farm
Flat %
Rolling %
Hill %
Steep %
% of farm at different height / altitude to the cowshed
%
Average difference in height / altitude between the cowshed and paddocks
metres
85
Raceway construction Width of race at farm dairy metres
Width of race at furtherest paddock metres
Width of race at midpoint metres
Width of gates exiting paddocks metres
Race Material Crushed rock
Pumice
Limestone
Rhyolite
Other?
Race surface score (Refer to photos) Machinery Available ITEM Make Model etc Eg Tractor 1998 Case 175, 75 Horsepower, cab, front end
loader.
86
People On Farm Number Estimated
FTEs Unpaid labour Owner operator
Spouse/partner
Children
Other
Paid employees FTE = Full Time Equivalent
Number Estimated FTEs
Full time
Part time
Relief Milkers Experience and Education of People on Farm Name Number of
Years Experience
Highest Educational
Achievement
Use Scale Below to Answer Reads material relevant to farming business
Attends Discussion Groups
Attends other relevant educational events
Use this scale to answer question above
1 2 3 4 5 6Never Infrequently Sometimes Usually Regularly As Often As
Possible
87
Use of Contractors What tasks on farm would the farmer usually use a contractor for?
Mowing silage Stock transport
Turning silage Spot spraying weeds
Rowing up silage Boom spraying
Baling silage Ploughing
Picking up silage to stack Harrowing
Stacking silage Rolling
Covering silage Empty effluent ponds
Spreading maintenance fertiliser Precision seeding, e.g. maize
Spreading N fertiliser Sowing grass seed
Fencing Calf rearing
Other… Other…
Other… Other…
Other… Other… Grazing Records Are we able to have access to daily grazing records? Yes / No Animal Health Are we able to access animal health records? Yes / No Production records Are we able to have access to daily production records? Yes / No Herd records Are we able to have access to herd records? Yes / No Financial Performance Are we able to have access to financial records for last 3 seasons? Yes / No
88
89
8.2. Appendix 2: Example Time Sheet
90
8.3. Appendix 3: Task Groupings
MILKING Task Code
Task Grouping Tasks Included
1 Herding Cows to Milking
• Bring Cows to farm dairy • Starts when you leave shed
2 Milking • Shed preparation for milking including drench & teat spray
• Milking cups on & cups off • Teat spraying • Daily drenching of cows • Treatment of animal health issues during milking,
e.g. mastitis • Herd testing • Colostrums cows
3 Cleaning Farm Dairy • Cleaning yard and bail area • Cleaning vat • Cleaning milking plant • Dealing with grades
4 Herding Cows After Milking
• Shutting cows away after milking • Checking trough • Adding minerals to trough
91
ANIMALS Task Code
Task Grouping Tasks Included
5 Calving • Assisting cows to calve • Separating cows and calves • Identification of calves • Calving beat • Drafting springer mobs etc • Vet visits to assist calving • Dealing with cows that have calving difficulty
6 Calf rearing • Set up facilities • Transport of milk to calves • Training calves to feed • Cleaning equipment • Feeding • Dehorning
7 Animal health • Non-daily drenching of cows, eg zinc, anthelmintics • Vaccination, e.g. leptospirosis • Bolus placement • Treating lameness • Magnesium dusting / spraying • Using in-line mineral dispenser • Blood tests • Dealing with sick cows • Dry cow therapy • Vet visits for non mating and non calving reasons • Record keeping
8 Breeding • Observing cows for oestrus • Tail painting / Kamars etc • Vet visits for mating • CIDR’ing • Artificial insemination • Pregnancy testing • Herd records • Sourcing and managing bulls
9 Other Stock Work • Droving stock • Loading / unloading cattle • Disposing of dead stock • Condition scoring • Weighing stock • Checking young stock at grazing
12 Break Feeding • Putting up break fences for dry or milking stock • Shifting stock between breaks
13 Supplements • Travel to & from supplement • Loading supplement • Transport to and feeding to cows • Washing down equipment • Feeding out crops grazed by cows • Harvesting supplements • Stack management
14 Cropping • Spraying out pasture • Cultivation • Planting • Spraying & other crop care • Regrassing as a result of cropping
15 Irrigation • Irrigation planning • Plant repairs and maintenance • Shifting irrigators • Irrigation resource consent related work
19 Repairs and Maintenance Preventative and actual maintenance to: • Plant • Machinery • Vehicles • Buildings • Raceways • Fences (including hedges) • Drains
PEOPLE Task Code
Task Grouping Tasks Included
20 Staff • Recruitment and selection • Organising and planning staff work schedules • Performance management • On the job - training • Staff related planning & administration • Organising relief staff • Organising contractors
21 Upskilling • Attending conferences • Attending training courses • Attending discussion groups • Reading relevant publications • Visits by farm advisor
94
OFFICE WORK Task Code
Task Grouping Tasks Included
22 Administration • Office work • Accounts • Sourcing products such as feed or grazing • Trading stock • Picking up supplies in town
23 Planning • Assessing other business opportunities • Buying new farm / business • Reviewing business performance • Planning future management
24 Record Keeping • Stock records not related to breeding or animal health
• TQM systems • Environment • Water use
RUN OFF Task Code
Task Grouping Tasks Included
25 Run-off • Any work associated with a run off including stock work on the runoff
SAT Daily Activities: Grazing Record AM: Pdk Nos: PM: Pdk Nos:
SUN Daily Activities:
J. Jago & G. Taylor - Dexcel Limited May 2007
8.5. Appendix 5: Benchmarking Tool
How’s Your Labour Productivity? Use the following worksheet to calculate labour productivity measures on your farm and then see how they look compared to other farms in the benchmarking sheet. Farm Information
Production (kgMS) A
Peak Cows Milked B
Farm Area (Ha) C
Number of People Working on Farm D Unpaid Labour
Hours/ week
No Of Weeks1
Hours / Person
Owner x = E
Other Unpaid Labour x = F
TOTAL Hours Worked by Unpaid Labour G (E+F)
TOTAL Unpaid FTEs H (G/2,4002)
Unpaid Management FTE I (H if less than 1, otherwise 1)
Other Unpaid FTEs J (H-I)
Paid Labour
Hours/ week
No Of Weeks1
Hours / Person
Manager x = K
Employee 1 x = L
Employee 2 x = M
Employee 3 x = N
Casual labour / Relief Milkers x = O
TOTAL Hours Worked by Paid Labour P (K+L+M+N+O)
TOTAL Paid FTEs Q (P/2,4002)
TOTAL FTEs R (H+Q)
TOTAL HOURS WORKED S (G+P) 1 A working year is approximately 46 weeks (52 weeks – 4 weeks leave – 2 weeks stats) 2 A Full Time Equivalent is assumed to work 2,400 hours per annum.
J. Jago & G. Taylor - Dexcel Limited May 2007
Total Cost of Labour
Wages to manager (see below) T
Unpaid Labour Adjustment U (Jx$30,000)
Wages & salaries (from accounts) V
Total Wages & Salaries W (T+U+V)
Labour Productivity Indicators
Cows / FTE (B/P)
Hours / Cow (S/B)
Ha / FTE (C/P)
Milksolids / FTE (A/P)
KgMS / Hr (A/S)
Wages: $ / kgMS (W/A)
Hours worked / Person X (S/D)
Hours / Person / Week (X/46)
Action Compare your performance to the benchmarks on the next page and answer these questions:
• How does my performance compare to average? • What does this mean for the farm team? • What action am I going to take as a result?
Calculating the Value of Wages to Management Wages to management are based on the peak number of cows milked:
Wage to Management Less than 100 cows $34,000 100 to 400 cows $34,000 + $70 per cow over 100 400 to 1,000 cows $55,000 + $50 per cow over 400 Over 1,000 cows $85,000
This adjustment is based on the manager working 2,400 hours per year. Where hours worked are greater than 2,400, the hours over and above 2,400 are calculated at $12.50/hour, which is equivalent to an annualised salary of $30,000. Other unpaid family labour is also valued at $12.50/hour. (Number of FTEs x annualised salary of $30,000)
J. Jago & G. Taylor - Dexcel Limited May 2007
Labour Productivity Benchmarks for a Range of Farm Sizes
Farm Description Indicative Ranges*
Peak Cows Milked
Effective Area (Ha)
Milksolids (kg)
Full Time Equivalent
Labour Cows/
FTE Hours/
Cow Ha/ FTE kgMS/ FTE kgMS/ Hr $/kgMS
Top 25% 126 28 50 41,079 17 1.27 152 61 50,127 1.5 Average 106 25 42 34,485 14 1.07
Source: 2004/05 Dexcel Profit Watch Data *NOTE: The analysis is based on quartile analysis to demonstrate the range of performance. There is no adjustment for profitability.
These averages are derived from a small number of data sets and therefore will be less robust than the data for the smaller herd sizes which have a larger number of farms contributing to produce the benchmark data