14
©2011 Pacific Gas and Electric Company. All rights reserved. SmartMeter TM Steering Committee Update – July 2012
| Date post: | 31-Dec-2015 |
| Category: |
Documents |
| Upload: | brooke-bender |
| View: | 63 times |
| Download: | 3 times |

©2011 Pacific Gas and Electric Company. All rights reserved.
SmartMeterTM
Steering Committee Update – July 2012

2Steering Committee July 2012 Report
Agenda
► Monthly Updates
► Release Status Update
► Deployment Status Update
► Schedule Update
► Deployment Update
► Budget Status – Expenditures by Workstream
► Budget Status – Benefits
► Issues / Risks Summary
► Program Metrics
► Appendix
► Project Deployment Plan Progress
► Contingency Reconciliation
► SmartMeterTM Acronyms

3Steering Committee July 2012 Report
Release Status Update
Challenges Actions/Status
EAC Funded Budget ITD Scope Schedule Resources Issues Risks
IT Releases: June 30, 2012
Release 1
Release 2
Release 3
Overall
▪ IT has executed against the SmartMeter plan. HAN enablement and Peak Time Rebate roadmaps are in progress.
Overall
▪ Development for all in-scope functionality completed as of 3/30/12▪ Project stabilization work complete for all components except MV90 and NEMs.▪ HAN enablement in implementation▪ Peak Time Rebate roadmap awaiting Commission approval.
4Steering Committee July 2012 Report
Deployment Status Update
Actions/StatusChallenges
EAC 2012 Forecast
(2012 EOY / CPI)
Scope Schedule Resources Issues Risks
Deployment: June 30, 2012
Endpoints (2012 YTD)
Gas Network (2012 YTD)
Electric Network (2012 YTD)
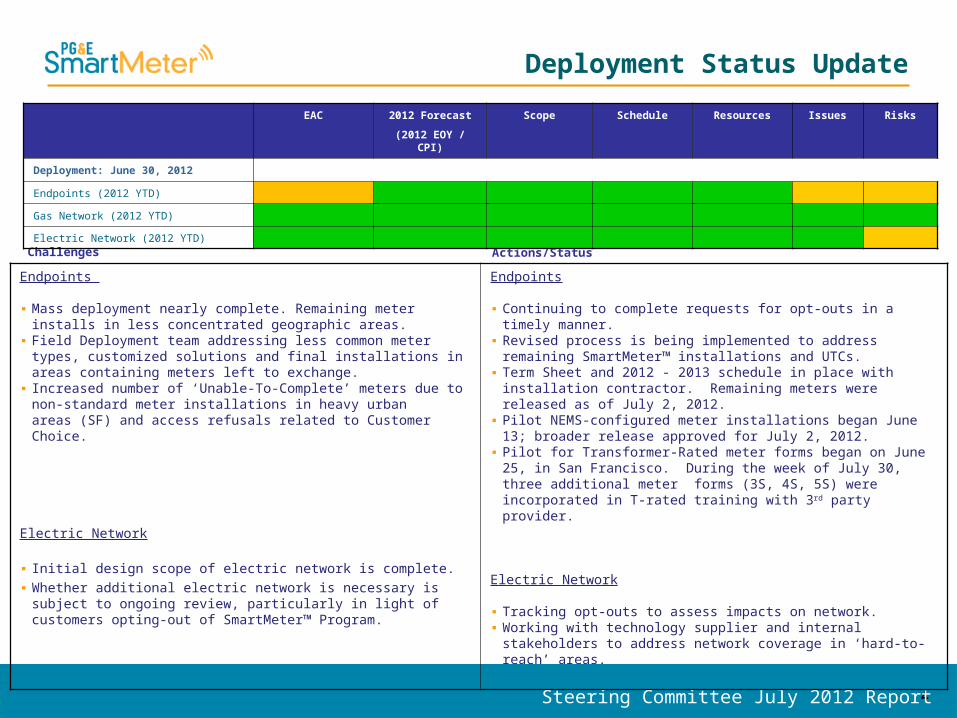
Endpoints
▪ Mass deployment nearly complete. Remaining meter installs in less concentrated geographic areas.
▪ Field Deployment team addressing less common meter types, customized solutions and final installations in areas containing meters left to exchange.
▪ Increased number of ‘Unable-To-Complete’ meters due to non-standard meter installations in heavy urban areas (SF) and access refusals related to Customer Choice.
Electric Network
▪ Initial design scope of electric network is complete.▪ Whether additional electric network is necessary is subject to ongoing
review, particularly in light of customers opting-out of SmartMeter™ Program.
Endpoints
▪ Continuing to complete requests for opt-outs in a timely manner. ▪ Revised process is being implemented to address remaining
SmartMeter™ installations and UTCs. ▪ Term Sheet and 2012 - 2013 schedule in place with installation contractor.
Remaining meters were released as of July 2, 2012. ▪ Pilot NEMS-configured meter installations began June 13; broader release
approved for July 2, 2012.▪ Pilot for Transformer-Rated meter forms began on June 25, in San
Francisco. During the week of July 30, three additional meter forms (3S, 4S, 5S) were incorporated in T-rated training with 3rd party provider.
Electric Network
▪ Tracking opt-outs to assess impacts on network. ▪ Working with technology supplier and internal stakeholders to address
network coverage in ‘hard-to-reach’ areas.

5Steering Committee July 2012 Report
Legend
Schedule Update
Benefits
Field Delivery
Approved Milestone (delay)
Meter Reading Reductions (ITD)
Forecasted Milestone (delay)Milestone MetBaseline Milestone
Forecasted Milestone (early) Milestone TBD
IT Release Deployment
SM Operations Center
2013
608 Positions Captured
MarJan Feb JulJunMayApr Aug Sep
All in-scope functionality completed
NovOct Dec2012
Jan
Begin NEMS pilot
Begin SmartMeter Opt-Out Program
Feb Mar
9.0M Meters/Modules in service
Begin NEMS deployment
Begin Transformer Rated Pilot
Release additional work per 2012 – 2013 Deployment Plan

6Steering Committee July 2012 Report
Deployment UpdateAs of June 30, 2012

7Steering Committee July 2012 Report
2012 Budget Status – Expenditures by Workstream
* Annual budgets revised with intent to complete project in 2013.* Annual budgets revised with intent to complete project in 2013.
Year-to-Date Variance Explanations:
Favorable YTD capital variance ($19.5M) primarily due to fewer meter/module installations (#3), fewer electric meter purchases (#4), and delayed timing of initial HAN roll-out (#5).Favorable YTD expense variance ($4.6M) primarily due to lower spending than planned in Business Operations/PMO (#7), Customer (#10) and IT (#13).
# Work Stream Budget Actual Variance Budget Actual Variance #
A. Capital (000s)
1 BUSINESS OPERATIONS (PMO) $56 $87 ($31) $860 $733 $127 $1,053 $50,035 1
2 SM OPERATIONS $0 $0 $0 $0 $0 $0 $0 $11,310 2
3 SM FIELD DELIVERY $5,376 $1,950 $3,426 $30,454 $22,624 $7,830 $31,018 $423,974 3
4 SM SOLUTIONS $3,562 ($2,038) $5,600 $10,316 $234 $10,082 $18,727 $973,312 4
5 IT $120 $138 ($18) $6,456 $4,985 $1,471 $8,548 $374,612 5
6 Capital Total: $9,114 $137 $8,977 $48,086 $28,576 $19,510 $59,346 $1,833,242 6
B. Expense (000s)
7 BUSINESS OPERATIONS (PMO) $1,012 $234 $778 $1,955 $469 $1,486 $1,853 $26,809 7
8 SM OPERATIONS $0 $0 $0 $0 $0 $0 $0 $56,594 8
9 SM CHANGE MANAGEMENT $0 ($26) $26 $150 $143 $7 $169 $15,027 9
10 CUSTOMER $1,721 $843 $878 $6,181 $4,036 $2,145 $12,899 $101,036 10
11 SM FIELD DELIVERY $23 $10 $13 $186 $18 $168 ($10) $18,010 11
12 SM SOLUTIONS $0 $0 ($0) $0 $32 ($32) $53 $68,021 12
13 IT $207 $4 $203 $1,766 $955 $811 $3,064 $134,078 13
14 Expense Total: $2,963 $1,065 $1,898 $10,238 $5,652 $4,586 $18,028 $419,576 14
C. Total: Capital + Expense (000s)
15 BUSINESS OPERATIONS (PMO) $1,068 $321 $747 $2,815 $1,202 $1,613 $2,905 $76,845 15
16 SM OPERATIONS $0 $0 $0 $0 $0 $0 $0 $67,904 16
17 SM CHANGE MANAGEMENT $0 ($26) $26 $150 $143 $7 $169 $15,027 17
18 CUSTOMER $1,721 $843 $878 $6,181 $4,036 $2,145 $12,899 $101,036 18
19 SM FIELD DELIVERY $5,399 $1,960 $3,439 $30,640 $22,641 $7,999 $31,008 $441,984 19
20 SM SOLUTIONS $3,562 ($2,038) $5,600 $10,316 $266 $10,050 $18,781 $1,041,333 20
21 IT $327 $142 $185 $8,222 $5,940 $2,282 $11,613 $508,690 21
22 Capital + Expense Total: $12,077 $1,202 $10,875 $58,324 $34,228 $24,096 $77,374 $2,252,818 22
23 * 2012 capital and expense forecasts revised to align with updated 2012 - 2013 deployment schedule. 23
Current Month - June Year to Date - JuneInception to Date Actual
2012Annual
Forecasts *
8Steering Committee July 2012 Report
2012 Budget Status – Benefits
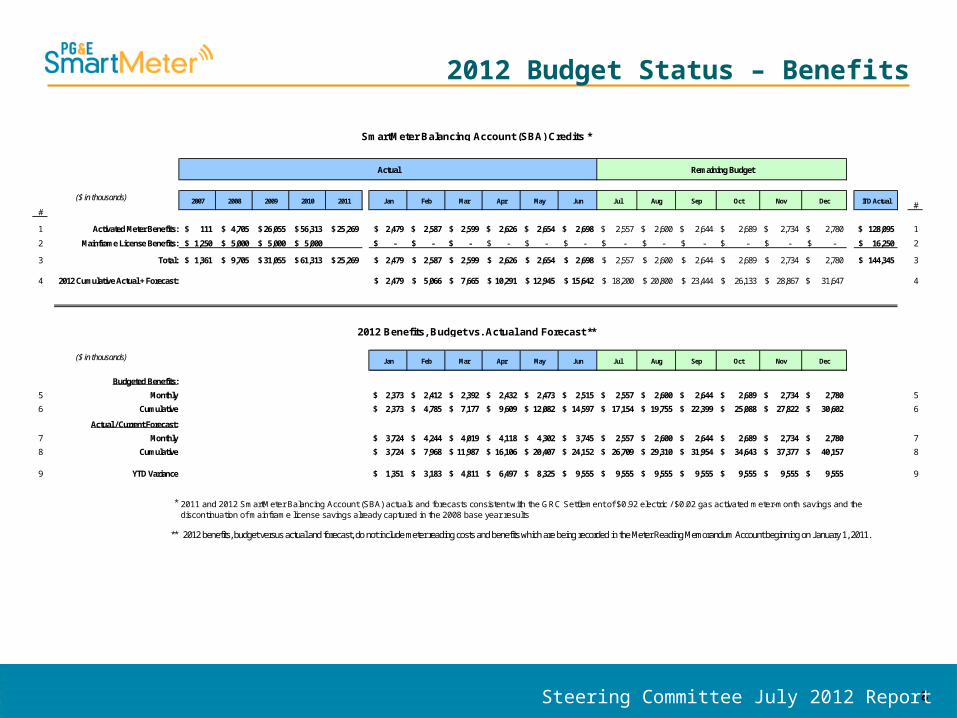
2007 2008 2009 2010 2011 Jan Feb Mar Apr May Jun Jul Aug Sep Oct Nov Dec ITD Actual #
1 Activated Meter Benefits: 111$ 4,705$ 26,055$ 56,313$ 25,269$ 2,479$ 2,587$ 2,599$ 2,626$ 2,654$ 2,698$ 2,557$ 2,600$ 2,644$ 2,689$ 2,734$ 2,780$ 128,095$ 1
2 Mainframe License Benefits: 1,250$ 5,000$ 5,000$ 5,000$ -$ -$ -$ -$ -$ -$ -$ -$ -$ -$ -$ -$ 16,250$ 2
3 Total: 1,361$ 9,705$ 31,055$ 61,313$ 25,269$ 2,479$ 2,587$ 2,599$ 2,626$ 2,654$ 2,698$ 2,557$ 2,600$ 2,644$ 2,689$ 2,734$ 2,780$ 144,345$ 3
4 2012 Cumulative Actual + Forecast: 2,479$ 5,066$ 7,665$ 10,291$ 12,945$ 15,642$ 18,200$ 20,800$ 23,444$ 26,133$ 28,867$ 31,647$ 4
Jan Feb Mar Apr May Jun Jul Aug Sep Oct Nov Dec
Budgeted Benefits:
5 Monthly 2,373$ 2,412$ 2,392$ 2,432$ 2,473$ 2,515$ 2,557$ 2,600$ 2,644$ 2,689$ 2,734$ 2,780$ 5
6 Cumulative 2,373$ 4,785$ 7,177$ 9,609$ 12,082$ 14,597$ 17,154$ 19,755$ 22,399$ 25,088$ 27,822$ 30,602$ 6
Actual / Current Forecast:
7 Monthly 3,724$ 4,244$ 4,019$ 4,118$ 4,302$ 3,745$ 2,557$ 2,600$ 2,644$ 2,689$ 2,734$ 2,780$ 7
8 Cumulative 3,724$ 7,968$ 11,987$ 16,106$ 20,407$ 24,152$ 26,709$ 29,310$ 31,954$ 34,643$ 37,377$ 40,157$ 8
9 YTD Variance 1,351$ 3,183$ 4,811$ 6,497$ 8,325$ 9,555$ 9,555$ 9,555$ 9,555$ 9,555$ 9,555$ 9,555$ 9
*
**
SmartMeter Balancing Account (SBA) Credits *
2012 Benefits, Budget vs. Actual and Forecast **
Remaining BudgetActual
#
($ in thousands)
2011 and 2012 SmartMeter Balancing Account (SBA) actuals and forecasts consistent with the GRC Settlement of $0.92 electric / $0.02 gas activated meter-month savings and the discontinuation of mainframe license savings already captured in the 2008 base year results
2012 benefits, budget versus actual and forecast, do not include meter reading costs and benefits which are being recorded in the Meter Reading Memorandum Account beginning on January 1, 2011.
($ in thousands)

9Steering Committee July 2012 Report
Issues Summary
Target Resolution Date
Issue Impact Status Summary
Ongoing
Increasing number of installations affected by access refusals and desire for customer choice program.
Increased costs, increase in unable to complete (UTC) back-log, customer change management.
Communicating with customers about the new SmartMeter Opt-Out Program to facilitate customer elections.
Customer Choice Phase 2 resolution is expected in 2013.

10Steering Committee July 2012 Report
Risks Summary
# Created On I P ScorePrev. Score
Risk Impact Status SummaryAssoc. Issue
1 9/30/2011 5 4 20 20 Increased forecast deployment costs and external resources requirement
Key drivers: Delays in deployment, resource availability and installation complexity
Increased installation costs and contract resources required to complete remaining installations effectively and timely
Pursuing identified opportunities to increase installation efficiency within ongoing operations and adherence to scope.
2 9/1/2011 5 3 15 15 Network deployment and performance in ‘hard-to-reach’ areas can not be completed successfully.
Key drivers: Network performance in ‘hard-to-reach’ areas and availability of alternate solutions.
Deployment delays, resource planning and increased costs.
Pursuing resolution of network coverage in ‘hard-to-reach’ areas with technology supplier, including potential alternate network solutions.

11Steering Committee July 2012 Report
Program Metrics
May '12 Variance AnalysisMetric Key Performance Indicator Actual Target Var Actual Target Var Actual Target Var Current Target Var
P1SM Earnings Contribution ($M -
estimated)5.78$ 5.80$ 0.0% 5.76$ 5.82$ -1.0% 34.77 34.92 -0.4% 71.20$ 70.80$ 0.6%
P2 OSHA Recordable Rate (YTD) - 0.51 - 0.51 - 0.51
P3 MVI Recordable Rate (YTD) - 0.10 - 0.10 - 0.98
C1Customers enrolled in
SmartRate (net)21,731 (track only) 33,709 (track only)
C2# of CPUC escalated Customer
Complaints7 (track only) 4 (track only) 30 (track only)
C10Customer Complaint Rate
(escalated to CPUC)0.057% (track only) 0.032% (track only) 0.019% (track only)
D1Meters/Modules Installed -
Electric & Gas14,139 14,139 0.0% 12,681 12,532 1.2% 153,885 153,736 0.1% 400,000 400,000 0.0%
D5 UTC Rate 12.1% 15.0% 19.7% 21.8% 15.0% -45.2% 18.8% 15.0% 25% 15.0% 15.0% 0.0% See Slide 4 for details
D7 UTCs open beyond 90 days 228,096 (track only) 158,709 (track only)
D8 CPI - Endpoints $104.68 $124.12 $125.94 $82.97CPI target under review in conjunction with revised deployment plan
D14Total Weeks of Inventory on
Hand - Electric Meters11 6 80.0% 11 6 81.5%
D15Total Weeks of Inventory on
Hand - Gas Modules12 6 95.0% 37 6 515.7%
O4 Transition Aging - Average Days 307 (track only) 222 (track only) 200 (track only) 152 (track only)
O5 SM Billing accuracy % (SA) 99.85% 99.88% 0.0% 99.85% 99.88% 0.0% 99.83% 99.87% 0.0% 99.88% 99.88% 0.0%
O6 SM Billing timeliness % (SA) 99.97% 99.81% 0.2% 99.97% 99.81% 0.2% 99.97% 99.80% 0.2% 99.79% 99.79% 0.0%
O7SM % Bills not estimated
(BSEGs)99.93% 99.90% 0.0% 99.93% 99.90% 0.0% 99.96% 99.90% 0.1% 99.90% 99.90% 0.0%
B2Meters Activated - Electric &
Gas (end of month)77,765 (track only) 15,897 (track only) 618,078 (track only) 850,412 (track only)
2012 Year End ForecastYTDJun '12 - Month ResultsMonth Results

12Steering Committee July 2012 Report
Project Deployment Plan Progress
13Steering Committee July 2012 Report
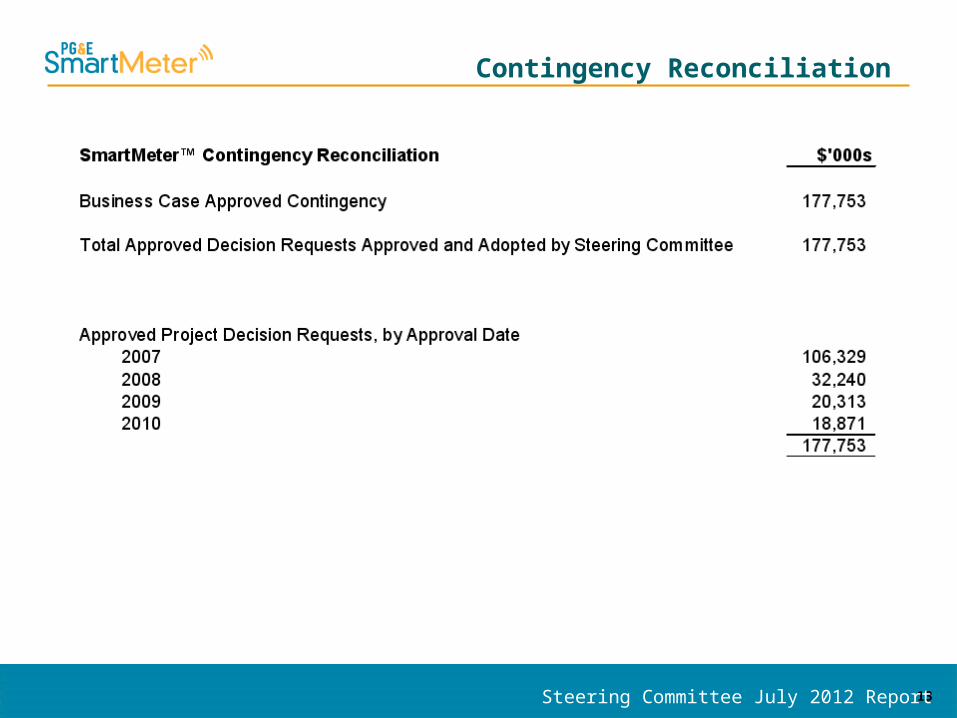
Contingency Reconciliation

14Steering Committee July 2012 Report
SmartMeterTM Acronyms
Acronym Definition Acronym DefinitionABS Advanced Billing System MARA My Account Re-ArchitectureAFCI Arc Fault Circuit Interrupter MDMS Meter Data Management SystemAMI Advanced Metering Infrastructure MLPP Meter Location Problem ProjectAP Access Point MPSC Meter Power Status CheckApps Applications MV-90 Multi Vendor - 90ASM Automated Storage Management MVI Motor Vehicle IncidentsBDG Business Development Group NEMS Net Energy Metering ServicesCC&B Customer Care and Billing NIC Network Interface CardCEDSA Centralized Electric Distribution System Assets OIR Order Instituting RulemakingCoE Center of Excellence OIS Outage Information SystemCPI Cost Per Install OMT Outage Management ToolsCPUC California Public Utilities Commission Ops OperationsDART Distribution Asset Reconciliation Tool OSHA Occupational Safety and Health AdministrationDC Data Center PCR Project Change RequestDCU Data Collector Unit PCT Programmable Communicating ThermostatDR Disaster Recovery PDP Peak Day PricingDRA Division of Ratepayer Advocates PDR Project Decision RequestDSCI Distribution Control Systems, Inc. PE Perfomance Engineering CompanyEA Ecologic Analytics PMO Project Management OfficeEAC Estimate at Completion PTR Peak Time RebateED Energy Division QBR Quarterly Business ReviewEMR Electric Meter Reader RCDC2 Remote Disconnect Phase 2EMT Electric Meter Technician Rev. RevisionEOM End-of-Month RF Radio FrequencyEON Emergency Outage Notification RFA Request For AuthorizationEOY End Of Year RV Restoration ValidationFA Functional Area SBA SmartMeter Balancing AccountsFD Field Delivery SM SmartMeterGE General Electric Co. SM Apps SmartMeter ApplicationsGFI Ground Fault Interrupter SMU SmartMeter UpgradeHAN Home Area Network SR Service RequestHC Head Count TBD To Be DeterminedIHD In-Home Devices TechArch Technical ArchitechtureISTS Information Systems and Technology Services TIC Technology Innovation CenterIT Information Technology TLM Transformer Load ManagementITD Inception To Date TOU Time Of UseIVR Interactive Voice Response UIQ Utility IQ - SSN softwareKC Knowledge Center UTC Unable To Complete (meter installation)KVAR Kilo-Volts-Amps Reactive YTD Year-To-DateLOB Line of Business
SmartMeter Acronyms


