18
EMPLOYEE TRAINING DECISIONS, BUSINESS STRATEGIES AND HUMAN RESOURCE MANAGEMENT PRACTICES: A STUDY BY SIZE OF BUSINESS October 2006 Rova Rabemananjara Chris Parsley

8/2/2019 SME Employee Training Eng
http://slidepdf.com/reader/full/sme-employee-training-eng 1/18
EMPLOYEE TRAINING DECISIONS, BUSINESSSTRATEGIES AND HUMAN RESOURCE
MANAGEMENT PRACTICES:
A STUDY BY SIZE OF BUSINESS
October 2006
Rova RabemananjaraChris Parsley

8/2/2019 SME Employee Training Eng
http://slidepdf.com/reader/full/sme-employee-training-eng 2/18
This publication is available upon request in accessible formats. Contact:
Multimedia Services SectionCommunications and Marketing BranchIndustry CanadaRoom 264D, West Tower235 Queen StreetOttawa ON K1A 0H5
Tel.: 613-948-1554Fax: 613-947-7155Email: [email protected]
This publication is also available electronically on the World Wide Web at the following address:http://strategis.ic.gc.ca/epic/site/sbrp-rppe.nsf/en/rd02059e.html
Permission to ReproduceExcept as otherwise specifically noted, the information in this publication may be reproduced, in part or inwhole and by any means, without charge or further permission from Industry Canada, provided that duediligence is exercised in ensuring the accuracy of the information reproduced; that Industry Canada is
identified as the source institution; and that the reproduction is not represented as an official version ofthe information reproduced, nor as having been made in affiliation with, or with the endorsement of,Industry Canada.
For permission to reproduce the information in this publication for commercial redistribution, please email:[email protected]
Cat. No. Iu188-31/2006E-PDFISBN 0-662-44145-160086E Aussi offert en français sous le titre Formation des employés, stratégies d’entreprises et pratiques de gestion de ressources humaines : étude selon la taille des entreprises.

8/2/2019 SME Employee Training Eng
http://slidepdf.com/reader/full/sme-employee-training-eng 3/18
3
Abstract
The aim of this study is to investigate in detail the proposition often found in the literature that small
businesses train their employees less than medium-sized and large businesses. The small business
population is much more heterogeneous than that of medium-sized and large firms in terms of motivation
because it includes not only growth firms but also foundation firms, which may be less interested in
growth. To account for differences in training rates by firm size as a result of different motivations, thebusiness populations are segmented according to different business strategies and different human
resources practices of firms.
Using the 2001 Workplace and Employee Survey of Statistics Canada, this study shows that small
businesses are less likely to provide training activities to their employees than medium-sized and large
businesses. However, it is clear that once they commit to investing in employee training, small businesses
do so as intensively as medium-sized and large firms. Moreover, the decision of whether or not to train
their employees is clearly related to the business strategies employed by the firm. In particular, the
incidence of training in small businesses that pursue an innovation and growth strategy is closer to the
incidence of training in medium-sized and large firms than that of other small businesses. In addition,
firms that have incentive schemes, use technology intensively or are innovative also exhibit a much
higher incidence of training across all firm sizes.

8/2/2019 SME Employee Training Eng
http://slidepdf.com/reader/full/sme-employee-training-eng 4/18
4
Table of contents
1. Introduction...............................................................................................................................................5
2. Literature review.......................................................................................................................................5
3. Data source................................................................................................................................................7
4. Expected relations between training decisions and business strategies, human resources management
practices, technology use and innovation ..................................................................................................... 7
5. Results.......................................................................................................................................................9
a. Incidence of training, by establishment size ....................................................................................... 10
b. Intensity of training, by establishment size ........................................................................................ 11
c. Incidence of training by business strategies, human resources practices, technology use and
innovation............................................................................................................................................... 12
Conclusions.................................................................................................................................................16
References...................................................................................................................................................17

8/2/2019 SME Employee Training Eng
http://slidepdf.com/reader/full/sme-employee-training-eng 5/18
5
1. Introduction
Fundamental changes in the global economy and the advent of new technologies have led to major
changes in the structure of employment in countries such as Canada. One impact has been that companies
have to constantly improve the skills of their workforce as technology changes in order to maintain high
productivity. Employee training is essential as it is one of the main ways of raising the skill level of the
workforce, the other being the recruitment of skilled personnel.
A growing number of empirical studies address the importance of employee training for businesses.However, few of them focus specifically on small businesses. The results relating business size to
employee training are general in nature, and basically state that small businesses provide less training to
their employees than medium-sized and large businesses. The aim of this study is to investigate this
proposition in greater detail.
The small business population is much more diverse than medium-sized and large firm populations in
terms of motivation. It includes not only start-up firms, growth firms, innovative firms and technology-
intensive firms, but also lower technology foundation firms, which may not be growth oriented.
Therefore, in order to understand why small businesses train their employees less than medium-sized andlarge firms, it is necessary to segment the small business population. By using data from the 2001Workplace and Employee Survey conducted by Statistics Canada, this paper examines training rates by
firm size according to different business strategies, human resources practices, and also technology use
and innovation.
The literature on employee training is reviewed in section two, while section three describes the database
used for the study. Section four briefly outlines the expected relationship between training decisions and
business strategies, human resources management practices, technology use and innovation. Part five
presents the empirical results. It compares the incidence and intensity of employee training across firm
sizes. For each firm size, it also shows how business strategies and human resources practices are related
to firms’ decisions on whether or not to train their employees.
2. Literature review
This section reviews a number of Canadian studies related to employee training. Empirical studies present
a profile of employee training and identify the obstacles to training that Canadian businesses are facing.
Some researchers are also interested in the impact of employee training on corporate performance.
The literature indicates that small businesses provide their employees with less training than larger
businesses. Moreover, small businesses tend to prefer on-the-job training to structured training1
(Leckie et
al., 2001; Baldwin and Johnson, 1995). Lack of time, high cost and lack of information are the main
reasons often cited. Compared with large firms, small firms are less capable of absorbing the possible
temporary reduction in productivity that can occur during training periods. In other words, they are less
able to take their employees off the job or replace them during training sessions. In addition, smallbusinesses do not enjoy as many economies of scale as larger businesses when they offer training for their
employees. Betcherman, Leckie and McMullen (1998) identified cost as a major obstacle to training for
small companies. They concluded that the average cost of training (per employee or person in training) is
1. Structured training is defined as a training activity with specific content that has a predefined objective and
predetermined format, and whose progress can be monitored and/or evaluated. On-the-job training, on the other
hand, is informal and does not necessarily have a predetermined format. It is generally conducted in the workplace
itself (Guide to the Analysis of the Workplace and Employee Survey, 2001, Statistics Canada).

8/2/2019 SME Employee Training Eng
http://slidepdf.com/reader/full/sme-employee-training-eng 6/18
6
appreciably higher in small firms than in large firms. As a result, small firms favour on-the-job training
because it is less structured and more accessible. This type of training does not incur the fixed costs
associated with structured training (training materials, instructors’ salaries, etc.). Lack of information on
training opportunities is also cited as a barrier to training for small businesses (e.g. training suppliers and
programs available).
Training is also more likely to be given to the more educated employees. Leckie et al. (2001) found thatCanadian workers who hold a university degree are twice as likely to take part in employer-sponsored
training activities as their colleagues with a high-school diploma. In addition, highly qualified workers
(managers and professionals) are more likely to have access to training programs than sales staff,
administrative personnel and production workers with no certification. The rationale is that the more
education employees have the more likely they are to succeed in training, thus reducing the employer’s
training investment risk.
Turcotte et al. (2003) highlighted a strong link between business strategy and employee training. The
authors found that firms emphasizing a human resources strategy or research and development strategy
are much more likely to sponsor training than those with no strategy.
Technology and innovation are also among the most cited determinants of employer support for training.Baldwin and Johnson (1995) found that companies that innovate, are more technologically advanced,
emphasize quality management and have human resources strategies will more frequently support training
initiatives. Baldwin and Peters (2001) similarly demonstrated that innovative firms are more likely to
support training activities than non-innovative firms, but the former have a preference for on-the-job
training. Innovative firms particularly favour acquiring experience, in the context of learning by doing, to
enhance the ability of employees to innovate and solve problems. Chowhan (2005) concluded that the
existence and intensity of training activities in a firm depend on the level of technological competency
that exists in that firm, rather than on its being a member of a technology-based industry.
A number of studies indicate that employee training has a positive impact on corporate performance.
They generally test the hypothesis that, by improving the competency of employees, training also
improves their productivity, which is reflected in an improvement in the firm’s performance. Betcherman,McMullen and Davidman (1998) concluded that firms that have training programs tended to perform
better in terms of productivity, revenues, profitability, viability and prospects. Saks et al. (2002) also
found a positive relation between training and productivity, profit, revenue and client satisfaction, a
relation that is more significant when the training is accompanied by incentives for the employees.
These studies present the profile of employee training and the importance of this activity for businesses;
however, none focus specifically on small businesses. The results relating business size to employee
training are general in nature, and basically state that medium-sized and large firms provide more training
to their employees than small businesses. This paper segments the business population by firm size in
order to understand the differences in training rates and examines training rates by firm size according to
different business strategies and human resources practices.

8/2/2019 SME Employee Training Eng
http://slidepdf.com/reader/full/sme-employee-training-eng 7/18
7
3. Data source
The data used in this study are from the 2001 Workplace and Employee Survey (WES) conducted by
Statistics Canada. It is a longitudinal survey of establishments2
designed to explore a broad range of
questions related to employers and their employees. The survey collects information on the organization
of work, compensation, corporate performance, competitiveness, innovation, technology use, employeetraining, human resources management, employment and revenues. All business establishments operating
in Canada with paid employees are represented in the target population, with the exception of those in the
Northwest Territories, Nunavut and Yukon. Establishments related to agriculture, fishing, hunting and
trapping, private households, religious organizations and governments are also excluded from the survey.
The data are from the workplace component of the 2001 WES. The data were collected from an overall
sample of 6223 establishments, representing an estimated population of 701 123 establishments.3
Unfortunately, establishments with fewer than 10 employees are excluded from the sample used in thisstudy as a great many of them did not respond to a number of the questions of interest to this study. This
brings the relevant sample to 4189 observations, representing a population of 199 163 establishments.
Small and medium-sized establishments account for 99 percent of establishments in the sample. Smallestablishments (under 100 employees) make up the largest share (92.5 percent). Just over half (51.3 percent) of the establishments have 10 to 19 employees. Furthermore, nearly half of the employees
(48.9 percent) in the sample are in small establishments. However, even though they represent only
1 percent of the target population, large establishments account for over a quarter of the employment
(26.8 percent).
This study focuses primarily on structured training. The WES provides little information about on-the-job
training activities, and in particular their associated costs. This simplifies our analysis as structured
training is an acceptable indicator of general training activities. Establishments that support structured
training are those that are most strongly committed to overall training activities4 (Betcherman, McMullen
and Davidman, 1998). Nevertheless, more flexible and less expensive on-the-job training deserves more
thorough exploration in future research.
4. Expected relations between training decisions and business strategies, human resources
management practices, technology use and innovation
Decisions about training are generally made at the top of the corporate pyramid: training-related strategies
and funding levels are determined by senior management. Generally, the employer considers training as
an investment in human capital from which it expects future benefits. The employer, therefore, must
consider the costs and benefits of the training. The rational employer decides to train employees if the
total expected benefit is greater than the total cost. The first decision the employer makes is whether or
2. The WES establishment sample is taken from the Statistics Canada Business Register. An establishment isdefined as a business location operating in Canada that has paid employees in March of the reference year. A
number of establishments may be owned by one business, and a business must own at least one establishment. In the
rest of this study, we will speak specifically of establishments.
3. A final weight is assigned to each sampled unit so that it represents other similar units that have not been selected.
In this way, the estimates from the sampled units produced with the application of final weights will be in line with
the estimates for the target population.
4. The 2001 WES data show that 84.4 percent of the establishments that support structured training activities also
offer on-the-job training. However, only 61.4 percent of establishments offering their employees on-the-job training
also support structured training.

8/2/2019 SME Employee Training Eng
http://slidepdf.com/reader/full/sme-employee-training-eng 8/18
8
not to undertake a training activity. Given that training is undertaken, the employer must then decide on
the extent of the training to support.
Consequently, at this point, it is important to distinguish two concepts that will be used throughout this
study. Incidence of training refers to the decision by establishments on whether or not to sponsor
training activities. It will be analysed based on the entire sample (N = 4189). Intensity of training, on the
other hand, corresponds to the extent of the training offered by establishments, once they have decided toundertake training. This is measured by the proportion of employees who have taken training and by the
ratio of structured training expenditures to operating revenue. Since it concerns only those establishments
that have decided to support training activities, a smaller sample (2995 establishments) is used.
Business strategy
The business strategy not only defines the organization of work, but also influences the level of
competency of the human capital needed to run the firm. Consequently, the various business strategies of
firms are linked to the training offered. In this study, business strategies are grouped into four categories:
Cost reduction: The main characteristics of this strategy are generally control of expenses and
expenditures. It is probable, therefore, that establishments that adopt such a strategy are less likely to traintheir employees.
Innovation and expansion: A firm pursuing this strategy places great importance on research and
development (R&D), innovation and market expansion. Firms that adopt such a strategy are striving to
create or increase comparative advantages to increase (or at least maintain) market share by broadening
their range of products and services and by expanding their market geographically. A person who has
developed a new idea can derive a certain market power over the market. It is reasonable to believe that
such firms need a relatively high-knowledge workforce and are more likely to train their employees.
Quality improvement: Firms that consider this strategy important are attempting to increase their
comparative advantages by distinguishing themselves for the quality of their products and services. One
would expect that such firms would invest in their workforce in order to increase their employees’abilities to constantly search for ways to improve quality.
Human resource-based strategy: This strategy includes heightened labour–management cooperation,
development of employees’ skills, improvement of employee involvement and improvement of
performance measures. This type of strategy permits companies to stimulate individual employee effort
by instilling a sense of belonging to the company. Employee productivity is thereby improved. It is
reasonable to believe that such a strategy favours employee training.
Human resources management practices5
Different human resources management practices can also act to influence the level of training,
particularly those that are concerned with organizational design and incentives. It is preferable to considera combination or bundle human resources practices, as expressed by Arthur (1994), since different
impacts on training are likely across different workplaces. In this study, three human resources
management practices are considered:
Flexible job design. The WES defines flexible job design as including job rotation, assignment of
personnel to a variety of tasks and a high degree of autonomy. Such practices make employees more
5. As defined in the WES.

8/2/2019 SME Employee Training Eng
http://slidepdf.com/reader/full/sme-employee-training-eng 9/18
9
versatile. One may think, therefore, that employees of firms that practise flexible job design, given their
autonomy, find it easier to organize their tasks so they can free up the time off needed to take part in a
training activity. In addition, the mobility that exists in such establishments makes it easier to replace, or
at least partly replace, employees going on training.
Hours of work. Loss of production time is, according to firms, one of the major obstacles to offering
training activities. It is especially problematical in small firms, which suggest that they have troublesending employees to training for fear of being unable to replace them during the training period
(Betcherman, Leckie and McMullen, 1998; Kapsalis, 1996). Unfortunately, the WES offers no
information on the allocation to employees of time specifically devoted to training.6
Therefore, the
average number of working hours is chosen to measure the opportunity cost (in terms of production
hours) of time allocated to training. It is assumed in this study that employees of firms with a lower
average number of working hours have more time available for activities other than production (e.g.
training). So the higher the number of hours of work, the higher the opportunity cost.7
Incentive system.8 Such a system includes practices linking employees’ compensation to their work
performance. Studies have found that employee training is much more likely to increase productivity
when it is combined with variable compensation (Saks et al., 2002; Black and Lynch, 1997). Therefore, it
is reasonable to believe that employees of firms where such systems exist would be more interested intraining to increase their competency and performance in order to receive better compensation.
Technology use and innovation
Technology and innovation will also affect training decisions because of the demands they make on the
skills composition of the workforce.
Technology use. Degree of technology use is likely to have a positive effect on employee training
decisions as employees’ abilities and skills in using technological equipment have to be regularly
updated. Technology use and training, therefore, are complements. In this study, technology use is
measured by the proportion of employees using a computer.9
Innovation. The innovation processes of firms generally require skilled workers with advanced
competencies. It can be expected that innovative firms are more likely to provide employee training. Four
types of innovation are defined: new products or services, improved products or services, new processes
and improved processes. To measure the degree of innovation in this study, a rating of 0 to 4 was
assigned to each establishment, with 0 indicating that the establishment has introduced none of the four
types of innovation, 1 indicating that it has introduced one type of innovation, and so forth.
5. Results
The first part of this section compares the incidence and the intensity of employee training in small,
medium-sized and large establishments. It shows that, among establishments that commit to investing in
employee training, the intensity of training is very similar across different firm-size groups. By using
6. Training activities may be held both during and outside normal working hours.
7. We acknowledge the weakness of this hypothesis. However, the results of our analyses seem to be consistent.
8. The WES identifies five types of incentive compensation: individual incentive systems, group incentive systems,
profit-sharing plans, merit pay and skill-based pay, and employee stock plans.
9. Computer here means a microcomputer, minicomputer, personal computer or mainframe that can be programmed
to perform a variety of operations (Guide to the Analysis of the Workplace and Employee Survey, 2001, Statistics
Canada).

8/2/2019 SME Employee Training Eng
http://slidepdf.com/reader/full/sme-employee-training-eng 10/18
10
descriptive analysis, the second part of this section examines, for each firm-size group, which factors are
associated with the incidence of training.
a. Incidence of training, by establishment size
This study, like previous studies, found that training enjoys less than universal support. Table 1 shows
that just over half of the establishments surveyed (51.9 percent) reported that they sponsored structured
training and 71.4 percent offered their employees on-the-job training. It is also not surprising that, for
both types of training, the rate of support increases with firm size. Less than half of the small
establishments (49.2 percent) sponsored structured training activities compared with 86.3 percent of medium-sized establishments and 96.1 percent of large establishments. The same trend also occurs for on-
the-job training.
Among small establishments, those with fewer than 50 employees are far less likely to offer training
activities. Structured training is offered by only 39.0 percent of establishments with 10 to 19 employees,and 53.8 percent of those with 20 to 49 employees. On the other hand, 79.2 percent of establishments
with 50 to 99 employees support structured training, a percentage that is closer to those for medium-sized
establishments than for other categories of small establishments.
Figures in Table 1 also support the idea that the smaller the establishment, the more on-the-job training ispreferred to structured training. The ratio of support for on-the-job training to structured training
decreases as the size of the establishment increases. Once again, the phenomenon is more pronounced for
establishments with fewer than 50 employees. The ratio drops dramatically from 1.38 for establishments
with 20 to 49 employees to 1.09 for establishments with 50 to 99 employees.
Table 1: Proportion of establishments supporting training activities, by size of
establishment (percentage), N = 4189
Size Structured On-the-job Ratio
of establishment training (1) training (2) (2) / (1)
Small establishments 49.2 69.8 1.42
10–19 employees 39.0 63.8 1.64
20–49 employees 53.8 74.0 1.38
50–99 employees 79.2 86.4 1.09
Medium-sized establishments 86.3 90.4 1.05
100–299 employees 85.2 90.0 1.06
300–499 employees 93.1 93.2 1.00
Large establishments
500 employees or more 96.1 94.9 0.99
Total 51.9 71.4
Source: Statistics Canada, Workplace and Employee Survey , 2001.
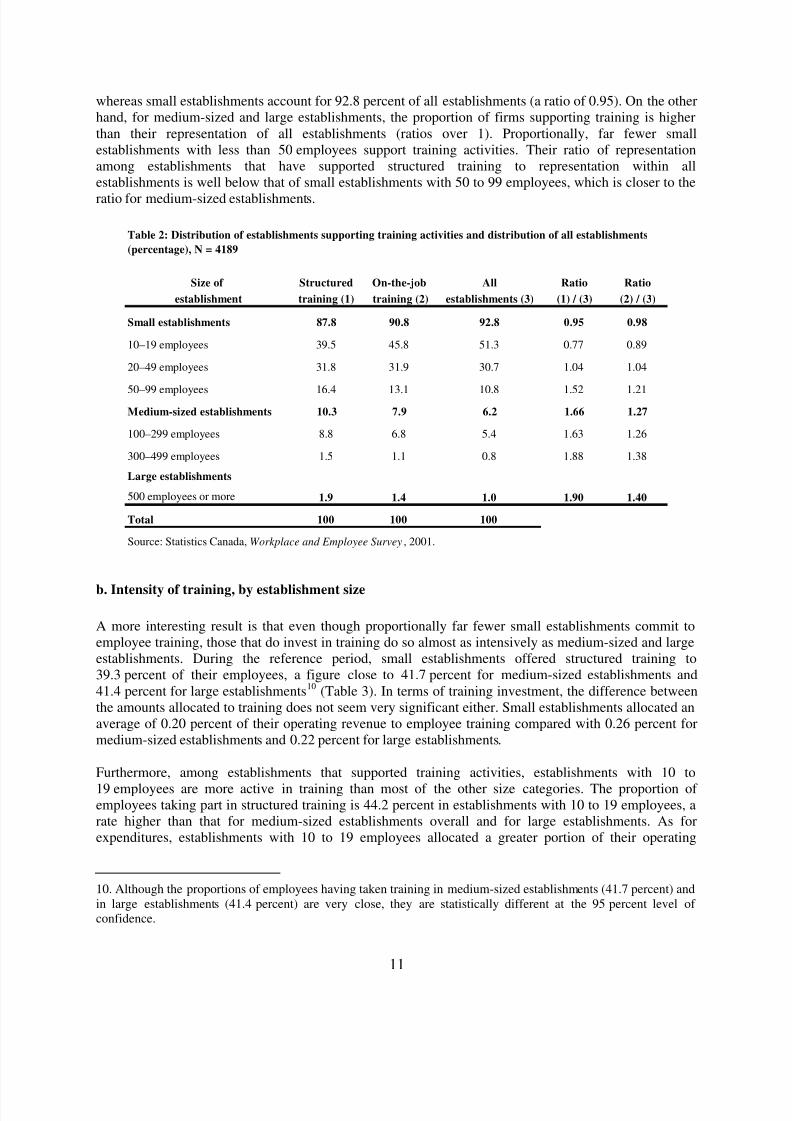
Analysis of the distribution of establishments supporting training activities (Table 2) confirms that small
establishments, particularly those with fewer than 50 employees, support training proportionally less than
other establishments. Of the establishments that supported structured training, 87.8 percent were small,
8/2/2019 SME Employee Training Eng
http://slidepdf.com/reader/full/sme-employee-training-eng 11/18
11
whereas small establishments account for 92.8 percent of all establishments (a ratio of 0.95). On the other
hand, for medium-sized and large establishments, the proportion of firms supporting training is higher
than their representation of all establishments (ratios over 1). Proportionally, far fewer small
establishments with less than 50 employees support training activities. Their ratio of representation
among establishments that have supported structured training to representation within all
establishments is well below that of small establishments with 50 to 99 employees, which is closer to the
ratio for medium-sized establishments.
Size of Structured On-the-job All Ratio Ratio
establishment training (1) training (2) establishments (3) (1) / (3) (2) / (3)
Small establishments 87.8 90.8 92.8 0.95 0.98
10–19 employees 39.5 45.8 51.3 0.77 0.89
20–49 employees 31.8 31.9 30.7 1.04 1.04
50–99 employees 16.4 13.1 10.8 1.52 1.21
Medium-sized establishments 10.3 7.9 6.2 1.66 1.27
100–299 employees 8.8 6.8 5.4 1.63 1.26
300–499 employees 1.5 1.1 0.8 1.88 1.38
Large establishments
500 employees or more 1.9 1.4 1.0 1.90 1.40
Total 100 100 100
Source: Statistics Canada, Workplace and Employee Survey , 2001.
Table 2: Distribution of establishments supporting training activities and distribution of all establishments
(percentage), N = 4189
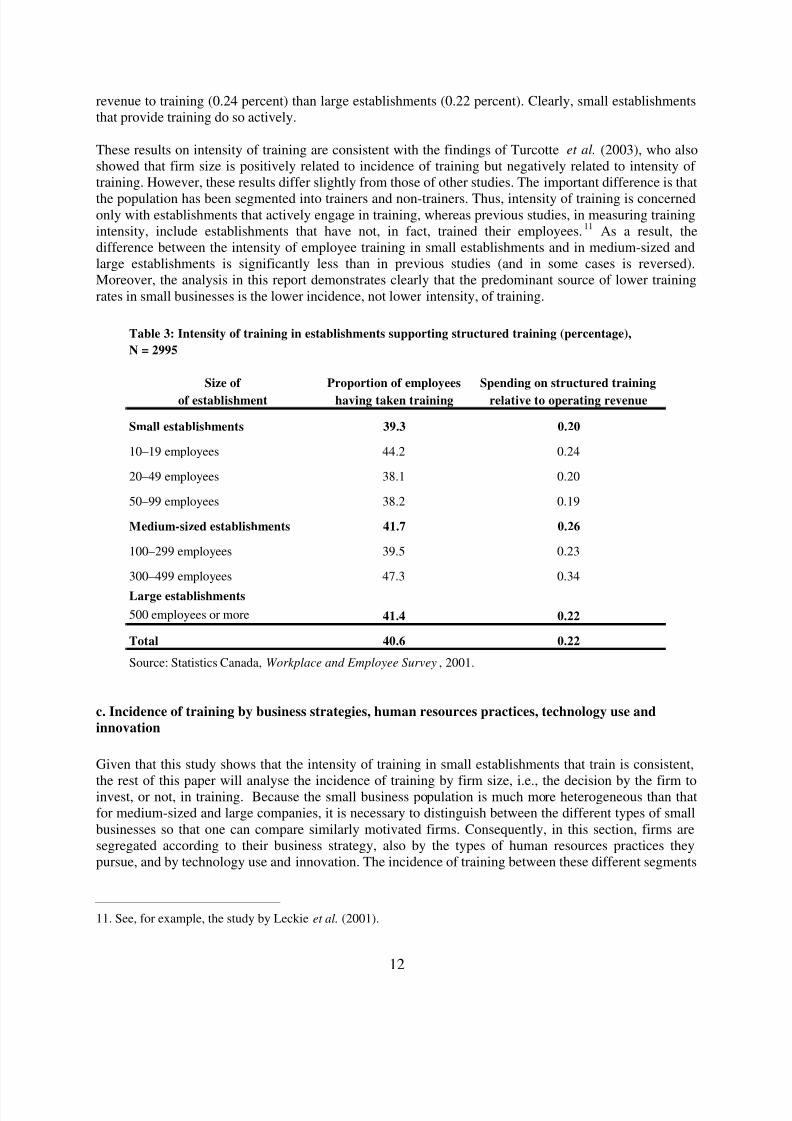
b. Intensity of training, by establishment size
A more interesting result is that even though proportionally far fewer small establishments commit to
employee training, those that do invest in training do so almost as intensively as medium-sized and large
establishments. During the reference period, small establishments offered structured training to
39.3 percent of their employees, a figure close to 41.7 percent for medium-sized establishments and
41.4 percent for large establishments10
(Table 3). In terms of training investment, the difference between
the amounts allocated to training does not seem very significant either. Small establishments allocated an
average of 0.20 percent of their operating revenue to employee training compared with 0.26 percent for
medium-sized establishments and 0.22 percent for large establishments.
Furthermore, among establishments that supported training activities, establishments with 10 to
19 employees are more active in training than most of the other size categories. The proportion of employees taking part in structured training is 44.2 percent in establishments with 10 to 19 employees, a
rate higher than that for medium-sized establishments overall and for large establishments. As for
expenditures, establishments with 10 to 19 employees allocated a greater portion of their operating
10. Although the proportions of employees having taken training in medium-sized establishments (41.7 percent) and
in large establishments (41.4 percent) are very close, they are statistically different at the 95 percent level of
confidence.
8/2/2019 SME Employee Training Eng
http://slidepdf.com/reader/full/sme-employee-training-eng 12/18
12
revenue to training (0.24 percent) than large establishments (0.22 percent). Clearly, small establishments
that provide training do so actively.
These results on intensity of training are consistent with the findings of Turcotte et al. (2003), who also
showed that firm size is positively related to incidence of training but negatively related to intensity of
training. However, these results differ slightly from those of other studies. The important difference is that
the population has been segmented into trainers and non-trainers. Thus, intensity of training is concernedonly with establishments that actively engage in training, whereas previous studies, in measuring training
intensity, include establishments that have not, in fact, trained their employees.11
As a result, the
difference between the intensity of employee training in small establishments and in medium-sized and
large establishments is significantly less than in previous studies (and in some cases is reversed).
Moreover, the analysis in this report demonstrates clearly that the predominant source of lower training
rates in small businesses is the lower incidence, not lower intensity, of training.
N = 2995
Size of Proportion of employees Spending on structured training
of establishment having taken training relative to operating revenue
Small establishments 39.3 0.20
10–19 employees 44.2 0.24
20–49 employees 38.1 0.20
50–99 employees 38.2 0.19
Medium-sized establishments 41.7 0.26
100–299 employees 39.5 0.23
300–499 employees 47.3 0.34
Large establishments
500 employees or more 41.4 0.22
Total 40.6 0.22
Source: Statistics Canada, Workplace and Employee Survey , 2001.
Table 3: Intensity of training in establishments supporting structured training (percentage),
c. Incidence of training by business strategies, human resources practices, technology use and
innovation
Given that this study shows that the intensity of training in small establishments that train is consistent,
the rest of this paper will analyse the incidence of training by firm size, i.e., the decision by the firm toinvest, or not, in training. Because the small business population is much more heterogeneous than that
for medium-sized and large companies, it is necessary to distinguish between the different types of small
businesses so that one can compare similarly motivated firms. Consequently, in this section, firms are
segregated according to their business strategy, also by the types of human resources practices they
pursue, and by technology use and innovation. The incidence of training between these different segments
11. See, for example, the study by Leckie et al. (2001).
8/2/2019 SME Employee Training Eng
http://slidepdf.com/reader/full/sme-employee-training-eng 13/18
13
is compared by size of firm to try to understand further the factors underlying variations in the incidence
of training.12
Business strategies
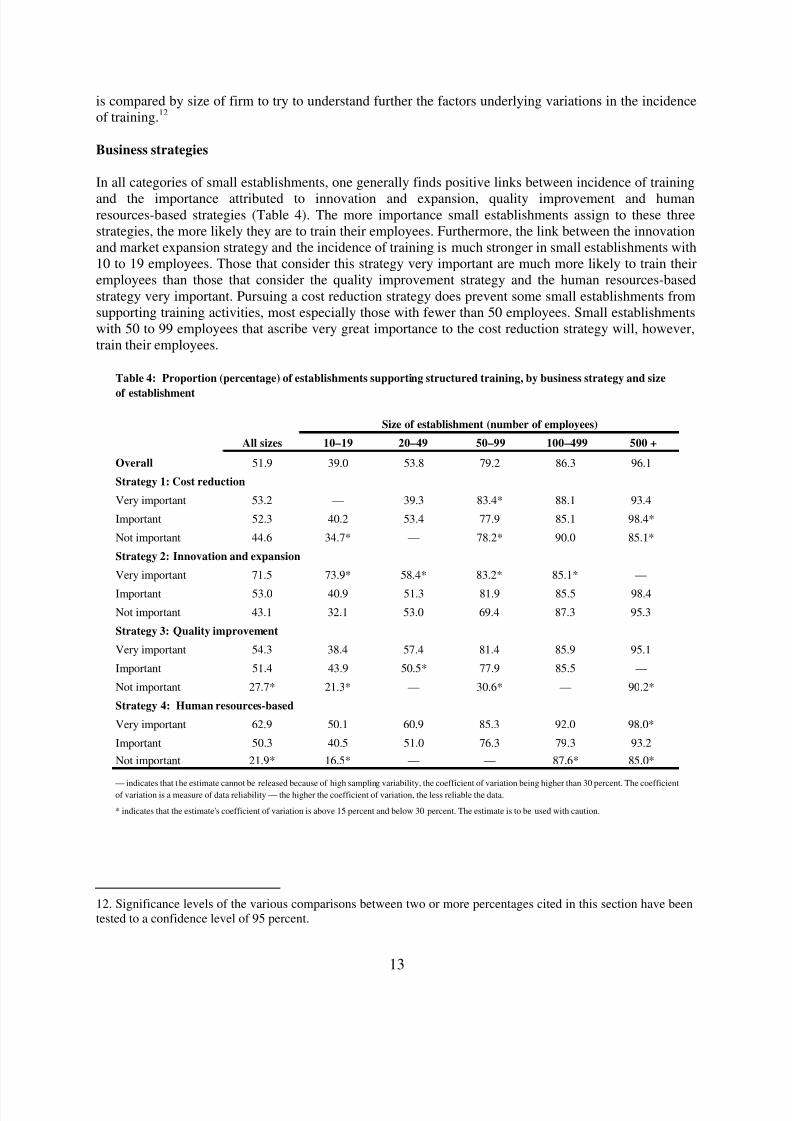
In all categories of small establishments, one generally finds positive links between incidence of training
and the importance attributed to innovation and expansion, quality improvement and humanresources-based strategies (Table 4). The more importance small establishments assign to these three
strategies, the more likely they are to train their employees. Furthermore, the link between the innovation
and market expansion strategy and the incidence of training is much stronger in small establishments with
10 to 19 employees. Those that consider this strategy very important are much more likely to train their
employees than those that consider the quality improvement strategy and the human resources-based
strategy very important. Pursuing a cost reduction strategy does prevent some small establishments from
supporting training activities, most especially those with fewer than 50 employees. Small establishments
with 50 to 99 employees that ascribe very great importance to the cost reduction strategy will, however,
train their employees.
All sizes 10–19 20–49 50–99 100–499 500 +
Overall 51.9 39.0 53.8 79.2 86.3 96.1
Strategy 1: Cost reduction
Very important 53.2 — 39.3 83.4* 88.1 93.4
Important 52.3 40.2 53.4 77.9 85.1 98.4*
Not important 44.6 34.7* — 78.2* 90.0 85.1*
Strategy 2: Innovation and expansion
Very important 71.5 73.9* 58.4* 83.2* 85.1* —
Important 53.0 40.9 51.3 81.9 85.5 98.4
Not important 43.1 32.1 53.0 69.4 87.3 95.3
Strategy 3: Quality improvement
Very important 54.3 38.4 57.4 81.4 85.9 95.1
Important 51.4 43.9 50.5* 77.9 85.5 —
Not important 27.7* 21.3* — 30.6* — 90.2*
Strategy 4: Human resources-based
Very important 62.9 50.1 60.9 85.3 92.0 98.0*
Important 50.3 40.5 51.0 76.3 79.3 93.2
Not important 21.9* 16.5* — — 87.6* 85.0*
* indicates that the estimate's coefficient of variation is above 15 percent and below 30 percent. The estimate is to be used with caution.
Table 4: Proportion (percentage) of establishments supporting structured training, by business strategy and size
of establishment
Size of establishment (number of employees)
— indicates that the estimate cannot be released because of high sampling variability, the coefficient of variation being higher than 30 percent. The coefficientof variation is a measure of data reliability — the higher the coefficient of variation, the less reliable the data.
12. Significance levels of the various comparisons between two or more percentages cited in this section have been
tested to a confidence level of 95 percent.
8/2/2019 SME Employee Training Eng
http://slidepdf.com/reader/full/sme-employee-training-eng 14/18
14
The relation between incidence of training and the different business strategies seems to be less
pronounced in medium-sized and large establishments. For each strategy, the incidence of training is
much less disparate in medium-sized and large establishments, whatever the importance ascribed to the
strategy, than in small establishments. In medium-sized establishments, however, those that base their
strategy primarily on human resources are more inclined to offer employee training than the others. In
large establishments, there is a positive relation for quality improvement strategies and human
resources-based strategies. And, for large establishments, cost control is not an obstacle to supportingtraining.
From the perspective of analysing different training rates by firm size, what is important is that the
decision to train employees or not is much more dependent on the different business strategies in small
establishments than in medium-sized and large establishments. The majority of medium-sized and large
establishments sponsor training activities regardless of the strategies they adopt. However, it is primarily
motivation to innovate and extend their market share that leads small establishments, especially those
with 10 to 19 employees, to offer employee training. Those seeking to improve the quality of their
products and those that base their strategy on human resources are also more likely to train their
employees, though to a lesser extent.
When comparing establishments of different sizes and similar strategies, the difference in the incidence of training is much less than that observed overall. One concludes, therefore, that it is the heterogeneity of
the small establishment population that is the source of the lower training rates observed in other studies.
When one compares similar firms, size seems to be a less important factor in training. A firm committed
to innovation and motivated to grow will find a way to undertake training, whatever their size.
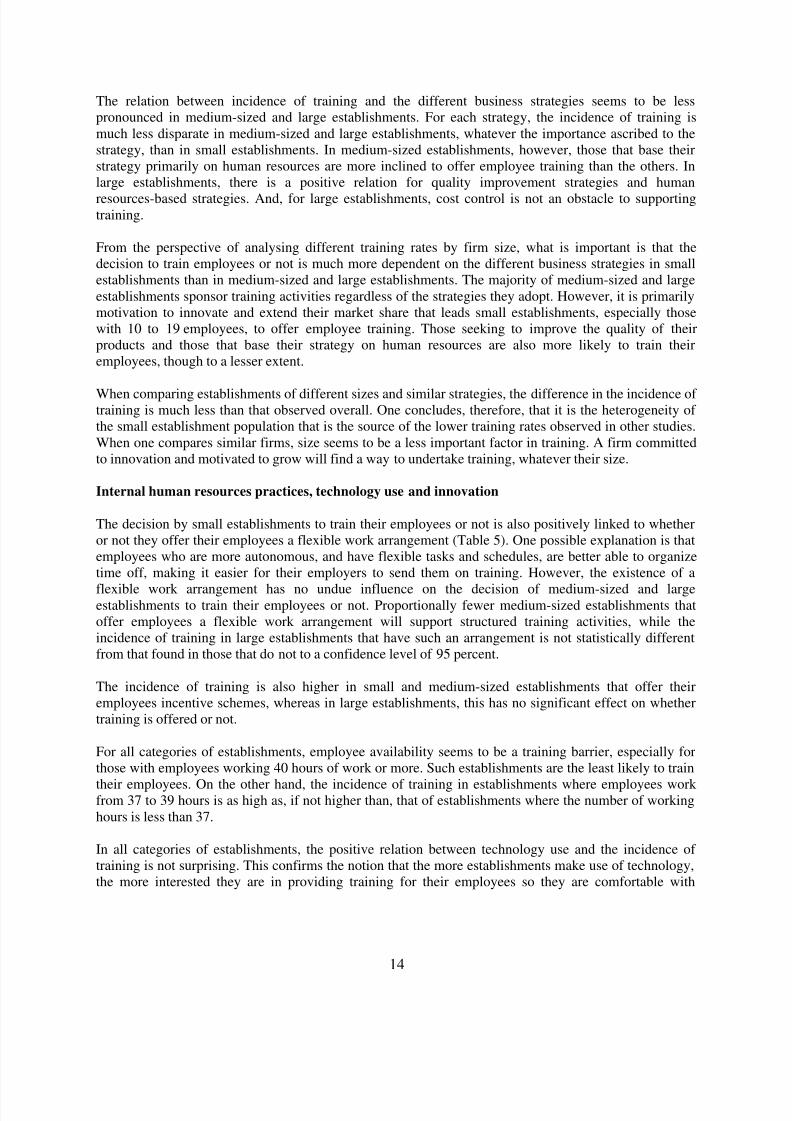
Internal human resources practices, technology use and innovation
The decision by small establishments to train their employees or not is also positively linked to whether
or not they offer their employees a flexible work arrangement (Table 5). One possible explanation is that
employees who are more autonomous, and have flexible tasks and schedules, are better able to organize
time off, making it easier for their employers to send them on training. However, the existence of a
flexible work arrangement has no undue influence on the decision of medium-sized and largeestablishments to train their employees or not. Proportionally fewer medium-sized establishments that
offer employees a flexible work arrangement will support structured training activities, while the
incidence of training in large establishments that have such an arrangement is not statistically different
from that found in those that do not to a confidence level of 95 percent.
The incidence of training is also higher in small and medium-sized establishments that offer their
employees incentive schemes, whereas in large establishments, this has no significant effect on whether
training is offered or not.
For all categories of establishments, employee availability seems to be a training barrier, especially for
those with employees working 40 hours of work or more. Such establishments are the least likely to train
their employees. On the other hand, the incidence of training in establishments where employees work from 37 to 39 hours is as high as, if not higher than, that of establishments where the number of working
hours is less than 37.
In all categories of establishments, the positive relation between technology use and the incidence of
training is not surprising. This confirms the notion that the more establishments make use of technology,
the more interested they are in providing training for their employees so they are comfortable with
8/2/2019 SME Employee Training Eng
http://slidepdf.com/reader/full/sme-employee-training-eng 15/18
15
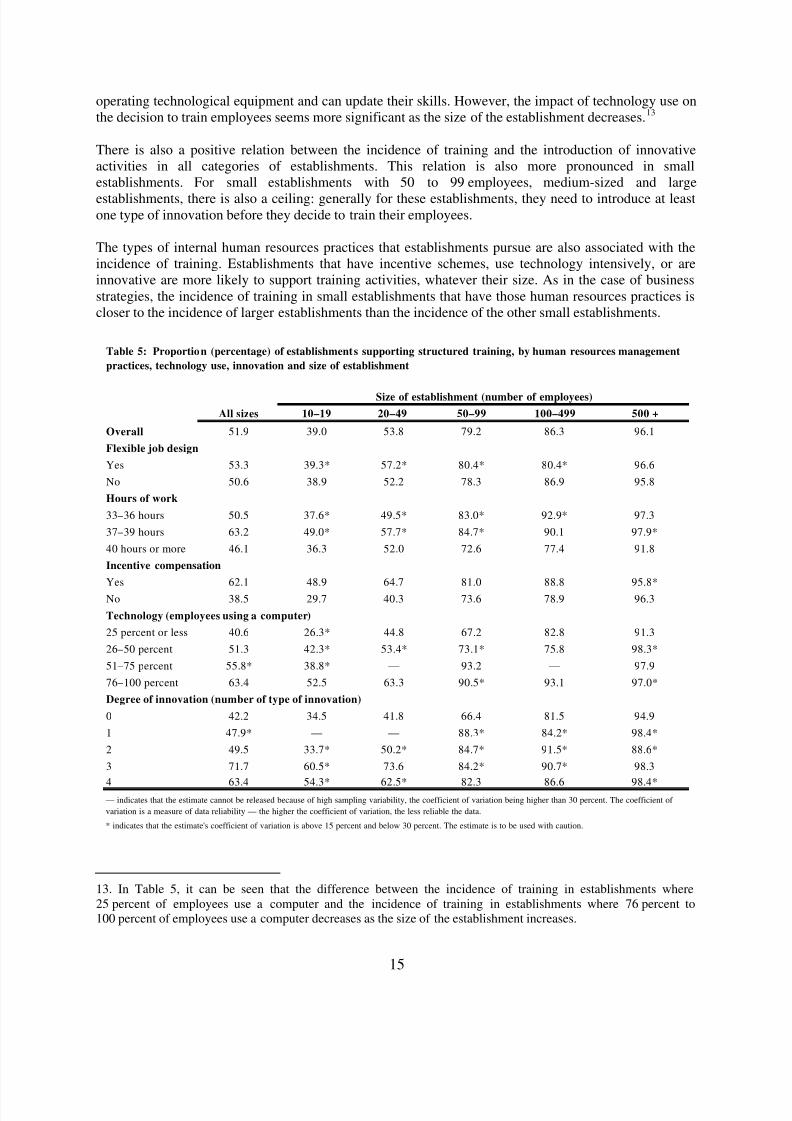
operating technological equipment and can update their skills. However, the impact of technology use on
the decision to train employees seems more significant as the size of the establishment decreases.13
There is also a positive relation between the incidence of training and the introduction of innovative
activities in all categories of establishments. This relation is also more pronounced in small
establishments. For small establishments with 50 to 99 employees, medium-sized and large
establishments, there is also a ceiling: generally for these establishments, they need to introduce at leastone type of innovation before they decide to train their employees.
The types of internal human resources practices that establishments pursue are also associated with the
incidence of training. Establishments that have incentive schemes, use technology intensively, or are
innovative are more likely to support training activities, whatever their size. As in the case of business
strategies, the incidence of training in small establishments that have those human resources practices is
closer to the incidence of larger establishments than the incidence of the other small establishments.
All sizes 10–19 20–49 50–99 100–499 500 +
Overall 51.9 39.0 53.8 79.2 86.3 96.1
Flexible job design
Yes 53.3 39.3* 57.2* 80.4* 80.4* 96.6
No 50.6 38.9 52.2 78.3 86.9 95.8
Hours of work
33–36 hours 50.5 37.6* 49.5* 83.0* 92.9* 97.3
37–39 hours 63.2 49.0* 57.7* 84.7* 90.1 97.9*
40 hours or more 46.1 36.3 52.0 72.6 77.4 91.8
Incentive compensation
Yes 62.1 48.9 64.7 81.0 88.8 95.8*
No 38.5 29.7 40.3 73.6 78.9 96.3
Technology (employees using a computer)
25 percent or less 40.6 26.3* 44.8 67.2 82.8 91.3
26–50 percent 51.3 42.3* 53.4* 73.1* 75.8 98.3*
51–75 percent 55.8* 38.8* — 93.2 — 97.9
76–100 percent 63.4 52.5 63.3 90.5* 93.1 97.0*
Degree of innovation (number of type of innovation)
0 42.2 34.5 41.8 66.4 81.5 94.9
1 47.9* — — 88.3* 84.2* 98.4*
2 49.5 33.7* 50.2* 84.7* 91.5* 88.6*
3 71.7 60.5* 73.6 84.2* 90.7* 98.3
4 63.4 54.3* 62.5* 82.3 86.6 98.4*
* indicates that the estimate's coefficient of variation is above 15 percent and below 30 percent. The estimate is to be used with caution.
Table 5: Proportion (percentage) of establishments supporting structured training, by human resources management
practices, technology use, innovation and size of establishment
Size of establishment (number of employees)
— indicates that the estimate cannot be released because of high sampling variability, the coefficient of variation being higher than 30 percent. The coefficient of
variation is a measure of data reliability — the higher the coefficient of variation, the less reliable the data.
13. In Table 5, it can be seen that the difference between the incidence of training in establishments where
25 percent of employees use a computer and the incidence of training in establishments where 76 percent to
100 percent of employees use a computer decreases as the size of the establishment increases.

8/2/2019 SME Employee Training Eng
http://slidepdf.com/reader/full/sme-employee-training-eng 16/18
16
Conclusions
The aim of this study was to examine the proposition that small firms train their employees less than
medium-sized and large firms. The results concur with previous studies in that proportionally fewer small
firms provide structured training activities for their employees, especially those with fewer than 50
employees. Moreover, small businesses are more likely to rely on on-the-job training versus structured
training. However, the report qualifies this general statement in a number of aspects. The results show
that when they commit to investing in employee training, small firms do so as intensively as
medium-sized and large businesses. In fact, in the same way that some firms are not interested in growth,
some firms have no interest in training. When the non-trainers are separated out, it is clear that the
intensity of training is very similar across the different size groups. This suggests that the source of less
training in small business is incidence, not intensity. Therefore, the incidence of training should be looked
at more closely if we want to understand differences in overall training rates by firm size.
The small business population is much more heterogeneous than the medium-sized and large firm
populations. The small business population includes both growth firms and firms that have no interest in
growth. To screen out firms with no interest in growth, this paper examined training rates by firm size and
segmented the business populations according to different business strategies and different human
resources practices.
The business strategies of a firm clearly influence whether they decide to train or not. In particular, firms
that pursue an innovation and growth strategy are more likely to train employees regardless of firm size.
One can conclude that when comparing firms with similar business strategies, the difference in the
incidence of training by firm size is much less than that observed overall. A similar but less pronounced
phenomenon can be seen for those firms that pursue a human resources focused business strategy.
The type of internal human resources practices that firms pursue also influences the incidence of training,
though the impact depends on the particular practice. Firms that have incentive schemes, use technology
intensively or are innovative exhibit much higher incidences of structured training across all firm sizes.
Once again, the gap between small firms and larger firms that have the same human resources practices is
reduced.
Consequently, the main reason training rates are lower in smaller firms is because the populations of the
smaller size group contain types of firms that are quite different and, indeed, absent from the population
of larger firms (foundation firms, growth firms, innovative and technology-intensive firms, lower
technology single-owner firms, non-growth-oriented firms). At the same time, there are many small
businesses that do train as intensively as large firms. A more realistic comparison is one that analyses
similar firms (in terms of motivation and practices) across different size groups. Problems arising from
heterogeneity, therefore, should be accounted for when evaluating studies on training by firm size.
Outcomes in this study were based on cross-sectional data and on a descriptive analysis. Therefore,
although the results of this study clearly showed that business strategies and human resources practices
are related to the training decisions of firms, they did not establish the direction of the causality links.Secondly, this study focused principally on structured training. However, the more flexible and less
expensive nature of on-the-job training deserves more thorough exploration in future research.
8/2/2019 SME Employee Training Eng
http://slidepdf.com/reader/full/sme-employee-training-eng 17/18
17
References
Almeida-Santos, F. and K. Mumford (2004), “Employee Training and Wage Compression in Britain”,
Department of Economics and Related Studies, University of York.
Arthur, J. (1994), “Effects of Human Resource Systems on Manufacturing Performance and Turnover”, Academy of Management Journal, Vol. 37, No. 3, pp. 670–687.
Baldwin, J. and J. Johnson (1995), “Human Capital Development and Innovation: The Case of Trainingin Small and Medium-Sized Firms”, Statistics Canada, Ottawa, No. 74-11F0019MPF No. 74, 44 p.
Baldwin, J. and V. Peters (2001), “Training as a Human Resource Strategy: The Response to Staff
Shortages and Technological Change”, Statistics Canada, Ottawa, No. 154-11F0019MPE No. 154,
38 p.
Baldwin, J., W. Chandler and T. Papailiadis (1994), “Strategies for Success: A Profile of Growing and
Medium-Sized Enterprises in Canada”, Statistics Canada, Ottawa, No. 61-523-RPE-1994001.
Bélanger, J. (2000), “The Influence of Employee Involvement on Productivity: A Review of RecentResearch”, Human Resources Development Canada, Ottawa, No. R-00-4E.
Betcherman, G., N. Leckie and K. McMullen (1998), “Barriers to Employer-Sponsored Training in
Canada”, Canadian Policy Research Network, Ottawa, 28 p.
Betcherman, G., K. McMullen and K. Davidman (1998), “Training for the New Economy: A Synthesis
Report”, Canadian Policy Research Network, Ottawa, 117 p.
Black, S. and L. Lynch (1997), “How to Compete: The Impact of Workplace Practices and Information
Technology on Productivity”, National Bureau of Economic Research, Cambridge, Working Paper
No. 6120, 34 p.
Chowhan, J. (2005), “Who Trains? High-Tech Industries or High-Tech Workplaces?” Statistics Canada,
Ottawa, No. 11-622-MIF No. 006, 69 p.
Cosh, A., J. Duncan and A. Hughes (1996), “The Impact of Training on Business Performance: An
Empirical Analysis of UK SMEs 1987–95”, University of Cambridge, 20 p.
Kapsalis, C. (1996), “The Role of Employees in Training Decisions in Canada”, Canadian Business
Economics, Fall 1996, pp. 71–80.
Lacoursière, R., B. Fabi, J. St-Pierre and M. Arcand (2005), « Effets de certaines pratiques de GRH sur la
performance de PME manufacturiers : vérification de l’approche universaliste », Revue InternationalePME , Vol. 18, No. 2, pp. 43–73.
Leckie, N., A. Léonard, J. Turcotte and D. Wallace (2001), “Employer and Employee Perspectives on
Human Resource Practices”, Statistics Canada, Ottawa, No. 71-584-MPF No. 1, 89 p.
Saks, A., S. Taggar and R. Haccoun (2002), “Is Training Related to Firm Performance?” Human
Resources Management Research Quarterly, International Alliance for Human Resources Research,
Vol. 6, No. 3, Fall 2002, 5 p.

8/2/2019 SME Employee Training Eng
http://slidepdf.com/reader/full/sme-employee-training-eng 18/18
18
Statistics Canada (2003), “Guide to the Analysis of Workplace and Employee Survey, 2001” , Labour
Statistics Division, Ottawa.
Taggar, S. and S. Thornhill (2002), “The Impact of Performance-Based Pay, Firm Strategy, and Firm Size
on Firm Performance”, Human Resources Management Research Quarterly, International Alliance
for Human Resources Research, Vol. 6, No. 4, Winter 2002, 5 p.
Turcotte, J., A. Léonard and C. Montmarquette (2003), “New Evidence on the Determinants of Training
in Canadian Business Locations”, Statistics Canada, Ottawa, No. 71-584-MPE No. 5, 94 p.


