Mayo Clinic College of MedicineMayo Clinic Comprehensive Cancer Center
Smoldering Multiple Myeloma
S. Vincent RajkumarProfessor of Medicine
Mayo Clinic
Scottsdale, Arizona Rochester, Minnesota Jacksonville, Florida
• <10% BMPC AND • <3gm/dL M protein AND• No CRAB
• ≥10% BMPC OR• ≥3 gm/dL M protein AND• No CRAB
• Clonal PCPD• CRAB attributable
to the PCPD
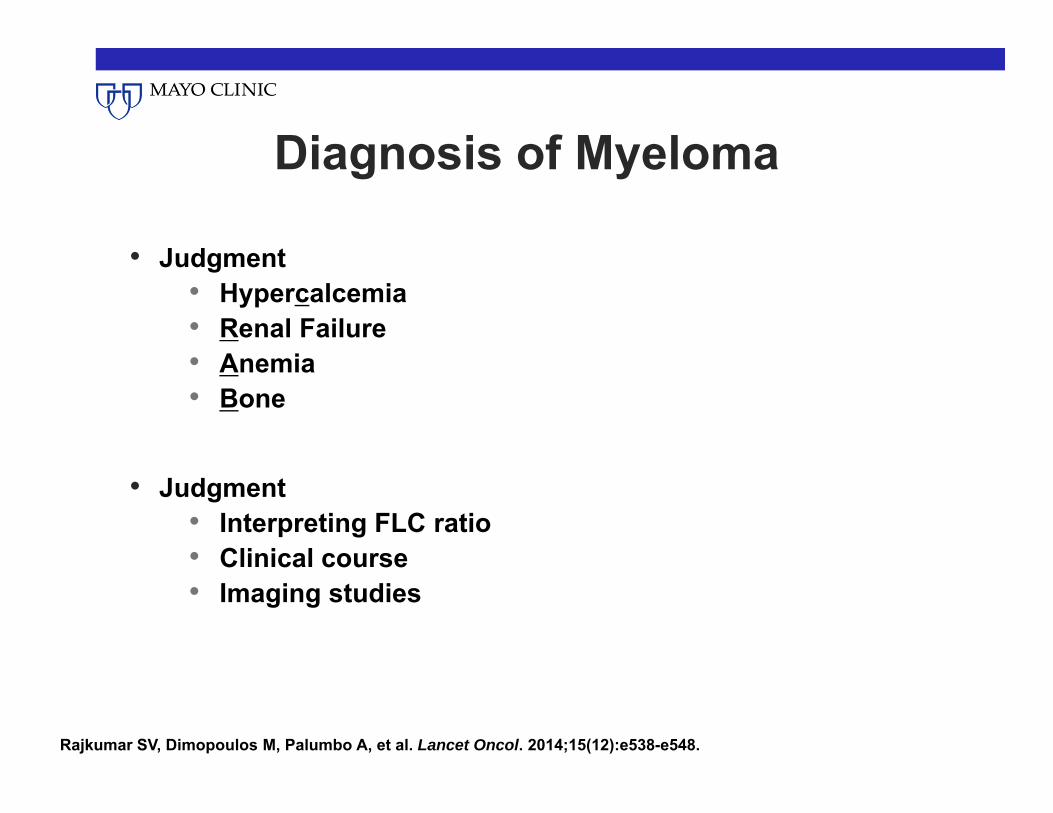
CRAB= Hypercalcemia, renal failure, anemia, or lytic bone lesions attributable to a clonal plasma cell disorder
MGUS SMM MM
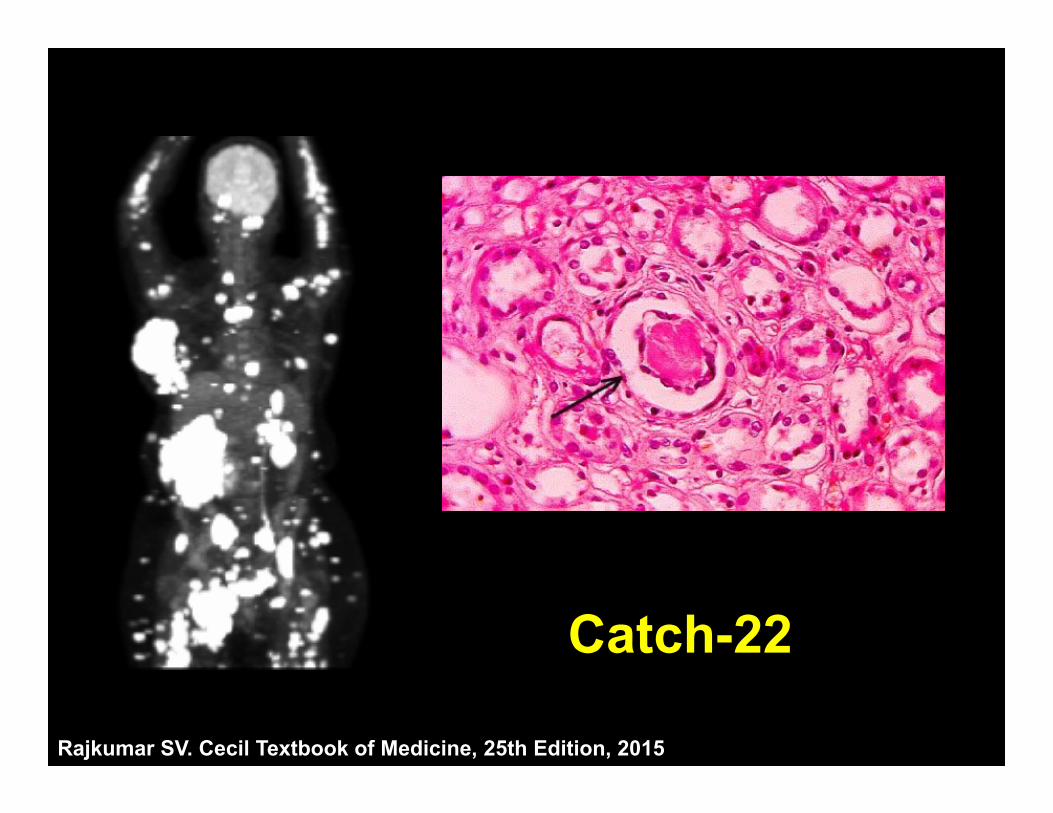
Rajkumar SV. Cecil Textbook of Medicine, 25th Edition, 2016
Previous Disease Definitions
No CRAB CRAB
• <10% BMPC AND • <3 gm/dL M protein AND• No MDE
• ≥10%-60% BMPC OR• ≥3 gm/dL S. M protein OR• ≥500 mg/24h Ur. M protein AND• No MDE
• PCPD, AND• 1 or more MDE• CRAB• ≥60% BMPC• ≥100 FLC ratio• >1 MRI focal lesion
MDE, myeloma-defining events
MGUS SMM MM
Rajkumar SV, et al. Lancet Oncol. 2014;15(12):e538-e548.
Revised IMWG Criteria
Low-dose Whole Body CT or PET-CT
Rajkumar SV, Dispenzieri A. In: Niederhuber JE, et al, eds. Abeloff’s Clinical Oncology, 5th Edition; 2013.Rajkumar SV. In: Goldman L and Schafer AI, eds. Goldman’s Cecil Medicine, 25th Edition. 2016.
Exclude Lytic Lesions
Bone Marrow Plasma Cell Estimation
Rajkumar SV et al. N Engl J Med 2011; N Engl J Med 2011; 365:474-475
• Regular (Wright’s, H & E)• Not immunostaining • Not flow
• Highest value
>100
<100
FLC Ratio >100 and Risk of progression to myeloma
Larsen J, et al. Leukemia advance online publication 27 November 2012; doi: 10.1038/leu.2012.296
Using the FLC ratio ≥100
• Measurable level of involved FLC: • ≥100 mg/L (≥10 mg/dL)
• Be wary of• Longstanding history• Minimal urine 24 hour M protein
• Assay
Rajkumar SV, Landgren O, Mateos MV. Blood 2015
Images courtesy of Jens Hillengass MD. University Hospital Heidelberg, S.D.G.;Hillengass J, Landgren O. Leuk Lymphoma 2013;54:1355–63.
MRI Focal Lesions
• 23/149 patients had >1 lesion; median TTP not patients with <= 1 FL and 13 months for those with >1 FL
Jens Hillengass et al. JCO 2010;28:1606-1610
MRI
• Definite focal lesions – at least 2• ≥5mm• Repeat in 3-6 months if in doubt
Rajkumar SV, Landgren O, Mateos MV. Blood 2015
Diagnosis of Myeloma
• Judgment • Hypercalcemia• Renal Failure• Anemia• Bone
• Judgment • Interpreting FLC ratio• Clinical course• Imaging studies
Rajkumar SV, Dimopoulos M, Palumbo A, et al. Lancet Oncol. 2014;15(12):e538-e548.
©2012 MFMER | 3206302-23
Smoldering Multiple Myeloma
Low-risk SMM:
High-Risk SMM
MM
• >60% BMPC
• FLCr >100
• >1 MRI focal lesions
©2012 MFMER | 3206302-24
Smoldering Multiple Myeloma
Low-risk SMM: 5%/yr risk of MM
High-Risk SMM
25%/year risk of MM
High Risk SMM: Median TTP ~2 years
≥10% PCs plus:•SMM with M protein ≥3 gm/dL •Absence (<5%) of normal PCs by immunophenotyping plus Immunoparesis •Abnormal FLC ratio 8-100•Del(17p), t4;14, gain(1q21)•M protein ≥4 gm/dL•IgA SMM•Evolving pattern•Increased circulating plasma cells
Rajkumar SV, Landgren O, Mateos MV. Blood 2015
Copyright ©2008 American Society of Hematology. Copyright restrictions may apply.
Dispenzieri, A. et al. Blood 2008;111:785-789
FLC Ratio and risk of progression in SMM
Bianchi, et al. Leukemia advance online publication 18 September 2012; doi: 10.1038/leu.2012.237
High Circulating Plasma Cells and Risk of progression to myeloma
Follow up from diagnosis of smoldering multiple myeloma (years)
Per
cent
pro
gres
sing
PCLI <1
PCLI ≥1
Madan S. Mayo Clin Proc 2010
High Plasma Cell Proliferative Rate and Risk of progression to myeloma
Risk Cytogenetic Abnormalities % of patients
(N=351)
Median TTP to
Multiple Myeloma(months) a
Median TTP to Multiple
Myeloma or related
disorder(months) b
High-Risk t(4;14)Del(17p)Gain(1q21)*
13% 24 24
Intermediate-Risk
Trisomies 42% 34 34
Standard-Risk t(11;14), t(14;16), t(14;20), combined IgH translocations and trisomies†, and isolated monosomy 13
30% 55 54
Low-Risk No abnormalities detected on FISH‡ 15% Not reached
101
Rajkumar SV et al Leukemia. 2013 Aug;27(8):1738-44; Neben et al. J Clin Oncol 2013
Cytogenetic Abnormalities and risk of progression in SMM
Risk factor Progression within 2 years eMP only 64%eHb only 65%Both eMP and eHb 82%eMP, eHb, and BMPC ≥20% 91%
eMP: 10% increase in M protein within 6 months (if M-protein ≥3 g/dl) or ≥25% increase in M protein within 12 months (minimum 0.5 g/dl)
Evolving M protein Levels
Ravi P, et al. Blood Cancer J 2016;6:e454-
eHb: ≥0.5 g/dL decrease within 12 months
When Should Treatment Be Initiated?
Potential New Myeloma or Smoldering Myeloma
Observation
Rajkumar SV, Landgren O, Mateos MV. Blood 2015
Any Myeloma Defining Events?• CRAB, • >60% PC, • FLC >100, • MRI >1 focal
No Myeloma Defining Events (SMM)
Treat as Myeloma
High Risk SMM(Median TTP ~2 years)
Low Risk SMM(~5% per year PD)
To Treat or Not to Treat?
Especially Evolving, or Many high risk
factors