Magnetic Resonance Imaging of the Wrist: Bone and Cartilage Injury Catherine L. Hayter, MBBS Stephanie L. Gold, B.A. Hollis G. Potter, M.D. Quantitative MRI of Articular Cartilage and Its Clinical Applications Xiaojuan Li, Ph.D. Sharmila Majumdar, Ph.D. MRI of Knee Ligament Injury and Reconstruction Nadja A. Farshad-Amacker, M.D. Hollis G. Potter, M.D. SECTION FOR MAGNETIC RESONANCE TECHNOLOGISTS OF THE INTERNATIONAL SOCIETY FOR MAGNETIC RESONANCE IN MEDICINE Home Studies Educational Seminars VOLUME 17 • NUMBER 3 Musculoskeletal MRI: Cartilage and Ligaments SMRT A WORLD OF KNOWLEDGE FOR MR TECHNOLOGISTS & RADIOGRAPHERS Expert Reviewer: Steven P. Shannon, R.T.(R)(MR) SMRT Educational Seminars Editor: Anne Marie Sawyer, B.S., R.T.(R)(MR), FSMRT Chair, SMRT Publications Committee: Vanessa Orchard, DCR(D), PGDip.(NucMed), M.Sc.(MRI)
Transcript
Magnetic Resonance Imaging of the Wrist: Bone and Cartilage Injury
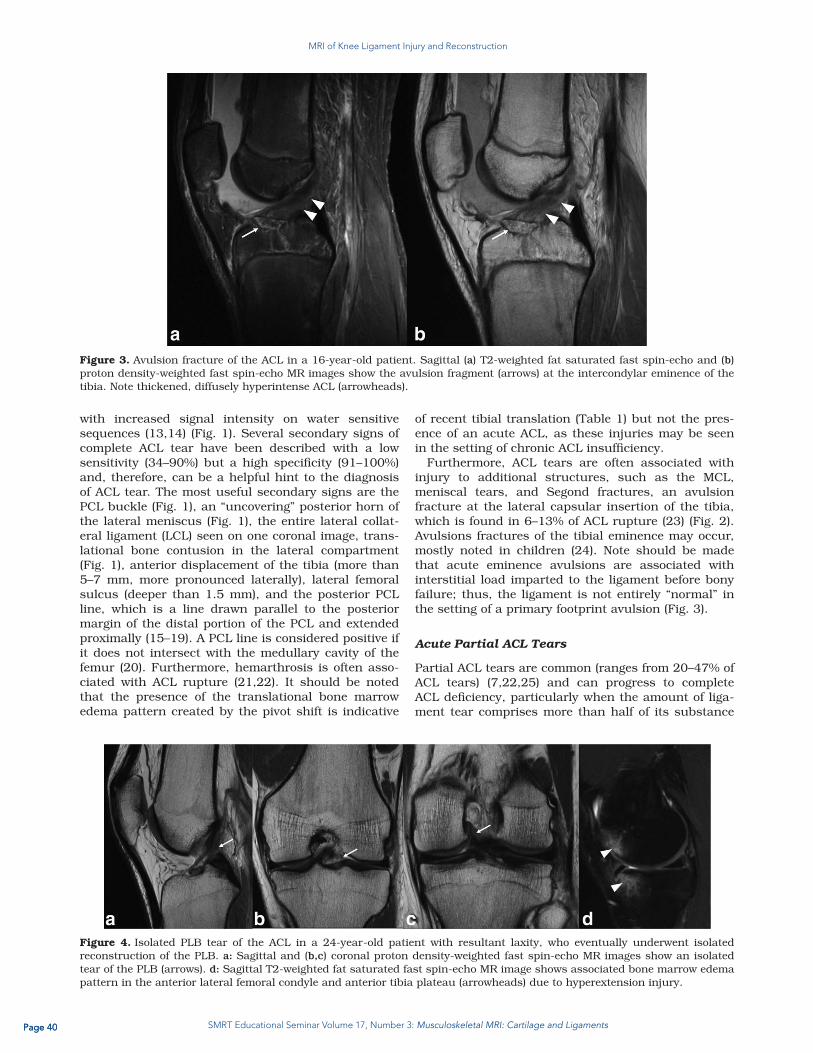
Catherine L. Hayter, MBBS
Stephanie L. Gold, B.A.
Hollis G. Potter, M.D.
Quantitative MRI of Articular Cartilage and Its Clinical Applications
Xiaojuan Li, Ph.D.
Sharmila Majumdar, Ph.D.
MRI of Knee Ligament Injury and Reconstruction
Nadja A. Farshad-Amacker, M.D.
Hollis G. Potter, M.D.
SECTION FOR MAGNETIC RESONANCE TECHNOLOGISTSOF THE INTERNATIONAL SOCIETY FOR MAGNETIC RESONANCE IN MEDICINE
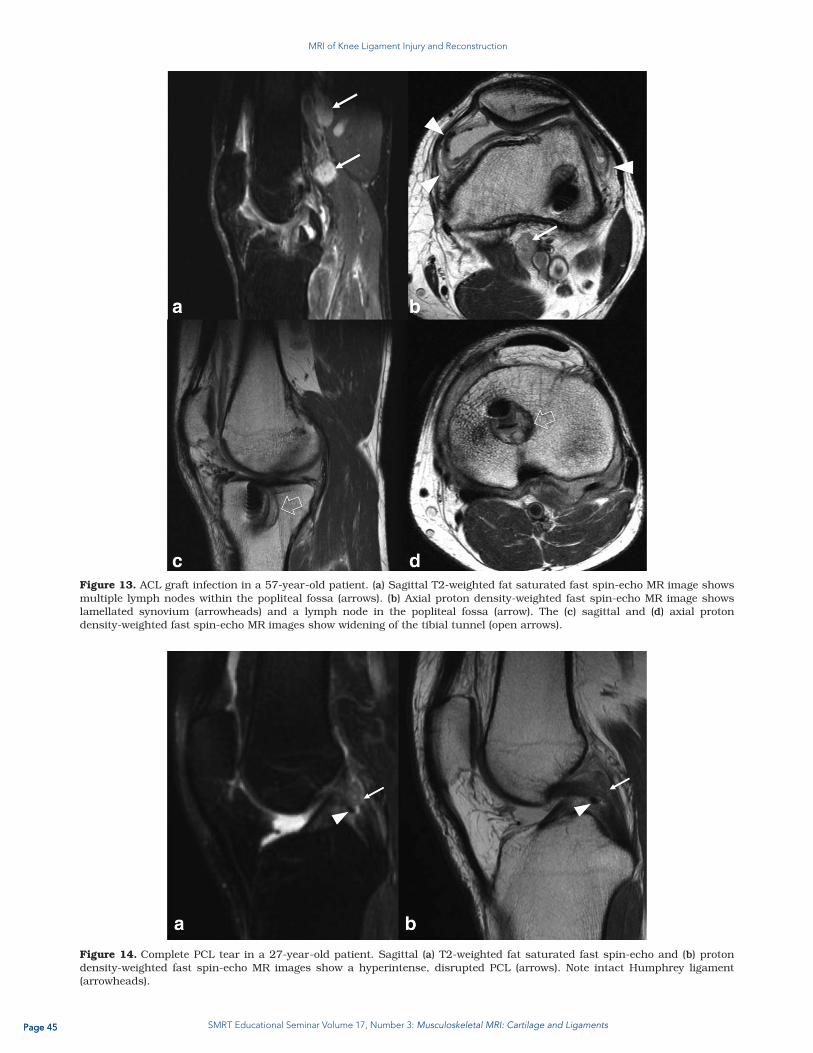
Home Studies Educational SeminarsV O L U M E 1 7 • N U M B E R 3
Musculoskeletal MRI: Cartilage and Ligaments
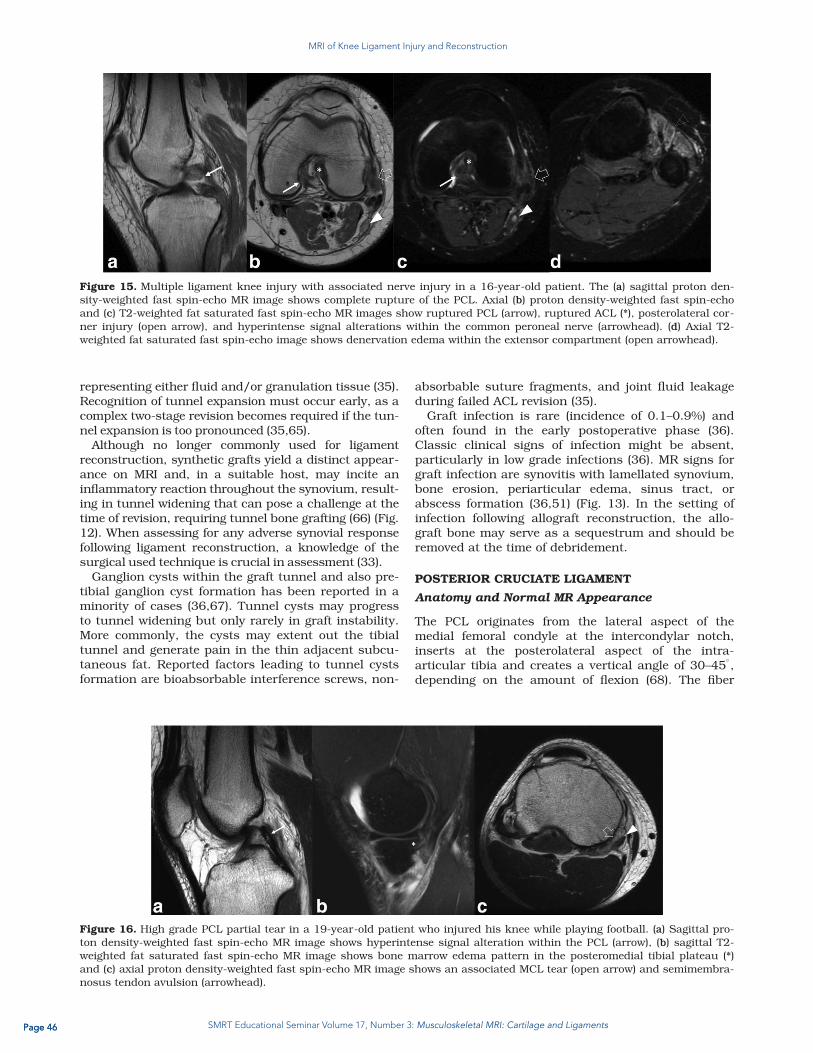
SMRT A W O R L D O F K N O W L E D G EFOR MR TECHNOLOGISTS & RADIOGRAPHERS
Expert Reviewer:Steven P. Shannon, R.T.(R)(MR)
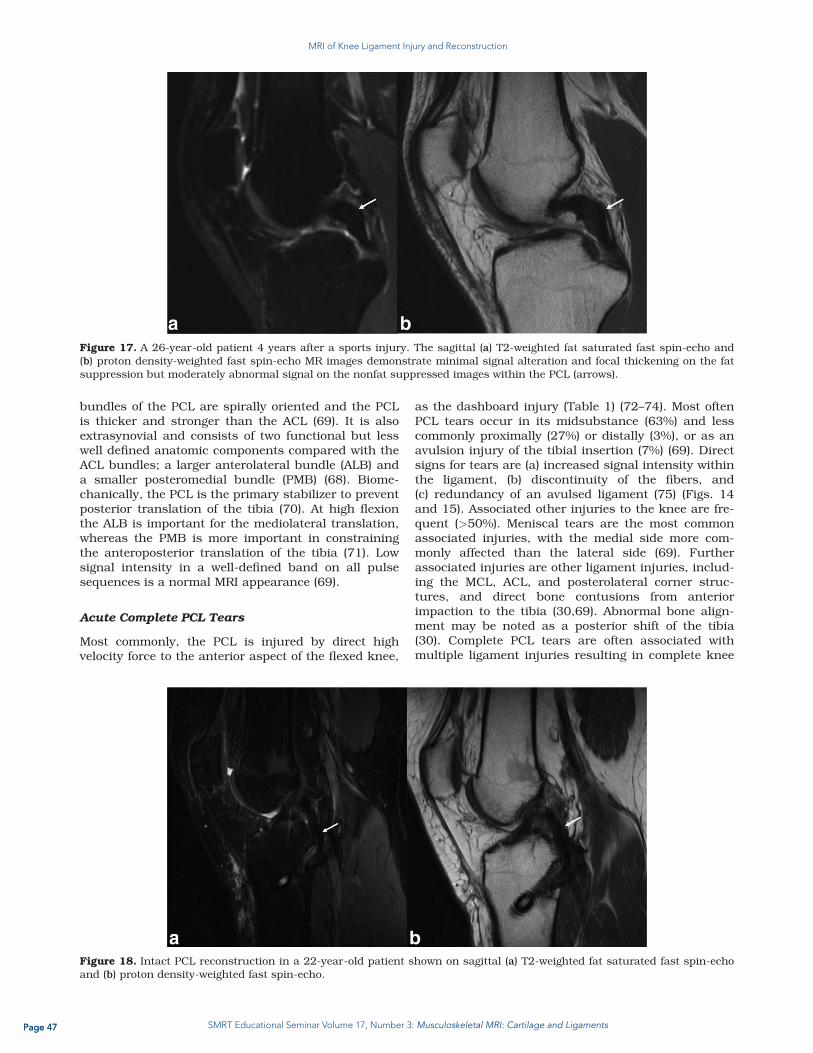
SMRT Educational Seminars Editor:Anne Marie Sawyer, B.S., R.T.(R)(MR), FSMRT
Chair, SMRT Publications Committee:Vanessa Orchard, DCR(D), PGDip.(NucMed), M.Sc.(MRI)
SMRT Educational Seminar Volume 17, Number 3: Musculoskeletal MRI: Cartilage and LigamentsPage 2
We are pleased to present the SMRT Educational Seminars, Volume
17, Number 3: “Musculoskeletal MRI: Cartilage and Ligaments.” This is
the 65th accredited Home Study developed by the SMRT, exclusively
for SMRT members. The accreditation is conducted by the SMRT
acting as a RCEEM (Recognized Continuing Education Evaluation
Mechanism) for the ARRT. Category A credits are assigned to each
Home Study, which can be used to maintain one’s ARRT advanced
registry. SMRT Home Studies are also approved for AIR (Australian
Institute of Radiography), NZIMRT (New Zealand Institute of Radiation
Technology) and CPD Now (The College of Radiographers, United
Kingdom) continuing professional development (CPD) activities.
Three peer-reviewed articles have been chosen
for this home study issue. As introduced in the
first article, “The complex osseous geometry of
the wrist combined with the thin articular carti-
lage, poses challenges for consistent diagnostic
imaging.” The authors outline the “technical
aspects of performing high-resolution MRI of
the wrist. The use of MRI in detecting osseous
pathologies such as occult fractures, osteone-
crosis, and abutment syndromes is discussed.
The role of MRI in assessing articular cartilage
defects and the MRI appearance of osteoarthri-
tis and inflammatory arthropathies is reviewed.”
The authors of the second article tell us “Car-
tilage is one of the most essential tissues for
healthy joint function and is compromised in
degenerative and traumatic joint disease.”
After reviewing cartilage composition and degeneration, methods
are discussed that “grade and quantify morphologic changes as well
as the techniques that quantify changes in the extracellular matrix.”
Given the increasing focus on the wide spread effects of osteoarthritis
(OA), this is an especially timely article as testimony that “quantita-
tive MRI provides noninvasive measures of cartilage degeneration at
the earliest stages of joint degeneration, which is essential for efforts
towards prevention and early intervention of OA.”
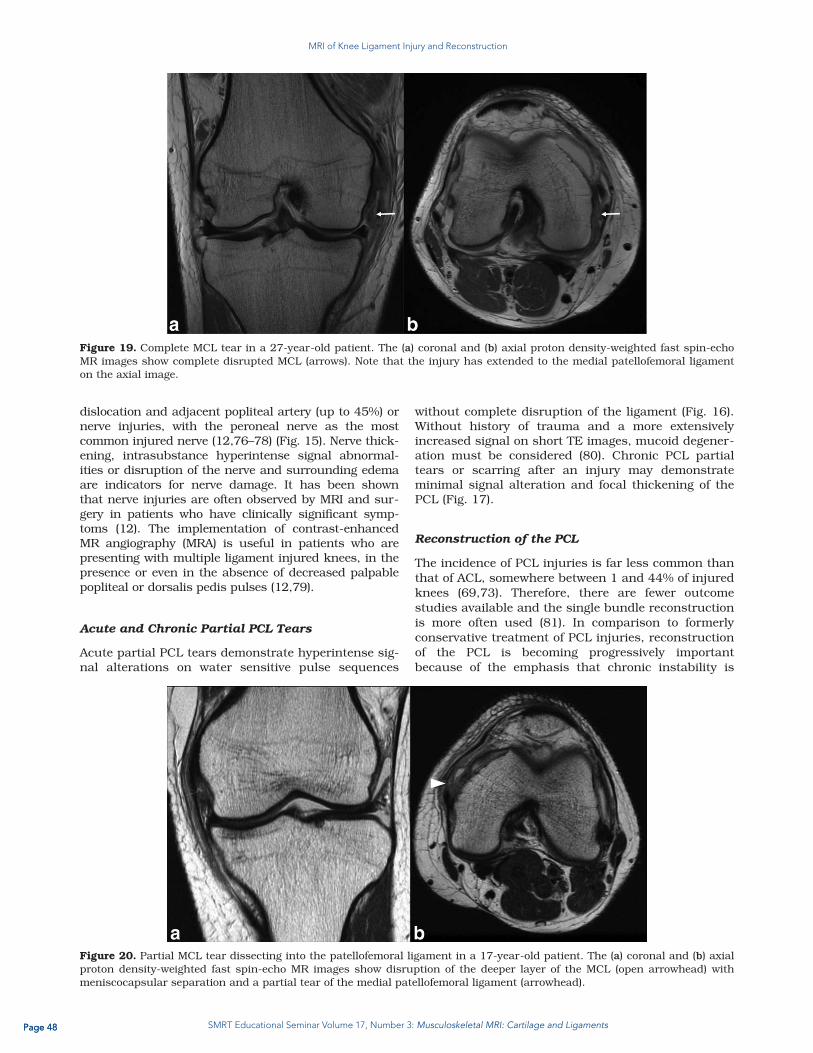
In the third and final article, the authors focus on injury and reconstruc-
tion of ligaments in the knee. “Knee ligament instability may lead
to meniscal and chondral damage, resulting in early osteoarthritis.”
This article aims to provide an understanding of “MRI appearances
of knee ligament structures associated with knee instability, and to
review the common patterns of altered knee mechanics that lead to
ligament failure.”
A special thank you to Steven P. Shannon, R.T.(R)(MR) from Cambridge,
Massachusetts, USA for acting as the Expert Reviewer.
Thanks also to Heidi Berns, M.S., R.T.(R)(MR), FSMRT, Chair of the
SMRT RCEEM Ad-hoc committee from Coralville, Iowa, USA and
all those who participate on this committee by reviewing the home
studies for accreditation. Finally, many thanks
to Jennifer Olson, Associate Executive Direc-
tor; Mary Keydash, Publications Director; Linda
O-Brown, SMRT Coordinator; Sally Moran,
Director of Electronic Communications and
the entire staff in the Berkeley, California, USA
office of the ISMRM and SMRT for their insight
and long hours spent supporting these edu-
cational symposia.
It is with great sadness that I acknowledge
that this particular Home Study is the last issue
that the SMRT Publications Committee, chair
Vanessa Orchard from Scotland and I as the
Home Study sub-committee chair will cre-
ate with Jennifer Olson. Since 1990 Jennifer
has provided enormous support and valu-
able direction for the Technologists’ section
of the ISMRM, the SMRT. Jennifer has been
our non-stop resource to ensure that the SMRT continues to grow
not only their membership, but also their educational offerings for
the membership. She has constantly cultivated ideas on how to
better serve the SMRT members. Jennifer has been relentless when
it comes to providing quality education for MR Technologists and
Radiographers. We will miss her terribly but know that she is off to
a new and rewarding chapter in her life and congratulate her for it.
And thank, thank, thank Jennifer a millions times over for all her hard
work and long hours spent supporting education for MR Technolo-
gists and Radiographers.
Anne Marie Sawyer, B.S., R.T.(R)(MR), FSMRT Home Study ProgramLucas Center for ImagingStanford University, Stanford, California, USAT: +1 650 725 9697E: [email protected]
A Message from the SMRT Educational Seminars Publications Committee
Musculoskeletal MRI: Cartilage and LigamentsJuly 2014
“Quantitative MRI
provides noninvasive
measures of cartilage
degeneration at the
earliest stages of joint
degeneration, which
is essential for efforts
towards prevention and
early intervention of OA.”
Editor, SMRT Educational Seminars, Home Study Program Chair, SMRT Publications Committee
SMRT Educational Seminar Volume 17, Number 3: Musculoskeletal MRI: Cartilage and LigamentsPage 3
Musculoskeletal MRI: Cartilage and Ligaments
Magnetic Resonance Imaging of the Wrist: Bone and Cartilage Injury • Describe technical considerations including coils and
patient positioning, imaging at 3T, and pulse sequences and scan protocols;
• Discuss osseus abnormalities including scaphoid fractures and complications, carpal bone fractures, stress fractures and Gymnast’s Wrist, avascular necrosis, and impaction/impingement syndromes;
• Review cartilage imaging and the SLAC/SNAC wrist including osteoarthritis, and inflammatory arthropathies; and
• Show image examples of osseus abnormalities including fractures, and cartilage imaging to look at osteoarthritis and other inflammatory processes.
Quantitative MRI of Articular Cartilage and Its Clinical Applications• Review cartilage composition and degeneration;
• Describe morphological changes in cartilage in osteoarthritis;
• Discuss quantitative MRI for cartilage matrix composition;
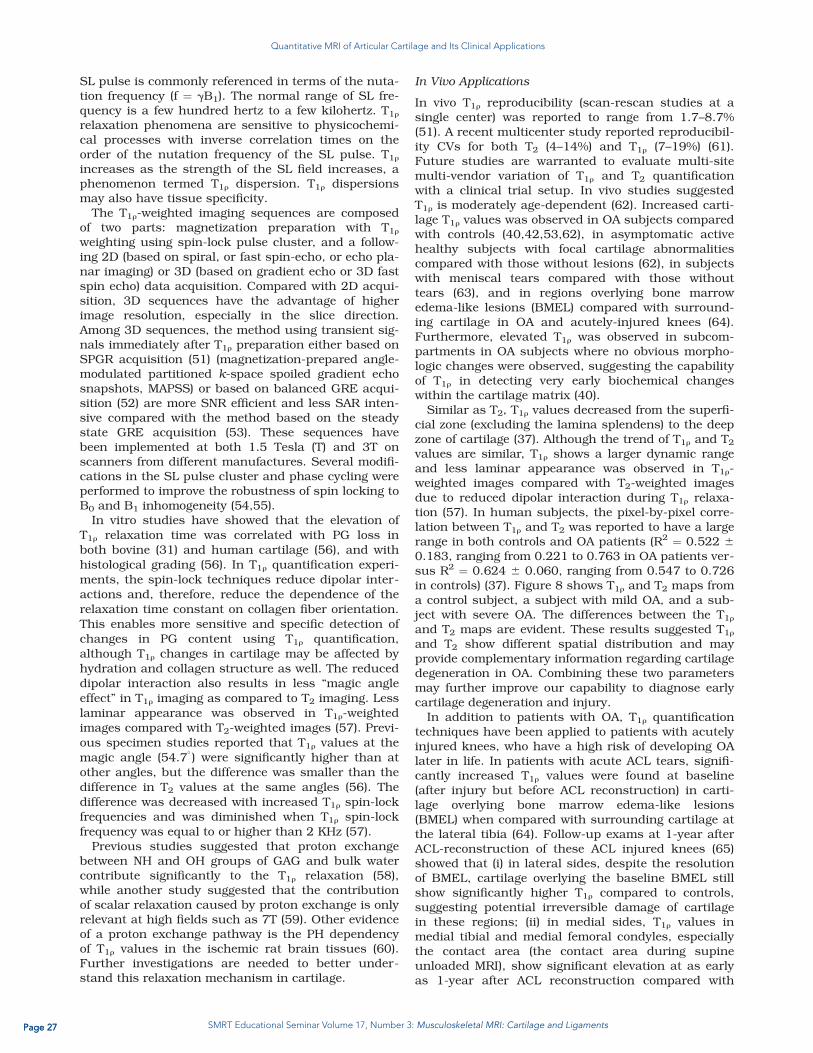
• Explain the use of postcontrast T1 relaxation time by delayed gadolinium-enhanced proton MRI of cartilage;
• Describe T2 relaxation time including basic principles and in vivo applications;
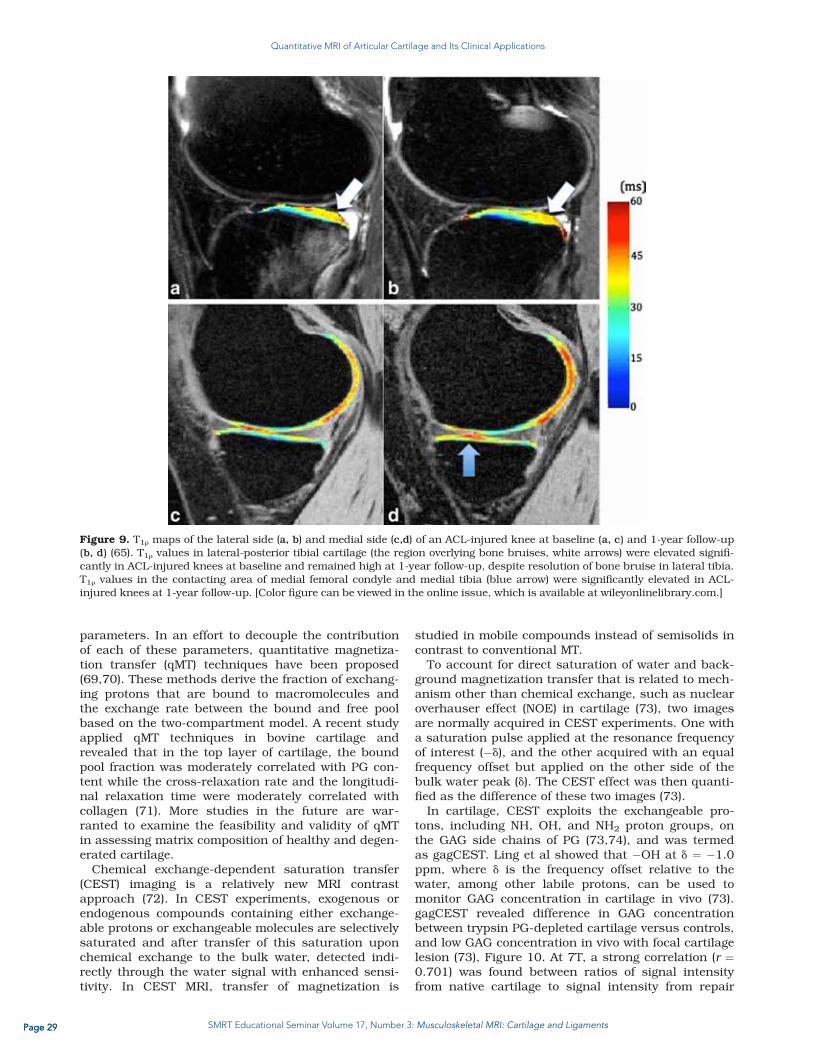
• Review T1r relaxation time quantification including basic principles and in vivo applications;
Expert Reviewer
Educational Objectives
SEC TION FOR MAGNE TIC RESONANCE TECHNOLOGISTS
Home Studies Educational Seminars V O L U M E 1 7 • N U M B E R 3
ENDORSED BY THE COLLEGE OF RADIOGRAPHERS - UNITED KINGDOM Credit levels according to SMRT certificate - Valid 2012 - 2014
CoR Assessment: A combined programme covering a wide range of clinical applications and current issues in MR imaging.
May support outcomes 1-13, 18 and 19 of CPD Now
Steven P. Shannon, RT (R)(MR)Operations Manager/MR Research TechnologistAthinoula A. Martinos Imaging CenterMcGovern Institute for Brain ResearchMassachusetts Institute of TechnologyCambridge, Massachusetts USA
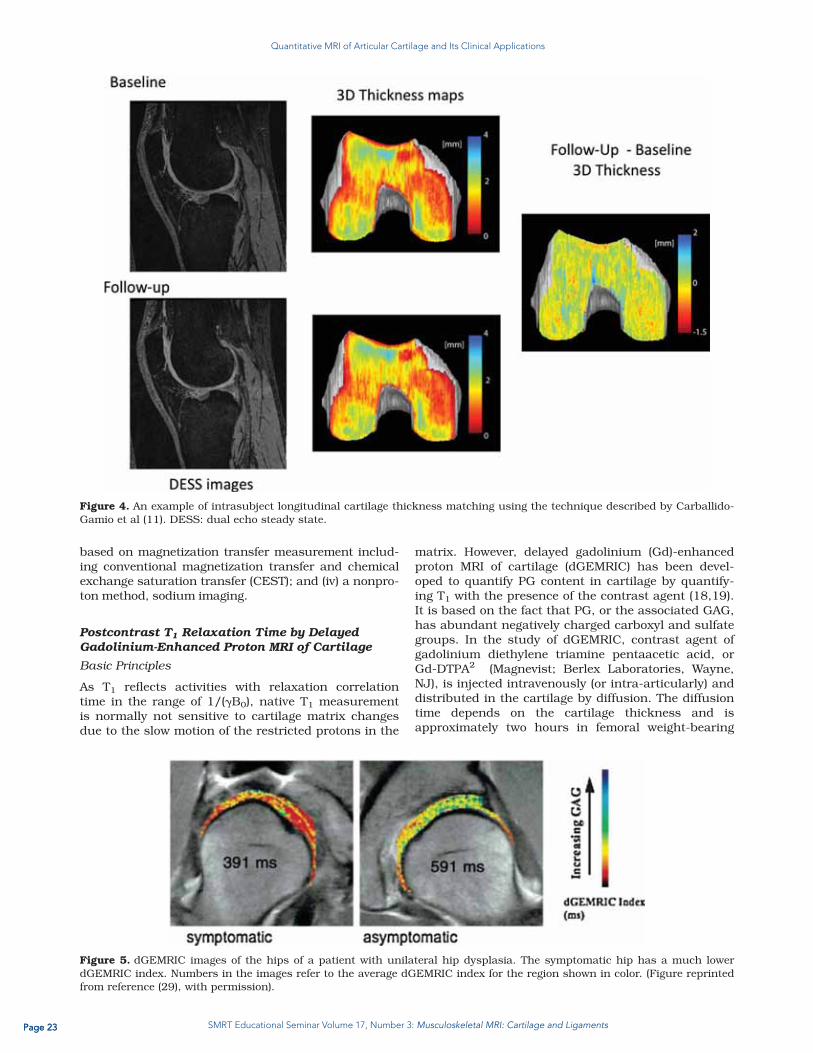
(Quantitative MRI of Articular Cartilage.... continued)
• Discuss other cartilage MR imaging methods including Magnetization Transfer (MT), Chemical Exchange-Dependent Saturation Transfer (CEST), Diffusion, sodium, and Ultra Short Echo (UTE); and
• Show image examples of all acquisition methods, proton and sodium.
MRI of Knee Ligament Injury and Reconstruction• MRI of Knee Ligament Injury and Reconstruction;
• Describe the Anterior Cruciate Ligament (ACL) including anatomy and normal appearance, tears, and ganglion cysts;
• Review reconstruction of the ACL including grafts and complications;
• Discuss the Posterior Cruciate LIgament (PCL) including anatomy and normal appearance, and tears;
• Describe reconstruction of the PCL;
• Review the Medial Collateral Ligament (MCL) including anatomy and normal appearance, pathology, and reconstruction;
• Explain the Posterolateral Corner (PLC) including anatomy and normal appearance, and pathologic appearance; and
• Show image examples of the ACL, PCL and MCl including tears, pathology and post-reconstruction.
NZIMRT APPROVED CPD ACTIVITYSMRT Home Studies, Online Electronic
Studies & Online Video StudiesCredits: 1 per activity, max of 6/yr
Valid: 2014
Page 4 SMRT Educational Seminar Volume 17, Number 3: Musculoskeletal MRI: Cartilage and Ligaments
Magnetic Resonance Imaging of the Wrist: Bone and Cartilage Injury
Magnetic Resonance Imaging of the Wrist:Bone and Cartilage Injury
Catherine L. Hayter, MBBS,1 Stephanie L. Gold, B.A.,1 and Hollis G. Potter, M.D.1,2*
Review
Magnetic Resonance Imaging of the Wrist: Bone andCartilage Injury
Catherine L. Hayter, MBBS,1 Stephanie L. Gold, BA,1 and Hollis G. Potter, MD1,2*
This article is accredited as a journal-based CME activity.If you wish to receive credit for this activity, please refer tothe website: www.wileyhealthlearning.com
ACCREDITATION AND DESIGNATION STATEMENT
Blackwell Futura Media Services designates this journal-based CME activity for a maximum of 1 AMA PRA Category1 CreditTM. Physicians should only claim credit commensu-rate with the extent of their participation in the activity.
Blackwell Futura Media Services is accredited by the Ac-creditation Council for Continuing Medical Education toprovide continuing medical education for physicians.
EDUCATIONAL OBJECTIVES
Upon completion of this educational activity, participantswill be better able to describe the technical aspects of per-forming high-resolution MRI of the wrist.
ACTIVITY DISCLOSURES
No commercial support has been accepted related to thedevelopment or publication of this activity.
Faculty Disclosures:
The following contributors have no conflicts of interest todisclose:
Authors: Catherine L. Hayter, MBBS, Stephanie L. Gold,BA, Hollis G. Potter, MD
This manuscript underwent peer review in line withthe standards of editorial integrity and publication ethics
maintained by Journal of Magnetic Resonance Imaging. Thepeer reviewers have no relevant financial relationships. Thepeer review process for Journal of Magnetic ResonanceImaging is double-blinded. As such, the identities of thereviewers are not disclosed in line with the standardaccepted practices of medical journal peer review.
Conflicts of interest have been identified and resolvedin accordance with Blackwell Futura Media Services’s Policyon Activity Disclosure and Conflict of Interest. No relevant fi-nancial relationships exist for any individual in control of thecontent and therefore there were no conflicts to resolve.
INSTRUCTIONS ON RECEIVING CREDIT
For information on applicability and acceptance of CMEcredit for this activity, please consult your professionallicensing board.
This activity is designed to be completed within an hour;physicians should claim only those credits that reflect thetime actually spent in the activity. To successfully earncredit, participants must complete the activity during thevalid credit period.
Follow these steps to earn credit:
� Log on to www.wileyhealthlearning.com
� Read the target audience, educational objectives, and
activity disclosures.
� Read the article in print or online format.
� Reflect on the article.
� Access the CME Exam, and choose the best answer to
each question.
� Complete the required evaluation component of the
activity.
This activity will be available for CME credit for twelvemonths following its publication date. At that time, it willbe reviewed and potentially updated and extended for anadditional period.
1Department of Radiology and Imaging, Hospital for Special Surgery, New York, New York, USA.2 Weill Cornell Medical College of Cornell University, New York, New York, USA.*Address reprint requests to: H.G.P., Department of Radiology and Imaging, Hospital for Special Surgery, 535 East 70th St., New York, NY10021. E-mail: [email protected] September 16, 2011; Accepted August 29, 2012.DOI 10.1002/jmri.23845View this article online at wileyonlinelibrary.com.
JOURNAL OF MAGNETIC RESONANCE IMAGING 37:1005–1019 (2013)
CME
VC 2012 Wiley Periodicals, Inc. 1005
Page 5 SMRT Educational Seminar Volume 17, Number 3: Musculoskeletal MRI: Cartilage and Ligaments
Magnetic Resonance Imaging of the Wrist: Bone and Cartilage Injury
Magnetic resonance imaging (MRI) is particularly usefulfor imaging the wrist due to its superior soft tissue con-trast and ability to detect subtle bone marrow changesand occult fractures. A high field (1.5T or greater)strength, dedicated wrist coil, and high in-plane andthrough-plane resolution must be utilized to successfullyvisualize the relatively thin cartilage of the wrist. MRI canbe used to detect occult carpal bone fractures, identifycomplications following scaphoid fractures, and assessfor avascular necrosis in the setting in Kienb€ock’s andPreiser’s disease. MRI is useful to identify secondary softtissue and chondral pathology in impaction/impingementsyndromes. The use of an intermediate-echo time fastspin echo sequence allows for accurate assessment ofarticular cartilage, allowing evaluation of chondral wearin the setting of primary osteoarthritis and posttraumaticdegenerative arthrosis. MRI is the most sensitive imagingmodality for the detection of early inflammatory arthropa-thies and can detect synovitis, bone marrow edema, andearly erosions in the setting of negative radiographs.
Key Words: magnetic resonance imaging; wrist; cartilage;ulnar impaction; Kienb€ock’s disease; arthritisJ. Magn. Reson. Imaging 2013;37:1005–1019.VC 2012 Wiley Periodicals, Inc.
THE COMPLEX OSSEOUS GEOMETRY of the wrist,combined with the thin articular cartilage, poses chal-lenges for consistent diagnostic imaging. Due to itssuperior soft tissue contrast, direct multiplanar capa-bilities, and ability to detect subtle bone marrowchanges, magnetic resonance imaging (MRI) is partic-ularly useful for imaging the wrist.
This article outlines the technical aspects of per-forming high-resolution MRI of the wrist. The use ofMRI in detecting osseous pathologies such as occultfractures, osteonecrosis, and abutment syndromes isdiscussed. The role of MRI in assessing articular carti-lage defects and the MRI appearance of osteoarthritisand inflammatory arthropathies is reviewed.
TECHNICAL CONSIDERATIONS
Coils and Patient Positioning
High-quality MRI of the wrist is technically challeng-ing, due to the high spatial resolution and signal-to-noise ratio (SNR) that are required to visualize thesmall structures of the wrist. Use of a high fieldstrength magnet with a dedicated surface coil isessential to achieve adequate SNR (1). A small field ofview (FOV; 8–10 cm) and thin (1–2 mm) contiguoussections are required for adequate assessment, as thecartilage of the wrist is thin and many of the intrinsicwrist ligaments are no more than 1–2 mm thick (2).
It is the authors’ preference to image the wrist withthe arm at the patient’s side, the elbow in extension,and forearm in pronation. This position is comfortableand therefore reduces patient motion. It does, how-ever, place the wrist off-isocenter of the magnet, whichdecreases SNR and makes frequency-selective fat sup-pression techniques more difficult. The alternative isto position the patient in the ‘‘superman position,’’
with the patient prone, the arm above the head andthe hand and forearm pronated. While this positionhas the advantage of placing the wrist closer to themagnet isocenter, it is less comfortable for the patientand increases the chance of patient motion. Elderlypatients and patients with shoulder pain or breathingdifficulties may be unable to tolerate this position.There is also an increased tendency for the wrist todrift into ulnar deviation in this position, which willaffect normal sagittal alignment.
When positioning the patient in the wrist coil, caremust be taken to avoid excessive radial or ulnar devi-ation of the wrist, as this will affect normal sagittalradiolunocapitate alignment. With ulnar deviation ofthe wrist, a pseudo-DISI (dorsal intercalated segmen-tal instability) configuration may be seen on sagittalimages, leading to potential erroneous diagnoses ofcarpal instability patterns (2). Wrist position and gripwill also alter perceived ulnar variance. With the wristin pronation, ulnar positive variance increases;therefore, care should be taken not to diagnose subtleisolated ulnar variance on MRI without radiographiccorrelation (3).
3T Imaging of the Wrist
3T imaging may be used for routine MRI of the wrist(4) and some studies have demonstrated improveddiagnostic accuracy when imaging the wrist ligamentsand the triangular fibrocartilage complex (TFCC) with3T systems compared to 1.5T systems (5). Increasingthe main magnetic field strength (B0) from 1.5T to 3Tdoubles the SNR, allowing an increase in image reso-lution, which can be achieved by decreasing the slicethickness, decreasing the FOV, or increasing the ma-trix. The doubling of SNR at 3T also allows a decreasein acquisition time, or number of excitations (NEX),which directly reduces scan time.
There are, however, offsets to imaging at 3T. Due tothe chemical shift difference between fat and water,imaging at 3T requires the use of a wider receiverbandwidth, which decreases SNR (4). T1 relaxationtimes are longer and T2 relaxation times are shorterat 3T, requiring alterations in pulse sequence parame-ters (6). Susceptibility artifact in the presence of me-tallic hardware or prior surgery is directly propor-tional to B0 and therefore can present significantdifficulty when imaging at 3T. Specific absorption rate(SAR) is also increased, although this is rarely of clini-cal importance in routine wrist imaging using stand-ardized sequences (4).
Pulse Sequences and Suggested Protocols
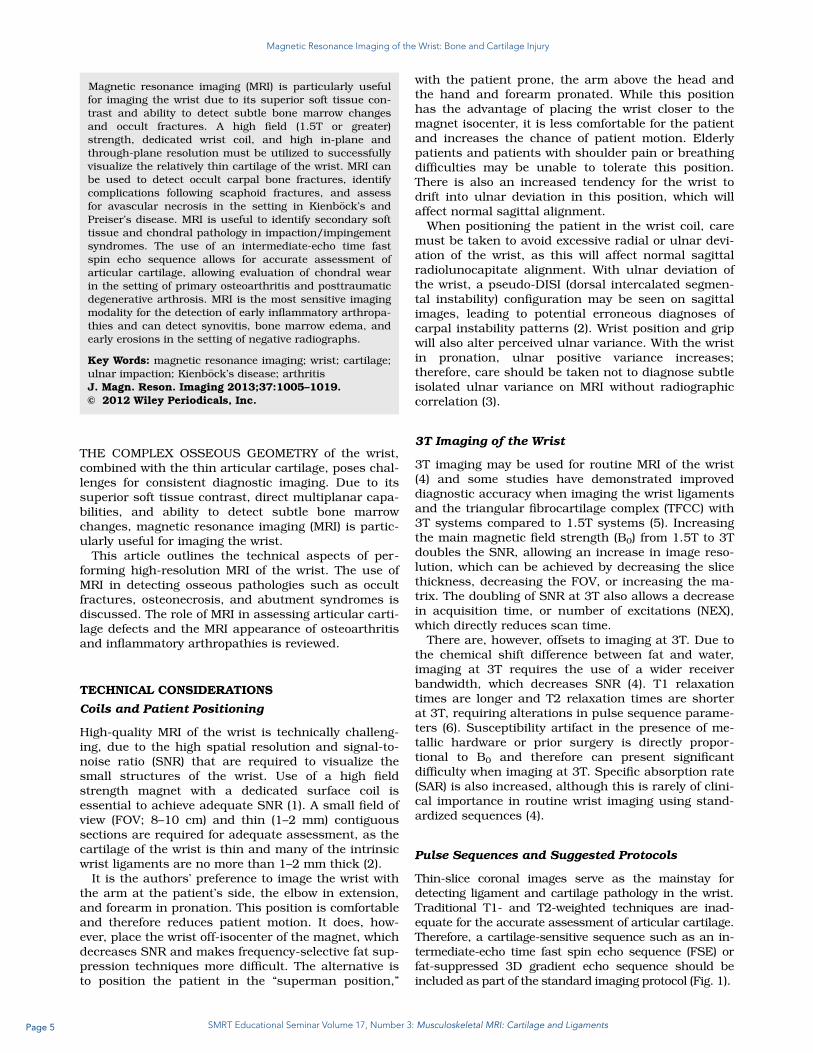
Thin-slice coronal images serve as the mainstay fordetecting ligament and cartilage pathology in the wrist.Traditional T1- and T2-weighted techniques are inad-equate for the accurate assessment of articular cartilage.Therefore, a cartilage-sensitive sequence such as an in-termediate-echo time fast spin echo sequence (FSE) orfat-suppressed 3D gradient echo sequence should beincluded as part of the standard imaging protocol (Fig. 1).
1006 Hayter et al.
Page 6 SMRT Educational Seminar Volume 17, Number 3: Musculoskeletal MRI: Cartilage and Ligaments
Magnetic Resonance Imaging of the Wrist: Bone and Cartilage Injury
Fat-suppressed 3D spoiled or T1-weighted gradientecho images have the advantage of producing thin(0.8–1 mm) contiguous slices (7). This technique,however, requires longer scan times and is limited bymetal-induced susceptibility artifact, which may be aproblem when imaging the postoperative patient. Anintermediate echo time 2D FSE technique providesgood contrast between the intermediate signal inten-sity articular cartilage, the high signal intensity sy-novial fluid, and the low signal intensity subchondralbone (8). Use of an FSE technique with a wide re-ceiver bandwidth minimizes susceptibility artifact,allowing accurate assessment of articular cartilage inthe presence of metallic hardware or debris. 3D-FSE-Cube is an alternative technique that acquires iso-tropic voxels which can be reformatted in any scanplane (9).
At our institution we therefore perform an interme-diate-echo time 2D FSE sequence in three planes, toallow assessment of the articular cartilage and re-gional tendons. A T2*-weighted 3D coronal gradientrecalled sequence is performed, providing thin (1 mm)slice coronal images that allow for detection of intrin-sic ligament and articular disc pathology. In addition,a coronal inversion recovery sequence is performed todetect bone marrow edema in the setting of infection,occult fractures, or bone erosions as well as bone via-bility in the setting of avascular necrosis. An inversionrecovery sequence is preferred over a frequency-selec-tive fat-suppression technique, as this results in moreuniform fat suppression when imaging off isocenterwith the wrist at the patient’s side (1).
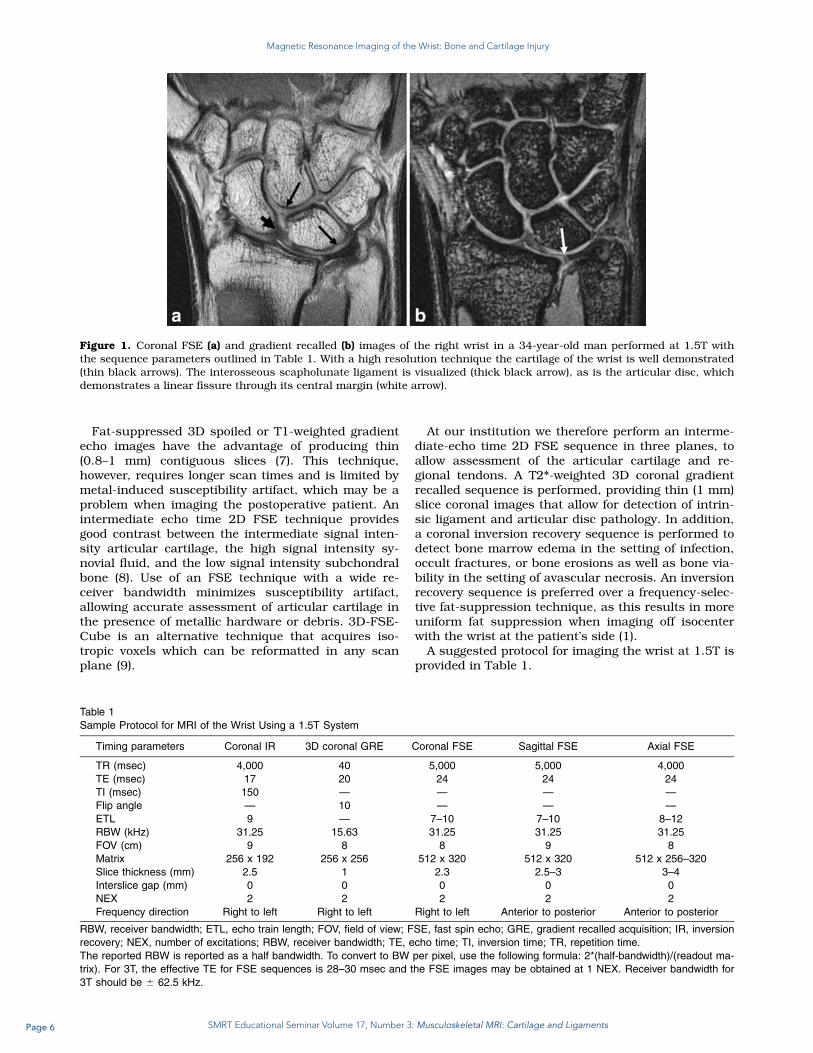
A suggested protocol for imaging the wrist at 1.5T isprovided in Table 1.
Table 1
Sample Protocol for MRI of the Wrist Using a 1.5T System
Timing parameters Coronal IR 3D coronal GRE Coronal FSE Sagittal FSE Axial FSE
TR (msec) 4,000 40 5,000 5,000 4,000
TE (msec) 17 20 24 24 24
TI (msec) 150 — — — —
Flip angle — 10 — — —
ETL 9 — 7–10 7–10 8–12
RBW (kHz) 31.25 15.63 31.25 31.25 31.25
FOV (cm) 9 8 8 9 8
Matrix 256 x 192 256 x 256 512 x 320 512 x 320 512 x 256–320
Slice thickness (mm) 2.5 1 2.3 2.5–3 3–4
Interslice gap (mm) 0 0 0 0 0
NEX 2 2 2 2 2
Frequency direction Right to left Right to left Right to left Anterior to posterior Anterior to posterior
RBW, receiver bandwidth; ETL, echo train length; FOV, field of view; FSE, fast spin echo; GRE, gradient recalled acquisition; IR, inversion
recovery; NEX, number of excitations; RBW, receiver bandwidth; TE, echo time; TI, inversion time; TR, repetition time.
The reported RBW is reported as a half bandwidth. To convert to BW per pixel, use the following formula: 2*(half-bandwidth)/(readout ma-
trix). For 3T, the effective TE for FSE sequences is 28–30 msec and the FSE images may be obtained at 1 NEX. Receiver bandwidth for
3T should be 6 62.5 kHz.
Figure 1. Coronal FSE (a) and gradient recalled (b) images of the right wrist in a 34-year-old man performed at 1.5T withthe sequence parameters outlined in Table 1. With a high resolution technique the cartilage of the wrist is well demonstrated(thin black arrows). The interosseous scapholunate ligament is visualized (thick black arrow), as is the articular disc, whichdemonstrates a linear fissure through its central margin (white arrow).
MRI of Wrist Cartilage 1007
Page 7 SMRT Educational Seminar Volume 17, Number 3: Musculoskeletal MRI: Cartilage and Ligaments
Magnetic Resonance Imaging of the Wrist: Bone and Cartilage Injury
OSSEOUS ABNORMALITIES
Injuries to the wrist and hand are common amongathletes, accounting for 3%–9% of all athletic injuries(10). MRI has been shown to be useful in the evalua-tion of wrist trauma with negative radiographs, partic-ularly with regard to the detection of radiographicallyoccult scaphoid fractures (11). MRI can detect avascu-lar necrosis, which may occur as a complication of ascaphoid fracture or in the absence of a history of dis-crete trauma. MRI is also useful to detect secondarysoft tissue and cartilage pathology in the setting of os-seous abutment syndromes.
Scaphoid Fractures and Complications
The scaphoid is the most commonly fractured carpalbone; injuries to the scaphoid account for 60%–70%of all carpal bone injuries. Approximately one sixth ofscaphoid fractures are radiographically occult at thetime of injury (12,13). Traditional management in thepresence of a clinically suspected scaphoid fracturewith normal radiographs involves treatment with castimmobilization for 2 weeks, followed by repeat clinicalexamination and delayed radiographs (13). However,follow-up radiography has been shown to have a poorsensitivity, reliability, and negative predictive value(14). Additionally, since the true prevalence of frac-tures in this group is less than 10% (15), the majorityof these patients are overtreated.
It is therefore increasingly common for MRI to bethe next investigation in the work-up of patients witha clinically suspected scaphoid fracture and normalradiographs. MRI is highly accurate for confirming orexcluding the diagnosis of scaphoid fracture (11) andhas a 100% negative predictive value in the immatureskeleton (16). MRI has been shown to be a cost-effec-tive method for ruling out occult fractures and bonecontusions, thereby avoiding unnecessary immobiliza-tion, follow-up appointments, and radiation exposure(17). MRI can detect additional soft tissue injuriesand can diagnose injury to the intrinsic or extrinsic
ligaments of the wrist, which can mimic a scaphoidfracture on clinical examination (18).
On MRI, an acute fracture is seen as a low signalintensity line extending across the bone with an adja-cent marrow edema pattern. High spatial resolutionwill help to identify more subtle fracture lines. A bonecontusion, which is sometimes referred to as a ‘‘bonebruise,’’ represents an injury to the trabeculae withoutevidence of a discrete fracture (19). On MRI, a bonecontusion manifests as a bone marrow edema pat-tern, without a discernable fracture line.
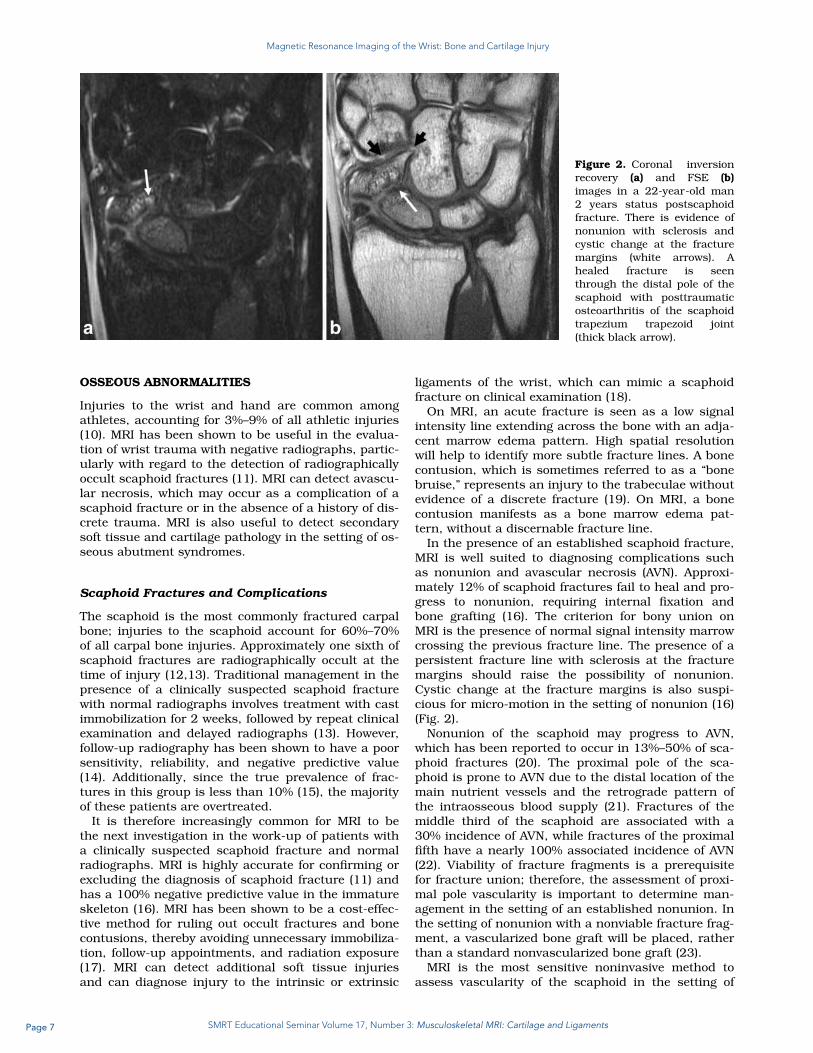
In the presence of an established scaphoid fracture,MRI is well suited to diagnosing complications suchas nonunion and avascular necrosis (AVN). Approxi-mately 12% of scaphoid fractures fail to heal and pro-gress to nonunion, requiring internal fixation andbone grafting (16). The criterion for bony union onMRI is the presence of normal signal intensity marrowcrossing the previous fracture line. The presence of apersistent fracture line with sclerosis at the fracturemargins should raise the possibility of nonunion.Cystic change at the fracture margins is also suspi-cious for micro-motion in the setting of nonunion (16)(Fig. 2).
Nonunion of the scaphoid may progress to AVN,which has been reported to occur in 13%–50% of sca-phoid fractures (20). The proximal pole of the sca-phoid is prone to AVN due to the distal location of themain nutrient vessels and the retrograde pattern ofthe intraosseous blood supply (21). Fractures of themiddle third of the scaphoid are associated with a30% incidence of AVN, while fractures of the proximalfifth have a nearly 100% associated incidence of AVN(22). Viability of fracture fragments is a prerequisitefor fracture union; therefore, the assessment of proxi-mal pole vascularity is important to determine man-agement in the setting of an established nonunion. Inthe setting of nonunion with a nonviable fracture frag-ment, a vascularized bone graft will be placed, ratherthan a standard nonvascularized bone graft (23).
MRI is the most sensitive noninvasive method toassess vascularity of the scaphoid in the setting of
Figure 2. Coronal inversionrecovery (a) and FSE (b)images in a 22-year-old man2 years status postscaphoidfracture. There is evidence ofnonunion with sclerosis andcystic change at the fracturemargins (white arrows). Ahealed fracture is seenthrough the distal pole of thescaphoid with posttraumaticosteoarthritis of the scaphoidtrapezium trapezoid joint(thick black arrow).
1008 Hayter et al.
Page 8 SMRT Educational Seminar Volume 17, Number 3: Musculoskeletal MRI: Cartilage and Ligaments
Magnetic Resonance Imaging of the Wrist: Bone and Cartilage Injury
suspected AVN (Fig. 3). Low signal abnormality in theproximal pole of the scaphoid on T1-weighted sequen-ces alone is nonspecific and may reflect necrosis, is-chemia, or viable bone (24,25). However, the presenceof low signal intensity on all pulse sequences indi-cates poor vascularity and is highly predictive of AVN(21,26). Some authors have reported that gadolinium-enhanced MRI is more accurate for the detection ofproximal pole AVN (25); however, this result has beendisputed by other studies (20,27). We therefore do notroutinely perform gadolinium-enhanced imagingwhen assessing for posttraumatic AVN.
In the presence of metallic hardware, FSE imagesperformed with a high receiver bandwidth, combinedwith STIR images, allow accurate assessment of proxi-mal pole viability. MRI is also useful to assess for
encroachment of cannulated screws on the radiosca-phoid or scaphoid trapezium joints, as well as the in-tegrity of the overlying cartilage (Fig. 4). When imagingthe postoperative wrist, gradient echo techniques,which lack the 180� refocusing pulse found in FSEsequences, should be avoided. Inversion recoverysequences are preferred over frequency-selective fatsuppression, as these sequences are less susceptible tolocal field inhomogeneities in the presence of metallichardware. Additional prototype sequence may also beemployed to further reduce susceptibility artifact (28).
Carpal Bone Fractures
Other radiographically occult wrist fractures mayalso be diagnosed on MRI and the utility of MRI in
Figure 3. Coronal inversionrecovery (a) and FSE (b)images in a 29-year-old manwith an established nonunionof the scaphoid (black arrow).The proximal fragment is lowsignal intensity on FSEimages but demonstrates abone marrow edema patternon the inversion recoveryimage (white arrow), suggest-ing that the proximal frag-ment is ischemic but there isno completely devitalizedbone.
Figure 4. Coronal inversion recovery (a) and FSE (b) images in a 26-year-old woman 5 months status postinternal fixationof a scaphoid mid-waist fracture. There is ischemia of the proximal fracture fragment, without completely devitalized bone(thin white arrow). The screw penetrates through the distal pole of the scaphoid (thick black arrow), resulting in a bone mar-row edema pattern in the trapezium and secondary degenerative arthrosis of the scaphoid trapezium joint (thick whitearrows).
MRI of Wrist Cartilage 1009
Page 9 SMRT Educational Seminar Volume 17, Number 3: Musculoskeletal MRI: Cartilage and Ligaments
Magnetic Resonance Imaging of the Wrist: Bone and Cartilage Injury
diagnosing occult wrist fractures is well established.Many carpal fractures are difficult to diagnose radio-graphically, even with the use of specialized views.
Hamate fractures are uncommon, accounting for1.7% of all carpal fractures, but are usually nondis-placed and difficult to diagnose radiographically. Mosthamate fractures involve the hook of the hamate andtypically result from baseball impaction, direct impactof the handle of a racket during racket sports (29), orby striking the ground with a golf club (30). Fracturesof the body of the hamate are much more uncommonand may be caused by an axial force transmittedthrough the metacarpals or by a direct blow to the ul-nar side of the wrist (29).
The radiographic assessment of the hamate ischallenging since routine PA and lateral views of thewrist rarely demonstrate the fracture. Although addi-tional views such as oblique lateral and carpal tun-nel views may disclose a fracture and in the settingof negative radiographs, MRI is extremely useful todiagnose an occult fracture (31) (Fig. 5). Hook ofhamate fractures can be associated with damage tothe adjacent ulnar neurovascular bundle; MRI isable to accurately detect signal abnormality withinthe ulnar nerve in this setting. MR angiography canbe used to detect pseudoaneurysm formation orocclusion in the setting of suspected ulnar arterydamage.
Pisiform fractures may result from direct trauma ormay be secondary to avulsion, when contraction ofthe flexor carpi ulnaris tendon occurs in the setting offorcible hyperextension of the wrist (32). Pisiformfractures are commonly associated with other injuriesto the carpus or distal radius (33). MRI can detectoccult pisiform fractures and assess the overlyingcartilage for evidence of chondral shear. Associatedbony and soft tissue injuries are also well depictedwith MRI.
Stress Fractures and Gymnast’s Wrist
Stress fractures, also known as fatigue fractures,occur when repetitive stress is applied to normalbone. Although stress fractures are more commonlyseen in the weight-bearing parts of the skeleton,stress fractures have, on occasion, been described inthe wrist. Scaphoid stress fractures have beenreported in activities that involve repeated wrist dorsi-flexion, such as shot putting and gymnastics (34).There have also been case reports of stress fracturesinvolving the hook of the hamate in racket sports (35),the triquetrum in break-dancing (36), and the pisi-form in volleyball (37). MRI of a stress reaction mani-fests as a bone marrow edema pattern with adjacentperiosteal and soft tissue edema. If untreated, a stressreaction may progress to a stress fracture, whichmanifests as a low signal fracture line or corticalbreach (30).
Chronic stress across the distal radial growth plateis a particular type of stress injury that has beenalmost exclusively described in young gymnasts (38).The condition is commonly bilateral. During gymnas-tics, the upper extremity is used for weight bearing,which results in compressive forces across the distalradial physis. In many cases, rotational forces arealso involved, resulting in additional shear stressacross the growth plate (39). Distal radial epiphysioly-sis or ‘‘gymnast’s wrist’’ is therefore thought to repre-sent a Salter Harris 1 type microfracture, due to re-petitive compressive forces of the distal radial growthplate (40).
Temporary ischemia across the zone of provisionalcalcification may result in a ‘‘pseudo-rickets’’ appear-ance on conventional radiographs, with metaphysealirregularity and widening of the growth plate. MRIfindings in ‘‘gymnast’s wrist’’ include widening,increased signal, and irregularity of the distal radial
Figure 5. Coronal inversion recovery (a) and coronal (b) and sagittal (c) FSE images in a 20-year-old woman with ongoingpain 1 month status postwrist injury. Previous radiographs were negative. There is a nondisplaced fracture of the hook of thehamate with a mild reactive bone marrow edema pattern (white arrow).
1010 Hayter et al.
Page 10 SMRT Educational Seminar Volume 17, Number 3: Musculoskeletal MRI: Cartilage and Ligaments
Magnetic Resonance Imaging of the Wrist: Bone and Cartilage Injury
growth plate (Fig. 6). Tongues of physeal cartilagemay be seen extending into the metaphysis (39). Inthe setting of substantial injury to the distal radialphysis, premature physeal closure may result, leadingto a shortened radius (41).
Avascular Necrosis
Avascular necrosis may occur in the setting oftrauma, such as following a scaphoid fracture, or maybe idiopathic, in the setting of Kienb€ock’s or Preiser’sdisease (42).
Kienb€ock’s Disease
Kienb€ock’s disease is a form of osteonecrosis thataffects the lunate and is of uncertain etiology. It mostcommonly occurs in the dominant hand of male man-ual workers between the ages of 20 and 40 years (43).The condition is usually unilateral. Clinically, patientspresent with dorsal or ulnar side wrist pain, associ-ated with a decreased range of movement and adecrease in grip strength (44). Although the cause ofKienb€ock’s disease remains unknown, there is anassociation with negative ulnar variance, which hasbeen observed to occur in 78% of patients withKienb€ock’s disease, compared with 23% of the normalpopulation (45).
Kienb€ock’s disease can be classified into fourstages, which were initially described by Lichtman etal (46). In stage I disease, radiographs are normal butMRI demonstrates focal or diffuse signal abnormalitywithin the lunate. In stage II, the lunate exhibitsincreased density on radiographs and appears as lowsignal intensity on T1-weighted images with patchyareas of high signal intensity on fluid-sensitivesequences. In stage III there is collapse of the lunate,allowing proximal migration of the capitate. Stage IIImay be subclassified into stage IIIA, where there is nocarpal collapse and the scaphoid maintains a normal
position; and stage IIIB, where there is diminishedcarpal height and fixed palmar flexion of the sca-phoid. Stage IV is characterized by degenerativearthrosis of the radiocarpal joint in the setting of acollapsed necrotic lunate (47,48).
MRI is useful in the early stages of Kienb€ock’s dis-ease when radiographs may be normal. In establishedKienb€ock’s disease, MRI is helpful to detect subchon-dral collapse and the integrity of the cartilage over theproximal and mid carpal rows, which may alter surgi-cal management (Fig. 7).
It is important to note that there are other condi-tions which may result in a bone marrow edema pat-tern within the lunate; therefore, increased signalintensity within the lunate should not always beascribed to Kienb€ock’s disease. Intraosseous ganglioncysts are relatively common in the carpal bones andoften occur along ligamentous attachments; they aretherefore frequently seen within the lunate adjacent tothe attachment of the interosseous scapholunate andlunotriquetral ligaments. The high signal cysts, whichmay on occasion elicit a surrounding stress reaction,should not be misinterpreted as Kienb€ock’s disease(2). Ulnolunate impaction syndrome may also cause abone marrow edema pattern in the lunate, which maymimic Kienb€ock’s disease. However, in contrast toKienb€ock’s disease, where the signal abnormalitybegins in the proximal radial aspect of the lunate,ulnolunate impaction syndrome will affect the proxi-mal ulnar aspect of the lunate and is associated withpositive ulnar variance and abnormalities of theTFCC (2,3).
Preiser’s Disease
Preiser’s disease refers to osteonecrosis of thescaphoid in the absence of a prior scaphoid fracture(Fig. 8). Preiser’s disease was initially thought to beidiopathic. It is now believed to be linked to defectivepatterns of vascularity of the proximal pole of the
Figure 6. Coronal inversionrecovery (a) and FSE (b)images in an 11-year-old girldemonstrates features of‘‘gymnast’s wrist.’’ There isincreased signal intensity atthe distal radial metaphysis(white arrow) with wideningand irregularity of the growthplate (black arrow).
MRI of Wrist Cartilage 1011
Page 11 SMRT Educational Seminar Volume 17, Number 3: Musculoskeletal MRI: Cartilage and Ligaments
Magnetic Resonance Imaging of the Wrist: Bone and Cartilage Injury
scaphoid and can be seen in association with repeti-tive microtrauma or as a complication of drug therapy(16).
MRI is the modality of choice to diagnose Preiser’sdisease. Two distinct patterns of Preiser’s diseasehave been described on MRI (49). Type 1 disease ischaracterized by signal abnormality that affects theentire scaphoid. These patients have a propensity forprogression towards degenerative arthrosis. Type IIdisease is characterized by signal abnormality in 50%or less of the scaphoid, and are associated with a bet-ter prognosis.
Impaction/Impingement Syndromes
A number of impaction and impingement syndromeshave been described. Although these conditions areusually diagnosed with clinical assessment and plainradiographs, MRI is helpful to confirm the diagnosisas well as assess for associated chondral wear, bone
marrow edema, and associated soft tissue injuries(50).
Ulnolunate Abutment Syndrome
Ulnolunate abutment syndrome, also known as ulnarimpaction syndrome, is a degenerative condition ofthe ulnar side of the wrist which occurs in the settingof positive ulnar variance. Positive ulnar variance maybe congenital or due to malunion of a distal radialfracture or prior radial head resection. The result isthat excessive load is imparted to the ulnar carpus,TFCC, and ulnar head. Patients present with ulnar-sided wrist pain which is exacerbated by maneuversthat increase ulnar variance, such as forearm prona-tion, ulnar deviation, and power grip (51).
Impaction between the distal ulna and ulnar carpusleads to a continuum of pathologic changes, usuallycommencing with a degenerative tear of the TFCC, fol-lowed by cartilage wear over the lunate, triquetrum,and distal ulna. Degenerative tears of the
Figure 7. Coronal inversionrecovery (a) and FSE (b)images in a 69-year-old man.There is a bone marrowedema pattern in the lunatedue to Kienb€ock’s disease(thick arrow). The proximal ul-nar margin of the lunate ishypointense on all pulsesequences (thin arrow) with asubchondral fracture (doublearrow), indicative of com-pletely devitalized bone.
Figure 8. Coronal inversionrecovery (a) and FSE (b)images in a 39-year-old mandemonstrate an intense bonemarrow edema pattern in thescaphoid (black arrow) withevidence of avascular necrosisof the proximal pole (whitearrow). No fracture is visibleand the patient denied a his-tory of discrete trauma. Thefindings are indicative of Pre-iser’s disease.
1012 Hayter et al.
Page 12 SMRT Educational Seminar Volume 17, Number 3: Musculoskeletal MRI: Cartilage and Ligaments
Magnetic Resonance Imaging of the Wrist: Bone and Cartilage Injury
interosseous lunotriquetral ligament may occur.Finally, degenerative arthrosis of the ulnocarpal anddistal radioulnar joints may result (52).
MRI demonstrates increased signal intensity in thedistal ulna and the ulnar aspect of the lunate (53).Subchondral cyst formation and sclerosis may occur.MRI allows assessment of the TFCC for tears, as wellas the integrity of the overlying cartilage of the lunate,triquetrum, and distal ulna (54) (Fig. 9). The choice oftreatment for ulnolunate impaction will depend on thecause of abutment and the integrity of the cartilageover the proximal carpal row and distal radioulnarjoint; therefore, these chondral surfaces should beclosely scrutinized on MR images.
Ulnar Styloid Impingement
Ulnar styloid impingement is due to an excessivelylong ulnar styloid process or a nonunited styloid pro-cess fracture, which impacts on the triquetrum (55).This may result in cartilage wear over the proximaltriquetrum and can lead to eventual lunotriquetraljoint instability.
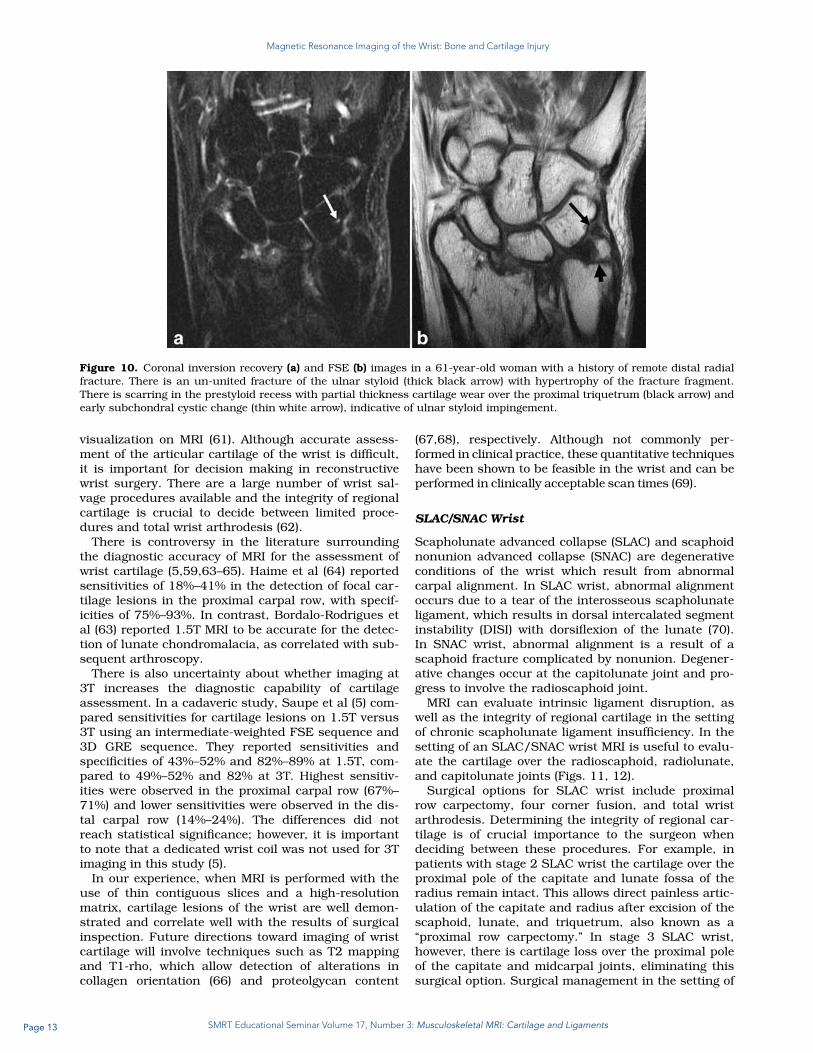
Radiographs may demonstrate an excessively longulnar styloid (greater than 6 mm), a curved ulnar sty-loid, or a nonunited styloid process fracture. MRI isuseful to demonstrate secondary changes of ulnar sty-loid impingement, such as cartilage defects over theproximal triquetrum as well as bone marrow edema,subchondral cysts, and sclerosis in the triquetrum orulnar styloid (50) (Fig. 10). Treatment for styloidimpingement involves resection of all but the proximal2 mm of the ulnar styloid, thus preserving the integ-rity of the TFCC attachments (55).
Ulnar Impingement Syndrome
Ulnar impingement syndrome occurs in associationwith negative ulnar variance, which may be congenital
or due to previous trauma or surgery (56). The short-ened ulnar impinges on the distal radius and canresult in a painful pseudarthrosis with the distal ra-dius. Patients present with ulnar-sided wrist pain,which is exaggerated by forearm pronation andsupination.
Radiographs demonstrate a shortened ulna, whicharticulates proximal to the sigmoid notch of the radius,and may demonstrate scalloping, sclerosis, and hyper-trophy at the site of impingement (54,56). MRI is usefulin the setting of suspected ulnar impingement syn-drome to demonstrate associated bone marrow edema,subchondral marrow changes, and early sclerosis.
Hamatolunate Impaction
The presence of a hamate-lunate facet, also known asa type II lunate, is an anatomic variant with areported incidence of 44%–77% (57). While the major-ity of the patients are asymptomatic, the presence ofthe additional facet is thought to predispose toimpingement of the hamate by the lunate when thewrist is in ulnar deviation (58). A type II lunate isassociated with a higher prevalence of cartilage wearover the proximal pole of the hamate (59,60). In onestudy, arthrosis of the proximal pole of the hamatewas reported in 38% of cadavers with a type II lunate,compared with 1.8% of those with a type I lunate (59).
A type II lunate is usually diagnosed on conven-tional radiographs. MRI is useful in this setting todemonstrate secondary cartilage wear over the proxi-mal pole of the hamate as well as subchondral sclero-sis and associated bone marrow edema.
CARTILAGE IMAGING
The hyaline cartilage of the radiocarpal and intercar-pal joints is relatively thin, proving a challenge for
Figure 9. Coronal inversion recovery (a) and FSE (b) images in a 56-year-old woman demonstrate a bone marrow edema pat-tern in the lunate with subchondral cyst formation at the ulnar proximal margin (thick white arrow). There is a degenerativecentral defect of the articular disc (black arrow). Hyperintense cartilage is seen over the proximal ulnar margin of the lunate(thin white arrow). Radiographs confirmed positive ulnar variance. The features are indicative of ulnolunate abutmentsyndrome.
MRI of Wrist Cartilage 1013
Page 13 SMRT Educational Seminar Volume 17, Number 3: Musculoskeletal MRI: Cartilage and Ligaments
Magnetic Resonance Imaging of the Wrist: Bone and Cartilage Injury
visualization on MRI (61). Although accurate assess-ment of the articular cartilage of the wrist is difficult,it is important for decision making in reconstructivewrist surgery. There are a large number of wrist sal-vage procedures available and the integrity of regionalcartilage is crucial to decide between limited proce-dures and total wrist arthrodesis (62).
There is controversy in the literature surroundingthe diagnostic accuracy of MRI for the assessment ofwrist cartilage (5,59,63–65). Haime et al (64) reportedsensitivities of 18%–41% in the detection of focal car-tilage lesions in the proximal carpal row, with specif-icities of 75%–93%. In contrast, Bordalo-Rodrigues etal (63) reported 1.5T MRI to be accurate for the detec-tion of lunate chondromalacia, as correlated with sub-sequent arthroscopy.
There is also uncertainty about whether imaging at3T increases the diagnostic capability of cartilageassessment. In a cadaveric study, Saupe et al (5) com-pared sensitivities for cartilage lesions on 1.5T versus3T using an intermediate-weighted FSE sequence and3D GRE sequence. They reported sensitivities andspecificities of 43%–52% and 82%–89% at 1.5T, com-pared to 49%–52% and 82% at 3T. Highest sensitiv-ities were observed in the proximal carpal row (67%–71%) and lower sensitivities were observed in the dis-tal carpal row (14%–24%). The differences did notreach statistical significance; however, it is importantto note that a dedicated wrist coil was not used for 3Timaging in this study (5).
In our experience, when MRI is performed with theuse of thin contiguous slices and a high-resolutionmatrix, cartilage lesions of the wrist are well demon-strated and correlate well with the results of surgicalinspection. Future directions toward imaging of wristcartilage will involve techniques such as T2 mappingand T1-rho, which allow detection of alterations incollagen orientation (66) and proteolgycan content
(67,68), respectively. Although not commonly per-formed in clinical practice, these quantitative techniqueshave been shown to be feasible in the wrist and can beperformed in clinically acceptable scan times (69).
SLAC/SNAC Wrist
Scapholunate advanced collapse (SLAC) and scaphoidnonunion advanced collapse (SNAC) are degenerativeconditions of the wrist which result from abnormalcarpal alignment. In SLAC wrist, abnormal alignmentoccurs due to a tear of the interosseous scapholunateligament, which results in dorsal intercalated segmentinstability (DISI) with dorsiflexion of the lunate (70).In SNAC wrist, abnormal alignment is a result of ascaphoid fracture complicated by nonunion. Degener-ative changes occur at the capitolunate joint and pro-gress to involve the radioscaphoid joint.
MRI can evaluate intrinsic ligament disruption, aswell as the integrity of regional cartilage in the settingof chronic scapholunate ligament insufficiency. In thesetting of an SLAC/SNAC wrist MRI is useful to evalu-ate the cartilage over the radioscaphoid, radiolunate,and capitolunate joints (Figs. 11, 12).
Surgical options for SLAC wrist include proximalrow carpectomy, four corner fusion, and total wristarthrodesis. Determining the integrity of regional car-tilage is of crucial importance to the surgeon whendeciding between these procedures. For example, inpatients with stage 2 SLAC wrist the cartilage over theproximal pole of the capitate and lunate fossa of theradius remain intact. This allows direct painless artic-ulation of the capitate and radius after excision of thescaphoid, lunate, and triquetrum, also known as a‘‘proximal row carpectomy.’’ In stage 3 SLAC wrist,however, there is cartilage loss over the proximal poleof the capitate and midcarpal joints, eliminating thissurgical option. Surgical management in the setting of
Figure 10. Coronal inversion recovery (a) and FSE (b) images in a 61-year-old woman with a history of remote distal radialfracture. There is an un-united fracture of the ulnar styloid (thick black arrow) with hypertrophy of the fracture fragment.There is scarring in the prestyloid recess with partial thickness cartilage wear over the proximal triquetrum (black arrow) andearly subchondral cystic change (thin white arrow), indicative of ulnar styloid impingement.
1014 Hayter et al.
Page 14 SMRT Educational Seminar Volume 17, Number 3: Musculoskeletal MRI: Cartilage and Ligaments
Magnetic Resonance Imaging of the Wrist: Bone and Cartilage Injury
stage 3 SLAC wrist will usually require excision of thedegenerative midcarpal joint and surgical fusion ofthe lunate, triquetrum, capitate, and hamate, alsoknown as a ‘‘four corner fusion’’ (71).
Osteoarthritis
In contrast to the fingers, primary osteoarthritis of thewrist is uncommon. Radiocarpal osteoarthritis usuallyoccurs secondary to prior ligament injury (SLACwrist), fracture (SNAC wrist), or avascular necrosisand accounts for 55% of cases of degenerative arthro-sis of the wrist (72).
Trapezio-metacarpal (basilar joint of the thumb) ar-thritis is relatively common, affecting 8% of the popula-tion over 55 years of age. It is almost always bilateraland most commonly occurs in perimenopausal women(72). Osteoarthritis of the scaphoid-trapezium trape-zoid (STT) joint accounts for 20% of cases of wristarthrosis and is most commonly associated with basi-lar joint arthritis (Fig. 13). Isolated severe STT jointosteoarthritis is unusual and is highly suggestive of acrystal-related arthropathy such as calcium pyrophos-phate deposition (CPPD) disease. The pisotriquetraljoint is another relatively common site of osteoarthritisof the wrist and is often overlooked on imaging studies.The pisiform-triquetral joint is well visualized on
Figure 11. Coronal (a) andsagittal (b) FSE images in a46-year-old man demonstratedisruption of the interosseousscapholunate ligament (whitearrow) with widening of thescapholunate interval anddorsal tilt of the lunate (thickblack arrow). There is partialthickness cartilage wear overthe proximal pole of the capi-tate (thin black arrow), indica-tive of an early SLAC wrist.The cartilage over the radio-scaphoid and radiolunatejoints is preserved.
Figure 12. Coronal (a,b) and sagittal (c) FSE images in a 31-year-old man demonstrate features of an SNAC wrist. There isnonunion of a scaphoid waist fracture with a pseudarthrosis at the fracture site (thin white arrow). There is dorsal tilt of thelunate (thick white arrow) and proximal migration of the capitate (thick black arrow). Full thickness cartilage wear is seenover the radioscaphoid joint (thin black arrow) with partial thickness cartilage wear over the radiolunate joint (double blackarrow).
MRI of Wrist Cartilage 1015
Page 15 SMRT Educational Seminar Volume 17, Number 3: Musculoskeletal MRI: Cartilage and Ligaments
Magnetic Resonance Imaging of the Wrist: Bone and Cartilage Injury
sagittal and axial MR images and should be carefullyscrutinized in all patients with ulnar-sided wrist pain(50).
Inflammatory Arthropathies
Rheumatoid Arthritis
Rheumatoid arthritis is a common disease that affectsup to 1% of the population. It is characterized by aninflammatory synovitis which progresses to articularcartilage loss, bony erosions, and joint destruction.Synovitis begins as early as 2 years after diseaseonset (73,74); however, most patients in the earlystages of the disease present with normal radio-graphic findings.
The availability of disease-modifying antirheumaticdrugs (DMARDs) and biologic agents has led to theneed to accurately identify patients with early inflam-
matory arthritis who are at high risk of erosive dis-ease so that they can be treated aggressively. MRI isthe most sensitive means of identifying rheumatoidarthritis at its earliest stages (75,76).
Marrow edema is a common finding in rheumatoidarthritis, affecting 64% of patients in the early stageof the disease (77). Bone marrow edema has beenshown to be predictive of a future site of erosion andis associated with a 6-fold increased risk of erosionwithin 1 year. Bone marrow edema is the strongest in-dependent reversible MRI precursor of erosions (78).
In later stages of rheumatoid arthritis, MRI canidentify bony erosions, synovitis, and tenosynovitis(Fig. 14). These findings are common on MRI, despitethe presence of normal radiographs. Erosions mostcommonly occur in the triquetrum, capitate, sca-phoid, and radial aspects of the second and thirdMCP joints (79). Synovitis may progress to bulky
Figure 14. Coronal inversionrecovery (a) and FSE (b)images in a 45-year-oldwoman demonstrate a pan-carpal inflammatory synovitis(black arrows) with a patchybone marrow edema patternin multiple carpal bones(white arrows) and an erosionover the ulnar margin of thetriquetrum (double blackarrows). The findings are in-dicative of an inflammatoryarthropathy. The correspond-ing radiographs showed noabnormality.
Figure 13. Coronal (a) andsagittal (b) FSE images in a55-year-old man demonstrateosteoarthritis of the scaphoidtrapezium trapezoid joint withfull thickness cartilage lossand subchondral sclerosis(black arrow). There is osteo-arthritis of the basilar joint ofthe thumb with exposed bone(white arrow).
1016 Hayter et al.
Page 16 SMRT Educational Seminar Volume 17, Number 3: Musculoskeletal MRI: Cartilage and Ligaments
Magnetic Resonance Imaging of the Wrist: Bone and Cartilage Injury
pannus formation, which can result in ligament dis-ruption and nerve compression. These complicationsare well depicted on MRI.
The use of gadolinium-enhanced MRI may help todifferentiate between an effusion and inflamed syno-vium or pannus (80). Synovial enhancement occursrapidly (between 1–2 minutes) following intravenousgadolinium administration. After 15–20 minutes, gad-olinium infuses into the synovial fluid and equilib-rium occurs (81). Therefore, if intravenous gadoliniumis administered, imaging within the first few minutesfollowing injection will result in the highest level ofdifferentiation between inflamed synovium versuseffusion (82).
The use of MR angiography has also been proposedas a noninvasive biomarker to identify abnormal vas-culature in patients with early inflammatory arthritis(83). Synovial angiogenesis is one of the earliestmarkers of inflammatory arthritis (84). MR angiogra-phy can provide direct visualization of pathologic sy-novial neovascularization and the number of vesselson MR angiography shows a strong correlation withsynovitis, bone marrow edema, and bone erosions(83) (Fig. 15). Dynamic MR angiography is performedwith a fast-repeated series of 3D spoiled gradient-echo images. Repeated sequences of about 20 secondseach are obtained over the first 4 minutes followinggadolinium injection, using a thin slice coronal 3D T1fat-saturated technique. While currently useful as aresearch tool, dynamic contrast-enhanced MRI is
seldom performed in clinical practice due to theadditional time to acquire images and additionalpostprocessing that is required (85).
Other Arthropathies
A wide number of other arthropathies may present inthe wrist, including seronegative spondyloarthropa-thies, amyloid arthropathy, gout, pigmented villonod-ular synovitis, and septic arthritis.
The seronegative spondyloarthropathies includeankylosing spondylitis, psoriatic arthritis, reactive ar-thritis, and enteropathic arthritis. These are differen-tiated from rheumatoid arthritis by their predilectionto involve the axial skeleton as well as the presence ofenthesopathies. However, due to the overlap in imag-ing findings, spondyloarthropathies cannot be clearlydifferentiated from rheumatoid arthritis on MRI of thewrist alone (86).
CONCLUSION
High-resolution noncontrast MRI allows reproducible,accurate assessment of the cartilage and osseousstructures of the wrist. MRI is useful to diagnoseoccult fractures in the setting of negative radiographsand assess for complications such as nonunion andavascular necrosis following scaphoid fracture. MRI isuseful to diagnose common impingement syndromesand to assess for cartilage wear in the setting of aSLAC/SNAC wrist, which will directly alter surgicalmanagement. MRI can detect early inflammatory ar-thritis, identifying patients who may benefit fromaggressive treatment to prevent the development offuture erosive disease.
DISCLOSURES/CONFLICT OF INTEREST
The Hospital for Special Surgery receives researchsupport from General Electric Healthcare.
REFERENCES
1. Sofka CM, Potter HG. Magnetic resonance imaging of the wrist.Semin Musculoskelet Radiol 2001;5:217–226.
2. Zanetti M, Saupe N, Nagy L. Role of MR imaging in chronic wristpain. Eur Radiol 2007;17:927–938.
3. Malone WJ, Snowden R, Alvi F, Klena JC. Pitfalls of wrist MRimaging. Magn Reson Imaging Clin N Am 2010;18:643–662.
4. Saupe N. 3-Tesla high-resolution MR imaging of the wrist. SeminMusculoskelet Radiol 2009;13:29–38.
5. Saupe N, Prussmann KP, Luechinger R, Bosiger P, Marincek B,Weishaupt D. MR imaging of the wrist: comparison between 1.5-and 3-T MR imaging—preliminary experience. Radiology 2005;234:256–264.
6. Cunningham PM, Law M, Schweitzer ME. High-field MRI. OrthopClin North Am 2006;37:321–329.
7. Eckstein F, Schnier M, Haubner M, et al. Accuracy of cartilagevolume and thickness measurements with magnetic resonanceimaging. Clin Orthop Relat Res 1998:137–148.
8. Potter HG, Linklater JM, Allen AA, Hannafin JA, Haas SB. Mag-netic resonance imaging of articular cartilage in the knee. Anevaluation with use of fast-spin-echo imaging. J Bone Joint SurgAm 1998;80:1276–1284.
9. Stevens KJ, Wallace CG, Chen W, Rosenberg JK, Gold GE. Imag-ing of the wrist at 1.5 Tesla using isotropic three-dimensionalfast spin echo cube. J Magn Reson Imaging 2011;33:908–915.
Figure 15. Axial (a,b) FSE images in a 54 year-old womanwith rheumatoid arthritis demonstrate an inflammatory syn-ovitis of the radiocarpal (black arrow) and distal radioulnarjoint (thick black arrow). There is a tenosynovitis of the flexorcarpi radialis (double black arrow). Corresponding MR angi-ography (c,d) demonstrates neovascularization at the level ofthe midcarpal (thick white arrows) and distal radioulnar(thin white arrow) joints.
MRI of Wrist Cartilage 1017
Page 17 SMRT Educational Seminar Volume 17, Number 3: Musculoskeletal MRI: Cartilage and Ligaments
Magnetic Resonance Imaging of the Wrist: Bone and Cartilage Injury
10. Rettig AC. Athletic injuries of the wrist and hand. Part I: Trau-matic injuries of the wrist. Am J Sports Med 2003;31:1038–1048.
11. Yin ZG, Zhang JB, Kan SL, Wang XG. Diagnosing suspected sca-phoid fractures: a systematic review and meta-analysis. ClinOrthop Relat Res 2010;468:723–734.
12. Hunter JC, Escobedo EM, Wilson AJ, Hanel DP, Zink-Brody GC,Mann FA. MR imaging of clinically suspected scaphoid fractures.AJR Am J Roentgenol 1997;168:1287–1293.
13. Steinmann SP, Adams JE. Scaphoid fractures and nonunions: di-agnosis and treatment. J Orthop Sci 2006;11:424–431.
14. Low G, Raby N. Can follow-up radiography for acute scaphoidfracture still be considered a valid investigation? Clin Radiol2005;60:1106–1110.
15. Adey L, Souer JS, Lozano-Calderon S, Palmer W, Lee SG, Ring D.Computed tomography of suspected scaphoid fractures. J HandSurg Am 2007;32:61–66.
16. Karantanas A, Dailiana Z, Malizos K. The role of MR imaging inscaphoid disorders. Eur Radiol 2007;17:2860–2871.
17. Dorsay TA, Major NM, Helms CA. Cost-effectiveness of immediateMR imaging versus traditional follow-up for revealing radiograph-ically occult scaphoid fractures. AJR Am J Roentgenol 2001;177:1257–1263.
18. Fowler C, Sullivan B, Williams LA, McCarthy G, Savage R, PalmerA. A comparison of bone scintigraphy and MRI in the early diag-nosis of the occult scaphoid waist fracture. Skeletal Radiol 1998;27:683–687.
19. Rangger C, Kathrein A, Freund MC, Klestil T, Kreczy A. Bonebruise of the knee: histology and cryosections in 5 cases. ActaOrthop Scand 1998;69:291–294.
20. Donati OF, Zanetti M, Nagy L, Bode B, Schweizer A, PfirrmannCW. Is dynamic gadolinium enhancement needed in MR imagingfor the preoperative assessment of scaphoidal viability in patientswith scaphoid nonunion? Radiology 2011;260:808–816.
21. Trumble TE. Avascular necrosis after scaphoid fracture: a corre-lation of magnetic resonance imaging and histology. J Hand SurgAm 1990;15:557–564.
22. Inoue G, Sakuma M. The natural history of scaphoid non-union.Radiographical and clinical analysis in 102 cases. Arch OrthopTrauma Surg 1996;115:1–4.
23. Kawamura K, Chung KC. Treatment of scaphoid fractures andnonunions. J Hand Surg Am 2008;33:988–997.
24. Desser TS, McCarthy S, Trumble T. Scaphoid fractures and Kien-bock’s disease of the lunate: MR imaging with histopathologiccorrelation. Magn Reson Imaging 1990;8:357–361.
25. Cerezal L, Abascal F, Canga A, Garcia-Valtuille R, Bustamante M,del Pinal F. Usefulness of gadolinium-enhanced MR imaging inthe evaluation of the vascularity of scaphoid nonunions. AJR AmJ Roentgenol 2000;174:141–149.
26. Perlik PC, Guilford WB. Magnetic resonance imaging to assessvascularity of scaphoid nonunions. J Hand Surg Am 1991;16:479–484.
27. Singh AK, Davis TR, Dawson JS, Oni JA, Downing ND. Gadolin-ium enhanced MR assessment of proximal fragment vascularityin nonunions after scaphoid fracture: does it predict the outcomeof reconstructive surgery? J Hand Surg Br 2004;29:444–448.
28. Hargreaves BA, Worters PW, Pauly KB, Pauly JM, Koch KM, GoldGE. Metal-induced artifacts in MRI. AJR Am J Roentgenol 2011;197:547–555.
29. Papp S. Carpal bone fractures. Orthop Clin North Am 2007;38:251–260, vii.
30. Lisle DA, Shepherd GJ, Cowderoy GA, O’Connell PT. MR imagingof traumatic and overuse injuries of the wrist and hand in ath-letes. Magn Reson Imaging Clin N Am 2009;17:639–654.
31. Watanabe A, Souza F, Vezeridis PS, Blazar P, Yoshioka H. Ulnar-sided wrist pain. II. Clinical imaging and treatment. SkeletalRadiol 2010;39:837–857.
34. Hanks GA, Kalenak A, Bowman LS, Sebastianelli WJ. Stress frac-tures of the carpal scaphoid. A report of four cases. J Bone JointSurg Am 1989;71:938–941.
35. Guha AR, Marynissen H. Stress fracture of the hook of thehamate. Br J Sports Med 2002;36:224–225.
36. Lohman M, Kivisaari L, Partio EK. Stress reaction in the carpalbones caused by breakdancing. Emerg Radiol 2003;10:102–104.
38. Carter SR, Aldridge MJ. Stress injury of the distal radial growthplate. J Bone Joint Surg Br 1988;70:834–836.
39. Anderson MW. Imaging of upper extremity stress fractures in theathlete. Clin Sports Med 2006;25:489–504.
40. Carter SR, Aldridge MJ, Fitzgerald R, Davies AM. Stress changesof the wrist in adolescent gymnasts. Br J Radiol 1988;61:109–112.
41. Davis KW. Imaging pediatric sports injuries: upper extremity.Radiol Clin North Am 2010;48:1199–1211.
42. Botte MJ, Pacelli LL, Gelberman RH. Vascularity and osteonecro-sis of the wrist. Orthop Clin North Am 2004;35:405–421, xi.
43. Schuind F, Eslami S, Ledoux P. Kienbock’s disease. J Bone JointSurg Br 2008;90:133–139.
44. Hooper G. Kienbock’s disease. J Hand Surg Br 1992;17:3–4.
45. Gelberman RH, Salamon PB, Jurist JM, Posch JL. Ulnar variancein Kienbock’s disease. J Bone Joint Surg Am 1975;57:674–676.
46. Lichtman DM, Alexander AH, Mack GR, Gunther SF. Kienbock’sdisease-update on silicone replacement arthroplasty. J HandSurg Am 1982;7:343–347.
47. Hashizume H, Asahara H, Nishida K, Inoue H, Konishiike T. His-topathology of Kienbock’s disease. Correlation with magnetic res-onance and other imaging techniques. J Hand Surg Br 1996;21:89–93.
48. Imaeda T, Nakamura R, Miura T, Makino N. Magnetic resonanceimaging in Kienbock’s disease. J Hand Surg Br 1992;17:12–19.
49. Kalainov DM, Cohen MS, Hendrix RW, Sweet S, Culp RW, Oster-man AL. Preiser’s disease: identification of two patterns. J HandSurg Am 2003;28:767–778.
50. Coggins CA. Imaging of ulnar-sided wrist pain. Clin Sports Med2006;25:505–526.
54. Cerezal L, del Pinal F, Abascal F, Garcia-Valtuille R, Pereda T,Canga A. Imaging findings in ulnar-sided wrist impaction syn-dromes. Radiographics 2002;22:105–121.
55. Topper SM, Wood MB, Ruby LK. Ulnar styloid impaction syn-drome. J Hand Surg Am 1997;22:699–704.
56. Bell MJ, Hill RJ, McMurtry RY. Ulnar impingement syndrome. JBone Joint Surg Br 1985;67:126–129.
57. Viegas SF, Patterson RM, Hokanson JA, Davis J. Wrist anatomy:incidence, distribution, and correlation of anatomic variations,tears, and arthrosis. J Hand Surg Am 1993;18:463–475.
58. Thurston AJ, Stanley JK. Hamato-lunate impingement: anuncommon cause of ulnar-sided wrist pain. Arthroscopy 2000;16:540–544.
59. Pfirrmann CW, Theumann NH, Chung CB, Trudell DJ, ResnickD. The hamatolunate facet: characterization and association withcartilage lesions-magnetic resonance arthrography and anatomiccorrelation in cadaveric wrists. Skeletal Radiol 2002;31:451–456.
60. Viegas SF, Wagner K, Patterson R, Peterson P. Medial (hamate)facet of the lunate. J Hand Surg Am 1990;15:564–571.
61. Peterfy CG, van Dijke CF, Lu Y, et al. Quantification of the vol-ume of articular cartilage in the metacarpophalangeal joints ofthe hand: accuracy and precision of three-dimensional MR imag-ing. AJR Am J Roentgenol 1995;165:371–375.
62. Nagy L. Salvage of post-traumatic arthritis following distal radiusfracture. Hand Clin 2005;21:489–498.
63. Bordalo-Rodrigues M, Schweitzer M, Bergin D, Culp R, BarakatMS. Lunate chondromalacia: evaluation of routine MRI sequen-ces. AJR Am J Roentgenol 2005;184:1464–1469.
64. Haims AH, Moore AE, Schweitzer ME, et al. MRI in the diagnosisof cartilage injury in the wrist. AJR Am J Roentgenol 2004;182:1267–1270.
65. Mutimer J, Green J, Field J. Comparison of MRI and wristarthroscopy for assessment of wrist cartilage. J Hand Surg EurVol 2008;33:380–382.
1018 Hayter et al.
Page 18 SMRT Educational Seminar Volume 17, Number 3: Musculoskeletal MRI: Cartilage and Ligaments
Magnetic Resonance Imaging of the Wrist: Bone and Cartilage Injury
66. Mosher TJ, Dardzinski BJ. Cartilage MRI T2 relaxation time map-ping: overview and applications. Semin Musculoskelet Radiol2004;8:355–368.
67. Wheaton AJ, Casey FL, Gougoutas AJ, et al. Correlation of T1rhowith fixed charge density in cartilage. J Magn Reson Imaging2004;20:519–525.
68. Duvvuri U, Reddy R, Patel SD, Kaufman JH, Kneeland JB, LeighJS. T1rho-relaxation in articular cartilage: effects of enzymaticdegradation. Magn Reson Med 1997;38:863–867.
69. Akella SV, Regatte RR, Borthakur A, Kneeland JB, Leigh JS,Reddy R. T1rho MR imaging of the human wrist in vivo. AcadRadiol 2003;10:614–619.
70. Timins ME, Jahnke JP, Krah SF, Erickson SJ, Carrera GF. MRimaging of the major carpal stabilizing ligaments: normal anat-omy and clinical examples. Radiographics 1995;15:575–587.
71. Cohen MS, Kozin SH. Degenerative arthritis of the wrist: proximalrow carpectomy versus scaphoid excision and four-cornerarthrodesis. J Hand Surg Am 2001;26:94–104.
72. Feydy A, Pluot E, Guerini H, Drape JL. Osteoarthritis of the wristand hand, and spine. Radiol Clin North Am 2009;47:723–759.
73. Brook A, Corbett M. Radiographic changes in early rheumatoiddisease. Ann Rheum Dis 1977;36:71–73.
74. Fuchs HA, Kaye JJ, Callahan LF, Nance EP, Pincus T. Evidenceof significant radiographic damage in rheumatoid arthritis withinthe first 2 years of disease. J Rheumatol 1989;16:585–591.
75. Sugimoto H, Takeda A, Masuyama J, Furuse M. Early-stagerheumatoid arthritis: diagnostic accuracy of MR imaging. Radiol-ogy 1996;198:185–192.
76. McQueen FM, Stewart N, Crabbe J, et al. Magnetic resonanceimaging of the wrist in early rheumatoid arthritis reveals a highprevalence of erosions at four months after symptom onset. AnnRheum Dis 1998;57:350–356.
77. McQueen FM, Benton N, Crabbe J, et al. What is the fate of ero-sions in early rheumatoid arthritis? Tracking individual lesionsusing x rays and magnetic resonance imaging over the first twoyears of disease. Ann Rheum Dis 2001;60:859–868.
78. McQueen FM, Stewart N, Crabbe J, et al. Magnetic resonanceimaging of the wrist in early rheumatoid arthritis reveals progres-sion of erosions despite clinical improvement. Ann Rheum Dis1999;58:156–163.
79. Pierre-Jerome C, Bekkelund SI, Mellgren SI, Torbergsen T, HusbyG, Nordstrom R. The rheumatoid wrist: bilateral MR analysis ofthe distribution of rheumatoid lesions in axial plan in a femalepopulation. Clin Rheumatol 1997;16:80–86.
80. Cimmino MA, Innocenti S, Livrone F, Magnaguagno F, Silvestri E,Garlaschi G. Dynamic gadolinium-enhanced magnetic resonanceimaging of the wrist in patients with rheumatoid arthritis can dis-criminate active from inactive disease. Arthritis Rheum 2003;48:1207–1213.
81. Drape JL, Thelen P, Gay-Depassier P, Silbermann O, BenacerrafR. Intraarticular diffusion of Gd-DOTA after intravenous injectionin the knee: MR imaging evaluation. Radiology 1993;188:227–234.
82. Jbara M, Patnana M, Kazmi F, Beltran J. MR imaging: arthropa-thies and infectious conditions of the elbow, wrist, and hand.Magn Reson Imaging Clin N Am 2004;12:361–379.
83. Vasanth LC, Foo LF, Potter HG, et al. Using magnetic resonanceangiography to measure abnormal synovial blood vessels in earlyinflammatory arthritis: a new imaging biomarker? J Rheumatol2010;37:1129–1135.
84. Gaffney K, Cookson J, Blades S, Coumbe A, Blake D. Quantita-tive assessment of the rheumatoid synovial microvascular bed bygadolinium-DTPA enhanced magnetic resonance imaging. AnnRheum Dis 1998;57:152–157.
85. Cyteval C. Doppler ultrasonography and dynamic magnetic reso-nance imaging for assessment of synovitis in the hand and wristof patients with rheumatoid arthritis. Semin MusculoskeletRadiol 2009;13:66–73.
86. Jbara M, Patnana M, Kazmi F, Beltran J. MR imaging: Arthropa-thies and infectious conditions of the elbow, wrist, and hand.Radiol Clin North Am 2006;44:625–642.
MRI of Wrist Cartilage 1019
Page 19Page 19 SMRT Educational Seminar Volume 17, Number 3: Musculoskeletal MRI: Cartilage and Ligaments
Quantitative MRI of Articular Cartilage and Its Clinical Applications
Quantitative MRI of Articular Cartilage and Its Clinical Applications
Quantitative MRI of Articular Cartilage and ItsClinical Applications
Xiaojuan Li, PhD, and Sharmila Majumdar, PhD*
This article is accredited as a journal-based CME activity.If you wish to receive credit for this activity, please refer tothe website: www.wileyhealthlearning.com
ACCREDITATION AND DESIGNATION STATEMENT
Blackwell Futura Media Services designates this journal-based CME activity for a maximum of 1 AMA PRA Category1 CreditTM. Physicians should only claim credit commensu-rate with the extent of their participation in the activity.
Blackwell Futura Media Services is accredited by theAccreditation Council for Continuing Medical Education toprovide continuing medical education for physicians.
EDUCATIONAL OBJECTIVES
Review the basic principles and clinical applications of majorquantitative MRI techniques as a non-invasive tool for evalu-ating cartilage degeneration during osteoarthritis (OA),including techniques that grade and quantify morphologicchanges as well as the techniques that quantify changes inthe extracellular matrix.
ACTIVITY DISCLOSURES
No commercial support has been accepted related to thedevelopment or publication of this activity.
Faculty Disclosures:
Editor-in-Chief: Mark E. Schweitzer, MD, disclosesDSMB work for Paradigm Spine, and consultation for MMI.
CME Editor: Scott B. Reeder, MD, PhD has no conflictsof interest to disclose.
CME Committee: Pratik Mukherjee, MD, PhD, ShreyasVasanawala, MD, PhD, Bonnie Joe, MD, PhD, Tim Leiner,MD, PhD, Sabine Weckbach, MD, and Frank Korosec, PhDhave no conflicts of interest to disclose. Scott K. Nagle, MD,PhD discloses a personal shareholder investment in GE.Mustafa R. Bashir, MD discloses research support fromBracco Diagnostics and Siemens Healthcare, and consul-tant honorarium from Bayer Pharmaceuticals.
This manuscript underwent peer review in line withthe standards of editorial integrity and publication ethicsmaintained by Journal of Magnetic Resonance Imaging. Thepeer reviewers have no relevant financial relationships. Thepeer review process for Journal of Magnetic Resonance Imag-ing is double-blinded. As such, the identities of the reviewersare not disclosed in line with the standard accepted practicesof medical journal peer review.
Conflicts of interest have been identified and resolvedin accordance with Blackwell Futura Media Services’sPolicy on Activity Disclosure and Conflict of Interest. No rel-evant financial relationships exist for any individual in con-trol of the content and therefore there were no conflicts toresolve.
INSTRUCTIONS ON RECEIVING CREDIT
For information on applicability and acceptance of CME creditfor this activity, please consult your professional licensingboard.
This activity is designed to be completed within an hour;physicians should claim only those credits that reflect the timeactually spent in the activity. To successfully earn credit, partic-ipants must complete the activity during the valid credit period.
Follow these steps to earn credit:
� Log on to www.wileyhealthlearning.com
� Read the target audience, educational objectives, andactivity disclosures.
� Read the article in print or online format.
� Reflect on the article.
� Access the CME Exam, and choose the best answer to
each question.
� Complete the required evaluation component of theactivity.
This activity will be available for CME credit for twelvemonths following its publication date. At that time, it willbe reviewed and potentially updated and extended for anadditional period.
Musculoskeletal Quantitative Imaging Research Group, Department of Radiology and Biomedical Imaging, University of California, San Fran-cisco, California, USA.
Contract grant sponsor: National Institutes of Health; Contract grant number: K25 AR053633; Contract grant number: R01 AR46905; Con-tract grant number: R01 AG17762; Contract grant number: U01 AR055079; Contract grant number: R21 AR056773; Contract grant num-ber: P50 AR060752; Contract grant sponsor: the Aircast Foundation; Contract grant sponsor: Pfizer Inc; Contract grant sponsor:GlaxoSmithKline Inc; Contract grant sponsor: GE Healthcare.
*Address reprint requests to: S.M., QB3 Building, 2nd Floor, Suite 203, 1700 - 4th Street, San Francisco, CA 94158. E-mail:[email protected]
Received August 28, 2012; Accepted June 21, 2013.
DOI 10.1002/jmri.24313View this article online at wileyonlinelibrary.com.
JOURNAL OF MAGNETIC RESONANCE IMAGING 38:991–1008 (2013)
CME
VC 2013 Wiley Periodicals, Inc. 991
Page 20Page 20 SMRT Educational Seminar Volume 17, Number 3: Musculoskeletal MRI: Cartilage and Ligaments
Quantitative MRI of Articular Cartilage and Its Clinical Applications
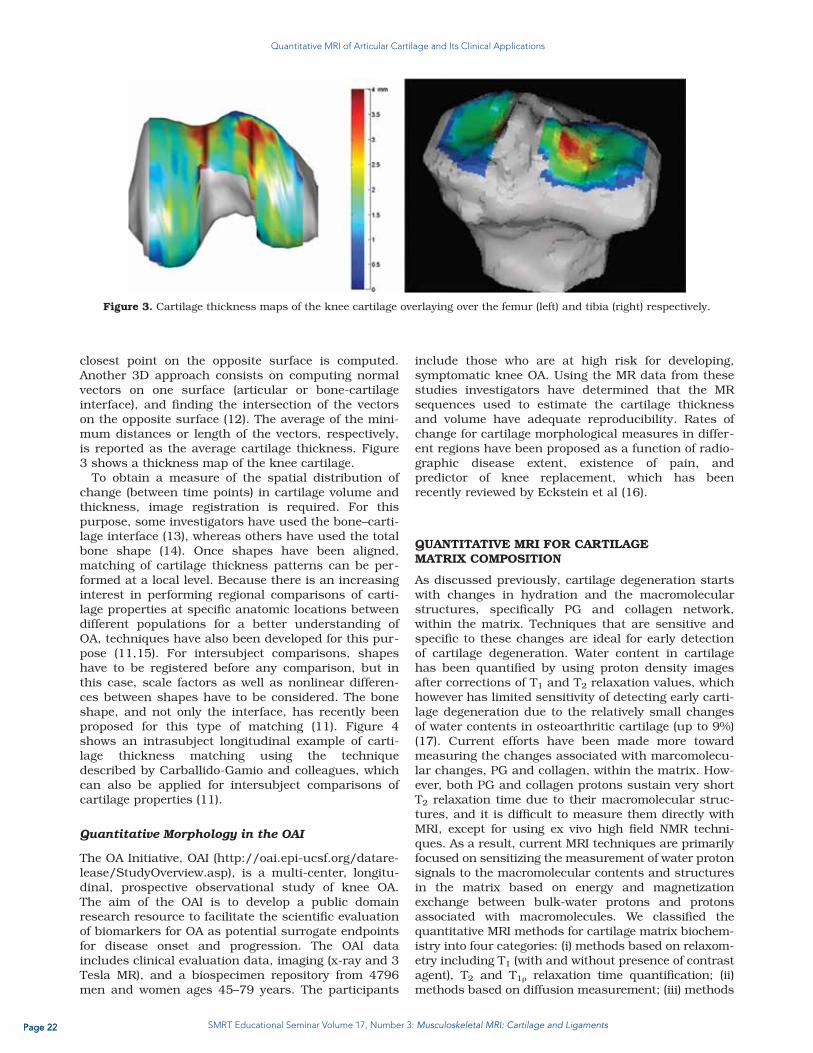
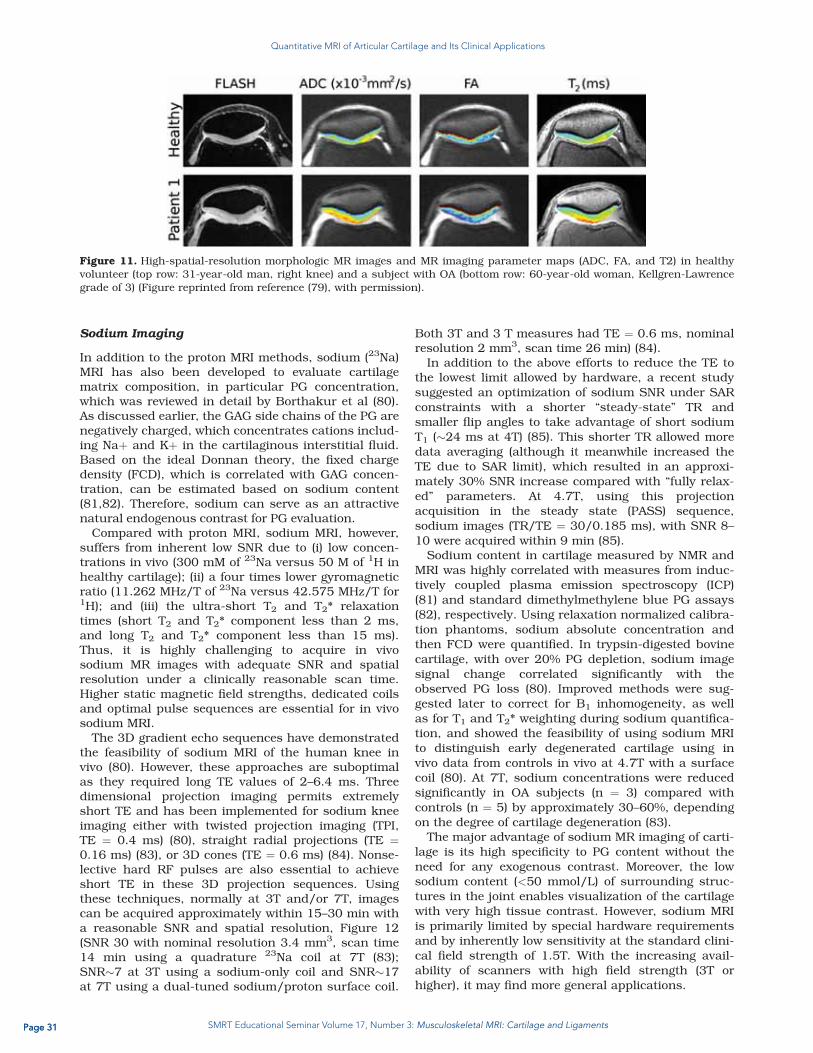
Cartilage is one of the most essential tissues for healthyjoint function and is compromised in degenerative andtraumatic joint diseases. There have been tremendousadvances during the past decade using quantitative MRItechniques as a noninvasive tool for evaluating cartilage,with a focus on assessing cartilage degeneration duringosteoarthritis (OA). In this review, after a brief overview ofcartilage composition and degeneration, we discuss tech-niques that grade and quantify morphologic changes aswell as the techniques that quantify changes in theextracellular matrix. The basic principles, in vivo applica-tions, advantages, and challenges for each technique arediscussed. Recent studies using the OA Initiative (OAI)data are also summarized. Quantitative MRI providesnoninvasive measures of cartilage degeneration at theearliest stages of joint degeneration, which is essential forefforts toward prevention and early intervention in OA.
J. Magn. Reson. Imaging 2013;38:991–1008.VC 2013 Wiley Periodicals, Inc.
CARTILAGE COMPOSITION AND DEGENERATION
Hyaline cartilage consists of a low density of chondro-cytes and a large extracellular matrix (ECM) (1). TheECM is composed primarily of water (�75% of carti-lage by weight), and a cross-linked matrix with pro-teoglycans (PG) and type-II collagen fibers. Theglycosaminoglycans (GAG) on PGs is highly negativelycharged. A key function of these aggregates is to pro-vide a stable environment of high fixed-charge density(FCD), essential for imbibing and retaining water inthe tissue by the high osmotic swelling pressure cre-ated. The distribution and orientation of collagen incartilage demonstrates anatomical zones at micros-copy. The collagen fibers are oriented parallel to thearticular surface in the superficial zone (10–20%),arcade like in the transitional zone (40–60%), andperpendicular in the radial zone (30–40%). The super-ficial zone can be further divided into two subzones:the lamina splenden, the more superficial layer withdense small fibrils and little polysaccharide and nocells; and the cellular layer with flattened chondro-cytes and collagen fibers tangentially to the articularsurface (http://www.wheelessonline.com/ortho/artic-ular_cartilage). Below radial zone is a thin layer of cal-cified cartilage, separated by the tidemark. Althoughthe etiopathogenesis of OA is not fully understood, itis believed that OA results from an imbalance betweenpredominantly chondrocyte-controlled anabolic andcatabolic processes, and is characterized by progres-sive degradation of the components of cartilage ECM(2). Changes at early stages of OA include hydration,PG loss, thinning and disruption of collagen, althoughit has been suggested neither the content nor the typeof collagen is altered at early stages (1). Changes inlate stages include dehydration, resulting in extensivefibrillation and loss of the cartilage and eventually
denudation of the subchondral bone. Figure 1 illus-trates the different stages of cartilage degeneration.
MORPHOLOGICAL CHANGES IN CARTILAGEIN OSTEOARTHRITIS
MR provides excellent soft tissue contrast and clinicalevaluation of articular cartilage is normally based onproton density or intermediate-weighted fast spin-echoimages. Both fat suppressed and nonfat suppressedimages have been used. Fat-suppressed images pro-vide better contrast between cartilage and surroundingtissues, while nonfat suppressed images permitshigher spatial resolution without the loss of signal tonoise afforded by routine fat suppression. Normally, awider receiver bandwidth will be used in nonfat sup-pressed imaging to reduce chemical shift artifact at thecartilage–subcondral bone interface. Morphologicalgrading of the cartilage to semi-quantify cartilagechanges in OA have also been developed. The WholeOrgan Magnetic Resonance Imaging Score (WORMS) ofthe knee in OA was proposed by Peterfy et al (3) and isone that characterizes multiple features in cartilage,meniscus, ligaments, bone marrow, all believed to berelevant to the pathophysiology of OA. Figure 2 showsrepresentative MR images with corresponding WORMSscores. The Boston-Leeds OA Knee Score or the BLOKSscore (4) focuses on bone marrow edema-like lesionsand has been related to pain in OA.
Apart from the grading systems, high resolutiontypically fat-suppressed MR images have also beenused to quantify cartilage thickness and volume.Apart from compartmental analysis (i.e., medial ver-sus lateral compartment), subregional analysis of car-tilage volume and thickness has been undertakenespecially by Eckstein et al (5). Pulse sequences thatare used to obtain images for cartilage volume estima-tion have high signal-to-noise ratio, high contrast-to-noise ratio, and high resolution as the cartilage thick-ness of a few mm warrants that the image resolutionbe as high as possible. Three-dimensional (3D) spoiledgradient echo images (SPGR) and several variants onthese sequences such as dual echo steady state(DESS) images with different methods of fat suppres-sion as well as newly developed 3D fast spin-echoimages have been used for the assessment of cartilagemorphology.
The steps involved in assessing cartilage volumeand thickness include the segmentation of the carti-lage. Several different image processing approacheshave been proposed for this purpose. Stammbergerand colleagues (6) applied a quadratic B-spline toguide the segmentation. An internal energy term con-trolled the rigidity of the contour, an external energyterm attracted the contour to the cartilage edges, anda coupling force enforced smooth changes from oneslice to another. In another 2D approach, Lynch et al(7) combined expert knowledge with cubic splines andimage processing algorithms reporting better reprodu-cibility and less user interaction than region growingtechniques. Grau et al (8) extended the watershed
992 Li and Majumdar
Page 21Page 21 SMRT Educational Seminar Volume 17, Number 3: Musculoskeletal MRI: Cartilage and Ligaments
Quantitative MRI of Articular Cartilage and Its Clinical Applications
technique to examining difference in class probabilityof neighboring pixels. Pakin et al (9) used a regiongrowing method with prior knowledge. Warfield andcolleagues (10) developed an adaptive, template mod-erated, spatially varying statistical classificationmethod, which consisted of an iterative techniquebetween classification and template registration. Man-ual editing is often required in the context of semi-
automated cartilage segmentation. After segmenta-tion, the simplest morphological measure to computeis the sum of the total number of voxels representingcartilage, followed by corresponding scaling accordingto the voxel dimensions. The most common approachto compute cartilage thickness is based on 2D or 3Dminimum Euclidean distances (11). For each point onthe bone–cartilage interface or articular surface, the
Figure 1. Articular cartilage degeneration during osteoarthritis (OA). Changes at early stages of OA include hydration, loss ofproteoglycan, thinning and disruption of collagen. Changes in late stages include further loss of proteoglycan and collagen,dehydration, extensive fibrillation and cartilage thinning, and eventually denudation of the subchondral bone. [Color figurecan be viewed in the online issue, which is available at wileyonlinelibrary.com.]
Figure 2. Representative MR images with different stages of cartilage lesions and the corresponding WORMS scores.
Quantitative MRI of Articular Cartilage 993
Page 22Page 22 SMRT Educational Seminar Volume 17, Number 3: Musculoskeletal MRI: Cartilage and Ligaments
Quantitative MRI of Articular Cartilage and Its Clinical Applications
closest point on the opposite surface is computed.Another 3D approach consists on computing normalvectors on one surface (articular or bone-cartilageinterface), and finding the intersection of the vectorson the opposite surface (12). The average of the mini-mum distances or length of the vectors, respectively,is reported as the average cartilage thickness. Figure3 shows a thickness map of the knee cartilage.
To obtain a measure of the spatial distribution ofchange (between time points) in cartilage volume andthickness, image registration is required. For thispurpose, some investigators have used the bone–carti-lage interface (13), whereas others have used the totalbone shape (14). Once shapes have been aligned,matching of cartilage thickness patterns can be per-formed at a local level. Because there is an increasinginterest in performing regional comparisons of carti-lage properties at specific anatomic locations betweendifferent populations for a better understanding ofOA, techniques have also been developed for this pur-pose (11,15). For intersubject comparisons, shapeshave to be registered before any comparison, but inthis case, scale factors as well as nonlinear differen-ces between shapes have to be considered. The boneshape, and not only the interface, has recently beenproposed for this type of matching (11). Figure 4shows an intrasubject longitudinal example of carti-lage thickness matching using the techniquedescribed by Carballido-Gamio and colleagues, whichcan also be applied for intersubject comparisons ofcartilage properties (11).
Quantitative Morphology in the OAI
The OA Initiative, OAI (http://oai.epi-ucsf.org/datare-lease/StudyOverview.asp), is a multi-center, longitu-dinal, prospective observational study of knee OA.The aim of the OAI is to develop a public domainresearch resource to facilitate the scientific evaluationof biomarkers for OA as potential surrogate endpointsfor disease onset and progression. The OAI dataincludes clinical evaluation data, imaging (x-ray and 3Tesla MR), and a biospecimen repository from 4796men and women ages 45–79 years. The participants
include those who are at high risk for developing,symptomatic knee OA. Using the MR data from thesestudies investigators have determined that the MRsequences used to estimate the cartilage thicknessand volume have adequate reproducibility. Rates ofchange for cartilage morphological measures in differ-ent regions have been proposed as a function of radio-graphic disease extent, existence of pain, andpredictor of knee replacement, which has beenrecently reviewed by Eckstein et al (16).
QUANTITATIVE MRI FOR CARTILAGEMATRIX COMPOSITION
As discussed previously, cartilage degeneration startswith changes in hydration and the macromolecularstructures, specifically PG and collagen network,within the matrix. Techniques that are sensitive andspecific to these changes are ideal for early detectionof cartilage degeneration. Water content in cartilagehas been quantified by using proton density imagesafter corrections of T1 and T2 relaxation values, whichhowever has limited sensitivity of detecting early carti-lage degeneration due to the relatively small changesof water contents in osteoarthritic cartilage (up to 9%)(17). Current efforts have been made more towardmeasuring the changes associated with marcomolecu-lar changes, PG and collagen, within the matrix. How-ever, both PG and collagen protons sustain very shortT2 relaxation time due to their macromolecular struc-tures, and it is difficult to measure them directly withMRI, except for using ex vivo high field NMR techni-ques. As a result, current MRI techniques are primarilyfocused on sensitizing the measurement of water protonsignals to the macromolecular contents and structuresin the matrix based on energy and magnetizationexchange between bulk-water protons and protonsassociated with macromolecules. We classified thequantitative MRI methods for cartilage matrix biochem-istry into four categories: (i) methods based on relaxom-etry including T1 (with and without presence of contrastagent), T2 and T1r relaxation time quantification; (ii)methods based on diffusion measurement; (iii) methods
Figure 3. Cartilage thickness maps of the knee cartilage overlaying over the femur (left) and tibia (right) respectively.
994 Li and Majumdar
Page 23Page 23 SMRT Educational Seminar Volume 17, Number 3: Musculoskeletal MRI: Cartilage and Ligaments
Quantitative MRI of Articular Cartilage and Its Clinical Applications
based on magnetization transfer measurement includ-ing conventional magnetization transfer and chemicalexchange saturation transfer (CEST); and (iv) a nonpro-ton method, sodium imaging.
Postcontrast T1 Relaxation Time by DelayedGadolinium-Enhanced Proton MRI of Cartilage
Basic Principles
As T1 reflects activities with relaxation correlationtime in the range of 1/(gB0), native T1 measurementis normally not sensitive to cartilage matrix changesdue to the slow motion of the restricted protons in the
matrix. However, delayed gadolinium (Gd)-enhancedproton MRI of cartilage (dGEMRIC) has been devel-oped to quantify PG content in cartilage by quantify-ing T1 with the presence of the contrast agent (18,19).It is based on the fact that PG, or the associated GAG,has abundant negatively charged carboxyl and sulfategroups. In the study of dGEMRIC, contrast agent ofgadolinium diethylene triamine pentaacetic acid, orGd-DTPA2� (Magnevist; Berlex Laboratories, Wayne,NJ), is injected intravenously (or intra-articularly) anddistributed in the cartilage by diffusion. The diffusiontime depends on the cartilage thickness and isapproximately two hours in femoral weight-bearing
Figure 4. An example of intrasubject longitudinal cartilage thickness matching using the technique described by Carballido-Gamio et al (11). DESS: dual echo steady state.
Figure 5. dGEMRIC images of the hips of a patient with unilateral hip dysplasia. The symptomatic hip has a much lowerdGEMRIC index. Numbers in the images refer to the average dGEMRIC index for the region shown in color. (Figure reprintedfrom reference (29), with permission).
Quantitative MRI of Articular Cartilage 995
Page 24Page 24 SMRT Educational Seminar Volume 17, Number 3: Musculoskeletal MRI: Cartilage and Ligaments
Quantitative MRI of Articular Cartilage and Its Clinical Applications
cartilage. Because Gd-DTPA2� is negatively charged,it will be distributed in a relatively low concentrationin areas that are rich in GAG (normal cartilage), andin higher concentrations in regions with depleted GAG(degenerated cartilage). Gd-DTPA2� has aconcentration-dependent effect on the MR parameterT1. Therefore, T1-weighted images in the presence ofGd-DTPA2� reflect the Gd-DTPA2� concentration, andhence tissue GAG concentration. By calculating T1
relaxation time, the concentration of GAG can bequantified based on a modified electrochemical equi-librium theory, assuming the Gd-DTPA2� is equili-brated in the tissue (18).
dGEMRIC measures have been validated using bio-chemical and histologic measurements of GAG con-centration in cartilage with ex vivo studies, asreviewed by Gray et al (19). The in vivo validation ofdGEMRIC techniques, however, was not straightfor-ward especially for the conversion from T1 quantifica-tion to GAG concentration, therefore the direct T1
measures of “dGEMRIC index” was normally reportedfor clinical studies (19). Loss of GAG will result in adecreased T1, and a decreased “dGEMRIC index”.
In Vivo Applications
The sequences for in vivo T1 quantification in dGEM-RIC studies include the most commonly used two-dimensional (2D) inversion recovery fast spin-echo(IR-FSE) sequences due to its widespread availabilityof the sequence and desirable contrast properties(cartilage versus fluid), 3D acquisitions based on IR-spoiled gradient echo (IR-SPGR) for better coverage,and fast 3D methods based on Look-Locker or basedon spoiled GRE images with two optimized flip angles.Good correlations were reported between measuresfrom the 3D methods and the gold-standard 2D IR-FSE technique. The reproducibility of the 3D-variableflip angle method (RMS-CV: 9.3–15.2%) was reportedto be inferior compared with 2D-IR FSE and 3D LookLocker methods (RMS-CV: 5.8–8.4%) (20). In particu-lar, the investigators suggested that positioning of theanalyzed images is crucial to generate reliable repeat-ability results. The recommended clinical protocol wassummarized by Burstein et al (21).
Decreased dGEMRIC index was observed in com-partments with radiography joint space narrowingcompared with other compartments (22). In obesesubjects, knee dGEMRIC index was associated withage, clinical knee OA, abnormal tibiofemoral align-ment, and quadriceps strength (23). Subjects withmedial meniscectomy (1–6 years before imaging)showed significantly lower dGEMRIC Index of themedial compartment after surgery (24). In subjectswith acute anterior cruciate ligament (ACL) injuries,significantly decreased dGEMRIC index was observedin ACL-injured knees compared with either contralat-eral knees or knees from healthy control subjects(25,26), suggesting that dGEMRIC index may beindicative of potential early degeneration in kneeswith risk of developing posttraumatic OA.
In the hip, lower dGEMRIC index was reported insubjects with femoroacetabular impingement (FAI)
with different patterns of subregional variationbetween subjects with cam and pincer FAI (27), andwas correlated with the magnitude of the deformityand pain (28). In subjects with hip dysplasia, a devel-opmental malformation of the hip associated withearly OA, Kim et al reported that dGEMRIC signifi-cantly correlated with severity of dysplasia and pain(29), Figure 5.
Advantages and Challenges
Previous studies support the dGEMRIC index as aclinically relevant measure of cartilage integrity, withspecific measures related to GAG concentration. How-ever, one should be aware that especially for in vivostudies, bias may be introduced during conversionfrom dGEMRIC measures to GAG concentration dueto factors such as the possibility of altered contrastagent relaxivity under different tissue conditions andother factors such as the transport of contrast agentinto cartilage with a variable blood concentration thatmight affect the equilibrating concentration ofGd(DTPA) 2� in vivo (19). Other challenges that hinderdGEMRIC from widespread clinical application includ-ing necessity of contrast agent injection, and longdelay of MR scan after Gd injection.
T2 Relaxation Time
Basic Principles
T2 relaxation time, or the spin-spin relaxation time,reflects the ability of free water proton molecules tomove and to exchange energy inside the cartilaginousmatrix. It has been shown that in normal cartilagethis transverse (T2) relaxation is dominated by theanisotropic motion of water molecules in a fibrous col-lagen network. Damage to collagen-PG matrix andincrease of water content in degenerating cartilagemay increase T2 relaxation times.
T2 quantification is normally performed by fittingT2-weighted images acquired with different TEs tomono- or multi-exponential decay curve. Pai et alcompared the T2 mapping techniques in phantomsand in vivo based on five different sequences withregard to SNR, reproducibility and quantification:spin-echo (SE), fast spin-echo (FSE), multi-echo SE(MESE), magnetization prepared 2D spiral, and mag-netization prepared 3D SPGR (30). Variation of T2
quantification was observed, Figure 6, which may dueto different sensitivity of each sequences to systemimperfections including stimulated echoes, off reso-nance signals and eddy currents. Different fittingmethods will also introduce bias to T2 quantification.Caution needs to be exercised when comparingresults from different studies and when designing amulti-center study.
In vitro studies have reported that T2 correlated withwater content but poorly with PG depletion in enzy-matically degraded articular cartilage (31). Using highfield microscopic MRI (mMRI), Xia et al showed that T2
spatial variation is dominated by the ultra-structure ofcollagen fibrils, and thus angular dependency of T2
with respect to the external magnetic field B0 can
996 Li and Majumdar
Page 25Page 25 SMRT Educational Seminar Volume 17, Number 3: Musculoskeletal MRI: Cartilage and Ligaments
Quantitative MRI of Articular Cartilage and Its Clinical Applications
provide specific information about the collagen struc-ture (32). T2 variation was also correlated with polar-ized light microscopy (33). This angular dependency ofT2 results in the “magic angle” effect and the com-monly seen laminar appearance in cartilage imaging.Multi-exponential T2 relaxation components were iden-tified by Reiter et al using intact and enzyme-digestedbovine nasal cartilage (34). Using bovine nasal carti-lage, it was demonstrated that the multicomponentproperties may depend on the orientation of collagenfibers with respect to B0. At the magic angle (55
�), T2
(and T1r) was a single component rather than multiplecomponents (35). This multiexponential approach hasthe potential to improve specificity of cartilage matrixevaluation using T2 relaxation parameters.
In Vivo Applications
In vivo T2 values have been shown to vary from thesubchondral bone to the cartilage surface (36,37).With the exception of the lamina splendens, T2
decreased from the superficial layer to the deep layer.Cartilage T2 has been correlated with age (38), but notwith gender (39). Elevated T2 relaxation times wereobserved in OA cartilage, and were associated withthe severity of disease categorized with radiography(40). In one study examining T2 in patellar cartilage,however, no differences of T2 values were foundacross the stages of OA based on radiographic KLscores (P ¼ 0.25) (41). The same study reportedincreased T2 was associated with increased BMI, sug-gesting BMI is a significant factor for increasing T2.Increase of T2 (and T1r) was also correlated withdecreased trabecular bone structure in OA knees,
highlighting the interplay between cartilage and bonestructure in OA (42,43).
T2 quantification has been used as noninvasivemeasures to quantify and monitor the change in bio-chemical and biomechanical properties of cartilageafter physical activity or exercise. Mosher et alreported that cartilage T2 values decreased after run-ning, along with a decrease in cartilage thickness(44), suggesting the decrease of water contents andchanges of collagen network after high impact activitysuch as running. A more recent study showed thegreatest decrease of T2 and T1r after running occurredin the superficial layer of medial femoro-tibial andpatella-femoral cartilage (45), suggesting greater loadsharing by these areas during running. Further stud-ies in subjects with OA would be interesting to exam-ine the loading pattern and cartilage response torunning in degenerative joints.
T2 quantification has been also applied in evaluat-ing early cartilage matrix changes after acute injuries,such as acute anterior cruciate (ACL) tears. In a veryrecent longitudinal study, Potter et al reported that T2values were elevated during follow-ups (up to 11 yearsafter injury) in the lateral side and patella after iso-lated ACL tears (T2 values in the medial side were notavailable), indicating accelerated cartilage degradationin such joints (46). The T2 elevation was observed inregions that were not covered by the initial bone mar-row edema-like lesions, suggesting the injury initiateda rather global disturbing of cartilage homeostasiswithin the whole joint.
In vivo T2 quantification using a multi-slice multi-echo spin-echo (MESE) sequence has been includedin the OA Initiative. Data from the monthly qualityassurance procedure over a 3-year period showed
Figure 6. Variation of T2 quantification was observed using different sequences in phantoms (left) and in vivo knees (right)(30). SE: spin-echo; FSE-4: fast spin-echo (FSE) with echo train length (ETL) as 4; FSE-8: FSE with ETL as 8; FSE-16: FSEwith ETL as 16; MESE: multi-echo spin-echo; SGPR: spoiled gradient echo acquisition. [Color figure can be viewed in theonline issue, which is available at wileyonlinelibrary.com.]
Quantitative MRI of Articular Cartilage 997
Page 26Page 26 SMRT Educational Seminar Volume 17, Number 3: Musculoskeletal MRI: Cartilage and Ligaments
Quantitative MRI of Articular Cartilage and Its Clinical Applications
excellent longitudinal reproducibility (RMS CV < 5%)except for one site (47). Cartilage T2 values have beencorrelated to physical activity levels (determined byPhysical Activity Scale for the Elderly), in particularknee bending activities, in OAI cohort (48). Light exer-cisers had lower T2 values compared with both seden-tary and moderate/strenuous exercisers in subjectswith risk factors for knee OA (n ¼ 128), Figure 7, sug-gesting that there could be a “U” shape of the effect ofexercise to cartilage biochemistry—either too little ortoo much will be detrimental, but the optimizedappropriate level of exercise for each individual maybe affected by many factors including BMI, geneticprofile, biomechanical characteristics such as align-ment and kinematics. Nonetheless, as exercise is amodified factor, exploring the relationship of differenttype and level of exercise to cartilage biochemistry asquantified by advanced MRI can be clinically valuableto allow intervention and training to prevent and slowdown cartilage degeneration.
Using OAI data, a 2-year longitudinal analysis ofOAI normal cohort showed a significant increase in T2
was in the tibiofemoral cartilage while no changes inthe patellofemoral cartilage (49). A greater increase incartilage T2 was found to correlate with an increase inthe progression of cartilage abnormalities (gradedwith WORMS). More recently, Joseph et al reported,in OAI subjects with risk factors for OA (n ¼ 289), thebaseline mean and heterogeneity of cartilage T2 weresignificantly (P < 0.05) associated with morphologicjoint degeneration in the cartilage, meniscus andbone marrow over 3 years (50). These studies sug-gested that characterizing and monitoring the carti-lage matrix integrity with T2 measurements mightenable identification of individuals at risk for thedevelopment of early OA before irreversible cartilageloss occurs.
Advantages and Challenges
Cartilage T2 quantification is a promising marker forcartilage matrix biochemistry and has been applied in
the large multicenter studies of OA with the effort of theOAI. T2 changes are dominated by the hydration andcollagen fibers and may not be sensitive to subtlechanges of PG loss. Caution is also needed during datainterpretation due to the magic angle effect of T2. Inaddition, due to the layer variation of cartilage T2 asdiscussed earlier, laminar analysis is recommended tobe used for analyzing either OA or cartilage repair data.It should be noted that sampling quantitative data inthe superficial zone or lamina splendens is technicallychallenging, and normally two layers (with equal thick-ness) were used for in vivo T2 laminar analysis due tothe limited resolution of in vivo T2 mapping.
T1r Relaxation Time Quantification
Basic Principles
The T1r parameter is defined as the time constantdescribing the spin-lattice relaxation in the rotatingframe. It probes the slow motion interactions betweenmotion-restricted water molecules and their localmacromolecular environment. The macromolecules inarticular cartilage ECM restrict the motion of watermolecules. Changes to the ECM, such as PG loss,therefore, can be reflected in measurements of T1r.The T1r is normally measured by the spin-lock (SL)technique, which enabled study of relaxation at verylow field without sacrificing the SNR afforded byhigher field strengths. In an SL experiment, spins areflipped into the transverse plane along one axis,immediately followed by a SL pulse applied along thesame axis. A SL pulse is an on-resonance, continuouswave radiofrequency (RF) pulse, normally long-duration and low-energy. Because the magnetizationand RF field are along the same direction, the magnet-ization is “spin-locked”, provided the locking conditionis satisfied, i.e., the B1 of locking pulses is muchstronger than the local magnetic fields generated by,for example, magnetic moments of nuclei. The spinswill relax with a time constant T1r along B1 of lockingpulses in the transverse plane. The amplitude of the
Figure 7. T2 maps of a sedentary subject (a), a light exerciser (b), and a moderate/strenuous exerciser (c) from the OAI cohortwith risk factors for knee OA. In subjects with risk factors for knee OA from OAI cohort, light exercisers had lower T2 valuescompared with both sedentary and moderate/strenuous exercisers (48), suggesting that there could be a “U” shape of theeffect of exercise to cartilage biochemistry. [Color figure can be viewed in the online issue, which is available atwileyonlinelibrary.com.]
998 Li and Majumdar
Page 27Page 27 SMRT Educational Seminar Volume 17, Number 3: Musculoskeletal MRI: Cartilage and Ligaments
Quantitative MRI of Articular Cartilage and Its Clinical Applications
SL pulse is commonly referenced in terms of the nuta-tion frequency (f ¼ gB1). The normal range of SL fre-quency is a few hundred hertz to a few kilohertz. T1r
relaxation phenomena are sensitive to physicochemi-cal processes with inverse correlation times on theorder of the nutation frequency of the SL pulse. T1r
increases as the strength of the SL field increases, aphenomenon termed T1r dispersion. T1r dispersionsmay also have tissue specificity.
The T1r-weighted imaging sequences are composedof two parts: magnetization preparation with T1r
weighting using spin-lock pulse cluster, and a follow-ing 2D (based on spiral, or fast spin-echo, or echo pla-nar imaging) or 3D (based on gradient echo or 3D fastspin echo) data acquisition. Compared with 2D acqui-sition, 3D sequences have the advantage of higherimage resolution, especially in the slice direction.Among 3D sequences, the method using transient sig-nals immediately after T1r preparation either based onSPGR acquisition (51) (magnetization-prepared angle-modulated partitioned k-space spoiled gradient echosnapshots, MAPSS) or based on balanced GRE acqui-sition (52) are more SNR efficient and less SAR inten-sive compared with the method based on the steadystate GRE acquisition (53). These sequences havebeen implemented at both 1.5 Tesla (T) and 3T onscanners from different manufactures. Several modifi-cations in the SL pulse cluster and phase cycling wereperformed to improve the robustness of spin locking toB0 and B1 inhomogeneity (54,55).
In vitro studies have showed that the elevation ofT1r relaxation time was correlated with PG loss inboth bovine (31) and human cartilage (56), and withhistological grading (56). In T1r quantification experi-ments, the spin-lock techniques reduce dipolar inter-actions and, therefore, reduce the dependence of therelaxation time constant on collagen fiber orientation.This enables more sensitive and specific detection ofchanges in PG content using T1r quantification,although T1r changes in cartilage may be affected byhydration and collagen structure as well. The reduceddipolar interaction also results in less “magic angleeffect” in T1r imaging as compared to T2 imaging. Lesslaminar appearance was observed in T1r-weightedimages compared with T2-weighted images (57). Previ-ous specimen studies reported that T1r values at themagic angle (54.7
�) were significantly higher than at
other angles, but the difference was smaller than thedifference in T2 values at the same angles (56). Thedifference was decreased with increased T1r spin-lockfrequencies and was diminished when T1r spin-lockfrequency was equal to or higher than 2 KHz (57).
Previous studies suggested that proton exchangebetween NH and OH groups of GAG and bulk watercontribute significantly to the T1r relaxation (58),while another study suggested that the contributionof scalar relaxation caused by proton exchange is onlyrelevant at high fields such as 7T (59). Other evidenceof a proton exchange pathway is the PH dependencyof T1r values in the ischemic rat brain tissues (60).Further investigations are needed to better under-stand this relaxation mechanism in cartilage.
In Vivo Applications
In vivo T1r reproducibility (scan-rescan studies at asingle center) was reported to range from 1.7–8.7%(51). A recent multicenter study reported reproducibil-ity CVs for both T2 (4–14%) and T1r (7–19%) (61).Future studies are warranted to evaluate multi-sitemulti-vendor variation of T1r and T2 quantificationwith a clinical trial setup. In vivo studies suggestedT1r is moderately age-dependent (62). Increased carti-lage T1r values was observed in OA subjects comparedwith controls (40,42,53,62), in asymptomatic activehealthy subjects with focal cartilage abnormalitiescompared with those without lesions (62), in subjectswith meniscal tears compared with those withouttears (63), and in regions overlying bone marrowedema-like lesions (BMEL) compared with surround-ing cartilage in OA and acutely-injured knees (64).Furthermore, elevated T1r was observed in subcom-partments in OA subjects where no obvious morpho-logic changes were observed, suggesting the capabilityof T1r in detecting very early biochemical changeswithin the cartilage matrix (40).
Similar as T2, T1r values decreased from the superfi-cial zone (excluding the lamina splendens) to the deepzone of cartilage (37). Although the trend of T1r and T2
values are similar, T1r shows a larger dynamic rangeand less laminar appearance was observed in T1r-weighted images compared with T2-weighted imagesdue to reduced dipolar interaction during T1r relaxa-tion (57). In human subjects, the pixel-by-pixel corre-lation between T1r and T2 was reported to have a largerange in both controls and OA patients (R2 ¼ 0.522 60.183, ranging from 0.221 to 0.763 in OA patients ver-sus R2 ¼ 0.624 6 0.060, ranging from 0.547 to 0.726in controls) (37). Figure 8 shows T1r and T2 maps froma control subject, a subject with mild OA, and a sub-ject with severe OA. The differences between the T1r
and T2 maps are evident. These results suggested T1r
and T2 show different spatial distribution and mayprovide complementary information regarding cartilagedegeneration in OA. Combining these two parametersmay further improve our capability to diagnose earlycartilage degeneration and injury.
In addition to patients with OA, T1r quantificationtechniques have been applied to patients with acutelyinjured knees, who have a high risk of developing OAlater in life. In patients with acute ACL tears, signifi-cantly increased T1r values were found at baseline(after injury but before ACL reconstruction) in carti-lage overlying bone marrow edema-like lesions(BMEL) when compared with surrounding cartilage atthe lateral tibia (64). Follow-up exams at 1-year afterACL-reconstruction of these ACL injured knees (65)showed that (i) in lateral sides, despite the resolutionof BMEL, cartilage overlying the baseline BMEL stillshow significantly higher T1r compared to controls,suggesting potential irreversible damage of cartilagein these regions; (ii) in medial sides, T1r values inmedial tibial and medial femoral condyles, especiallythe contact area (the contact area during supineunloaded MRI), show significant elevation at as earlyas 1-year after ACL reconstruction compared with
Quantitative MRI of Articular Cartilage 999
Page 28Page 28 SMRT Educational Seminar Volume 17, Number 3: Musculoskeletal MRI: Cartilage and Ligaments
Quantitative MRI of Articular Cartilage and Its Clinical Applications
healthy controls, probably due to abnormal kinemat-ics even after ACL reconstruction, Figure 9. T2 alsoshowed increasing trend in these regions of cartilage,however it did not reach statistical significance. Theauthors speculated that T1r is more sensitive than T2
in detecting cartilage damages and potential earlydegeneration in ACL-injured knees (65). It should benoted that at the spin-lock frequencies that are com-monly used for in vivo studies (400–500 Hz), T1r
quantification also showed orientation dependency asdiscussed earlier. Therefore, T1r values of subregionsalong the femoral condyles cannot be compareddirectly. Rather, the values should be compared withmatch-regions in control knees. To increase the spin-lock frequency will decrease the orientation depend-ency, but the highest spin-lock frequency will be lim-ited by the energy deposited to the tissue as evaluatedby specific absorption rate (SAR) or by the maximumB1 allowed by the hardware.
Advantages and Challenges
T1r quantification in cartilage can provide valuableinformation related with biochemical changes in carti-lage matrix. In particular, compared with more estab-lished T2 relaxation time, T1r provides a larger dynamicrange and a more sensitive detection of PG loss at earlystages of cartilage degeneration. Similar as T2 quantifi-cation, T1r quantification requires no contrast agentinjection and no special hardware, therefore has greatpotential to be used in clinical applications or trials.Technical challenges of T1r quantification include high
energy deposited to tissue (high SAR), especially athigh and ultra high field strength.
Magnetization Transfer (MT) and ChemicalExchange-Dependent SaturationTransfer (CEST) MRI
MR imaging techniques based on magnetizationtransfer (MT) are sensitive to marcomolecular changesin tissues by exploring the exchange of magnetizationbetween the pool of semisolid macromolecule associ-ated protons and the pool of more free or liquid pro-tons associated with bulk water (66). During MTexperiments, the macromolecule-bounded protons arepreferentially saturated with selective off-resonanceRF pulses. The exchange of magnetization that trans-fers macromolecular saturation to the liquid protonpool produces an observable decrease in the longitu-dinal magnetization of the liquid spins. The magnet-ization exchange can occur by means of dipolarcoupling or by means of chemical exchange. The mostcommon parameter to quantify the amount of MT isby calculating the MT ratio (MTR) of the signal inten-sity before and after saturation.
The magnetization transfer effect in cartilage hasbeen attributed primarily to collagen (67), while stud-ies showed that changes in PG concentration and tis-sue structure also contribute to changes in MT ratioin cartilage (68). It is worthy of noting that, althoughMTR provides valuable information regarding tissuecomposition, MTR is not an intrinsic MR property oftissue. This parameter is reflective of a complex com-bination of the sequence, tissue relaxation and MT
Figure 8. T1r and T2 maps of a healthy control (a), a subject with mild OA (b), and a subject with severe OA (c). Significantelevation of T1r and T2 values were observed in subjects with OA. T1r and T2 elevation had different spatial distribution andmay provide complementary information associated with cartilage degeneration. [Color figure can be viewed in the onlineissue, which is available at wileyonlinelibrary.com.]
1000 Li and Majumdar
Page 29Page 29 SMRT Educational Seminar Volume 17, Number 3: Musculoskeletal MRI: Cartilage and Ligaments
Quantitative MRI of Articular Cartilage and Its Clinical Applications
parameters. In an effort to decouple the contributionof each of these parameters, quantitative magnetiza-tion transfer (qMT) techniques have been proposed(69,70). These methods derive the fraction of exchang-ing protons that are bound to macromolecules andthe exchange rate between the bound and free poolbased on the two-compartment model. A recent studyapplied qMT techniques in bovine cartilage andrevealed that in the top layer of cartilage, the boundpool fraction was moderately correlated with PG con-tent while the cross-relaxation rate and the longitudi-nal relaxation time were moderately correlated withcollagen (71). More studies in the future are war-ranted to examine the feasibility and validity of qMTin assessing matrix composition of healthy and degen-erated cartilage.
Chemical exchange-dependent saturation transfer(CEST) imaging is a relatively new MRI contrastapproach (72). In CEST experiments, exogenous orendogenous compounds containing either exchange-able protons or exchangeable molecules are selectivelysaturated and after transfer of this saturation uponchemical exchange to the bulk water, detected indi-rectly through the water signal with enhanced sensi-tivity. In CEST MRI, transfer of magnetization is
studied in mobile compounds instead of semisolids incontrast to conventional MT.
To account for direct saturation of water and back-ground magnetization transfer that is related to mech-anism other than chemical exchange, such as nuclearoverhauser effect (NOE) in cartilage (73), two imagesare normally acquired in CEST experiments. One witha saturation pulse applied at the resonance frequencyof interest (�d), and the other acquired with an equalfrequency offset but applied on the other side of thebulk water peak (d). The CEST effect was then quanti-fied as the difference of these two images (73).
In cartilage, CEST exploits the exchangeable pro-tons, including NH, OH, and NH2 proton groups, onthe GAG side chains of PG (73,74), and was termedas gagCEST. Ling et al showed that �OH at d ¼ �1.0ppm, where d is the frequency offset relative to thewater, among other labile protons, can be used tomonitor GAG concentration in cartilage in vivo (73).gagCEST revealed difference in GAG concentrationbetween trypsin PG-depleted cartilage versus controls,and low GAG concentration in vivo with focal cartilagelesion (73), Figure 10. At 7T, a strong correlation (r ¼0.701) was found between ratios of signal intensityfrom native cartilage to signal intensity from repair
Figure 9. T1r maps of the lateral side (a, b) and medial side (c,d) of an ACL-injured knee at baseline (a, c) and 1-year follow-up(b, d) (65). T1r values in lateral-posterior tibial cartilage (the region overlying bone bruises, white arrows) were elevated signifi-cantly in ACL-injured knees at baseline and remained high at 1-year follow-up, despite resolution of bone bruise in lateral tibia.T1r values in the contacting area of medial femoral condyle and medial tibia (blue arrow) were significantly elevated in ACL-injured knees at 1-year follow-up. [Color figure can be viewed in the online issue, which is available at wileyonlinelibrary.com.]
Quantitative MRI of Articular Cartilage 1001
Page 30Page 30 SMRT Educational Seminar Volume 17, Number 3: Musculoskeletal MRI: Cartilage and Ligaments
Quantitative MRI of Articular Cartilage and Its Clinical Applications
tissue obtained with gagCEST (asymmetries in gagC-EST z-spectra summed over all offsets from 0 to 1.3ppm) or 23Na imaging (74), which suggested the speci-ficity of gagCEST for detecting GAG concentration.
gagCEST is a promising new method of evaluatingcartilage matrix composition, with high specificity toGAG concentration and no need of contrast agentinjection. However, the sensitivity to multiple factors,including pH changes, changes in hydration and colla-gen that may also change the exchange rate of �OHprotons, and to pulse sequence parameters compli-cates the interpretation of gagCEST and comparisonstudies between laboratories. In addition, the fieldinhomogeneity, susceptibility-induced artifacts andmotion may confound the results from gagCESTexperiments. Furthermore, at 3T, the slow-to-intermediate exchange condition, Dv > k (where Dv isthe chemical shift of the solute spin relative to bulkwater proton, and k is the exchange rate of solutespin), which is needed to efficiently observe CESTeffect, is not fulfilled for �OH protons with exchangesite at 1 ppm. The CEST effect is expected to increaseat ultra high field strength such as 7T. The advantageincludes the larger frequency separation for betteradherence to the slow-exchange condition and reducedinterference of direct water saturation, and the limita-tion includes the increase in power deposition.
Diffusion Imaging
Diffusion MRI measures Brownian motion of watermolecules in tissues, which provides a noninvasivemethod for evaluating microscopic cellular structuresof the tissue. Diffusion-weighted images provide anew contrast qualitatively related to tissue properties.Diffusion tensor imaging (DTI) where diffusionweighted images are acquired in multiple directionscan provide quantitative information, including themean diffusivity (MD) or apparent diffusion coefficient(ADC), indicating the degree of water diffusion, andthe fractional anisotropy (FA), indicating the anisot-ropy of water diffusion in different orientations.
Ex vivo studies have documented promising resultsthat MRI diffusion parameters may be sensitive toboth the PG content and the collagen architecturewithin cartilage matrix, and therefore can be promis-ing indicators of early degeneration of the tissue (75–77). Zonal variation was observed where ADC continu-
ously decreased and FA increased from the articularsurface to the bone-cartilage interface (77). The colla-gen fiber architecture has been shown to be the pri-mary source of the anisotropy of diffusion (75,76).The primary eigenvector of the diffusion tensor (i.e.,the eigenvector associated with the largest eigenvalue)has been shown to correlate with the orientation ofthe collagen fibrils using polarized light microscopy(PLM) (76) and scanning electron microscopy (77).Loss of PG caused significant increases of mean diffu-sivity and minimal changes in FA, while collagendepletion led to changes of ADC, fractional anisotropy(FA), and primary eigenvector (75).
Despite promising results from ex vivo studies, invivo quantification of diffusion coefficients in cartilageare rather limited due to the short T2 and consequentlylow SNR in cartilage, as well as spatial distortions aris-ing from the sensitivity of the EPI trajectory to B0 fieldinhomogeneity (therefore, the commonly used EPIbased diffusion sequences are not optimal for cartilageimaging). Very recently, Staroswiecki et al proposed amethod for in vivo simultaneous quantification of carti-lage T2 and apparent diffusion coefficients by modifyingthe spoiler gradient area and flip angle of the doubleecho steady state (DESS) sequence (78). Data acquiredin phantoms and in vivo healthy knees at 3T showedgood agreement with quantification using standardspin-echo sequences (78). Raya et al performed in vivoDTI of cartilage at 7T using line-scan techniques (79).The test–retest reproducibility was 8.1% for mean ADCand 9.7% for FA. Mean ADC and FA differed signifi-cantly (P < 0.01) between the OA and healthy popula-tions, while T2 did not in their study cohort (79), Figure11. These studies demonstrated the feasibility of per-forming in vivo diffusion imaging in cartilage.
Diffusion MRI, in particular DTI, has the advantagethat multi-components of the cartilage matrix includ-ing PG concentration and collagen network orienta-tion and fraction can be quantified from onesequence. The major challenges for in vivo diffusionMRI of cartilage include the low SNR due to the shortT2 relaxation time of the tissue, requirement of highresolution due to small dimension of cartilage and thesensitivity of diffusion MRI to motion, and long acqui-sition time. Further studies are warranted to evaluatethe reliability and reproducibility of in vivo diffusionparameter quantification and to evaluate its capabilityin diagnosing and monitoring cartilage degeneration.
Figure 10. The gagCEST images of a human patella in vivo with irradiation at d ¼ �1.0 ppm (left), d ¼ þ 1.0 ppm (middle),and the difference image (right), displaying a clear demarcation of a cartilage lesion and GAG loss on the medial facet (indi-cated by arrows) (Figure reprinted from reference (73), with permission).
1002 Li and Majumdar
Page 31Page 31 SMRT Educational Seminar Volume 17, Number 3: Musculoskeletal MRI: Cartilage and Ligaments
Quantitative MRI of Articular Cartilage and Its Clinical Applications
Sodium Imaging
In addition to the proton MRI methods, sodium (23Na)MRI has also been developed to evaluate cartilagematrix composition, in particular PG concentration,which was reviewed in detail by Borthakur et al (80).As discussed earlier, the GAG side chains of the PG arenegatively charged, which concentrates cations includ-ing Naþ and Kþ in the cartilaginous interstitial fluid.Based on the ideal Donnan theory, the fixed chargedensity (FCD), which is correlated with GAG concen-tration, can be estimated based on sodium content(81,82). Therefore, sodium can serve as an attractivenatural endogenous contrast for PG evaluation.
Compared with proton MRI, sodium MRI, however,suffers from inherent low SNR due to (i) low concen-trations in vivo (300 mM of 23Na versus 50 M of 1H inhealthy cartilage); (ii) a four times lower gyromagneticratio (11.262 MHz/T of 23Na versus 42.575 MHz/T for1H); and (iii) the ultra-short T2 and T2* relaxationtimes (short T2 and T2* component less than 2 ms,and long T2 and T2* component less than 15 ms).Thus, it is highly challenging to acquire in vivosodium MR images with adequate SNR and spatialresolution under a clinically reasonable scan time.Higher static magnetic field strengths, dedicated coilsand optimal pulse sequences are essential for in vivosodium MRI.
The 3D gradient echo sequences have demonstratedthe feasibility of sodium MRI of the human knee invivo (80). However, these approaches are suboptimalas they required long TE values of 2–6.4 ms. Threedimensional projection imaging permits extremelyshort TE and has been implemented for sodium kneeimaging either with twisted projection imaging (TPI,TE ¼ 0.4 ms) (80), straight radial projections (TE ¼0.16 ms) (83), or 3D cones (TE ¼ 0.6 ms) (84). Nonse-lective hard RF pulses are also essential to achieveshort TE in these 3D projection sequences. Usingthese techniques, normally at 3T and/or 7T, imagescan be acquired approximately within 15–30 min witha reasonable SNR and spatial resolution, Figure 12(SNR 30 with nominal resolution 3.4 mm3, scan time14 min using a quadrature 23Na coil at 7T (83);SNR�7 at 3T using a sodium-only coil and SNR�17at 7T using a dual-tuned sodium/proton surface coil.
Both 3T and 3 T measures had TE ¼ 0.6 ms, nominalresolution 2 mm3, scan time 26 min) (84).
In addition to the above efforts to reduce the TE tothe lowest limit allowed by hardware, a recent studysuggested an optimization of sodium SNR under SARconstraints with a shorter “steady-state” TR andsmaller flip angles to take advantage of short sodiumT1 (�24 ms at 4T) (85). This shorter TR allowed moredata averaging (although it meanwhile increased theTE due to SAR limit), which resulted in an approxi-mately 30% SNR increase compared with “fully relax-ed” parameters. At 4.7T, using this projectionacquisition in the steady state (PASS) sequence,sodium images (TR/TE ¼ 30/0.185 ms), with SNR 8–10 were acquired within 9 min (85).
Sodium content in cartilage measured by NMR andMRI was highly correlated with measures from induc-tively coupled plasma emission spectroscopy (ICP)(81) and standard dimethylmethylene blue PG assays(82), respectively. Using relaxation normalized calibra-tion phantoms, sodium absolute concentration andthen FCD were quantified. In trypsin-digested bovinecartilage, with over 20% PG depletion, sodium imagesignal change correlated significantly with theobserved PG loss (80). Improved methods were sug-gested later to correct for B1 inhomogeneity, as wellas for T1 and T2* weighting during sodium quantifica-tion, and showed the feasibility of using sodium MRIto distinguish early degenerated cartilage using invivo data from controls in vivo at 4.7T with a surfacecoil (80). At 7T, sodium concentrations were reducedsignificantly in OA subjects (n ¼ 3) compared withcontrols (n ¼ 5) by approximately 30–60%, dependingon the degree of cartilage degeneration (83).
The major advantage of sodium MR imaging of carti-lage is its high specificity to PG content without theneed for any exogenous contrast. Moreover, the lowsodium content (<50 mmol/L) of surrounding struc-tures in the joint enables visualization of the cartilagewith very high tissue contrast. However, sodium MRIis primarily limited by special hardware requirementsand by inherently low sensitivity at the standard clini-cal field strength of 1.5T. With the increasing avail-ability of scanners with high field strength (3T orhigher), it may find more general applications.
Figure 11. High-spatial-resolution morphologic MR images and MR imaging parameter maps (ADC, FA, and T2) in healthyvolunteer (top row: 31-year-old man, right knee) and a subject with OA (bottom row: 60-year-old woman, Kellgren-Lawrencegrade of 3) (Figure reprinted from reference (79), with permission).
Quantitative MRI of Articular Cartilage 1003
Page 32Page 32 SMRT Educational Seminar Volume 17, Number 3: Musculoskeletal MRI: Cartilage and Ligaments
Quantitative MRI of Articular Cartilage and Its Clinical Applications
Ultra Short Echo Imaging Methods
Sequences that acquire data with ultra-short or negli-gible time between excitation and data acquisition aredesigned to image tissue components with very shortT2 of a few milliseconds or less (86), which are other-wise “invisible” with conventional MR sequences. Inaddition to cortical bone and tendons, the ultra-shortecho (UTE) methods have been applied to cartilage,menisci and vertebral disc, as reviewed by Bae et al(87). In cartilage, with the exception of the laminarsplendens, the T2 relaxation times decrease from thesuperficial zone to the deep zone as discussed previ-ously. In the calcified zone close to the bone-cartilageinterface, the T2 relaxation times can be 10 ms orless. Changes within these regions may be importantin early detection of cartilage degeneration.
The typical UTE sequences apply half excitationpulses, and data are acquired on the gradient ramp tokeep a minimal TE, normally from a few micro-seconds (ms) to less than 100 ms. The data acquisitionwas developed with both 2D and 3D implementation,including 2D radial, twisted radial or spiral acquisi-tion, and 3D projection reconstruction (3D PR),twisted projection imaging (TPI) and hybrid methodssuch as acquisition-weighted stack of spirals (87).Multiple techniques for long-T2 component suppres-sion in UTE were proposed to improve the contrastand visualization of short T2 component, includingdual echo acquisition with echo or scaled echo sub-traction, methods based on RF pulses that selectivelysaturate or null long T2-component for saturation andtheir modifications (86,88).
More recently, UTE sequences have been used forquantifying T2* by Williams et al (89) and T1r by Du et
al (90) in cartilage and other MSK tissues with shortT2 such as Achilles tendon and meniscus. The root-mean-square average coefficients of variation (RMSA-CV) of in vivo UTE-T2* measures in cartilage wasreported to be 8%, 6%, 16% for full-thickness, super-ficial and deep cMFC ROIs, corresponding to absoluteerrors (SD) of 1.2, 1.5, 1.5 ms, respectively (89). Thesesequences also have potential to quantify the relaxa-tion times and the fractions of short and long watercomponents in cartilage and other tissues.
REPAIR AND REGENERATION
MR methods especially those characterizing changesin the extra-cellular matrix play an important role inassessing cartilage repair (91). Microfracture is a fre-quently used technique for the repair of articular car-tilage lesions of the knee, which is performed byinducing multiple penetrating injuries into the sub-chondral bone. Pluripotent mesenchymal progenitorcells migrate into the injury area, which subsequentlyform reparative fibrocartilage. Such generated fibro-cartilage typically lacks stratification of hyaline carti-lage matrix structure. In contrast, other techniques,including mosaicplasty, autologous chondrocytetransplantation (ACT) or matrix-associated autologouschondrocyte transplantation (MACT) are expected togenerate more hyaline cartilage with stratification ofmatrix structure.
Marlovits et al developed a Magnetic ResonanceObservation of Cartilage Repair Tissue (MOCART)classification system that defined nine variables todescribe the morphology and signal intensity of therepair tissue compared with the adjacent native
Figure 12. In vivo sodium imaging at 7T and 3T, respectively. 3T: 15,000 projections, RF 80�/0.5 ms, TR 80 ms, 2 mm iso-
tropic resolution, time of acquisition (TA) 20 min; 7T: 10,000 projections, RF 90�/0.5 ms, TR 100 ms, 2 mm isotropic resolu-
tion, TA 17 min. IR RECT: 3D radial with the rectangular inversion; IR WURST: 3D radial with the adiabatic Wide-bandUniform Rate and Smooth Truncation (WURST) inversion pulse (“IR WURST” experiment). Images Courtesy of Dr. RavinderRegatte. [Color figure can be viewed in the online issue, which is available at wileyonlinelibrary.com.]
1004 Li and Majumdar
Page 33Page 33 SMRT Educational Seminar Volume 17, Number 3: Musculoskeletal MRI: Cartilage and Ligaments
Quantitative MRI of Articular Cartilage and Its Clinical Applications
cartilage. Excellent interobserver reproducibility ofMOCART grading was reported and the gradings werecorrelated to clinical outcomes evaluated by visualanalog score (VAS) and the knee injury and osteoar-thritis outcome score (KOOS) in a 2-year longitudinalstudy (92).
In a prospective 2-year study in symptomaticpatients with isolated full-thickness articular cartilagedefects treated with the microfracture technique out-comes, clinical rating and MRI was combined. MRIshowed good repair-tissue fill in the defect in 13patients (54%), moderate fill in 7 (29%), and poor fillin 4 patients (17%) and correlated with the knee func-tion scores (93). A multi-modal approach using T2,diffusion weighted imaging and grading of MR imageshas been used for assessing postoperative cartilage.While grading did not show differences between thetwo repair techniques, microfracture therapy andMACT, T2-mapping showed lower T2 values aftermicrofracture, and diffusion weighted imagingbetween healthy cartilage and cartilage repair tissuein both procedures (94). Mamisch et al (95) prospec-tively used T2 cartilage maps to study the effect ofunloading during the MR scan in the postoperativefollow-up of patients after MACT of the knee joint.They demonstrated that T2 values change with thetime of unloading during the MR scan, and this differ-ence was more pronounced in repair tissue. The dif-ference between the repair and control tissue was alsogreater after longer unloading times, suggesting thatassessment of cartilage repair is affected by the timingof the image acquisition relative to unloading thejoint. A combined T1r and T2 study examining
repaired and the surrounding cartilage has demon-strated differences in cartilage after microfracture andmosaicplasty 3–6 months and after a year (96), Figure13.
Articular cartilage has very limited intrinsic regen-erative capacity, making cell-based therapy a possibleapproach for cartilage repair. Tissue engineered colla-gen matrix seeded with autogenous chondrocytesdesigned for the repair of hyaline articular cartilagehave also been proposed and early studies combiningMR grading and quantitative T2 mapping have beenused to assess the impact of such repair (97). In addi-tion to fill efficacy the layered appearance or partialstratification of T2 as a result of collagen orientationwas detected in this study for 2 patients at 12 monthsand 4 patients at 24 months. Cell tracking can be amajor step toward unraveling and improving therepair process of some of these therapies. Micrometersized (MPIOs) and superparamagnetic iron oxides(SPIO) for labeling bone marrow-derived mesenchymalstem cells regarding effectivity, cell viability, long-term metabolic cell activity, chondrogenic differentia-tion has been studied (98,99). MPIO labeling resultsin efficient contrast uptake and signal loss that canbe visualized and quantitatively characterized bymeans of MRI. SPGR imaging of implanted cellsresults in ex vivo detection within native tissue, andT1r imaging is unaffected by the presence of labeledcells immediately following implantation. MPIO label-ing does not affect quantitative GAG production dur-ing chondrogenesis, but iron aggregation hindersextracellular matrix visualization (98). Similarly, SPIOlabeling was effective and did not impair any of the
Figure 13. Representative T1r (left) and T2 (right) maps 3–6 months and 1-year after microfracture (96). RT: repaired tissue;NC: normal cartilage. [Color figure can be viewed in the online issue, which is available at wileyonlinelibrary.com.]
Quantitative MRI of Articular Cartilage 1005
Page 34Page 34 SMRT Educational Seminar Volume 17, Number 3: Musculoskeletal MRI: Cartilage and Ligaments
Quantitative MRI of Articular Cartilage and Its Clinical Applications
studied safety aspects, and injected and implantedSPIO-labeled cells can be accurately be visualized byMRI in a clinically relevant sized joint (100).
CONCLUSIONS
Quantitative MRI can provide noninvasive measure-ment of cartilage morphology as well as early changeswithin the matrix, which should be used concurrentlyfor evaluating cartilage degeneration during OA. Inparticular, measures that detect early changes in thematrix may provide novel imaging markers for carti-lage degeneration at early and potentially reversiblestages. The most value of these advanced measuresprobably lies in evaluating subjects who are at earlystages of the disease, and have a high risk of fast pro-gression, such as those with obesity or with acuteinjuries. Such imaging markers will provide criticalevaluation and monitoring for early intervention andprevention of the disease of OA. The quantitative MRIcan be also effective in augmenting the longitudinalassessment of cohorts at risk for premature osteoar-thritis, such as developmental dysplasia of the hip,femoroacetabular impingement, and patellofemoraldysmorphism.
While univariate analysis of each MR parametersdiscussed in this study demonstrated promisingresults, combing them using advanced statisticalanalysis method will provide multparametric evalua-tion and integrate information related with differentaspects of the cartilage matrix, which has the poten-tial to further improve our capability to distinguishdegenerated cartilage from controls, as well as tomonitor subtle changes after interventions.
Current advanced MRI methods for quantifyingmatrix changes normally require a long acquisitiontime and have a limited spatial resolution. Furthertechnique development to increase the spatial resolu-tion, the signal-to-noise ratio, and to reduce theacquisition time will facilitate translating these techni-ques into clinical applications.
Another critical issue for applying these advancedMRI techniques in clinical trial or studies is thestandardization of the acquisition and postprocessingtechniques. As discussed earlier, quantification varia-tion can be caused by different scanner models, dif-ferent sequence types and different postprocessingmethodologies. The efforts of having standardizedimaging and image processing protocols need to besynthesized between academic and industrial com-munities. More longitudinal and multicenter large-scale studies are warranted to evaluate the reliability(repeatability), validity, sensitivity, and specificity ofadvanced MRI measures as biomarkers for evaluatingcartilage degeneration in OA.
REFERENCES
1. Dijkgraaf LC, de Bont LG, Boering G, Liem RS. The structure, bio-chemistry, and metabolism of osteoarthritic cartilage: a review ofthe literature. J Oral Maxillofac Surg 1995;53:1182–1192.
2. Goldring M, Goldring S. Osteoarthritis. J Cell Physiol 2007;213:626–634.
3. Peterfy CG, Guermazi A, Zaim S, et al. Whole-Organ MagneticResonance Imaging Score (WORMS) of the knee in osteoarthritis.Osteoarthritis Cartilage 2004;12:177–190.
4. Hunter DJ, Lo GH, Gale D, Grainger AJ, Guermazi A, ConaghanPG. The reliability of a new scoring system for knee osteoarthritisMRI and the validity of bone marrow lesion assessment: BLOKS(Boston Leeds Osteoarthritis Knee Score). Ann Rheum Dis 2008;67:206–211.
5. Eckstein F, Adam C, Sittek H, et al. Non-invasive determinationof cartilage thickness throughout joint surfaces using magneticresonance imaging. J Biomech 1997;30:285–289.
6. Stammberger T, Eckstein F, Michaelis M, Englmeier KH, ReiserM. Interobserver reproducibility of quantitative cartilage measure-ments: comparison of B-spline snakes and manual segmentation.Magn Reson Imaging 1999;17:1033–1042.
7. Lynch JA, Zaim S, Zhao J, Stork A, Peterfy CG, Genant HK, edi-tors. Cartilage segmentation of 3D MRI scans of the osteoarthriticknee combining user knowledge and active contours. SPIE, Medi-cal Imaging; 2000; San Diego, CA.
8. Grau V, Mewes AU, Alcaniz M, Kikinis R, Warfield SK. Improvedwatershed transform for medical image segmentation using priorinformation. IEEE Trans Med Imaging 2004;23:447–458.
9. Pakin SK, Tamez-Pena JG, Totterman S, Parker KJ, editors.Segmentation, surface extraction, and thickness computationof articular cartilage. SPIE, Medical Imaging; 2002; San Diego,CA.
10. Warfield SK, Kaus M, Jolesz FA, Kikinis R. Adaptive, templatemoderated, spatially varying statistical classification. Med ImageAnal 2000;4:43–55.
11. Carballido-Gamio J, Bauer JS, Stahl R, et al. Inter-subject com-parison of MRI knee cartilage thickness. Med Image Anal 2008;12:120–135.
12. Ateshian GA, Soslowsky LJ, Mow VC. Quantitation of articularsurface topography and cartilage thickness in knee joints usingstereophotogrammetry. J Biomech 1991;24:761–776.
13. Pelletier JP, Raynauld JP, Berthiaume MJ, et al. Risk factorsassociated with the loss of cartilage volume on weight-bearingareas in knee osteoarthritis patients assessed by quantitativemagnetic resonance imaging: a longitudinal study. Arthritis ResTher 2007;9:R74.
14. Carballido-Gamio J, Link T, Majumdar S. New techniques forcartilage magnetic resonance imaging relaxation time analysis:texture analysis of flattened cartilage and localized intra- andinter-subject comparisons. Magn Reson Med 2008;59:1472–1477.
15. Cohen ZA, Mow VC, Henry JH, Levine WN, Ateshian GA. Tem-plates of the cartilage layers of the patellofemoral joint and theiruse in the assessment of osteoarthritic cartilage damage. Osteo-arthritis Cartilage 2003;11:569–579.
17. Mankin HJ, Thrasher AZ. Water content and binding in normaland osteoarthritic human cartilage. J Bone Joint Surg Am 1975;57:76–80.
18. Bashir A, Gray ML, Burstein D. Gd-DTPA2- as a measure of carti-lage degradation. Magn Reson Med 1996;36:665–673.
19. Gray ML, Burstein D, Kim YJ, Maroudas A. 2007 Elizabeth Win-ston Lanier Award Winner. Magnetic resonance imaging of carti-lage glycosaminoglycan: basic principles, imaging technique, andclinical applications. J Orthop Res 2008;26:281–291.
20. Siversson C, Tiderius CJ, Neuman P, Dahlberg L, Svensson J.Repeatability of T1-quantification in dGEMRIC for three differentacquisition techniques: two-dimensional inversion recovery,three-dimensional look locker, and three-dimensional variableflip angle. J Magn Reson Imaging 2010;31:1203–1209.
21. Burstein D, Velyvis J, Scott KT, et al. Protocol issues for delayedGd(DTPA)(2-)-enhanced MRI (dGEMRIC) for clinical evaluation ofarticular cartilage. Magn Reson Med 2001;45:36–41.
22. Williams A, Sharma L, McKenzie CA, Prasad PV, Burstein D.Delayed gadolinium-enhanced magnetic resonance imaging ofcartilage in knee osteoarthritis: findings at different radiographicstages of disease and relationship to malalignment. ArthritisRheum 2005;52:3528–3535.
23. Anandacoomarasamy A, Giuffre BM, Leibman S, et al. Delayedgadolinium-enhanced magnetic resonance imaging of cartilage:
1006 Li and Majumdar
Page 35Page 35 SMRT Educational Seminar Volume 17, Number 3: Musculoskeletal MRI: Cartilage and Ligaments
Quantitative MRI of Articular Cartilage and Its Clinical Applications
clinical associations in obese adults. J Rheumatol 2009;36:1056–1062.
24. Ericsson YB, Tjornstrand J, Tiderius CJ, Dahlberg LE. Relation-ship between cartilage glycosaminoglycan content (assessed withdGEMRIC) and OA risk factors in meniscectomized patients.Osteoarthritis Cartilage 2009;17:565–570.
25. Tiderius CJ, Olsson LE, Nyquist F, Dahlberg L. Cartilage glycos-aminoglycan loss in the acute phase after an anterior cruciate lig-ament injury: delayed gadolinium-enhanced magnetic resonanceimaging of cartilage and synovial fluid analysis. Arthritis Rheum2005;52:120–127.
27. Mamisch TC, Kain MS, Bittersohl B, et al. Delayed gadolinium-enhanced magnetic resonance imaging of cartilage (dGEMRIC) inFemoacetabular impingement. J Orthop Res 2011;29:1305–1311.
28. Jessel RH, Zilkens C, Tiderius C, Dudda M, Mamisch TC, KimYJ. Assessment of osteoarthritis in hips with femoroacetabularimpingement using delayed gadolinium enhanced MRI of carti-lage. J Magn Reson Imaging 2009;30:1110–1115.
29. Kim YJ, Jaramillo D, Millis MB, Gray ML, Burstein D. Assess-ment of early osteoarthritis in hip dysplasia with delayedgadolinium-enhanced magnetic resonance imaging of cartilage. JBone Joint Surg Am 2003;85:1987–1992.
30. Pai A, Li X, Majumdar S. A comparative study at 3 T of sequencedependence of T2 quantitation in the knee. Magn Reson Imaging2008;26:1215–1220.
31. Regatte RR, Akella SV, Borthakur A, Kneeland JB, Reddy R. Pro-teoglycan depletion-induced changes in transverse relaxationmaps of cartilage: comparison of T2 and T1rho. Acad Radiol2002;9:1388–1394.
32. Xia Y. Relaxation anisotropy in cartilage by NMR microscopy(muMRI) at 14-microm resolution. Magn Reson Med 1998;39:941–949.
33. Nieminen MT, Rieppo J, Toyras J, et al. T2 relaxation reveals spa-tial collagen architecture in articular cartilage: a comparativequantitative MRI and polarized light microscopic study. MagnReson Med 2001;46:487–493.
34. Reiter DA, Roque RA, Lin PC, Doty SB, Pleshko N, Spencer RG.Improved specificity of cartilage matrix evaluation using multiex-ponential transverse relaxation analysis applied to pathomimeti-cally degraded cartilage. NMR Biomed 2011;24:1286–1294.
35. Wang N, Xia Y. Dependencies of multi-component T2 and T1rhorelaxation on the anisotropy of collagen fibrils in bovine nasalcartilage. J Magn Reson 2011;212:124–132.
36. Dardzinski BJ, Mosher TJ, Li S, Van Slyke MA, Smith MB. Spa-tial variation of T2 in human articular cartilage. Radiology 1997;205:546–550.
37. Li X, Pai A, Blumenkrantz G, et al. Spatial distribution and rela-tionship of T1rho and T2 relaxation times in knee cartilage withosteoarthritis. Magn Reson Med 2009;61:1310–1318.
38. Mosher T, Liu Y, Yang Q, et al. Age dependency of cartilage mag-netic resonance imaging T2 relaxation times in asymptomaticwomen. Arthritis Rheum 2004;50:2820–2828.
39. Mosher TJ, Collins CM, Smith HE, et al. Effect of gender on invivo cartilage magnetic resonance imaging T2 mapping. J MagnReson Imaging 2004;19:323–328.
40. Li X, Ma C, Link T, et al. In vivo T1rho and T2 mapping of articu-lar cartilage in osteoarthritis of the knee using 3 Tesla MRI.Osteoarthritis and Cartilage 2007;15:789–797.
41. Koff MF, Amrami KK, Kaufman KR. Clinical evaluation of T2 val-ues of patellar cartilage in patients with osteoarthritis. Osteoar-thritis Cartilage 2007;15:198–204.
42. Bolbos R, Zuo J, Banerjee S, et al. Relationship between trabecu-lar bone structure and articular cartilage morphology and relaxa-tion times in early OA of the knee joint using parallel MRI at 3 T.Osteoarthritis Cartilage 2008;16:1150–1159.
43. Lammentausta E, Kiviranta P, Toyras J, et al. Quantitative MRIof parallel changes of articular cartilage and underlying trabecu-lar bone in degeneration. Osteoarthritis Cartilage 2007;15:1149–1157.
44. Mosher TJ, Liu Y, Torok CM. Functional cartilage MRI T2 map-ping: evaluating the effect of age and training on knee cartilageresponse to running. Osteoarthritis Cartilage 2010;18:358–364.
45. Subburaj K, Kumar D, Souza RB, et al. The Acute Effect of Run-ning on Knee Articular Cartilage and Meniscus Magnetic Reso-nance Relaxation Times in Young Healthy Adults. Am J SportsMed 2012;9:2134–2141.
46. Potter HG, Jain SK, Ma Y, Black BR, Fung S, Lyman S. Cartilageinjury after acute, isolated anterior cruciate ligament tear: imme-diate and longitudinal effect with clinical/MRI follow-up. Am JSports Med 2012;40:276–285.
47. Schneider E, NessAiver M, White D, et al. The osteoarthritis initi-ative (OAI) magnetic resonance imaging quality assurance meth-ods and results. Osteoarthritis Cartilage 2008;16:994–1004.
48. Hovis KK, Stehling C, Souza RB, et al. Physical activity is associ-ated with magnetic resonance imaging-based knee cartilage T2measurements in asymptomatic subjects with and those withoutosteoarthritis risk factors. Arthritis Rheum 2011;63:2248–2256.
49. Pan J, Pialat JB, Joseph T, et al. Knee cartilage T2 characteristicsand evolution in relation to morphologic abnormalities detectedat 3-T MR imaging: a longitudinal study of the normal controlcohort from the osteoarthritis initiative. Radiology 2011;261:507–515.
50. Joseph GB, Baum T, Alizai H, et al. Baseline mean and heteroge-neity of MR cartilage T(2) are associated with morphologic degen-eration of cartilage, meniscus, and bone marrow over 3 years -data from the Osteoarthritis Initiative. Osteoarthritis Cartilage2012;20:727–735.
51. Li X, Han E, Busse R, Majumdar S. In vivo T1rho mapping in car-tilage using 3D magnetization-prepared angle-modulated parti-tioned k-space spoiled gradient echo snapshots (3D MAPSS).Magn Reson Med 2008;59:298–307.
52. Witschey W, Borthakur A, Elliott M, et al. T1rho-prepared bal-anced gradient echo for rapid 3D T1rho MRI. J Magn ResonImaging 2008;28:744–754.
53. Regatte RR, Akella SV, Wheaton AJ, et al. 3D-T1rho-relaxationmapping of articular cartilage: in vivo assessment of early degen-erative changes in symptomatic osteoarthritic subjects. AcadRadiol 2004;11:741–749.
54. Charagundla SR, Borthakur A, Leigh JS, Reddy R. Artifacts inT(1rho)-weighted imaging: correction with a self-compensatingspin-locking pulse. J Magn Reson 2003;162:113–121.
55. Chen W, Takahashi A, Han E. Quantitative T(1)(rho) imagingusing phase cycling for B0 and B1 field inhomogeneity compen-sation. Magn Reson Imaging 2011;29:608–619.
56. Li X, Cheng J, Lin K, et al. Quantitative MRI using T1rho and T2in human osteoarthritic cartilage specimens: correlation with bio-chemical measurements and histology. Magn Reson Imaging2011;29:324–334.
57. Akella SV, Regatte RR, Wheaton AJ, Borthakur A, Reddy R.Reduction of residual dipolar interaction in cartilage by spin-locktechnique. Magn Reson Med 2004;52:1103–1109.
58. Duvvuri U, Goldberg AD, Kranz JK, et al. Water magnetic relaxa-tion dispersion in biological systems: the contribution of protonexchange and implications for the noninvasive detection of carti-lage degradation. Proc Natl Acad Sci U S A 2001;98:12479–12484.
59. Mlynarik V, Szomolanyi P, Toffanin R, Vittur F, Trattnig S. Trans-verse relaxation mechanisms in articular cartilage. J Magn Reson2004;169:300–307.
60. Kettunen M, Grohn O, Silvennoinen M, Penttonen M, KauppinenR. Effects of intracellular pH, blood, and tissue oxygen tension onT1rho relaxation in rat brain. Magn Reson Med 2002;48:470–477.
61. Mosher TJ, Zhang Z, Reddy R, et al. Knee articular cartilage dam-age in osteoarthritis: analysis of MR image biomarker reproduci-bility in ACRIN-PA 4001 multicenter trial. Radiology 2011;258:832–842.
62. Stahl R, Luke A, Li X, et al. T1rho, T2 and focal knee cartilageabnormalities in physically active and sedentary healthy subjectsversus early OA patients--a 3.0-Tesla MRI study. Eur Radiol2009;19:132–143.
63. Zarins ZA, Bolbos RI, Pialat JB, et al. Cartilage and meniscusassessment using T1rho and T2 measurements in healthy sub-jects and patients with osteoarthritis. Osteoarthritis Cartilage2010;18:1408–1416.
64. Li X, Ma C, Bolbos R, et al. Quantitative assessment of bone mar-row edema pattern and overlying cartilage in knees with
Quantitative MRI of Articular Cartilage 1007
Page 36Page 36 SMRT Educational Seminar Volume 17, Number 3: Musculoskeletal MRI: Cartilage and Ligaments
Quantitative MRI of Articular Cartilage and Its Clinical Applications
osteoarthritis and anterior cruciate ligament tear using MR imag-ing and spectroscopic imaging. J Magn Reson Imaging 2008;28:453–461.
65. Li X, Kuo D, Theologis A, et al. Cartilage in anterior cruciateligament-reconstructed knees: MR imaging T1frhog and T2--initial experience with 1-year follow-up. Radiology 2011;258:505–514.
66. Henkelman RM, Stanisz GJ, Graham SJ. Magnetization transferin MRI: a review. NMR Biomed 2001;14:57–64.
67. Kim DK, Ceckler TL, Hascall VC, Calabro A, Balaban RS. Analy-sis of water-macromolecule proton magnetization transfer inarticular cartilage. Magn Reson Med 1993;29:211–215.
68. Gray ML, Burstein D, Lesperance LM, Gehrke L. Magnetizationtransfer in cartilage and its constituent macromolecules. MagnReson Med 1995;34:319–325.
69. Henkelman RM, Huang X, Xiang QS, Stanisz GJ, Swanson SD,Bronskill MJ. Quantitative interpretation of magnetization trans-fer. Magn Reson Med 1993;29:759–766.
70. Sled JG, Pike GB. Quantitative imaging of magnetization transferexchange and relaxation properties in vivo using MRI. MagnReson Med 2001;46:923–931.
71. Stikov N, Keenan KE, Pauly JM, Smith RL, Dougherty RF, GoldGE. Cross-relaxation imaging of human articular cartilage. MagnReson Med 2011;66:725–734.
72. van Zijl PC, Yadav NN. Chemical exchange saturation transfer(CEST): what is in a name and what isn’t? Magn Reson Med2011;65:927–948.
73. Ling W, Regatte RR, Navon G, Jerschow A. Assessment of glycos-aminoglycan concentration in vivo by chemical exchange-dependent saturation transfer (gagCEST). Proc Natl Acad Sci U SA 2008;105:2266–2270.
74. Schmitt B, Zbyn S, Stelzeneder D, et al. Cartilage quality assess-ment by using glycosaminoglycan chemical exchange saturationtransfer and (23)Na MR imaging at 7 T. Radiology 2011;260:257–264.
75. Deng X, Farley M, Nieminen MT, Gray M, Burstein D. Diffusiontensor imaging of native and degenerated human articular carti-lage. Magn Reson Imaging 2007;25:168–171.
76. de Visser SK, Bowden JC, Wentrup-Byrne E, et al. Anisotropy ofcollagen fibre alignment in bovine cartilage: comparison of polar-ised light microscopy and spatially resolved diffusion-tensormeasurements. Osteoarthritis Cartilage 2008;16:689–697.
77. Raya JG, Arnoldi AP, Weber DL, et al. Ultra-high field diffusiontensor imaging of articular cartilage correlated with histology andscanning electron microscopy. MAGMA 2011;24:247–258.
78. Staroswiecki E, Granlund KL, Alley MT, Gold GE, Hargreaves BA.Simultaneous estimation of T(2) and apparent diffusion coeffi-cient in human articular cartilage in vivo with a modified three-dimensional double echo steady state (DESS) sequence at 3 T.Magn Reson Med 2012;67:1086–1096.
79. Raya JG, Horng A, Dietrich O, et al. Articular cartilage: in vivodiffusion-tensor imaging. Radiology 2012;262:550–559.
80. Borthakur A, Mellon E, Niyogi S, Witschey W, Kneeland J, ReddyR. Sodium and T1rho MRI for molecular and diagnostic imagingof articular cartilage. NMR Biomed 2006;19:781–821.
81. Lesperance LM, Gray ML, Burstein D. Determination of fixedcharge density in cartilage using nuclear magnetic resonance. JOrthop Res 1992;10:1–13.
82. Shapiro EM, Borthakur A, Gougoutas A, Reddy R. 23Na MRIaccurately measures fixed charge density in articular cartilage.Magn Reson Med 2002;47:284–291.
83. Wang L, Wu Y, Chang G, et al. Rapid isotropic 3D-sodium MRI ofthe knee joint in vivo at 7T. J Magn Reson Imaging 2009;30:606–614.
84. Staroswiecki E, Bangerter NK, Gurney PT, Grafendorfer T, GoldGE, Hargreaves BA. In vivo sodium imaging of human patellar
cartilage with a 3D cones sequence at 3 T and 7 T. J Magn ResonImaging 2010;32:446–451.
85. Watts A, Stobbe RW, Beaulieu C. Signal-to-noise optimization forsodium MRI of the human knee at 4.7 Tesla using steady state.Magn Reson Med 2011;66:697–705.
86. Gatehouse PD, Bydder GM. Magnetic resonance imaging of shortT2 components in tissue. Clin Radiol 2003;58:1–19.
87. Bae WC, Du J, Bydder GM, Chung CB. Conventional and ultra-short time-to-echo magnetic resonance imaging of articular carti-lage, meniscus, and intervertebral disk. Top Magn Reson Imaging2010;21:275–289.
88. Du J, Takahashi AM, Bae WC, Chung CB, Bydder GM. Dualinversion recovery, ultrashort echo time (DIR UTE) imaging: cre-ating high contrast for short-T(2) species. Magn Reson Med 2010;63:447–455.
89. Williams A, Qian Y, Chu CR. UTE-T2 * mapping of human articu-lar cartilage in vivo: a repeatability assessment. OsteoarthritisCartilage 2011;19:84–88.
90. Du J, Carl M, Diaz E, et al. Ultrashort TE T1rho (UTE T1rho)imaging of the Achilles tendon and meniscus. Magn Reson Med2010;64:834–842.
92. Marlovits S, Singer P, Zeller P, Mandl I, Haller J, Trattnig S. Mag-netic resonance observation of cartilage repair tissue (MOCART)for the evaluation of autologous chondrocyte transplantation:determination of interobserver variability and correlation to clini-cal outcome after 2 years. Eur J Radiol 2006;57:16–23.
93. Mithoefer K, Williams RJ III, Warren RF, et al. Chondral resurfac-ing of articular cartilage defects in the knee with the microfrac-ture technique. Surgical technique. J Bone Joint Surg Am 2006;88(Suppl 1 Pt 2):294–304.
94. Welsch GH, Trattnig S, Domayer S, Marlovits S, White LM,Mamisch TC. Multimodal approach in the use of clinical scoring,morphological MRI and biochemical T2-mapping and diffusion-weighted imaging in their ability to assess differences betweencartilage repair tissue after microfracture therapy and matrix-associated autologous chondrocyte transplantation: a pilot study.Osteoarthritis Cartilage 2009;17:1219–1227.
95. Mamisch TC, Trattnig S, Quirbach S, Marlovits S, White LM,Welsch GH. Quantitative T2 mapping of knee cartilage: differentia-tion of healthy control cartilage and cartilage repair tissue in theknee with unloading--initial results. Radiology 2010;254:818–826.
96. Holtzman DJ, Theologis AA, Carballido-Gamio J, Majumdar S, LiX, Benjamin C. T(1rho) and T(2) quantitative magnetic resonanceimaging analysis of cartilage regeneration following microfractureand mosaicplasty cartilage resurfacing procedures. J Magn ResonImaging 2010;32:914–923.
97. Crawford DC, Heveran CM, Cannon WD Jr, Foo LF, Potter HG.An autologous cartilage tissue implant NeoCart for treatment ofgrade III chondral injury to the distal femur: prospective clinicalsafety trial at 2 years. Am J Sports Med 2009;37:1334–1343.
98. Saldanha KJ, Doan RP, Ainslie KM, Desai TA, Majumdar S. Micro-meter-sized iron oxide particle labeling of mesenchymal stem cellsfor magnetic resonance imaging-based monitoring of cartilage tis-sue engineering. Magn Reson Imaging 2011;29:40–49.
99. Majumdar S, Li X, Blumenkrantz G, et al. MR imaging andearly cartilage degeneration and strategies for monitoringregeneration. J Musculoskelet Neuronal Interact 2006;6:382–384.
100. van Buul GM, Kotek G, Wielopolski PA, et al. Clinically translat-able cell tracking and quantification by MRI in cartilagerepair using superparamagnetic iron oxides. PLoS One 2011;6:e17001.
1008 Li and Majumdar
SMRT Educational Seminar Volume 17, Number 3: Musculoskeletal MRI: Cartilage and LigamentsPage 37
Nadja A. Farshad-Amacker, M.D. and Hollis G. Potter, M.D.*
Review
MRI of Knee Ligament Injury and Reconstruction
Nadja A. Farshad-Amacker, MD and Hollis G. Potter, MD*
This article is accredited as a journal-based CME activity.If you wish to receive credit for this activity, please refer tothe website: www.wileyhealthlearning.com
ACCREDITATION AND DESIGNATION STATEMENT
Blackwell Futura Media Services designates this journal-based CME activity for a maximum of 1 AMA PRA Category1 CreditTM. Physicians should only claim credit commensu-rate with the extent of their participation in the activity.
Blackwell Futura Media Services is accredited by theAccreditation Council for Continuing Medical Education toprovide continuing medical education for physicians.
EDUCATIONAL OBJECTIVES
Upon completion of this educational activity, participants willbe better able to define appropriate indications for MRI in theevaluation of patients with suspected pulmonary embolism,potential aortic dissection, or myocardial ischemia; and sum-marize the evidence supporting the use of MRI in the evalua-tion of patients with suspected pulmonary embolism, poten-tial aortic dissection, or myocardial ischemia.
ACTIVITY DISCLOSURES
No commercial support has been accepted related to thedevelopment or publication of this activity.
Faculty Disclosures:
Editor-in-Chief: C. Leon Partain, MD, PhD has no con-flicts of interest to disclose.
CME Editor: Scott B. Reeder, MD, PhD has no conflictsof interest to disclose.
CME Committee: Pratik Mukherjee, MD, PhD, ShreyasVasanawala, MD, PhD, Bonnie Joe, MD, PhD, Tim Leiner,MD, PhD, Sabine Weckbach, MD, and Frank Korosec, PhDhave no conflicts of interest to disclose. Scott K. Nagle, MD,PhD discloses a personal shareholder investment in GE.Mustafa R. Bashir, MD discloses research support fromBracco Diagnostics and Siemens Healthcare, and consul-tant honorarium from Bayer Pharmaceuticals.
Authors: Nadja A. Farshad-Amacker,MD,HollisG. Potter,MD,havenothing todisclose.ScottK.Nagle,MD,PhD,disclosesaper-sonal shareholder investment inGE.
This manuscript underwent peer review in line withthe standards of editorial integrity and publication ethicsmaintained by Journal of Magnetic Resonance Imaging.The peer reviewers have no relevant financial relation-ships. The peer review process for Journal of MagneticResonance Imaging is double-blinded. As such, the identi-ties of the reviewers are not disclosed in line with thestandard accepted practices of medical journal peerreview.
Conflicts of interest have been identified and resolvedin accordance with Blackwell Futura Media Services’sPolicy on Activity Disclosure and Conflict of Interest. No rel-evant financial relationships exist for any individual in con-trol of the content and therefore there were no conflicts toresolve.
INSTRUCTIONS ON RECEIVING CREDIT
For information on applicability and acceptance of CMEcredit for this activity, please consult your professionallicensing board.
This activity is designed to be completed within an hour;physicians should claim only those credits that reflect thetime actually spent in the activity. To successfully earncredit, participants must complete the activity during thevalid credit period.
Follow these steps to earn credit:
� Log on to www.wileyhealthlearning.com
� Read the target audience, educational objectives, andactivity disclosures.
� Read the article in print or online format.
� Reflect on the article.
� Access the CME Exam, and choose the best answer to
each question.
� Complete the required evaluation component of theactivity.
This activity will be available for CME credit for twelvemonths following its publication date. At that time, it willbe reviewed and potentially updated and extended for anadditional period.
The MRI Research Laboratory, Department of Radiology and Imaging, Hospital for Special Surgery, New York, New York, USA.
*Address reprint requests to: H.G.P., MRI Department, Hospital for Special Surgery, 535 East 70th Street, New York, NY 10021. E-mail:[email protected]
Received December 14, 2012; Accepted June 19, 2013.
DOI 10.1002/jmri.24311View this article online at wileyonlinelibrary.com.
JOURNAL OF MAGNETIC RESONANCE IMAGING 38:757–773 (2013)
CME
VC 2013 Wiley Periodicals, Inc. 757
Page 38Page 38 SMRT Educational Seminar Volume 17, Number 3: Musculoskeletal MRI: Cartilage and Ligaments
MRI of Knee Ligament Injury and Reconstruction
Knee ligament instability may lead to meniscal and chon-dral damage, resulting in early osteoarthritis. Due to itssuperior soft tissue contrast and avoidance of harmful ion-izing radiation, MRI has become the most important imag-ing modality for early recognition of structural defects ofthe knee joint. This review aims to the understanding ofMRI appearances of knee ligament structures associatedwith knee instability, and to review the common patternsof altered knee mechanics that lead to ligament failure.Normal anatomy of the knee ligaments, pathologic condi-tions, and postsurgical appearances of the anterior cruci-ate ligament, posterior cruciate ligament, medial collateralligament, and posterolateral corner are described.
KNEE INSTABILITY can occur if one or more of themajor ligaments are disrupted. The key structures,which contribute to its stability, are the anterior cru-ciate ligament (ACL), the posterior cruciate ligament(PCL), the medial collateral ligament (MCL), and theposterolateral corner complex (PLC). Knee instabilityhas been identified as a risk factor for meniscal andchondral damage, resulting in early osteoarthritis;therefore, early recognition and treatment is impor-tant (1,2). MRI has become the most useful imagingmodality due to its superior soft tissue contrast, lackof ionizing radiation and multiplanar capabilities.This review aims to provide a summary of current evi-dence and standards regarding MRI of structuresrelated to the static stabilizers of the knee.
ANTERIOR CRUCIATE LIGAMENT
Anatomy and Normal ACL Appearance
The ACL originates from the posteromedial aspect ofthe femoral condyle and consists of two distinct ana-
tomic components based on their insertion at thetibia: an anteromedial band (AMB) and a posterolat-eral band (PLB) (3–5). The ACL is composed primarilyof longitudinally oriented collagen type I fibers (3,4,6)and is surrounded by synovium (3–5). Its main vascu-lar supply is by the middle geniculate artery withadditional supply from the inferior medial and lateralgeniculate arteries (4). Biomechanically, the ACL isthe primary stabilizer to anterior tibial displacement.The AMB becomes tight in flexion and the PLB atextension. Therefore, a failure of the AMB results inanterior instability whereas failure of the PLB resultsin rotational instability (7), which may be provoked inpivoting sports such as soccer or basketball.Increased signal surrounding and between the bun-dles of the ACL on short echo time (TE) MR images isconsidered normal and reflects the orientation of thefascicles to the static magnetic field as well as adja-cent fat surrounding the ligament.
ACL Tears
The ACL is the most common injured ligament withapproximately 3000 per year in United States andapproximately 200,000 ACL reconstructions per-formed (8). The ACL is most commonly affected inhyperextension injuries, as seen in competitive down-hill skiers or football players but also may secondarilytear following valgus loads after primary MCL failureas in the intermediate skier that traverses the slopeand sustains a primary valgus moment (Table 1). MRIis the most noninvasive method for diagnosing ACLtears with a sensitivity of 87–94%, specificity of50–100%, and accuracy of 91–95% (9–11). Most ACLtears occur in the middle portion of the ligament, lessfrequently at the femoral or tibial attachment (12,13).
Acute Complete ACL Tears
Direct signs of acute, complete ACL tear are (a) com-plete discontinuity of fibers or (b) irregular contour
Table 1
Location of Bone Marrow Edema and Injured Ligamentous Structures According to the Injury Pattern
Page 39Page 39 SMRT Educational Seminar Volume 17, Number 3: Musculoskeletal MRI: Cartilage and Ligaments
MRI of Knee Ligament Injury and Reconstruction
Figure 2. A Segond fracture (arrows), associated with a complete ACL tear (arrowhead) in a 26-year-old patient is shown on(a) radiograph and (b) a coronal proton density-weighted fast spin-echo.
Figure 1. Complete ACL tear in a 15-year-old patient. Sagittal (a,c) T2-weighted fat saturated fast spin-echo and (b,d) protondensity-weighted fast spin-echo images show complete, acute ACL rupture (arrows) in the middle portion of the ligament withtranschondral fractures (arrowheads) in the lateral femoral condyle and the lateral tibial plateau as well as buckling of thePCL (open arrow) and undercovering of the posterior horn of the lateral meniscus (*) as secondary signs.
MRI of Knee Ligament Injury and Reconstruction 759
Page 40Page 40 SMRT Educational Seminar Volume 17, Number 3: Musculoskeletal MRI: Cartilage and Ligaments
MRI of Knee Ligament Injury and Reconstruction
with increased signal intensity on water sensitivesequences (13,14) (Fig. 1). Several secondary signs ofcomplete ACL tear have been described with a lowsensitivity (34–90%) but a high specificity (91–100%)and, therefore, can be a helpful hint to the diagnosisof ACL tear. The most useful secondary signs are thePCL buckle (Fig. 1), an “uncovering” posterior horn ofthe lateral meniscus (Fig. 1), the entire lateral collat-eral ligament (LCL) seen on one coronal image, trans-lational bone contusion in the lateral compartment(Fig. 1), anterior displacement of the tibia (more than5–7 mm, more pronounced laterally), lateral femoralsulcus (deeper than 1.5 mm), and the posterior PCLline, which is a line drawn parallel to the posteriormargin of the distal portion of the PCL and extendedproximally (15–19). A PCL line is considered positive ifit does not intersect with the medullary cavity of thefemur (20). Furthermore, hemarthrosis is often asso-ciated with ACL rupture (21,22). It should be notedthat the presence of the translational bone marrowedema pattern created by the pivot shift is indicative
of recent tibial translation (Table 1) but not the pres-ence of an acute ACL, as these injuries may be seenin the setting of chronic ACL insufficiency.
Furthermore, ACL tears are often associated withinjury to additional structures, such as the MCL,meniscal tears, and Segond fractures, an avulsionfracture at the lateral capsular insertion of the tibia,which is found in 6–13% of ACL rupture (23) (Fig. 2).Avulsions fractures of the tibial eminence may occur,mostly noted in children (24). Note should be madethat acute eminence avulsions are associated withinterstitial load imparted to the ligament before bonyfailure; thus, the ligament is not entirely “normal” inthe setting of a primary footprint avulsion (Fig. 3).
Acute Partial ACL Tears
Partial ACL tears are common (ranges from 20–47% ofACL tears) (7,22,25) and can progress to completeACL deficiency, particularly when the amount of liga-ment tear comprises more than half of its substance
Figure 3. Avulsion fracture of the ACL in a 16-year-old patient. Sagittal (a) T2-weighted fat saturated fast spin-echo and (b)proton density-weighted fast spin-echo MR images show the avulsion fragment (arrows) at the intercondylar eminence of thetibia. Note thickened, diffusely hyperintense ACL (arrowheads).
Figure 4. Isolated PLB tear of the ACL in a 24-year-old patient with resultant laxity, who eventually underwent isolatedreconstruction of the PLB. a: Sagittal and (b,c) coronal proton density-weighted fast spin-echo MR images show an isolatedtear of the PLB (arrows). d: Sagittal T2-weighted fat saturated fast spin-echo MR image shows associated bone marrow edemapattern in the anterior lateral femoral condyle and anterior tibia plateau (arrowheads) due to hyperextension injury.
760 Farshad-Amacker and Potter
Page 41Page 41 SMRT Educational Seminar Volume 17, Number 3: Musculoskeletal MRI: Cartilage and Ligaments
MRI of Knee Ligament Injury and Reconstruction
(26). Partial ACL tears are more difficult to diagnosein MRI than complete tears because of their varioustear patterns (25). A higher sensitivity (87%), specific-ity (87%), and accuracy (87%) has been described byusing standard orthogonal sequences plus obliqueaxial intermediate-weighted images (27). MR signs ofpartial tears are (a) abnormal intra-ligament signal,(b) bowing of the ligament, and (c) inability to identifyall fibers (28). In partial tears, both bundles can beaffected partially or one of the two bundle can be torncompletely with the AMB more commonly affectedthan the PLB (12,29) (Fig. 4).
Chronic ACL Tears
Chronic ACL tears may show (a) hypointense horizon-tally oriented remnant fibers, (b) ACL resorption yield-ing the “empty notch” sign and/or (c) anterior
displacement of the tibia relative to the femur on“nonloaded” MRI (13–15,30,31) (Fig. 5). Careful scru-tiny of the individual bundle orientation is necessaryto disclose more subtle, chronic partial tears.
Ganglion Cysts of the Cruciate Ligaments
Ganglion cysts consist of mucinous degeneration ofconnective tissue and/or synovial fluid imbibition(Fig. 6). These cysts may cause intermittent pain orrestricted knee motion (particularly the extremes offlexion) but do not necessarily reflect ACL tear (32).
Reconstruction of the ACL
Autograft tendon harvest is the graft of choice in mostorthopedic practices instead of the formerly usedprosthetic ligament grafts (33–35). The most commonautologous grafts are a bone–patellar tendon–bone(BPTB) or a multiple-strand hamstring with semite-ndinosus and gracilis tendon (34,36,37) (Fig. 7). Theuse of hamstring grafts is becoming more popularbecause of low reported graft side morbidity (38).Given that the material properties of the graft are afunction of the graft cross sectional diameter, thehamstring tendons are commonly doubled or quad-rupled to reinforce the tissue, often interlinked withsuture. Given the suture reinforcement, increasedsusceptibility artifact will be encountered, particularlywhen scanning at field strengths of 3 Tesla (T) orhigher, and the use of wider receiver bandwidth ishelpful in reducing the artifact around the graft andat the points of fixation.
The double bundle reconstruction was introducedto restore the AMB and the PLB to maintain the anat-omy and kinematics of the knee in comparison to thesingle bundle reconstruction (Fig. 7). Although manystudies failed to show any significant differencesbetween the two techniques (39–41), a recent meta-analysis of eighteen studies states a (a) significanthigher negative rate of pivot shift and positive Lach-man test, (b) significant differences regarding theInternational Knee Documentation Committee meas-urements (IKDC) Score, and (c) relevant decrease incomplications (42). Others have documented a
Figure 5. Chronic, complete ACL tear in a 29-year-old patient. The (a) sagittal T2-weighted fat saturated fast spin-echo and(b) proton density-weighted fast spin-echo MR images show absent ACL with hypointense, horizontally oriented remnantfibers and the (c) coronal proton density-weighted fast spin-echo image shows an “empty notch sign.”
Figure 6. Ganglion cysts of ACL (arrows) in a 60-year-oldpatient with a stiff knee, shown on sagittal T2-weighted fatsaturated fast spin-echo MR image.
MRI of Knee Ligament Injury and Reconstruction 761
Page 42Page 42 SMRT Educational Seminar Volume 17, Number 3: Musculoskeletal MRI: Cartilage and Ligaments
MRI of Knee Ligament Injury and Reconstruction
Figure 7. Different ACL reconstructions. Sagittal proton density-weighted fast spin-echo images show (a) normal appearanceof a single bundle BPTB reconstruction, 6 years postoperative, (b) a single bundle reconstruction in a “more anatomic posi-tion,” 11 months postoperative and (c,d) a double bundle reconstruction with a hamstring graft, 7 months postoperative.
Figure 8. Intact BPTB ACL graft with persistent anterior displacement of the tibia (laterally 1.3 cm, normally < 5 mm) (18) ina 19-year-old patient, noted on (a) coronal and (b) sagittal proton density-weighted fast spin-echo.
Figure 9. Acute and chronic ACL graft ruptures. Sagittal (a,b) T2-weighted fat saturated fast spin-echo and (c) protondensity-weighted fast spin-echo MR images show acute ACL graft rupture (arrows) in a 41-year-old patient. Note the boneedema pattern within the lateral femoral condyle and in the posterolateral tibial plateau (*). (d) Sagittal proton density-weighted fast spin-echo MR image shows chronic ACL graft rupture (arrow) in a 51-year-old patient.
762 Farshad-Amacker and Potter
Page 43Page 43 SMRT Educational Seminar Volume 17, Number 3: Musculoskeletal MRI: Cartilage and Ligaments
MRI of Knee Ligament Injury and Reconstruction
decreased revision rate in a 2-year follow-up (43).Further studies are needed to prove a superior resultwith the double-bundle reconstruction (44).
In the setting of a partial tear, partial reconstructionof the affected band may be performed as an augmen-tation (29). Previous studies have recommendedreconstruction of individual bundle tears, as it pre-vents anterior laxity, preserves neuronal elements andmechanoreceptors, and influences the vascularity andreinnervation, also in regard due to the risk of pro-gression to full thickness tears and functional ACLinsufficiency if the partial ACL tear involve more than50% of the ligament fibers, (26,29).
Normal MRI Appearance of ACL Grafts
A correct surgical placement of the femoral and tibialtunnels is crucial to restore knee homeostasis, resolvefunctional instability and limit complications of recon-struction such as impingement or graft failure. In the
traditional endoscopic techniques, the femoral tunnelis placed as far posterior as possible, and only a 1–2mm thick cortical rim should remain (36). The open-ing of the proximal tibial tunnel in the sagittal planeshould be immediately posterior to the intersection ofthe Blumensaat’s line and in the coronal plane, at theintercondylar eminence (36). Three-dimensional highspatial resolution sequences are recommended toobtain oblique axial images for better visualization ofthe double-bundle graft (45–47).
A homogenously hypointense signal on moderate tolong TE sequences in the proximal to midportion isconsidered normal on all pulse sequences in theimmediate postoperative period in BPTB and ham-string grafts (48–51), but the latter may have a stri-ated appearance because of the four separate strandsand may contain small amounts of fluid collections inthe osseous tunnel (34,35,50). After 3–8 months, thegraft undergoes revascularization, cellular remodeling,and re-synovialization, which changes the MR signal
Figure 10. ACL graft impingement in a 15-year-old patient. Sagittal (a) T2-weighted fat saturated fast spin-echo and (b) pro-ton density-weighted fast spin-echo MR images show a thickened, diffusely hyperintense ACL graft with localized scarring ofthe Hoffa’s fat pad, consistent with a cyclops lesion (arrows).
Figure 11. ACL arthrofibrosis with a ruptured ACL graft in a 42-year-old patient. The (a) sagittal and (b) axial protondensity-weighted fast spin-echo MR images show diffuse fibrous scarring of the Hoffa’s fat pad (arrows) with extension to thesuprapatellar recess (arrowhead). Note remnant of the ACL graft (open arrow).
MRI of Knee Ligament Injury and Reconstruction 763
Page 44Page 44 SMRT Educational Seminar Volume 17, Number 3: Musculoskeletal MRI: Cartilage and Ligaments
MRI of Knee Ligament Injury and Reconstruction
from hypointense signal to a T1- and T2-weightedintermediate signal (33,52). After 12 months, the grafttypically resembles a native ACL histologically (52)and on MRI (47,50) (Fig. 7a). This process has beendescribed as “ligamentization” of the tendon graft (53).After 12 months following ACL graft reconstruction,high sensitivity (100%) and specificity (86%) andaccuracy (87%) in diagnosing ACL graft tears can beachieved (54). However, in some cases increased intra-substance signal may remain for years and may chal-lenge the diagnosis of graft tears (55). It is, therefore,of utmost importance to correlate the MR findingswith clinical functions and symptoms. Persistentanterior displacement of the tibia relative to the femuris noted following clinically successful ACL recon-struction, suggesting that the native mechanics of theknee are not fully restored following surgery (Fig. 8).
Note should be made that the more recent trendtoward an “anatomic” femoral and tibial footprintbrings the graft more inferiorly on the femur in theintercondylar notch and more anteromedially on thetibia (56) (Fig. 7b). This affects the signal properties ofthe graft, with more prolonged hyperintensity in thedelayed perioperative period. It remains unclear if thissignal reflects plastic deformation of the graft or thefact that these grafts are “seeing” more load. Furtherstudy in this area is warranted.
Complication of ACL Reconstruction
Complications associated with ACL reconstructioninclude: (a) partial or complete rupture, (b) graftimpingement, (c) arthrofibrosis, (d) tunnel expansion/osteolysis, (e) ganglion formation, and (f) infection(33,51).
Graft ruptures are almost always associated withtrauma. The MR criteria for graft tear are (a) increasedsignal intensity within the graft on water sensitivepulse sequences together with (b) partial or completediscontinuity of the fibers, depending on the amountof rupture (33,51) (Fig. 9). Associated findings due tothe pivot shift result in bone contusion pattern due to
the transchondral fractures (35,57) (Fig. 9b). Most ofthe secondary signs described for native ACL tearsare not helpful in diagnosing ACL graft tears in termsof low sensitivity and specificity (57); for example, anuncovered posterior lateral meniscal horn, a horizon-tal orientation of the graft, an abnormal PCL line orbuckling of the PCL may be due to the persistentanterior displacement of the tibia (57).
Graft impingement is most commonly a result of amal-positioned proximal tibial tunnel and presentsclinically as loss of terminal knee extension(56,58,59). An additional cause is mechanical irrita-tion of the synovium adjacent to the native ACLstump when not entirely debrided. Impingement isbest detected on sagittal images on MRI. Increasedsignal intensity within an intact graft may be seen atthe site of impingement (33). A notchplasty can pre-vent impingement of the graft against the roof of thenotch (60,61). Impingement may also lead to focalfibrosis and nodule formation resulting in a cyclopslesion (Fig. 10).
Arthrofibrosis is one of the most serious complica-tions following ligament surgery of the knee with inci-dences ranging from 4–35% (62), presenting clinicallywith limited joint motion and ultimately in a mechani-cal block. It is caused by fibrous scarring of the Hof-fa’s fat pad with possible extension to the supra- andparapatellar recesses and appears on MRI as a diffuseT1- and T2-weighted hypointense mass (35) (Fig. 11).Arthrofibrosis is a cytokine-mediated globalized cap-sular contraction (63,64) and is distinguished fromthe focal mechanical deformation of the synovium inthe cyclops lesion. It should not be confused with nor-mal postoperative changes, appearing as a linear lowsignal intensities within Hoffa’s fad pad. A retainednative ACL remnant can clinically and on MRI mimicthe signs of arthrofibrosis.
Tunnel expansion or osteolysis is most commonlyobserved within the first 3 months after reconstruc-tion. Signs for tunnel expansion on MRI are (a) tunnelwidening and (b) T2-weighted hyperintense signalaround the graft within the femoral and tibial tunnels,
Figure 12. Tunnel widening in a synthetic graft in a 51-year-old patient who underwent ACL reconstruction in the 1980s.Sagittal (a) T2-weighted fat saturated fast spin-echo (b) proton density-weighted fast spin-echo MR images show reactive syn-ovitis surrounding a synthetic (Gortex) graft with tunnel expansion (arrows).
764 Farshad-Amacker and Potter
Page 45Page 45 SMRT Educational Seminar Volume 17, Number 3: Musculoskeletal MRI: Cartilage and Ligaments
MRI of Knee Ligament Injury and Reconstruction
Figure 13. ACL graft infection in a 57-year-old patient. (a) Sagittal T2-weighted fat saturated fast spin-echo MR image showsmultiple lymph nodes within the popliteal fossa (arrows). (b) Axial proton density-weighted fast spin-echo MR image showslamellated synovium (arrowheads) and a lymph node in the popliteal fossa (arrow). The (c) sagittal and (d) axial protondensity-weighted fast spin-echo MR images show widening of the tibial tunnel (open arrows).
Figure 14. Complete PCL tear in a 27-year-old patient. Sagittal (a) T2-weighted fat saturated fast spin-echo and (b) protondensity-weighted fast spin-echo MR images show a hyperintense, disrupted PCL (arrows). Note intact Humphrey ligament(arrowheads).
MRI of Knee Ligament Injury and Reconstruction 765
Page 46Page 46 SMRT Educational Seminar Volume 17, Number 3: Musculoskeletal MRI: Cartilage and Ligaments
MRI of Knee Ligament Injury and Reconstruction
representing either fluid and/or granulation tissue (35).Recognition of tunnel expansion must occur early, as acomplex two-stage revision becomes required if the tun-nel expansion is too pronounced (35,65).
Although no longer commonly used for ligamentreconstruction, synthetic grafts yield a distinct appear-ance on MRI and, in a suitable host, may incite aninflammatory reaction throughout the synovium, result-ing in tunnel widening that can pose a challenge at thetime of revision, requiring tunnel bone grafting (66) (Fig.12). When assessing for any adverse synovial responsefollowing ligament reconstruction, a knowledge of thesurgical used technique is crucial in assessment (33).
Ganglion cysts within the graft tunnel and also pre-tibial ganglion cyst formation has been reported in aminority of cases (36,67). Tunnel cysts may progressto tunnel widening but only rarely in graft instability.More commonly, the cysts may extent out the tibialtunnel and generate pain in the thin adjacent subcu-taneous fat. Reported factors leading to tunnel cystsformation are bioabsorbable interference screws, non-
Graft infection is rare (incidence of 0.1–0.9%) andoften found in the early postoperative phase (36).Classic clinical signs of infection might be absent,particularly in low grade infections (36). MR signs forgraft infection are synovitis with lamellated synovium,bone erosion, periarticular edema, sinus tract, orabscess formation (36,51) (Fig. 13). In the setting ofinfection following allograft reconstruction, the allo-graft bone may serve as a sequestrum and should beremoved at the time of debridement.
POSTERIOR CRUCIATE LIGAMENT
Anatomy and Normal MR Appearance
The PCL originates from the lateral aspect of themedial femoral condyle at the intercondylar notch,inserts at the posterolateral aspect of the intra-articular tibia and creates a vertical angle of 30–45
�,
depending on the amount of flexion (68). The fiber
Figure 15. Multiple ligament knee injury with associated nerve injury in a 16-year-old patient. The (a) sagittal proton den-sity-weighted fast spin-echo MR image shows complete rupture of the PCL. Axial (b) proton density-weighted fast spin-echoand (c) T2-weighted fat saturated fast spin-echo MR images show ruptured PCL (arrow), ruptured ACL (*), posterolateral cor-ner injury (open arrow), and hyperintense signal alterations within the common peroneal nerve (arrowhead). (d) Axial T2-weighted fat saturated fast spin-echo image shows denervation edema within the extensor compartment (open arrowhead).
Figure 16. High grade PCL partial tear in a 19-year-old patient who injured his knee while playing football. (a) Sagittal pro-ton density-weighted fast spin-echo MR image shows hyperintense signal alteration within the PCL (arrow), (b) sagittal T2-weighted fat saturated fast spin-echo MR image shows bone marrow edema pattern in the posteromedial tibial plateau (*)and (c) axial proton density-weighted fast spin-echo MR image shows an associated MCL tear (open arrow) and semimembra-nosus tendon avulsion (arrowhead).
766 Farshad-Amacker and Potter
Page 47Page 47 SMRT Educational Seminar Volume 17, Number 3: Musculoskeletal MRI: Cartilage and Ligaments
MRI of Knee Ligament Injury and Reconstruction
bundles of the PCL are spirally oriented and the PCLis thicker and stronger than the ACL (69). It is alsoextrasynovial and consists of two functional but lesswell defined anatomic components compared with theACL bundles; a larger anterolateral bundle (ALB) anda smaller posteromedial bundle (PMB) (68). Biome-chanically, the PCL is the primary stabilizer to preventposterior translation of the tibia (70). At high flexionthe ALB is important for the mediolateral translation,whereas the PMB is more important in constrainingthe anteroposterior translation of the tibia (71). Lowsignal intensity in a well-defined band on all pulsesequences is a normal MRI appearance (69).
Acute Complete PCL Tears
Most commonly, the PCL is injured by direct highvelocity force to the anterior aspect of the flexed knee,
as the dashboard injury (Table 1) (72–74). Most oftenPCL tears occur in its midsubstance (63%) and lesscommonly proximally (27%) or distally (3%), or as anavulsion injury of the tibial insertion (7%) (69). Directsigns for tears are (a) increased signal intensity withinthe ligament, (b) discontinuity of the fibers, and(c) redundancy of an avulsed ligament (75) (Figs. 14and 15). Associated other injuries to the knee are fre-quent (>50%). Meniscal tears are the most commonassociated injuries, with the medial side more com-monly affected than the lateral side (69). Furtherassociated injuries are other ligament injuries, includ-ing the MCL, ACL, and posterolateral corner struc-tures, and direct bone contusions from anteriorimpaction to the tibia (30,69). Abnormal bone align-ment may be noted as a posterior shift of the tibia(30). Complete PCL tears are often associated withmultiple ligament injuries resulting in complete knee
Figure 17. A 26-year-old patient 4 years after a sports injury. The sagittal (a) T2-weighted fat saturated fast spin-echo and(b) proton density-weighted fast spin-echo MR images demonstrate minimal signal alteration and focal thickening on the fatsuppression but moderately abnormal signal on the nonfat suppressed images within the PCL (arrows).
Figure 18. Intact PCL reconstruction in a 22-year-old patient shown on sagittal (a) T2-weighted fat saturated fast spin-echoand (b) proton density-weighted fast spin-echo.
MRI of Knee Ligament Injury and Reconstruction 767
Page 48Page 48 SMRT Educational Seminar Volume 17, Number 3: Musculoskeletal MRI: Cartilage and Ligaments
MRI of Knee Ligament Injury and Reconstruction
dislocation and adjacent popliteal artery (up to 45%) ornerve injuries, with the peroneal nerve as the mostcommon injured nerve (12,76–78) (Fig. 15). Nerve thick-ening, intrasubstance hyperintense signal abnormal-ities or disruption of the nerve and surrounding edemaare indicators for nerve damage. It has been shownthat nerve injuries are often observed by MRI and sur-gery in patients who have clinically significant symp-toms (12). The implementation of contrast-enhancedMR angiography (MRA) is useful in patients who arepresenting with multiple ligament injured knees, in thepresence or even in the absence of decreased palpablepopliteal or dorsalis pedis pulses (12,79).
Acute and Chronic Partial PCL Tears
Acute partial PCL tears demonstrate hyperintense sig-nal alterations on water sensitive pulse sequences
without complete disruption of the ligament (Fig. 16).Without history of trauma and a more extensivelyincreased signal on short TE images, mucoid degener-ation must be considered (80). Chronic PCL partialtears or scarring after an injury may demonstrateminimal signal alteration and focal thickening of thePCL (Fig. 17).
Reconstruction of the PCL
The incidence of PCL injuries is far less common thanthat of ACL, somewhere between 1 and 44% of injuredknees (69,73). Therefore, there are fewer outcomestudies available and the single bundle reconstructionis more often used (81). In comparison to formerlyconservative treatment of PCL injuries, reconstructionof the PCL is becoming progressively importantbecause of the emphasis that chronic instability is
Figure 20. Partial MCL tear dissecting into the patellofemoral ligament in a 17-year-old patient. The (a) coronal and (b) axialproton density-weighted fast spin-echo MR images show disruption of the deeper layer of the MCL (open arrowhead) withmeniscocapsular separation and a partial tear of the medial patellofemoral ligament (arrowhead).
Figure 19. Complete MCL tear in a 27-year-old patient. The (a) coronal and (b) axial proton density-weighted fast spin-echoMR images show complete disrupted MCL (arrows). Note that the injury has extended to the medial patellofemoral ligamenton the axial image.
768 Farshad-Amacker and Potter
Page 49Page 49 SMRT Educational Seminar Volume 17, Number 3: Musculoskeletal MRI: Cartilage and Ligaments
MRI of Knee Ligament Injury and Reconstruction
leading to early degenerative changes (82). For PCLreconstruction, autografts such as BPTB, hamstring,
quadriceps tendon and allografts such as Achilles, tibi-
alis anterior and tibialis posterior tendon can be used
(83), with the BPTB and hamstring as the most com-
monly used grafts. The normal MR appearance of the
PCL grafts parallels the findings of the ACL grafts (35)
(Fig. 18). Some authors have noted persistent increased
intrasubstance signal on both T1- and T2-weighted
image in serial evaluation in the first year (84).
MEDIAL COLLATERAL LIGAMENT
Anatomy and Normal MCL Appearance
The MCL originates from the medial epicondyle of thefemur posteriorly and attaches at the proximal meta-physis of the tibia approximately 6 cm below thejoint capsule (85). It contains two dominant compo-
nents: superficial and deep fibers. At the anteriorthird of the medial aspect of the knee joint, thesuperficial MCL layer and the crural fascia are fusedand form the medial retinaculum (86,87). At the pos-terior third, the superficial and the deep MCL layerfuse to form the posterior oblique ligament (POL)(86,87). The POL together with the semimembrano-sus tendon and their aponeurotic extensions formthe posteromedial corner (87,88). The deep layer ofthe MCL inserts directly in the medial meniscus (86)and consists of a meniscofemoral and meniscotibialligament whose attachments are either at the femoralcondyle or at the superficial MCL layer and at thetibia inferiorly to the joint space, respectively (85,87–89). Between the superficial and deep layers, there isa bursa and variable amount of fatty tissue (86). TheMCL is normally thin and of low signal intensity inall MR pulse sequences and it is best seen in coronalor axial images (30,86).
Figure 21. MCL partial tear in a 45-year-old patient. The (a) coronal and (b) axial proton density-weighted fast spin-echo MRimages show disrupted fibers of the deep layer of the MCL (arrows). Incidentally, a Segond avulsion is noted (arrowhead).
Figure 22. MCL repair in a 22-year-old patient shown on (a,b) coronal and (c) axial proton density-weighted fast spin-echoMR images. Note the hypertrophic scarring at the femoral origin (arrows).
MRI of Knee Ligament Injury and Reconstruction 769
Page 50Page 50 SMRT Educational Seminar Volume 17, Number 3: Musculoskeletal MRI: Cartilage and Ligaments
MRI of Knee Ligament Injury and Reconstruction
Pathologic MRI MCL Appearance
MCL tears most often occur following valgus stress,clipping injuries in valgus and pivot shift injuries(Table 1) (74). MCL tears are most common in theproximal fibers, followed by distal and midsubstance(12). A complete MCL tear results in discontinuity andhyperintense signal on all MR pulse sequences (Fig.19). Associated avulsion fractures at the attachmentsite or an associated valgus compression fractures ofthe lateral compartment may be found (30,90). Whendiagnosing anterior MCL tears at the femur on coronalMR images, careful scrutiny of the axial images isnecessary to determine the integrity of the medialpatellofemoral ligament and retinaculum (Figs. 19and 20). In severe injuries, dissection may continue tothe vastus medialis obliquus (VMO) fibers or to thesemimembranosus tendon (Fig. 16).
Partial tears demonstrate hyperintense signal on allpulse sequences and discontinuity of at least somefibers, whereas low grade injuries are typically mani-fest as a thickened, mildly hyperintense MCL on allpulse sequences and perifocal edema (30) (Figs. 20and 21). Surrounding edema is often observed in any
acute MCL injuries, although it is nonspecific and canalso be present in other knee problems, such asmeniscal tears or osteoarthritis (91).
Chronic MCL tears demonstrate a thickened liga-ment and may be associated with calcification or ossi-fication of the medial collateral ligament, also knownas the Pellegrini-Stieda disease (92,93).
MCL Reconstruction and Normal MR Appearance
MCL fibroblasts have a higher capacity to remodel to func-tional capacity compared with ACL fibroblasts. As such,the MCL rarely undergoes primary repair; when neces-sary, this is typically performed as an augmentation usingautologous hamstring tendon (Bosworth procedure) (94).In the setting of a multiple ligament injured knee, the defi-cient MCL is reconstructed with allograft tissue.
The postoperative MCL is denoted as a thickened lig-ament and may persist thickened for many years. Thesignal intensity in the T1- and T2-weighted imagesare initially increased and starts decreasing over time(Fig. 22). Postoperative ossification may occur (Pelle-grini-Stieda) (35).
Figure 23. Posterolateral corner injury in a 25-year-old patient. The (a) coronal and (b) axial proton density-weighted fastspin-echo MR image show signal alteration within the LCL (arrow) and of the popliteus tendon (arrowhead) at their origin,corresponding to high-grade partial tears.
Figure 24. Severe posterolateral corner injury in a 16-year-old patient who had a multiple ligament knee injury. The (a,b)coronal and (c) axial proton density-weighted fast spin-echo MR images show complete rupture of the LCL (arrows) and thepopliteus tendon (arrowheads), the latter of which displaced onto the popliteofibular ligament (*).
770 Farshad-Amacker and Potter
Page 51Page 51 SMRT Educational Seminar Volume 17, Number 3: Musculoskeletal MRI: Cartilage and Ligaments
MRI of Knee Ligament Injury and Reconstruction
POSTEROLATERAL CORNER
Anatomy and Normal PLC Appearance
The lateral capsular structures are best divided in ananterolateral and posterolateral stabilizing complex.The anterolateral stabilizing complex contains the fas-cia lata, which continues as the iliotibial tract andtogether form the lateral patellar retinaculum andinsert at the tubercle of Gerdy (95). The posterolateralstabilizing complex or posterolateral corner structuresinclude: (a) the LCL, (b) the posterolateral capsule, (c)the arcuate ligament, (d) the popliteofibular ligament,(e) the fabellofibular ligament, (f) popliteus tendon/muscle, (g) biceps femoris tendon, and (h) the lateralhead of the gastrocnemius (35,95,96). The popliteusmuscle is a rotatory stabilizer; thus, its course isobliquely oriented, running from medial to lateral andposterior to anterior on serial coronal MR images. Theterm “posterolateral corner” usually refers to thosecomponents that are subject to eventual reconstruc-tion, including the LCL, popliteus tendon, and thepopliteofibular ligament.
The LCL originates from the lateral femoral condyleimmediately below the lateral gastrocnemius muscleand insert as conjoined tendon with the biceps femoristendon at the head of the fibula, laterally (88,97). Thepopliteus tendon arises from the lateral femoral con-dyle intra-articular below the lateral collateral ligamentand attaches at the posteromedial surface of the proxi-mal tibia (97). The popliteus tendon is connected to the
fibula by the popliteofibular ligament, which inserts
medially at the head of the fibula and further to the lat-
eral meniscus by the popliteal meniscal ligament
(95,98). The arcuate ligament is a thickening of the
joint capsule, has an Y-shaped configuration and
inserts at the head of the fibula immediately medially to
the conjoined tendon of the LCL and biceps femoris
(95). The oblique popliteal ligament reinforces together
with the semimembranosus tendon the capsule (95).
The lateral gastrocnemius tendon originates from the
epicondylar process of the femur. The fabellofibular lig-
ament is an inconsistent ligament that arises from the
fabella, an osseous or cartilaginous body adjacent to
the gastrocnemius tendon, and inserts at the lateral
base of the fibular head between the popliteofibular lig-
ament and the arcuate ligament (88,97).The posterolateral corner structures are best identi-
fied using the coronal and axial MRI planes. Someinvestigators have found superior visualization of theligaments by the use of a coronal oblique plane withthe popliteus tendon as the key structure (99).
Pathologic MRI PLC Appearance
Posterolateral corner injuries are most often observedin severe extension and varus stress injuries withmultiple ligament knee injuries (Table 1) (74). On MRIthe LCL, popliteus tendon, popliteofibular ligament,and biceps femoris tendon injuries are denoted asincreased signal intensity with disruption of fibers.Injuries of the popliteus tendon are most often found
at the muscle-tendon junction and less commonly atits origin (Fig. 23). Isolated popliteus injury, however,may occur and the attachment at the femur should beroutinely assessed on MR imaging, regardless of thesuspected clinical diagnosis (100). Injuries of the PLCstructures are often associated with other ligamen-tous injuries, particularly ACL, MCL, and PCL tears(96,101) (Table 1; Figs. 15 and 24). In the setting of asevere PLC injury, the adjacent peroneal nerve shouldbe assessed for the presence of traumatic neuritis ordisruption of nerve fascicles (Fig. 15). Similarly, thealignment of the tibiofibular joint should be deter-mined, as well as the integrity of the capsularligaments.
CONCLUSION
MRI allows reliable assessment of knee ligamentstructures and therefore is the image modality ofchoice in diagnosing knee ligament instability. Thisreview demonstrates the MRI signal characteristics ofthe knee ligaments and helps understanding the com-plex anatomy of the knee joint. Depending on themechanism of injury, attention should be directedtoward specific knee ligament(s). The science of liga-ment reconstruction is a dynamic one, and the evolu-tion of graft choices, tunnel placement and graftmechanics requires a continuous update on currentorthopedic surgical techniques to ensure accurateand reproducible image interpretation.
REFERENCES
1. Lee J-J, Choi Y-J, Shin K-Y, Choi C-H. Medial meniscal tears inanterior cruciate ligament-deficient knees: effects of posteriortibial slope on medial meniscal tear. Knee Surg Relat Res 2011;23:227–230.
2. Shefelbine SJ, Ma CB, Lee K-Y, et al. MRI analysis of in vivomeniscal and tibiofemoral kinematics in ACL-deficient and nor-mal knees. J Orthop Res 2006;24:1208–1217.
3. Petersen W, Zantop T. Anatomy of the anterior cruciate ligamentwith regard to its two bundles. Clin Orthop Relat Res 2007;454:35–47.
4. Giuliani JR, Kilcoyne KG, Rue J-PH. Anterior cruciate ligamentanatomy: a review of the anteromedial and posterolateral bun-dles. J Knee Surg 2009;22:148–154.
5. Siegel L, Vandenakker-Albanese C, Siegel D. Anterior cruciateligament injuries: anatomy, physiology, biomechanics, and man-agement. Clin J Sport Med 2012;22:349–355.
6. Petersen W, Tillmann B. [Anatomy and function of the anteriorcruciate ligament]. Orthopade 2002;31:710–718.
7. Siebold R, Fu FH. Assessment and augmentation of symptomaticanteromedial or posterolateral bundle tears of the anterior cruci-ate ligament. Arthroscopy 2008;24:1289–1298.
8. National Institutes of Health (NIH), National Institute of Arthritisand Musculoskeletal and Skin Diseases (NIAMS), Vanderbilt Uni-versity, United States.A Multicenter Cohort Study. Availableat: http://clinicaltrials.gov/ct2/show/NCT00463099. AccessedMarch 1, 2011.
9. Delin C, Silvera S, Coste J, et al. Reliability and diagnostic accu-racy of qualitative evaluation of diffusion-weighted MRI com-bined with conventional MRI in differentiating between completeand partial anterior cruciate ligament tears. Eur Radiol 2013;23:845–854.
10. Lee JK, Yao L, Phelps CT, Wirth CR, Czajka J, Lozman J. Ante-rior cruciate ligament tears: MR imaging compared with arthro-scopy and clinical tests. Radiology. 1988;166:861–864.
11. Vellet AD, Lee DH, Munk PL, et al. Anterior cruciate ligamenttear: prospective evaluation of diagnostic accuracy of middle-
MRI of Knee Ligament Injury and Reconstruction 771
Page 52Page 52 SMRT Educational Seminar Volume 17, Number 3: Musculoskeletal MRI: Cartilage and Ligaments
MRI of Knee Ligament Injury and Reconstruction
and high-field-strength MR imaging at 1.5 and 0.5 T. Radiology1995;197:826–830.
12. Potter HG, Weinstein M, Allen AA, Wickiewicz TL, Helfet DL.Magnetic resonance imaging of the multiple-ligament injuredknee. J Orthop Trauma 2002;16:330–339.
14. Robertson PL, Schweitzer ME, Bartolozzi AR, Ugoni A. Anteriorcruciate ligament tears: evaluation of multiple signs with MRimaging. Radiology 1994;193:829–834.
15. Boeree NR, Ackroyd CE. Magnetic resonance imaging of anteriorcruciate ligament rupture. A new diagnostic sign. J Bone JointSurg Br 1992;74:614–616.
16. Tung GA, Davis LM, Wiggins ME, Fadale PD. Tears of the ante-rior cruciate ligament: primary and secondary signs at MR imag-ing. Radiology 1993;188:661–667.
17. Al-Dadah O, Shepstone L, Marshall TJ, Donell ST. Secondarysigns on static stress MRI in anterior cruciate ligament rupture.Knee 2011;18:235–241.
18. Hill PF, Vedi V, Williams A, Iwaki H, Pinskerova V, Freeman MA.Tibiofemoral movement 2: the loaded and unloaded living kneestudied by MRI. J Bone Joint Surg Br 2000;82:1196–1198.
19. Gentili A, Seeger LL, Yao L, Do HM. Anterior cruciate ligamenttear: indirect signs at MR imaging. Radiology 1994;193:835–840.
21. DeHaven KE. Diagnosis of acute knee injuries with hemarthro-sis. Am J Sports Med 1980;8:9–14.
22. Noyes FR, Bassett RW, Grood ES, Butler DL. Arthroscopy inacute traumatic hemarthrosis of the knee. Incidence of anteriorcruciate tears and other injuries. J Bone Joint Surg Am 1980;62:687–695, 757.
23. Goldman AB, Pavlov H, Rubenstein D. The Segond fracture ofthe proximal tibia: a small avulsion that reflects major ligamen-tous damage. AJR Am J Roentgenol 1988;151:1163–1167.
24. Lafrance RM, Giordano B, Goldblatt J, Voloshin I, Maloney M.Pediatric tibial eminence fractures: evaluation and management.J Am Acad Orthop Surg 2010;18:395–405.
25. Van Dyck P, De Smet E, Veryser J, et al. Partial tear of the ante-rior cruciate ligament of the knee: injury patterns on MR imag-ing. Knee Surg Sports Traumatol Arthrosc 2012;20:256–261.
26. Noyes FR, Mooar LA, Moorman CT, McGinniss GH. Partial tearsof the anterior cruciate ligament. Progression to complete liga-ment deficiency. J Bone Joint Surg Br 1989;71:825–833.
27. Ng AWH, Griffith JF, Hung EHY, Law KY, Yung PSH. MRI diag-nosis of ACL bundle tears: value of oblique axial imaging. Skele-tal Radiol 2013;42:209–217.
28. Umans H, Wimpfheimer O, Haramati N, Applbaum YH, Adler M,Bosco J. Diagnosis of partial tears of the anterior cruciate liga-ment of the knee: value of MR imaging. AJR Am J Roentgenol1995;165:893–897.
29. Ochi M, Adachi N, Deie M, Kanaya A. Anterior cruciate ligamentaugmentation procedure with a 1-incision technique: anterome-dial bundle or posterolateral bundle reconstruction. Arthroscopy2006;22:463.e1–e5.
30. Mohana-Borges AVR, Resnick D, Chung CB. Magnetic resonanceimaging of knee instability. Semin Musculoskelet Radiol 2005;9:17–33.
31. Chen W-T, Shih TT-F, Tu H-Y, Chen R-C, Shau W-Y. Partial andcomplete tear of the anterior cruciate ligament. Acta Radiol2002;43:511–516.
32. Garcia-Alvarez F, Garcia-Pequerul JM, Avila JL, Sainz JM,Castiella T. Ganglion cysts associated with cruciate ligaments ofthe knee: a possible cause of recurrent knee pain. Acta OrthopBelg 2000;66:490–494.
33. Schatz JA, Potter HG, Rodeo SA, Hannafin JA, Wickiewicz TL.MR imaging of anterior cruciate ligament reconstruction. AJRAm J Roentgenol 1997;169:223–228.
34. Gnannt R, Chhabra A, Theodoropoulos JS, Hodler J, AndreisekG. MR imaging of the postoperative knee. J Magn Reson Imaging2011;34:1007–1021.
35. Sanders TG. Imaging of the postoperative knee. Semin Muscu-loskelet Radiol 2011;15:383–407.
36. Bencardino JT, Beltran J, Feldman MI, Rose DJ. MR imaging ofcomplications of anterior cruciate ligament graft reconstruction.Radiographics 2009;29:2115–2126.
37. Siegel MG, Barber-Westin SD. Arthroscopic-assisted outpatientanterior cruciate ligament reconstruction using the semitendino-sus and gracilis tendons. Arthroscopy 1998;14:268–277.
38. Lawhorn KW, Howell SM. Principles for using hamstring tendonsfor anterior cruciate ligament reconstruction. Clin Sports Med2007;26:567–585.
39. Gobbi A, Mahajan V, Karnatzikos G, Nakamura N. Single- ver-sus double-bundle ACL reconstruction: is there any difference instability and function at 3-year followup? Clin Orthop Relat Res2012;470:824–834.
40. Ahld�en M, Samuelsson K, Sernert N, Forssblad M, Karlsson J,Kartus J. The Swedish National Anterior Cruciate LigamentRegister: a report on baseline variables and outcomes of surgeryfor almost 18,000 patients. Am J Sports Med 2012;40:2230–2235.
41. Ventura A, Legnani C, Terzaghi C, Borgo E. Single- and Double-Bundle Anterior Cruciate Ligament Reconstruction in PatientsAged Over 50 Years. Arthroscopy 2012;28:1702–1709.
42. Zhu Y, Tang R-K, Zhao P, Zhu S-S, Li Y-G, Li J-B. Double-bun-dle reconstruction results in superior clinical outcome thansingle-bundle reconstruction. Knee Surg Sports TraumatolArthrosc 2013;21:1085–1096.
43. Suomalainen P, Moisala A-S, Paakkala A, Kannus P, Jarvela T.Double-bundle versus single-bundle anterior cruciate ligamentreconstruction: randomized clinical and magnetic resonanceimaging study with 2-year follow-up. Am J Sports Med 2011;39:1615–1622.
44. Tiamklang T, Sumanont S, Foocharoen T, Laopaiboon M. Dou-ble-bundle versus single-bundle reconstruction for anterior cru-ciate ligament rupture in adults. Cochrane Database Syst Rev2012;11:CD008413.
45. Steckel H, Vadala G, Davis D, Fu FH. 2D and 3D 3-tesla mag-netic resonance imaging of the double bundle structure in ante-rior cruciate ligament anatomy. Knee Surg Sports TraumatolArthrosc 2006;14:1151–1158.
46. Poellinger A, Scheffler S, Hamm B, Asbach P. Magnetic reso-nance imaging of double-bundle anterior cruciate ligamentreconstruction. Skeletal Radiol 2009;38:309–315.
47. Murakami Y, Sumen Y, Ochi M, Fujimoto E, Adachi N, Ikuta Y.MR evaluation of human anterior cruciate ligament autograft onoblique axial imaging. J Comput Assist Tomogr 1998;22:270–275.
48. Howell SM, Clark JA, Blasier RD. Serial magnetic resonanceimaging of hamstring anterior cruciate ligament autografts dur-ing the first year of implantation. A preliminary study. Am JSports Med 1991;19:42–47.
49. Recht MP, Piraino DW, Applegate G, et al. Complications afteranterior cruciate ligament reconstruction: radiographic and MRfindings. AJR Am J Roentgenol 1996;167:705–710.
50. Rispoli DM, Sanders TG, Miller MD, Morrison WB. Magnetic res-onance imaging at different time periods following hamstringharvest for anterior cruciate ligament reconstruction. Arthro-scopy 2001;17:2–8.
51. Papakonstantinou O, Chung CB, Chanchairujira K, Resnick DL.Complications of anterior cruciate ligament reconstruction: MRimaging. Eur Radiol 2003;13:1106–1117.
52. Arnoczky SP, Tarvin GB, Marshall JL. Anterior cruciate ligamentreplacement using patellar tendon. An evaluation of graft revas-cularization in the dog. J Bone Joint Surg Am 1982;64:217–224.
54. Nakayama Y, Shirai Y, Narita T, Mori A, Kobayashi K. The accu-racy of MRI in assessing graft integrity after anterior cruciate lig-ament reconstruction. J Nippon Med Sch 2001;68:45–49.
55. Saupe N, White LM, Chiavaras MM, et al. Anterior cruciate liga-ment reconstruction grafts: MR imaging features at long-termfollow-up--correlation with functional and clinical evaluation.Radiology 2008;249:581–590.
56. Iriuchishima T, Shirakura K, Fu FH. Graft impingement in ante-rior cruciate ligament reconstruction. Knee Surg Sports Trauma-tol Arthrosc 2013;21:664–670.
772 Farshad-Amacker and Potter
Page 53Page 53 SMRT Educational Seminar Volume 17, Number 3: Musculoskeletal MRI: Cartilage and Ligaments
MRI of Knee Ligament Injury and Reconstruction
57. Horton LK, Jacobson JA, Lin J, Hayes CW. MR imaging of ante-rior cruciate ligament reconstruction graft. AJR Am J Roentgenol2000;175:1091–1097.
58. Howell SM. Principles for placing the tibial tunnel and avoidingroof impingement during reconstruction of a torn anterior cruci-ate ligament. Knee Surg Sports Traumatol Arthrosc 1998;(Suppl1):S49–S55.
59. Bedi A, Maak T, Musahl V, et al. Effect of tibial tunnel positionon stability of the knee after anterior cruciate ligament recon-struction: is the tibial tunnel position most important? Am JSports Med 2011;39:366–373.
60. Akamatsu Y, Mitsugi N, Taki N, Takeuchi R, Saito T. Simultane-ous anterior cruciate ligament reconstruction and openingwedge high tibial osteotomy: report of four cases. Knee 2010;17:114–118.
61. Hame SL, Markolf KL, Hunter DM, Oakes DA, Zoric B. Effects ofnotchplasty and femoral tunnel position on excursion patternsof an anterior cruciate ligament graft. Arthroscopy 2003;19:340–345.
63. Chen MR, Dragoo JL. Arthroscopic releases for arthrofibrosis ofthe knee. J Am Acad Orthop Surg 2011;19:709–716.
64. Murakami S, Muneta T, Furuya K, Saito I, Miyasaka N,Yamamoto H. Immunohistologic analysis of synovium in infrapa-tellar fat pad after anterior cruciate ligament injury. Am J SportsMed 1995;23:763–768.
65. Wilson TC, Kantaras A, Atay A, Johnson DL. Tunnel enlarge-ment after anterior cruciate ligament surgery. Am J Sports Med2004;32:543–549.
66. Muren O, Dahlstedt L, Brosjo E, Dahlborn M, Dalen N. Grossosteolytic tibia tunnel widening with the use of Gore-Tex ante-rior cruciate ligament prosthesis: a radiological, arthrometricand clinical evaluation of 17 patients 13–15 years after surgery.Acta Orthop 2005;76:270–274.
67. Deie M, Sumen Y, Ochi M, Murakami Y, Fujimoto E, Ikuta Y.Pretibial cyst formation after anterior cruciate ligament recon-struction using auto hamstring grafts: two case reports in a pro-spective study of 89 cases. Magn Reson Imaging 2000;18:973–977.
68. Amis AA, Gupte CM, Bull AMJ, Edwards A. Anatomy of the pos-terior cruciate ligament and the meniscofemoral ligaments. KneeSurg Sports Traumatol Arthrosc 2006;14:257–263.
70. Veltri DM, Deng XH, Torzilli PA, Warren RF, Maynard MJ. Therole of the cruciate and posterolateral ligaments in stability ofthe knee. A biomechanical study. Am J Sports Med 1995;23:436–443.
71. Papannagari R, DeFrate LE, Nha KW, et al. Function of posteriorcruciate ligament bundles during in vivo knee flexion. Am JSports Med 2007;35:1507–1512.
72. Hayes CW, Brigido MK, Jamadar DA, Propeck T. Mechanism-based pattern approach to classification of complex injuries ofthe knee depicted at MR imaging. Radiographics 2000;20(SpecNo):S121–S134.
73. Schulz MS, Russe K, Weiler A, Eichhorn HJ, Strobel MJ. Epide-miology of posterior cruciate ligament injuries. Arch OrthopTrauma Surg 2003;123:186–191.
74. Sanders TG, Medynski MA, Feller JF, Lawhorn KW. Bone contu-sion patterns of the knee at MR imaging: footprint of the mecha-nism of injury. Radiographics 2000;20(Spec No):S135–S151.
77. Almekinders LC, Logan TC. Results following treatment of trau-matic dislocations of the knee joint. Clin Orthop Relat Res 1992;284:203–207.
78. Green NE, Allen BL. Vascular injuries associated with disloca-tion of the knee. J Bone Joint Surg Am 1977;59:236–239.
79. Welling RE, Kakkasseril J, Cranley JJ. Complete dislocations ofthe knee with popliteal vascular injury. J Trauma 1981;21:450–453.
80. Hodler J, Haghighi P, Trudell D, Resnick D. The cruciate liga-ments of the knee: correlation between MR appearance andgross and histologic findings in cadaveric specimens. AJR Am JRoentgenol 1992;159:357–360.
81. Dennis MG, Fox JA, Alford JW, Hayden JK, Bach BR. Posteriorcruciate ligament reconstruction: current trends. J Knee Surg2004;17:133–139.
82. Dandy DJ, Pusey RJ. The long-term results of unrepaired tearsof the posterior cruciate ligament. J Bone Joint Surg Br 1982;64:92–94.
83. H€oher J, Scheffler S, Weiler A. Graft choice and graft fixation inPCL reconstruction. Knee Surg Sports Traumatol Arthrosc 2003;11:297–306.
84. Sherman PM, Sanders TG, Morrison WB, Schweitzer ME, LeisHT, Nusser CA. MR imaging of the posterior cruciate ligamentgraft: initial experience in 15 patients with clinical correlation.Radiology 2001;221:191–198.
85. LaPrade RF, Engebretsen AH, Ly TV, Johansen S, Wentorf FA,Engebretsen L. The anatomy of the medial part of the knee.J Bone Joint Surg Am 2007;89:2000–2010.
86. De Maeseneer M, Van Roy F, Lenchik L, Barbaix E, De Ridder F,Osteaux M. Three layers of the medial capsular and supportingstructures of the knee: MR imaging-anatomic correlation. Radio-graphics 2000;20(Spec No):S83–S89.
87. Warren LF, Marshall JL. The supporting structures and layerson the medial side of the knee: an anatomical analysis. J BoneJoint Surg Am 1979;61:56–62.
88. Malone WJ, Verde F, Weiss D, Fanelli GC. MR imaging of kneeinstability. Magn Reson Imaging Clin N Am 2009;17:697–724,vi–vii.
89. Hughston JC, Andrews JR, Cross MJ, Moschi A. Classificationof knee ligament instabilities. Part I. The medial compartmentand cruciate ligaments. J Bone Joint Surg Am 1976;58:159–172.
90. Garvin GJ, Munk PL, Vellet AD. Tears of the medial collateralligament: magnetic resonance imaging findings and associatedinjuries. Can Assoc Radiol J 1993;44:199–204.
91. Wen DY, Propeck T, Kane SM, Godbee MT, Rall KL. MRI descrip-tion of knee medial collateral ligament abnormalities in theabsence of trauma: edema related to osteoarthritis and medialmeniscal tears. Magn Reson Imaging 2007;25:209–214.
92. Wang JC, Shapiro MS. Pellegrini-Stieda syndrome. Am J Orthop1995;24:493–497.
93. Niitsu M, Ikeda K, Iijima T, Ochiai N, Noguchi M, Itai Y. MRimaging of Pellegrini-Stieda disease. Radiat Med 1999;17:405–409.
94. Bosworth DM. Transplantation of the semitendinosus for repairof laceration of medial collateral ligament of the knee. J BoneJoint Surg Am 1952;34:196–202.
95. Recondo JA, Salvador E, Villanua JA, Barrera MC, Gervas C,Alustiza JM. Lateral stabilizing structures of the knee: func-tional anatomy and injuries assessed with MR imaging. Radio-graphics 2000;20(Spec No):S91–S102.
96. Miller TT, Gladden P, Staron RB, Henry JH, Feldman F. Postero-lateral stabilizers of the knee: anatomy and injuries assessedwith MR imaging. AJR Am J Roentgenol 1997;169:1641–1647.
97. Munshi M, Pretterklieber ML, Kwak S, Antonio GE, Trudell DJ,Resnick D. MR imaging, MR arthrography, and specimen corre-lation of the posterolateral corner of the knee: an anatomicstudy. AJR Am J Roentgenol 2003;180:1095–1101.
98. Maynard MJ, Deng X, Wickiewicz TL, Warren RF. The popliteo-fibular ligament. Rediscovery of a key element in posterolateralstability. Am J Sports Med 1996;24:311–316.
99. Yu JS, Salonen DC, Hodler J, Haghighi P, Trudell D, Resnick D.Posterolateral aspect of the knee: improved MR imaging with acoronal oblique technique. Radiology 1996;198:199–204.
100. Brown TR, Quinn SF, Wensel JP, Kim JH, Demlow T. Diagnosisof popliteus injuries with MR imaging. Skeletal Radiol 1995;24:511–514.
101. Levy BA, Stuart MJ, Whelan DB. Posterolateral instability of theknee: evaluation, treatment, results. Sports Med Arthrosc 2010;18:254–262.
MRI of Knee Ligament Injury and Reconstruction 773
PRINTED HOME STUDY EDUCATIONAL SEMINARS
Qty. Vol. CE Home Studies Title
9.1 3.0 MRI of Breast Cancer: Update I
9.2 2.5 MR Atlas of the Shoulder
9.3 3.0 Exploring Magnetic Field Strengths: Challenges and Opportunities
9.4 4.0 MRI of Breast Cancer: Update II
10.1 4.0 MR Imaging of Perfusion
10.2 3.0 MR Imaging Artifacts:Appearance, Cause & Cure
1.1 3.5 Functional MRI: Capabilities and Limitations
1.2 3.0 Concepts in MR Physics
2.1 3.5 Considerations in Low Field MRI
2.2 3.0 Directions in Basic Cardiac Imaging
2.3 3.0 Directions in Advanced Cardiac Imaging
2.4 1.5 The Basics of Magnetic Resonance Angiography
3.1 3.0 Introduction to Spectroscopy
3.2 1.0 Renal MR Imaging
3.3 3.0 A Primer on MR Pulse Sequences
3.4 2.5 Artifacts Encountered in Abdominal MRI
4.1 3.0 Safety Aspects in MRI
4.2 3.0 Directions in MRI of the Liver
4.3 2.0 MR Techniques in the Evaluation of the Uterus
4.4 3.0 Fundamental Principles for MR Imaging of the Brain
5.1 2.5 Atlas of Cranial Neuroanatomy
5.2 2.0 MRI of the Ankle & Foot
5.3 3.0 MR Imaging of the Breast
5.4 1.0 Diffusion-Weighted Imaging of the Brain
6.1 1.0 Directions in MRA of the Abdominal Aorta and Lower Extremities
6.2 3.5 Fundamental Principles of MR Imaging of the Head, Neck, and Spine
6.3 1.5 Advances in Interventional MRI
6.4 1.5 Diffusion-Weighted MR Imaging of the Pediatric Brain
7.1 2.0 The Role of Neuroimaging in the Diagnosis of Alzheimer’s Disease
7.2 2.5 Cardiovascular MRI: Update I
7.3 2.5 K-Space in the Clinic
7.4 3.0 MR Imaging and Spectroscopy of the Prostate
8.1 1.0 Atlas of Knee Anatomy
8.2 2.0 Cardiovascular MRI: Update II
8.3 2.5 Update: Safety in MR Examinations
8.4 2.0 Parallel MR Imaging
*Home Study Educational Seminars available online at no cost to SMRT members.
All home study educational seminars following Volume 15.4 will be available ONLINE ONLY.
PAYMENT WITHIN USA: Personal checks, money orders, cashier’s checks and company checks are acceptable. Institutional purchase orders are accept-able and will be invoiced, but payment must still be received prior to shipment.
PAYMENT OPTIONS & BILLING INFORMATION
SMRT Member ID# (REQUIRED)
Name
Address
City State/Province Postal Code/ZIP + 4 Country
Phone Fax E-mail
p Credit Card: p VISA p MasterCard p AMEX p Discover
(Credit card orders may be faxed directly to SMRT: +1 510 841 2340)
Card Number: Expiration Date: Security Code:
Billing Address Billing Zip + 4/Postal Code:
Signature:
CALCULATE YOUR ORDER HERE
SHIPPING: Shipping is included on orders of four volumes or less. Shipping is charged on orders of five volumes or more. We will contact you with the shipping cost
before we process your order. No orders will be processed before you have confirmed the actual shipping cost.
Total quantity ordered: x US$25 each = $ Subtotal = US$
YOU MAY ORDER PAST ISSUES OF HOME STUDY EDUCATIONAL SEMINARS ONLINE:
http://cds.ismrm.org/protected/ehs/hsorder.htm
TO ORDER BY MAIL, PLEASE FILL OUT AND MAIL THIS FORM, INCLUDING
YOUR QUANTITY AND CHOICE OF ISSUES FROM PREVIOUS PAGE
HOME STUDY EDUCATIONAL SEMINARS ORDER FORMBack issues of SMRT educational seminars are for sale to SMRT members only!
PAYMENT FROM OUTSIDE USA: Checks: The check must be payable “to” (NOT “through”) a U.S. bank in U.S. Dollars. The check must be imprinted with the com-puter encoding and routing information authorized by the American Banking Association. Traveler’s Checks: Traveler’s checks in U.S. dollars for the exact amount, properly counter-signed, are acceptable. International Money Order: The money order must be in U.S. dollars and be imprinted with the computer encoding and routing information authorized by the American Banking Association. U.S. dollar International Postal Money Orders imprinted as stated above are acceptable.
Wire: Wire payments are not accepted.
WE ARE A NETWORK OF KNOWLEDGE
SMRT – A Global CommunityThe Section for Magnetic Resonance Technologists (SMRT) of the International Society for Magnetic Reso-nance in Medicine (ISMRM) is the leading non-profit organization that provides an international forum for education, information and research in magnetic reso-nance for technologists and radiographers throughout the world.
The SMRT was established by technologists, clini-cians and scientists of the ISMRM as a forum for technologists and radiographers to share their expertise and educational resources, with a com-mon goal of improving healthcare for people world-wide.
As an organization, we are committed to promoting communication and the dissemination of cutting-edge MR developments. The objective of the SMRT is to advance education and training, while striving
to promote a high level of knowledge and profession-alism in the field of MR technology and radiography.