13
Snapshot of Telecom Industry Presented by:- Aayushi Garg (109102) Abhimanyu Singh(109103)
| Date post: | 10-Apr-2018 |
| Category: |
Documents |
| Upload: | 9957118230 |
| View: | 220 times |
| Download: | 0 times |

8/8/2019 Snapshot of Telecom Industry 2010
http://slidepdf.com/reader/full/snapshot-of-telecom-industry-2010 1/13
Snapshot of Telecom
Industry
Presented by:-
Aayushi Garg (109102) Abhimanyu Singh(109103)
8/8/2019 Snapshot of Telecom Industry 2010
http://slidepdf.com/reader/full/snapshot-of-telecom-industry-2010 2/13
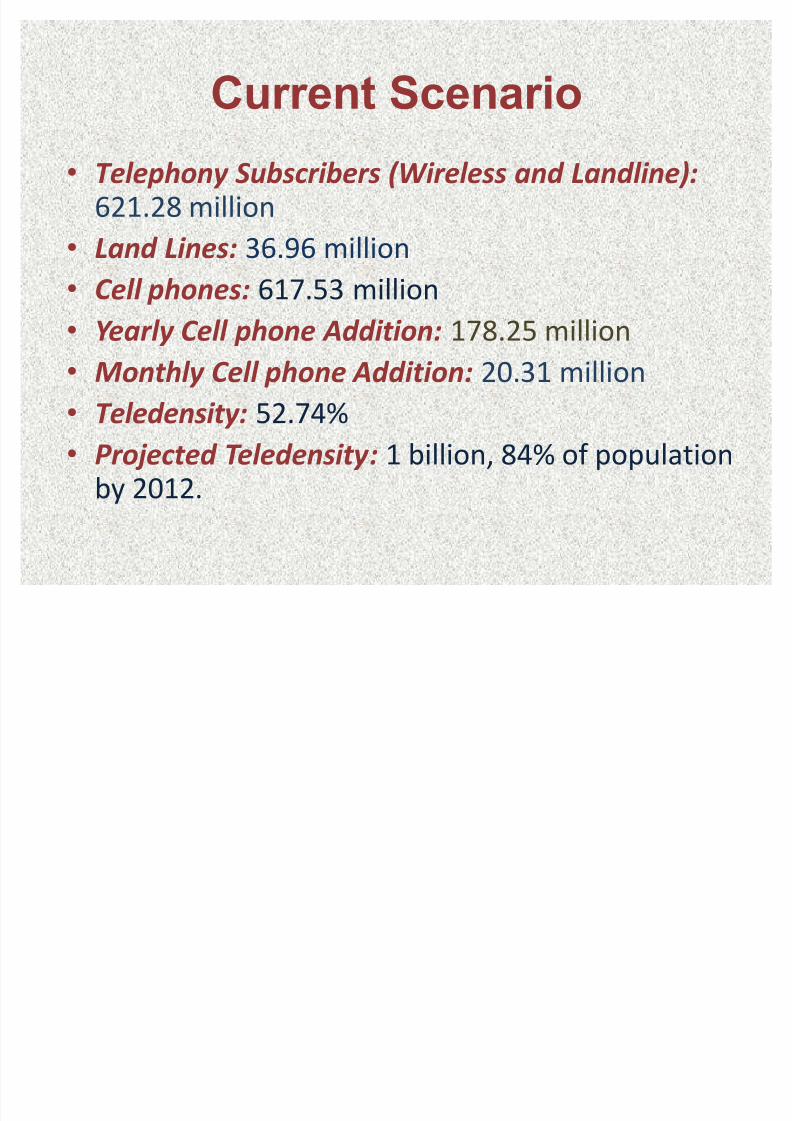
Current Scenario
Telephony Subscribers (Wireless and Landline):621.28 million
Land Lines: 36.96 million
C ell phones: 617.53 million
Y early C ell phone Addition: 178.25 million
Monthly C ell phone Addition: 20.31 million
Teledensity: 52.74% P rojected Teledensity: 1 billion, 84% of population
by 2012.
8/8/2019 Snapshot of Telecom Industry 2010
http://slidepdf.com/reader/full/snapshot-of-telecom-industry-2010 3/13
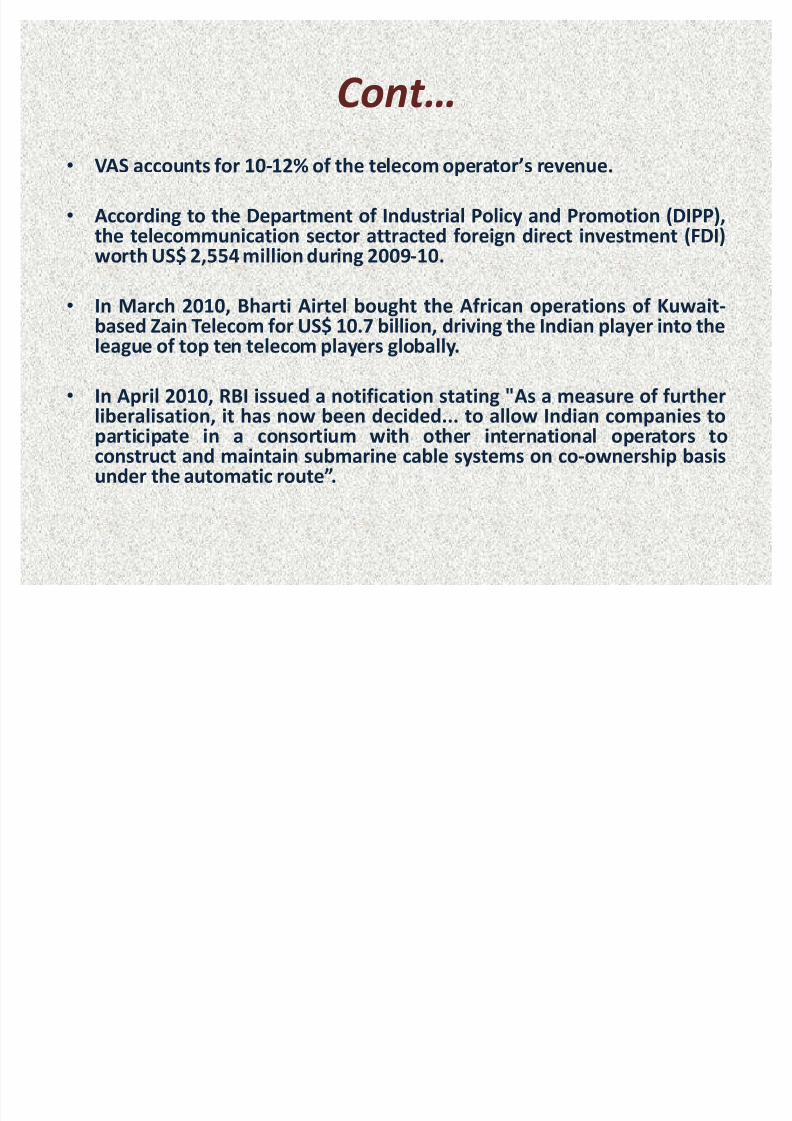
C ont
VAS accounts for 10-12% of the telecom operators revenue.
According to the Department of Industrial Policy and Promotion (DIPP),the telecommunication sector attracted foreign direct investment (FDI)worth US$ 2,554 million during 2009-10.
In March 2010, Bharti Airtel bought the African operations of Kuwait-based Zain Telecom for US$ 10.7 billion, driving the Indian player into theleague of top ten telecom players globally.
In April 2010, RBI issued a notification stating "As a measure of further
liberalisation, it has now been decided... to allow Indian companies toparticipate in a consortium with other international operators toconstruct and maintain submarine cable systems on co-ownership basisunder the automatic route.

8/8/2019 Snapshot of Telecom Industry 2010
http://slidepdf.com/reader/full/snapshot-of-telecom-industry-2010 4/13
C ont.
Remote treatment and diagnosis of patients throughmobile phones would become a reality in the nearfuture..
According to the Economic Survey 2009-10, the
production of telecom equipment in value terms hasincreased from US$ 9 billion in 2007-08 to US$ 10.53billion in 2008-09 and is expected to be US$ 12.4billion in 2009-10.
It is proposed to achieve rural tele-density of 25 per
cent by means of 200 million rural connections by theend of the Eleventh Five Year Plan.

8/8/2019 Snapshot of Telecom Industry 2010
http://slidepdf.com/reader/full/snapshot-of-telecom-industry-2010 5/13
Trends in Telephone subscribers and
Teledensity in India

8/8/2019 Snapshot of Telecom Industry 2010
http://slidepdf.com/reader/full/snapshot-of-telecom-industry-2010 6/13
Wireless Segment:-
Service Provider wise Market Share as
on 30-6-2010

8/8/2019 Snapshot of Telecom Industry 2010
http://slidepdf.com/reader/full/snapshot-of-telecom-industry-2010 7/13
Wireline Segment:-
Service Provider wise Market Share as
on 30-6-2010

8/8/2019 Snapshot of Telecom Industry 2010
http://slidepdf.com/reader/full/snapshot-of-telecom-industry-2010 8/13
Porters Five Forces Model

8/8/2019 Snapshot of Telecom Industry 2010
http://slidepdf.com/reader/full/snapshot-of-telecom-industry-2010 9/13

8/8/2019 Snapshot of Telecom Industry 2010
http://slidepdf.com/reader/full/snapshot-of-telecom-industry-2010 10/13
Porters five force model
Rivalry among existing companies
There are three types of players in telecom service:
State owned companies.
Private Indian owned companies.
Foreign invested companies.
8/8/2019 Snapshot of Telecom Industry 2010
http://slidepdf.com/reader/full/snapshot-of-telecom-industry-2010 11/13
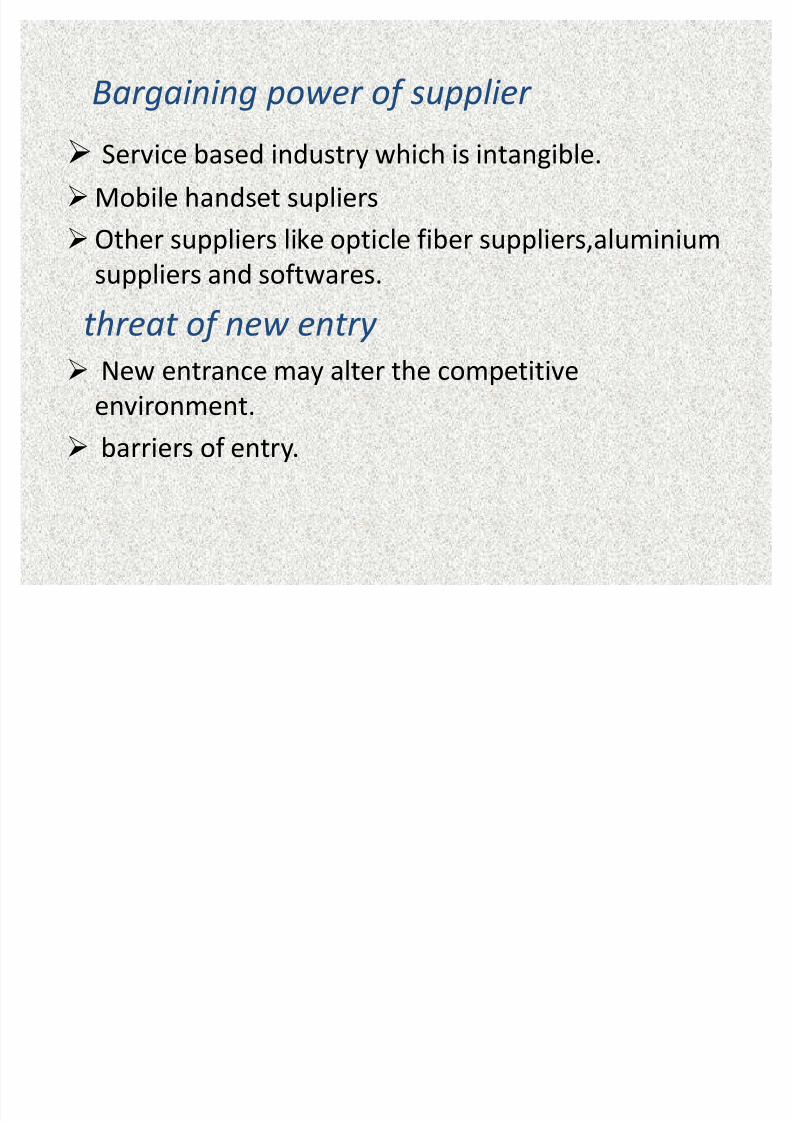
Bargaining power of supplier
Service based industry which is intangible.
Mobile handset supliers
Other suppliers like opticle fiber suppliers,aluminium
suppliers and softwares.
threat of new entry
New entrance may alter the competitive
environment. barriers of entry.
8/8/2019 Snapshot of Telecom Industry 2010
http://slidepdf.com/reader/full/snapshot-of-telecom-industry-2010 12/13
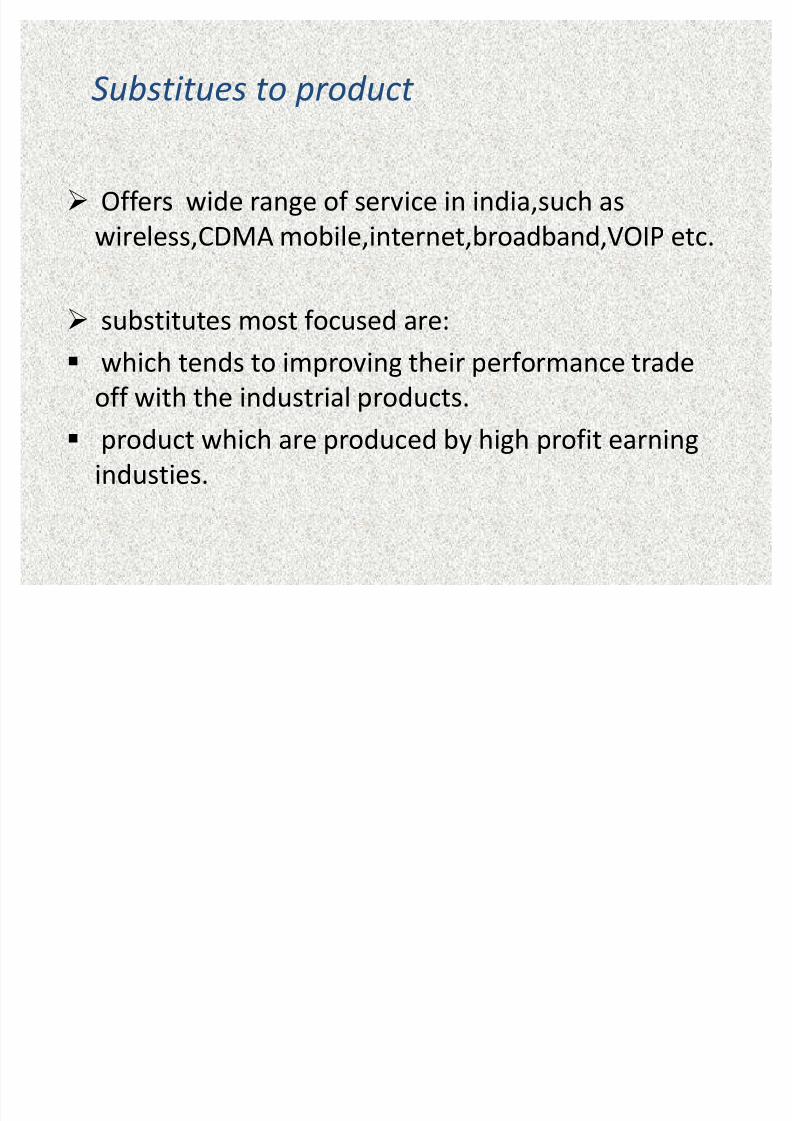
Substitues to product
Off ers wide range of service in india,such as
wireless,CDMA mobile,internet,broadband,VOIP etc.
substitutes most focused are:
which tends to improving their performance trade
off with the industrial products.
product which are produced by high profit earning
industies.

8/8/2019 Snapshot of Telecom Industry 2010
http://slidepdf.com/reader/full/snapshot-of-telecom-industry-2010 13/13


