37
Social and Affordable Housing in Thames-Coromandel District Report Prepared By: Dave Snell and Daniel Hopper Research Office Waikato Institute of Technology July, 2014
Social and Affordable Housing in
Thames-Coromandel District
Report
Prepared By:
Dave Snell and Daniel Hopper
Research Office
Waikato Institute of Technology
July, 2014

2
Executive Summary
Background and Method to the Report
The purpose of this research was to investigate the social and affordable housing needs in the
Thames-Coromandel District, through the collation and analysis of the district’s demographics.
The report aimed to inform funding and policy decision makers in the area of local government
and/or community housing in the Thames-Coromandel District. It focuses predominantly on two
wards that have been identified by local community organisations as potentially having the most
need – Coromandel-Colville and Mercury Bay.
There were two research phases for the development of the report. The initial phase consisted of
collecting relevant material concerning social and affordable housing in New Zealand as well as
regional demographic information sourced from the Thames Coromandel Community Profile
that was created using 2013 Census Data obtained from Statistics New Zealand (available at
http://profile.idnz.co.nz/thames-coromandel/home). The second phase of the research consisted
of an analysis of this sourced material, in order to assess the need for additional social and
affordable housing.
Conclusions and Recommendations
Overall, there is a need for social and affordable housing in the Thames-Coromandel District.
Decreasing home ownership and a shift towards fewer state-owned houses and a lack of quality
affordable housing is a concern. Further, increasing rental costs of privately owned
accommodation, as well as a decline in owner-occupation makes the private provision of
affordable housing unsustainable in providing a stable rental market for local residents. A report
prepared by SGS Economics and Planning Research (2012) identifies the Community Sector as a
possible provider of affordable social rental accommodation that can also provide sustainability.
The sustainable provision of social and affordable housing is particularly important for
vulnerable groups in the Thames-Coromandel District. Such groups include the elderly, people
with disabilities and those people on a low income. Of particular relevance to the district is the

3
high proportion of elderly people. Many elderly people also identify as having one or more
disabilities and so it is the finding of this report that this group is the most in need of social and
affordable housing. The needs of disabled people have also been identified by the Thames-
Coromandel District Council as being a high priority for the council’s social development
planning.
This report suggests that the most appropriate form of new housing for those people who are
elderly and/or have a disability could include:
Smaller one or two bedroom houses,
A high level of insulation,
Street level entrance, with wider pathways and hallways, and hand rails and
Location within easy reach of important facilities and public transportation.
Additionally, this report identifies affordable housing for kaumātuā as an increasing need. More
Māori people are re-entering the district and this will place increasing demands on kaumātuā in
relation to mārae and whānau responsibilities. As such, these people will need further support,
particularly as many of them are likely to be elderly, earning a low income and potentially have
some form of disability.

4
Contents
Executive Summary ........................................................................................................................ 2 Background and Method to the Report ....................................................................................... 2 Conclusions and Recommendations ........................................................................................... 2
Introduction ..................................................................................................................................... 7
Housing figures for Thames-Coromandel District ......................................................................... 8 Social housing ............................................................................................................................. 8 Home ownership and rent ......................................................................................................... 10 Rental prices in Coromandel Township and Thames-Coromandel district .............................. 10 Households and family types .................................................................................................... 13
Construction and housing demand ............................................................................................ 15 Housing quality & short-term leasing ....................................................................................... 15
Vulnerable Groups in the Thames-Coromandel District .............................................................. 16
Māori people ............................................................................................................................. 16 Aged persons ............................................................................................................................. 18 People with Disabilities ............................................................................................................ 19
Social Deprivation Index .............................................................................................................. 20
People with Low Incomes ......................................................................................................... 22 Part-time employment ........................................................................................................... 23
Single Parent Families .............................................................................................................. 24 Section conclusions ..................................................................................................................... 255 Ward Information.......................................................................................................................... 26
Coromandel-Colville Ward and Coromandel Township .......................................................... 26 Mercury Bay and Whitianga Township .................................................................................... 27
Major differences between the regions ......................................................................................... 28
Depriviation .............................................................................................................................. 28
Population ................................................................................................................................. 29 Ethnicity .................................................................................................................................... 29 Qualifications ............................................................................................................................ 30 Income....................................................................................................................................... 30 Families & Households ............................................................................................................. 30
Children................................................................................................................................. 30
Household size ...................................................................................................................... 30
House size ............................................................................................................................. 30
Home ownership ................................................................................................................... 31
Rent prices ............................................................................................................................ 32
Conclusions and Recommendations ............................................................................................. 33
Limitations .................................................................................................................................... 35
References ..................................................................................................................................... 36

5
List of Figures
Figure 1: Thames-Coromandel Region. Adapted from GIS maps obtained from
www.tcdc.govt.nz ........................................................................................................................... 7
Figure 2: Median rental prices of private rental accommodation of one to four bedroom houses in
Coromandel Township (www.landlords.co.nz).............................................................................12
Figure 3: A comparison of people per household in 2013 between Thames-Coromandel district
and the Waikato region (Statistics New Zealand, 2013) ............................................................... 13
Figure 4: Changes in number of bedrooms per occupied dwellings in 2013 since 2006 (Statistics
New Zealand, 2013) ...................................................................................................................... 14
Figure 5: Changes in people per household between 2006 and 2013 (Statistics New Zealand,
2013) ............................................................................................................................................. 15
Figure 6: Changes to sources of household income between 2006 and 2013 in the Thames-
Coromandel region........................................................................................................................ 19
Figure 7: Social Deprivation Index 2006 for the Waikato regions and surrounding areas (NZ
Herald, 2013) ................................................................................................................................ 22
Figure 8: Annual individal income 2013 of Thames-Coromandel district compared to the
Waikato region (Statistics New Zealand, 2013) ........................................................................... 23
Figure 9: Coromandel-Colville ward map (www.tcdc.govt.nz, 2013) ......................................... 26
Figure 10: Mercury Bay ward map (www.tcdc.govt.nz, 2013) .................................................... 27
Figure 11: Current proportion of smokers and deprivation decile in 2013 (New Zealand
Department of Public Health, 2013). ............................................................................................ 29

6
List of Tables
Table 1: Ownership of rental accommodation in the Thames-Coromandel District (Statistics New
Zealand, 2006). ............................................................................................................................... 8
Table 2: Summary of Social Housing units provision by Territorial Authorities in the Waikato
Region (Black & Cox, 2012, p.27) ................................................................................................. 9
Table 3: Housing New Zealand Waiting List information for Waikato Region taken from
www.hnzc.co.nz. ............................................................................................................................. 9
Table 4: 2013 Census figures for housing tenures in the Thames-Coromandel district (Statistics
New Zealand, 2013). ..................................................................................................................... 10
Table 5: Comparison of weekly rental payments in the Thames-Coromandel district to the
Waikato region (Statistics New Zealand, 2013). .......................................................................... 11
Table 6: Changes in the proportion of people spending more on housing costs in New Zealand
(Black & Cox, 2012, p.18) ............................................................................................................ 12
Table 7: Percentage of people in each age bracket with disabilities in New Zealand taken from
Statistics New Zealand 2006……………………………………………………………..………20
Table 8: Social Deprivation Index 2013 for the Thames-Coromandel district ............................. 21
Table 9: Employment Status: A 2006 and 2013 comparison of employment statuses in Thames
Coromandel Region and the rest of New Zealand………………………………………….……24
Table 10: Family Types in Thames-Coromandel District and New Zealand (Statistics New
Zealand, 2013) .............................................................................................................................. 24
Table 11: Number of bedrooms per occupied dwelling in Coromandel-Colville (Statistics New
Zealand, 2013) .............................................................................................................................. 31
Table 12: Number of bedrooms per occupied dwelling in Mercury Bay (Statistics New Zealand,
2013) ............................................................................................................................................. 31

7
Introduction
Figure 1: Thames-Coromandel Region. Adapted from GIS maps obtained
from www.tcdc.govt.nz
With an overall population of 27, 100 people (Statistics New Zealand, 2013), the Thames-
Coromandel District consists of over 50 diverse settlements. Due to this diversity, the area is
divided into four wards. Each ward has its own community board and district councillors
(Thames-Coromandel District Council, n.d.). Coromandel-Colville and Mercury Bay are two
such wards and are the two wards furthest away from the peninsula’s base (see Figure 1). While
each ward consists of a number of small towns, the largest in Coromandel-Colville and Mercury
Bay are Coromandel Town and Whitianga respectively. Each township differs in its
demographic make-up and history, and so constitute two very different communities. In this
section we outline key demographics for the Thames-Coromandel district overall, before
discussing key features of each ward.

8
Housing figures for Thames-Coromandel District
Social housing
Community groups such as Poverty Action Waikato (Black and Cox, 2012) have reported an
overall lack of social and affordable housing in the Thames-Coromandel District. Key features of
the local rental housing market discussed in this section include:
an increase in the number of privately-owned rental properties with a corresponding
decrease in the amount of Housing New Zealand properties,
an increase in rents that represent an increasing proportion of household income,
a decrease in the quality of rental properties and
a relatively transient housing market characterised by out-of-town owners and absentee
landlords.
The number of rental properties in the district owned by private renters has been steadily
increasing over the past decade, while the number of houses owned by Housing New Zealand
Corporation, local authority or other state landlords, are all steadily declining – as is represented
by Table 1 below, which shows figures for 1996, 2001 and 2006.
Table 1: Ownership of rental accommodation in the Thames-Coromandel
District (Statistics New Zealand, 2006).
This decline has continued to the present day, where currently there is no social housing
provided by lthe ocal council in the Thames-Coromandel District (ibid. 2012). There are two
Housing New Zealand houses and 14 pensioner flats owned by the Coromandel Independent
Living Trust (Coromandel Independent Living Trust, personal communication, 26 July, 2013).

9
Table 2: Summary of Social Housing units provision by Territorial
Authorities in the Waikato Region (Black & Cox, 2012, p.27)
However, it is important to note that the Thames-Coromandel District Council does provide
social development support for local organisations – particularly in the housing sector. For
example, they lease council land for the community provided pensioner housing and can act as
guarantor to build new units in Coromandel (Thames-Coromandel District Council, personal
communication, 7 October, 2013).
Given that there are only two Housing New Zealand houses in a district that has a population of
over 25, 000, there is a significant need for affordable social housing. While exact waiting list
information for Housing New Zealand houses in the district is unclear, Table 3 below shows
waiting list information for the greater Waikato Region.
Table 3: Housing New Zealand Waiting List information for Waikato
Region taken from www.hnzc.co.nz.
It is also of note that the number of applicants on the waiting list categorised as Priority Eligible
B (which is still considered of “serious need”) has slightly increased, at least in the short term.

10
Home ownership and rent
2013 census figures [See Table 4 below] indicate housing ownership is much higher in the
Thames-Coromandel district than it is in the Waikato region (39.1% vs. 25.9%); while the
amount of people with mortgages is slightly lower (22.6% vs. 30.6%). Accordingly there are
fewer people renting in the Thames-Coromandel district when compared to the Waikato region
(24.3 vs. 29.7). Figures indicate 2.3% of the district’s population are in social housing.
Table 4: 2013 Census figures for housing tenures in the Thames-
Coromandel district (Statistics New Zealand, 2013).
Rental prices in Coromandel Township and Thames-Coromandel district
Figure 2 graphs the median rental prices for private rental properties in the Coromandel township
and indicates an increase in weekly rental prices. It is important to note that the more broken or
erratic the graph line, the less availability of houses of that type. For example, there are no one-
bedroom houses rented in Coromandel Township, very few four-bedroom houses in Coromandel
rented, and the most common house rental is a three-bedroom house. These figures have
limitations however, as rental payments are not comparable over time because of the influences
of economic change such as inflation.

11
Figure 2. Median rental prices of private rental accommodation for one - four bedroom
houses in Coromandel Township (www.landlords.co.nz).
Table 5 illustrates weekly rental payments across the Thames-Coromandel district in comparison
to the Waikato region from the 2013 census. Almost half (48.4%) of the district’s rental housing
is priced between $200 and $299 per week, compared to 33.8% for the Waikato region.
Table 5: Comparison of weekly rental payments in the Thames-
Coromandel district to the Waikato region (Statistics New Zealand, 2013).

12
The housing rental quartiles [distribution of rental payments in Thames-Coromandel District
relative to New Zealand] indicate 31.3% of rental payments are in the lowest group compared to
31.1% of the Waikato region, and 46.3% are in the medium lowest quartile, compared to 32.8%
of the Waikato region. The highest two groups make up 22.5% of the Thames-Coromandel
district, while in the Waikato region they make up 36.1%. Almost half the region’s rental costs
in the second quartile [$192 to $288 per week] compared to 25%, and 2.8% in the top quartile
[$379 and over] compared to 25% nationally indicates the region’s rent is much lower than the
national average. 31.3% in the lowest quartile compared to 25% nationally is probably a
reflection of only 26.4% of the region’s population living in homes with zero, one, or two
bedrooms.
While rental prices may seem relatively low when compared to the national median, a significant
number of Thames-Coromandel households earn less than $40,000 (as will be discussed later).
Thus, a significant amount of weekly income would go towards rent for those people. In other
words, the proportion of household income being spent on rent is high. While exact figures for
the District are difficult to locate, Table 6 below shows the New Zealand average for 2008 and
2011.
Table 6: Changes in the proportion of people spending more on housing costs in New
Zealand (Black & Cox, 2012, p.18)
The 2013 census indicates 41.9% of the Thames-Coromandel population annually earn between
$30,000 and $40,000. Using the figure above of 48.4% of the region’s population paying
between $200 and $300 dollars a week, under the assumption that many of this demographic will
be renting homes; I have used the median between these figures [$35,000 and $250*52 weeks] to
work out that 37.1% of income will be spend on rent for this demographic.

13
Overall, housing costs for low to middle-income households have risen as a proportion of
household income (Perry, 2012). This trend towards a higher percentage of income being spent
on rental accommodation is concerning, particularly given household incomes have remained
relatively static (Statistics New Zealand, 2013).
Households and family types
The most apparent trend in the Thames-Coromandel district in terms of household types is sole
person households, which has increased by 2.9%, now making up 30.7% of the population. This
may not seem like a large figure, but the following graph puts in perspective this growth in
comparison to other household types.
Other major changes in the district include a reduction in couples with dependent children of
3.2%, while couples without children increased by 1.2, now making up 32.1% of the population.
One to two person households make up 74.3% of the Thames-Coromandel region, which is
higher than Waikato region average [58.7%]. Three or four person households make up 19.8%
of the population, lower than the regional average [31.1%] (Statistics New Zealand, 2013).
Figure 3 shows a comparison of people per house compared to the Waikato region.
Figure 3: A comparison of people per household in 2013 between Thames
Coromandel district and the Waikato region (Statistics New Zealand,
2013)

14
Despite the large rise in single person households in comparison to the other groups, there has
been little construction of new one or two bedroom homes. The number of one and two bedroom
homes occupied in the Thames-Coromandel region has actually reduced, while the number of
three and four bedroom dwellings has increased. Sixty three percent of the Thames-Coromandel
district lives in three or four bedroom homes. This is a surprising figure, due the fact three and
four person households has reduced, while one and two person households have increased. This
could indicate that the quality of small homes is worse than the quality of larger homes, or that
couples who plan to have children in the future are moving into these larger homes. This could
be one indication why the median rental prices in the district have increased since the last census,
as larger homes are more expensive to rent.
Figure 4: Changes in number of bedrooms per occupied dwellings in 2013
since 2006 (Statistics New Zealand, 2013)

15
Figure 5: Changes in people per household between 2006 and 2013
(Statistics New Zealand, 2013)
Construction and housing demand
New residential building consents have decreased steadily on a yearly basis in the region since
2005. In 2005, there were 580 residential building consents, while in 2013 there were 183; a
reduction of 68.45%. The decrease in residential building consents could be due to lower
demand for new houses, as there were 930 unoccupied dwellings in the Thames-Coromandel
district. This could be due to the age or quality of the housing, or an abundance of rental housing
in areas of low demand. The population of the Thames-Coromandel district has also been
stagnant, only increasing by 0.91% between 2006 and 2013. Comparatively, the national
population increased by 6.3 % (Statistics New Zealand, 2013). There were 2267 new homes
constructed between 2006 and 2013, and with a population increase of only 240 people, it is not
surprising residential construction has slowed dramatically.
Housing quality & short-term leasing
Local residents have expressed concern for rental price increases, as the quality of housing in the
district is not at a reasonable standard, as reflected in participants interviewed by Black and Cox
(2012):
Housing is a huge problem. There are not a lot of places to rent and so the rents are high.

16
Some rental properties are in really poor condition but people here do not have other
options. They are not worth the money that you have to pay (p. 19).
The district is a popular place for out of district people to purchase second or vacation homes. At
the time of the 2013 Census, 12,000 (49.4%) private dwellings were occupied and 12,087
(49.8%) were not. This is in comparison to national figures, where the percentages are 88.9%
and 10.5% respectively (Statistics New Zealand, 2013). As a result, much of the building of the
housing in this region was originally with vacations in mind, rather than long-term residences.
Consequently, a majority of housing is poorly insulated and maintained. As such, many rental
properties are viewed as unsuitable for longer-term tenancy due to damp, mould and cold (Black
& Cox, 2012).
The rental housing market is still viewed as transient to some degree, as many rentals are
seasonal. Homeowners frequently lease out their accommodation during the winter months, only
to require tenants to leave during the summer-holiday peak season. This has resulted in a rental
market that is frequently associated with unsecured, short-term tenancies (Black & Cox, 2012).
Vulnerable Groups in the Thames-Coromandel District
Information contained in the previous section is of particular interest to the present report, as
there are proportionately high percentages of vulnerable populations who live in the Thames-
Coromandel District. Such groups may find employment difficult to secure or maintain for a
range of reasons. For example those with disabilities may have difficulty finding suitable long-
term employment, or if they are employed, may have increased costs relating to their disability
(e.g. medical costs) (Batavia & Beaulaurier, 2001). Other vulnerable groups include people who
are in low-income households, people who are Māori, people with disabilities and the elderly.
Māori people
Due to its diverse nature, Thames-Coromandel is home to a number of iwi -approximately 12 in
total (Te Puni Kokiri, n.d.). 16.6 percent of people in Thames-Coromandel District define
themselves as Māori compared with 14.9 percent for all of New Zealand. The median income

17
for Māori living in the district was $19, 800, compared with $22, 500 for Māori people
nationally (Statistics New Zealand, 2013). While regional statistics for levels of home ownership
amongst Māori in the area are difficult to find, at a national level home ownership rates for
Māori are lower than for other ethnic groups and have been gradually decreasing since the 1950s
(Waldegrave, King, Walker, & Fitzgerald, 2006).
In their research conducted for the Centre for Housing Research, Waldegrave and colleagues
(2006) found that key issues related to national housing conditions for Māori people included
overcrowding, substandard housing causing health risks, and inadequate heating. In Thames-
Coromandel, given the low median income, coupled with the rising housing costs being
experienced nationally, Māori find it difficult to obtain financing in order to meet their
aspirations for home ownership (similar to Pākehā aspirations to do the same). Māori are also
over-represented in household overcrowding statistics, a measure that shows the proportion of
the Thames-Coromandel population living in crowded housing (i.e. requiring one or more
additional bedrooms, as defined by the Canadian Crowding Index) at 17.6% - as compared to
3.7% of Pākehā, and behind only Asian peoples at 18.4% (Ministry of Social Development,
2009).
As a result of these issues, the number of Māori people who are over 65 years of age requiring
rental accommodation is expected to continue to increase. The number of Māori people over 65
years of age is projected to increase three-fold from 20,000 in 2001 to 57,000 in 2021. It is
estimated that in 2021, one third of Māori people over 65 years of age will require rental housing
(Housing New Zealand Corporation, 2008).
Further, in discussions with community organisations such as Coromandel Independent Living
Trust and Poverty Action Waikato, there has been a perceived increase in the number of Māori
moving back to their tribal areas within the district. This trend has resulted in some Māori
families taking extreme measures for housing in the district, as was reported by a Coromandel
participant in Black and Cox (2012):
Some Māori families, because of the lack of affordable rental accommodation, have gone
to their land and now live in shacks, with eight children in one bedroom and a long drop

18
as their only toilet, no running water or electricity (p. 16).
It is also important to note that there is currently no kaumātuā housing in the district
(Coromandel Independent Living Trust, personal communication, 26 July, 2013). This reflects a
definite need for cheap, quality housing for not only those Māori people with younger children
but also older Māori.
Aged persons
While New Zealand as a nation has an increasingly aged population that will continue to place
high demands on social services (Saville-Smith, James, Warren & Coleman, 2009), the Thames-
Coromandel District has an even higher proportion of elderly. In the 2013 Census, 36.1%
identified themselves as being over 60 years of age, as compared to 19.8% nationally. In the
2006 this figure was 28.7% for Thames-Coromandel and 16.7% nationally (Statistics New
Zealand, 2013). Whitianga community groups have mentioned that the actual percentage may be
much higher. Some have even noted that the actual figure may be closer to 60% (Age Concern,
personal communication, 21 September, 2013; Grey Power, personal communication 21
September, 2013).
Thames-Coromandel’s population is characterised by an aging population that is significantly
increasing compared to the rest of New Zealand. This is made even more apparent by the
number of people on superannuation or veterans’ pensions, which makes up 36.3% of the
district’s population’s income, compared to 23.7% of the Waikato region. This compares to the
figures of 30.8% and 20.9% in 2006 respectively. The growth of people on
superannuation/pensions compared to other sources of income is exemplified in the following
graph.

19
Figure 6: Changes to sources of household income between 2006 and 2013
in the Thames-Coromandel region
Aging populations and the decrease of home ownership are problematic for the future health and
poverty levels of coming generations of New Zealand’s elderly in New Zealand. The
combination of decreasing levels of home ownership and lack of social housing will greatly
impact upon the elderly as a particularly vulnerable group through the lack of quality and relative
unaffordability of rental accommodation (Salville-Smith & Fraser, 2007).
Further, given their advanced years (coupled with a trend towards increasing numbers of elderly
people not having driver’s licenses), the elderly rely heavily on health care services and public
transportation (ibid., 2009). This combined with the geographic barriers that the Thames-
Coromandel District can create (i.e. the rural nature of the district and scattered population)
means that housing for the elderly not only needs to be of a reasonable quality, but also needs to
be centralised and within easy reach of essential services such as hospitals and public
transportation.
People with Disabilities
In the 2006 Census 17% of New Zealanders identified themselves as having a disability
(Statistics New Zealand, 2006).1 Table 7 below shows the percentage of people in various age
1 At the time of writing the results of the 2013 New Zealand Disability Survey had not yet been released.

20
brackets that identify as having a disability in New Zealand.
Table 7. Percentage of people in each age bracket with disabilities in New Zealand taken
from Statistics New Zealand (2006)
Exact figures for the number of people with disabilities in the Thames-Coromandel District are
difficult to find. The prevalence of people with disabilities is difficult to measure nationally, let
alone within a district, but with 21% of Thames-Coromandel residents being over 65 years of
age, it is likely that a high number of these people will also have some form of disability.
Additionally, 16.2% of people in the Thames-Coromandel District reported ‘Looking after a
disabled household member’ or ‘Looking after ill or disabled other person’ as part of unpaid
activities in the region. This is compared with 14.5% nationally (Statistics New Zealand, 2013).
Of the people self-identifying as having a disability, 60% have more than one disability, 65%
have a physical disability of some kind, and 33% require some sort of special equipment
(Saville-Smith & Fraser, 2007). Centre for Housing Research states that any housing that is
provided for those people with disabilities needs to be adaptable and be able to cater for a wide
variety of situations. They identified ramp access, street level entrances (or where this was not
possible, wider front steps), and wider pathways and hallways, as being key features required for
housing for disabled people. This research also emphasized the importance of adequate heating
and/or insulation, as cold temperatures can exacerbate existing conditions, leading to more
hospital visits and the potential for further health complications (ibid., 2007).
Social Deprivation Index
The Social Deprivation Index is used in the measurement and interpretation of socioeconomic
status of communities for a wide variety of contexts such as needs assessment, resource
allocation, research and advocacy. The Social Deprivation Index (SDI) combines nine variables

21
from the Census and provides a deprivation score for various geographical areas, as identified by
Statistics New Zealand (Salmond, Crampton & Atkinson, 2007). These variables include:
car and telephone access
receipt of means-tested benefits
unemployment
household income
sole parenting
educational qualifications
home ownership and
home living space.
This social deprivation index is used by a range of different service providers in order to
calculate the provision of services to residents (e.g. primary health care) (ibid., 2007). Figure 7
shows the SDI for 2013 for Waikato regions and surrounding regions, while Table 8 shows
deprivation across the Thames-Coromandel district.
For the purpose of comparison, the Social Deprivation Index is presented as a scale, ranking
small areas from the least deprived to the most deprived. The mean is 1000 index points and the
higher the number the greater the deprivation.
Table 8: Social Deprivation Index 2013 for the Thames-Coromandel
district
22
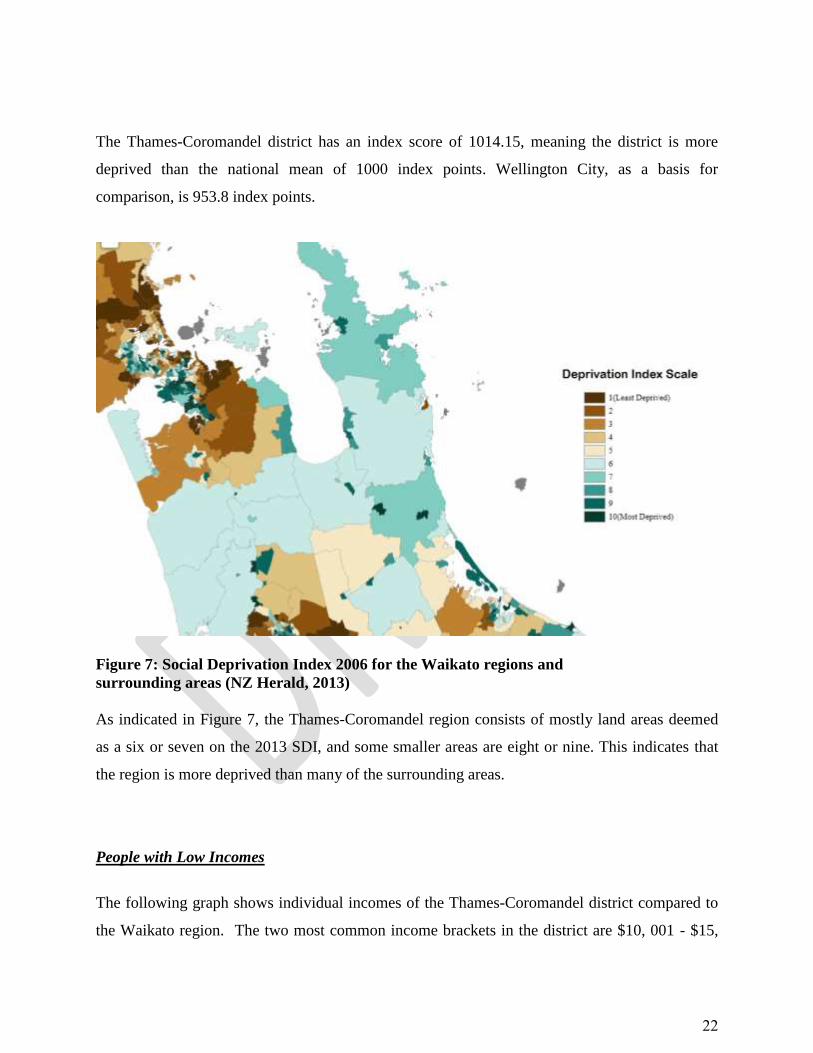
The Thames-Coromandel district has an index score of 1014.15, meaning the district is more
deprived than the national mean of 1000 index points. Wellington City, as a basis for
comparison, is 953.8 index points.
Figure 7: Social Deprivation Index 2006 for the Waikato regions and
surrounding areas (NZ Herald, 2013)
As indicated in Figure 7, the Thames-Coromandel region consists of mostly land areas deemed
as a six or seven on the 2013 SDI, and some smaller areas are eight or nine. This indicates that
the region is more deprived than many of the surrounding areas.
People with Low Incomes
The following graph shows individual incomes of the Thames-Coromandel district compared to
the Waikato region. The two most common income brackets in the district are $10, 001 - $15,

23
000 (12%) and $15, 001 - $20, 000 (13.3%).
Figure 8: Annual individual income 2013 of Thames-Coromandel district
compared to the Waikato region (Statistics New Zealand, 2013)
In terms of household income, only 49.2% of the population earned over $50,001, compared to
64.2% of the Waikato region.
Part-time employment
The Thames-Coromandel District also has a higher percentage of residents in part-time
employment, a figure that has increased since the 2006 Census. This could be the result of the
employment market in the region being more geared towards this seasonal, part-time work.
Current trends seem to indicate that part-time work and no employment are increasing in the
area, while full-time employment is decreasing. However further research would be needed to
confirm this.

24
Thames-Coromandel
District 2013 2006
Change
Employment status Number % New Zealand
% Number %
New Zealand
%
2006 to
2013
Employed 11,475 94.2 92.9 12,153 96.2 94.9 -678
Employed full-time 7,923 65.0 71.5 8,772 69.5 73.2 -849
Employed part-time 3,552 29.2 21.4 3,381 26.8 21.7 +171
Unemployed 705 5.8 7.1 477 3.8 5.1 +228
Total labour force 12,180 100.0 100.0 12,630 100.0 100.0 -450
Table 9. Employment status: A 2006 and 2013 comparison of employment statuses in the
Thames-Coromandel Region and the rest of New Zealand (Statistics New Zealand, 2013).
Single Parent Families
Also of interest when planning for the housing needs of a district are single parent families.
Table 10 below shows relevant statistics for the Thames-Coromandel District.
Table 10: Family Types in Thames-Coromandel District and New Zealand (Statistics New
Zealand, 2013)
Table 10 shows that there are relatively fewer couples with a child/children and one parent
families with a child/children compared to families that consist of a couple without children.
This is to be expected given the high numbers of elderly people in the district. However, it is
important to note that just because there are relatively fewer numbers of one parent or couples
with a child or children, this does not mean that there is not a need for housing for these people.
This is particularly the case given the importance of adequate housing in the general health of
young people (James & Saville-Smith, 2010).

25
Section conclusions
In summary, Thames-Coromandel as a district is one characterised by a high need for affordable
social housing. This is due to a lack of provision for the apparent high demand. The district has a
number of vulnerable people (e.g. those on low incomes and the elderly) living in a relatively
socially deprived area. These people appear to have few resources, and so are unable to move to
other districts. Further, the higher number of Māori people and the diverse range of iwi
represented in the area, mean that many Māori would also be unable to move due to their ties to
the land. As such, there is a need for the district as a whole to provide socially affordable housing
for all of these groups. However, it is a key finding of this report that the groups most in need of
housing in the district are the elderly and people with a disability.
Further, as mentioned previously, the two wards identified by local community groups as being
in particular need also have their own characteristics that need to be considered. The following
section outlines these ward differences.

26
Ward Information
The following is a summary of the two wards, Coromandel-Colville and Mercury Bay, followed
by a comparison of the major differences between the two wards.
Coromandel-Colville Ward and Coromandel Township
Figure 9: Coromandel-Colville ward map (www.tcdc.govt.nz, 2013)
The Coromandel-Colville Ward is geographically the topmost ward on the Coromandel
peninsula. Given Coromandel Township’s milling and mining history, it is considered somewhat
of a heritage settlement (Planning and Policy Group, 2008). The largest township is Coromandel
Town, which has a population of 1,617 people, while the ward has a population of 2817. The
ward has seen a 1.88% decrease since the 2006 census (Statistics New Zealand, 2013).

27
The median age of Coromandel Town is approximately 45 years old, which is higher than the
Waikato and national median of 37 years (ibid., 2008; Statistics New Zealand, 2013). 45.1% of
the ward’s dwellings are unoccupied, owned by out of town residents, in comparison to 49.8% in
the wider district. This is still well above the Waikato region figure of 16.7% (Statistics New
Zealand, 2013). Other features are difficult to ascertain for the ward at this time, particularly due
to issues of communication within the region, making any assessment of need problematic..
Mercury Bay and Whitianga Township
Figure 10: Mercury Bay ward map (www.tcdc.govt.nz, 2013)
Mercury Bay is the eastern ward of Thames-Coromandel. The largest township, Whitianga, has
a population of 3,768 people. In 2006 it was the fastest growing town in the district, as its
population has increased by 26% since 1996 (Policy and Planning Group, 2008). The 2013
census puts the ward’s population at 7,173 people, a 9.3% population increase since the 2006
census (Statistics New Zealand, 2013).
56.2% of Ward’s dwellings are unoccupied, in comparison to 49.8% in the wider district.

28
According to the Thames-Coromandel District Council’s Policy and Planning Group (2008),
35% of Whitianga’s population aged over 15 years is not part of the work force, and 38% of
Whitianga residents earn less than $20, 000 per annum. They also reported that 96% of the
Whitianga workforce is employed either full or part time, however statistics in this area are
problematic due to the high rate of seasonal employment. This was reflected in a Waikato
Institute of Technology (2011) survey that found that 83.13% of all opportunities for seasonal
work (which in the Thames-Coromandel district is November to February) in the Mercury Bay
ward were located in Whitianga Township. 2013 census figures indicate 29.6% of the district’s
workforce are in part-time employment, relative to the district’s average.
Major differences between the regions
Depriviation
According to the SDI for 2013, the rating for Coromandel-Colville is 1059.86 index points,
while Mercury Bay’s was at 993.13. Coromandel-Colville was the most deprived in Thames-
Coromandel district, while Mercury Bay was the third least deprived. This suggests the
deprivation in the Coromandel-Colville district is much higher than it is in Mercury Bay, and its
residents are in much more need of support.
According to the Department of Public Health, we would expect to see the proportions of regular
smokers increase across the deprivation deciles from least to most deprived. There is a strong
relationship between area deprivation and smoking behaviour among various age groups, both
sexes, and across ethic groups (New Zealand Department of Public Health, 2013). Figure 11
graphs the correlation between current smokers and 2013 deprivation deciles.

29
Figure 11: Current proportion of smokers and deprivation decile in 2013
(New Zealand Department of Public Health, 2013).
This is reflected in the 2013 census figures, where 19.3% of the Coromandel-Colville ward
identified themselves as regular smokers, while 14.8% of the Mercury Bay ward were smokers.
Population
The Mercury Bay population increased by 9.2% since 2006, while the Coromandel-Colville
population decreased by 1.9%. The Mercury Bay population over the age of 60 increased
substantially, and the age group of 25 to 29, and 50 to 54 increased slightly. All the other age
groups decreased. Similar changes are observed in the Coromandel-Colville area, but to a lesser
extent. The difference there was a slight increase in the 20 to 24 age bracket rather than the 25 to
29 year olds, and a decrease in the 50 to 54 age bracket.
Ethnicity
Mercury Bay had a lower percentage of Maori than the district average, with 11.6% of the total
population. Coromandel-Colville had a much higher proportion, with 29.4% population
describing themselves as Maori.

30
Qualifications
The Coromandel-Colville ward was less qualified than Mercury Bay; 26.3% of the population
had no qualifications compared to 21.1% of Mercury Bay. 19.6% of Coromandel-Colville had
post-school qualifications, compared to 24.4% of Mercury Bay.
Income
Individual income in Coromandel-Colville was lower than the Mercury Bay ward. In
Coromandel-Colville, 5.2% had high income, and 27.8% had low income. In Mercury Bay,
7.0% had high income, while 25.3% had low income. Household income levels showed a
similar trend.
Families & Households
Children
In Mercury Bay, there are 59.9% of couples without children, while in Coromandel-Colville, this
figure is 55%. There is a higher proportion of one parent families in Coromandel-Colville, with
17.8% compared to 12.5% in Mercury Bay.
Household size
66.2% of households are one family households in Mercury Bay, compared to 60.1% of
households in Coromandel-Colville,
There are 27.6% of lone person households in Mercury Bay, while the figure is 32.6% in
Coromandel-Colville. Two person dwellings in Mercury Bay make up 46.4% of households and
42.1% in Coromandel-Colville.
House size
Tables 11 and 12 show the number of bedrooms per dwelling for the two wards. Despite the
trend of one and two person households, the amount of small homes being built doesn’t reflect
this.

31
In the two wards, the amount of 0 (e.g. studio apartments) or 1 bedroom dwellings have
decreased, while two bedroom homes have seen minimal growth, especially in Mercury Bay,
where out of the 429 new houses, only three were two bedroom homes.
The Coromandel-Colville ward has seen very little construction of new houses, but this is
probably due to an overall lack of demand due to a reduced population (-54 people).
Table 11: Number of bedrooms per occupied dwelling in Coromandel-
Colville (Statistics New Zealand, 2013)
Table 12: Number of bedrooms per occupied dwelling in Mercury Bay
(Statistics New Zealand, 2013)
Home ownership
Home ownership is much higher in the Coromandel-Colville ward, with 44.1% of the population
owning their home, while in Mercury Bay this figure is 37.7%. However, the purchasing figures
in Mercury Bay are higher, with 24.0% of the population with a mortgage, compared to 17.1% in
Coromandel-Colville.
32
Rent prices
25.0% of the Mercury Bay ward population are renting, compared to 21.7% in Coromandel-
Colville.
Mercury Bay residents are currently paying more in rent than the Coromandel-Colville ward.
6.3% of renters in Mercury Bay pay more than $350 per week, while no renter paid more than
this in Coromandel-Colville. 44.5% of Mercury Bay renters pay between $250 and $350 per
week, while this figure in the Coromandel-Colville ward is 24.2%. 10.6% of residents in
Mercury Bay pay less than $150 per week, while this figure is much higher in Coromandel-
Colville at 25.9%.

33
Conclusions and Recommendations
In New Zealand, there is a shift towards fewer state-owned houses, as well as fewer people
owning their own home (SGS Economics and Planning, 2007). Further, the greater level of
private rentals provide an unsustainable model for housing provision in the country (ibid, 2007).
As the New Zealand Housing Strategy (as cited in SGS Economics and Planning, 2007) states:
The decline in owner-occupation has been accompanied by increased investment in rental
property. This investment may not continue, however, if rental yields fall too far behind
house prices. In some regions, rental housing returns are below the cost of capital, and
investors may be relying on capital gains and tax advantages to make a return on their
investments. This may not be a sustainable basis for on-going investment that delivers a
stable rental market (p. iv).
This situation is particularly relevant for the Thames-Coromandel District, as many properties
are owned by non-residents or absentee landlords. With its high percentage of unoccupied
housing, the private rental market in the district is ill-prepared to service the accommodation
needs of those people who regularly reside in Thames-Coromandel. The SGS Economics and
Planning Research (2007) conducted on housing affordability identifies the Community Sector
as a possible provider who, if funded appropriately, could provide affordable social rental
accommodation.
This is somewhat echoed in discussions of the social needs of the Thames-Coromandel District.
This is reflected in the Thames-Coromandel District Council Challenges and Opportunities
website, which outlines their focus for social development – which specifically mentions a need
to focus on both housing affordability and people with disabilities.
The limited research work that we have completed to date highlights that there are a
number of social development issues affecting our District at present such as housing
affordability. We are already contributing a great deal of resource to the social
development of our District; however, we are looking to take a more coordinated and
effective approach by looking at all the key social issues facing our District and where we
can best contribute to addressing them. In the short term, we will be focussing on the

34
areas of youth and disability – Thames-Coromandel District Council (2012, para. 17).
As rents continue to increase, with more private rental accommodation that is arguably not
maintained to a particularly high standard (and maybe an unsustainable model for housing
provision) (Black and Cox, 2012), there is a need for housing owned and maintained by local
government or community organisations. If local government is unable to fully resource
community organisations to do this, then national funding sources may be the best way to
resource community initiatives. In this way, regional needs can be addressed by regional
organisations.
In Thames-Coromandel (as it is nationally) it is difficult to accurately ascertain exact housing
demands. However, with a high number of vulnerable populations in a socially deprived area,
with limited transport, there is a need for housing for all of the vulnerable groups mentioned in
previous sections. The greatest need, for both wards, appears to be for the elderly and the
disabled – and as mentioned previously, in many cases these two groups are a similar group of
people given that many elderly people also have a disability of some description. Supporting
those with disabilities is in line with District Council’s regionally recognised needs. Providing
adequate housing for these people would be the most appropriate way to support this group, as a
raft of social issues can come from inadequate housing – such as exacerbating financial
insecurity and further ill health (Black & Cox, 2012).
Figures indicate much of the privately owned rental accommodation in the area seems to be three
or four bedrooms – making such houses potentially unaffordable for elderly people who either
live alone or with one other. The housing needs of the elderly and those with a disability, from
current research, suggests that this housing would need to be affordable, well insulated, and
incorporate features of accessibility such as street level entrances (or where this is not possible,
adequate ramps and/or widely spaced steps), wider pathways and hallways, and hand rails. Such
housing could be relatively small and still accommodate tenants’ needs, for example one or two
bedrooms, as a high proportion of these couples do not have dependent children.
Further, an important point to consider in future projections is also the provision of kaumatua

35
housing in the district. Authors of a 1997 study found that kaumatua can be more reluctant to
access medical services and can have less opportunity to supplement their income compared to
non- Māori of the same age (Te Pumanawa Hauora, 1997). The authors of this Massey
University research proposed that this may be due to their whānau and mārae responsibilities. As
more Māori re-enter the Thames-Coromandel District due to their iwi affiliations, greater strain
may be placed on local kaumatua in relation to mārae duties and whānau support – particularly
given that kaumātuā may also be represented in Statistics New Zealand (2006; 2013) census
figures, concerning the numbers of elderly and potentially, also those people with a disability.
Limitations The Coromandel peninsula is a region of New Zealand referred to in the local tourism guide as a
“mountainous landscape”, predominantly due to the Coromandel Range which forms a spine for
the peninsula that rises to nearly 900 metres (Coromandel Visitor’s Guide, 2013). This,
combined with the heavily forested area that makes up the Coromandel Forest Park, means that
the population is somewhat scattered throughout the area, making the accuracy of population
data difficult to obtain. New Zealand housing and disability statistics are already difficult to
locate – finding accurate statistics for a specific district with a scattered population is even more
difficult.
Further, while housing research is a growing field of interest in New Zealand due to
developments in the housing market (particularly in relation to rental accommodation), research
into the housing needs of the Thames-Coromandel District needs to continue. There is a need for
social and affordable housing in the district – particularly for the elderly and those people with a
disability. However, the recommendations contained in this report concerning the specific
required housing features needed are initial suggestions. Before building commences further
research would be needed from primary sources (e.g. local community groups or potential users
themselves) in order to ensure that the benefit of such accommodation for these groups is fully
maximised.

36
References
Batavia, A.I. & Bealaurier, R.L. (2001). The Financial Vulnerability of People with Disabilities:
Assessing Poverty Risks. Journal of Sociology and Social Welfare, 28(1), 139-162.
Black, R. & Cox, A. (2012). Window on Waikato Poverty: Affordable and Social Housing,
Hamilton: Poverty Action Waikato – Te Whakatika Mahi Pohara I Waikato.
Coromandel Visitor’s Guide (2013). Retrieved from http://www.thecoromandel.com/new-
zealand/visitor-guides/ on 1st October 2013.
Department of Public Health (2013). Socioeconomic Deprivation Indexes: NZDep and NziDep.
Retrieved from http://www.otago.ac.nz/wellington/research/hirp/otago020194.html.
Housing New Zealand Corporation. (2008). Maori Housing Trends Report.
http://www.hnzc.co.nz/about-us/research-and-policy/housing-research-and-evaluation
Landlords (2014). Residental Dwelling Sales. Retrieved from
http://www.landlords.co.nz/housing-statistics on 10th July 2014
Ministry of Social Development (2009). Regional Indicators 2009. Retrieved from
http://www.socialreport.msd.govt.nz/2009/regional/. on 1st October, 2013.
New Zealand Herald (2013). Where are NZ's most deprived areas? Retrieved from
http://www.nzherald.co.nz/nz/news/article.cfm?c_id=1&objectid=11254032 on 1st October
2013.
Perry, B. (2012). Household incomes in New Zealand: Trends in indicators of inequality and
hardship 1982-2011. Wellington: Ministry of Social Development.
Policy and Planning Group. (2008). Coromandel Peninsula: District profile – People, housing
and projections. Thames Coromandel District Council
Salmond, C., Crampton, P. & Atkinson, J. (2007). NZDep2006 Index of Deprivation.
Wellington: Department of Public Health, University of Otago.
Salville-Smith, K. and Fraser, R. (2007). Housing and Disability: Future Proofing New Zealand
Housing Stock for an Inclusive Society. Wellington: Centre for Housing Research.
SGS Economics and Planning. (2007). Affordable Housing: The Community Housing Sector in
New Zealand. Wellington: Centre for Housing Research.
Statistics New Zealand (2006). Census Data. Retrieved from www.stats.govt.nz on 1st October
2013.
Statistics New Zealand (2013). Census Data. Retrieved from www.stats.govt.nz on 10th July

37
2014 October, 2013.
Te Pumanawa Hauora (1997). Oranga kaumatua. The Health and Wellbeing of Older Maori
People. A report prepared for the Ministry of Health and Te Puni Kokiri, Wellington.
Te Puni Kokiri. (n.d.). Te Kāhui Māngai (Directory of Iwi and Māori Organisations).Retrieved
from http://www.tkm.govt.nz/. on 1st October 2013.
Thames-Coromandel District Council (n.d.). Communities and wards. Retrieved from
http://www.tcdc.govt.nz/Your-Council/Communities-and-Wards/ on 1st October 2013.
Waikato Institute of Technology. (2011). Scoping of Seasonal Job Opportunities for Youth in the
Mercury Bay Region. Hamilton: Wintec Research Office.
Waldegrave, C., King, P., Walker, T. & Fitzgerald, E. (2006). Māori Housing Experiences:
Emerging Trends and Issues, Auckland: The Family Centre Social Policy Research Unit,
Research Centre for Māori Health and Development Massey University.


