Social and ecological factors influencing movement and organizational patterns in sheep Habiba, Caitlin Barale, Ipek Kulahci, Rajmonda Sulo and Khairi Reda complementary approaches from ecology and computer science
Transcript
Social and ecological factors influencing movement and organizational patterns in
sheep
Habiba, Caitlin Barale, Ipek Kulahci,
Rajmonda Sulo and Khairi Reda
complementary approaches from ecology and computer science
How do we identify the key individuals in a group?
•Personality 'types’•Group social dynamics•Group movement patterns
Approaches
Ecology• Direct observation
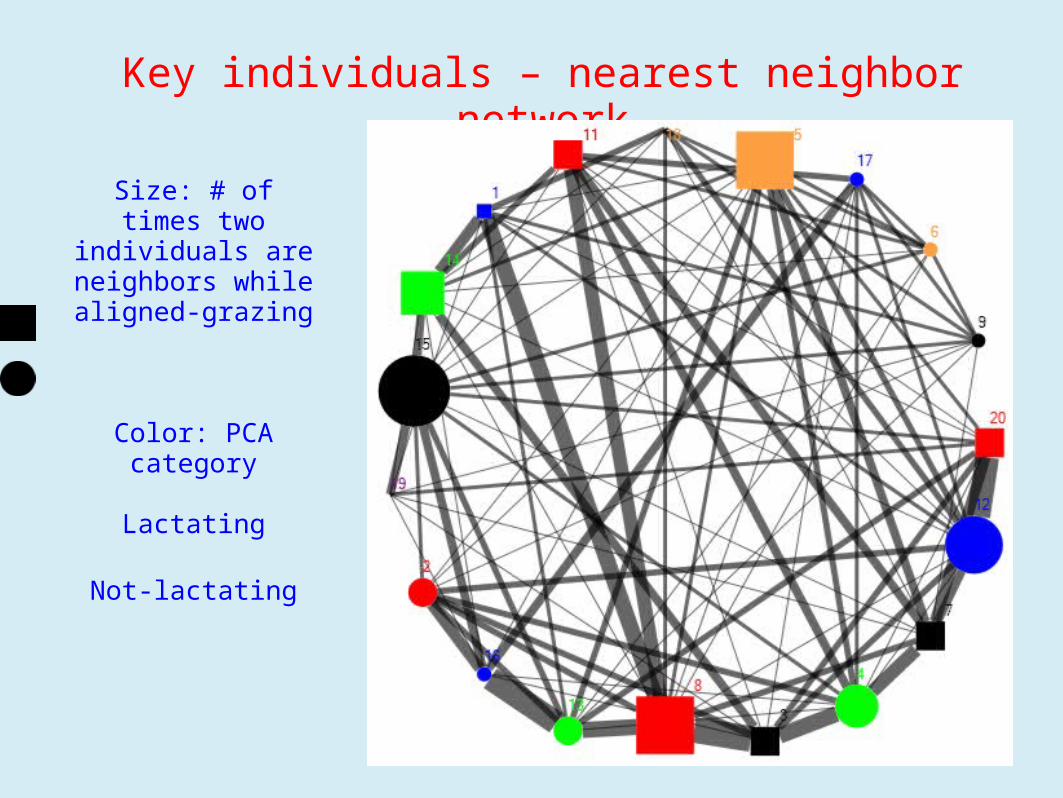
• Information on:• Proximity
• Individual movement patterns
• Behavior
• Interactions
• Individual state
Computer Science• Remote sensing
• Information on:• Proximity
• Group-level movement patterns
• Clustering
• Velocity
• Turning angle
How can we use concepts from computer science to study animal behavior?
•Association visualizations
•Static networks
•GPS clustering algorithms
•Dynamic networks
•Social network analysis
•Agent-based modeling
GPS Data
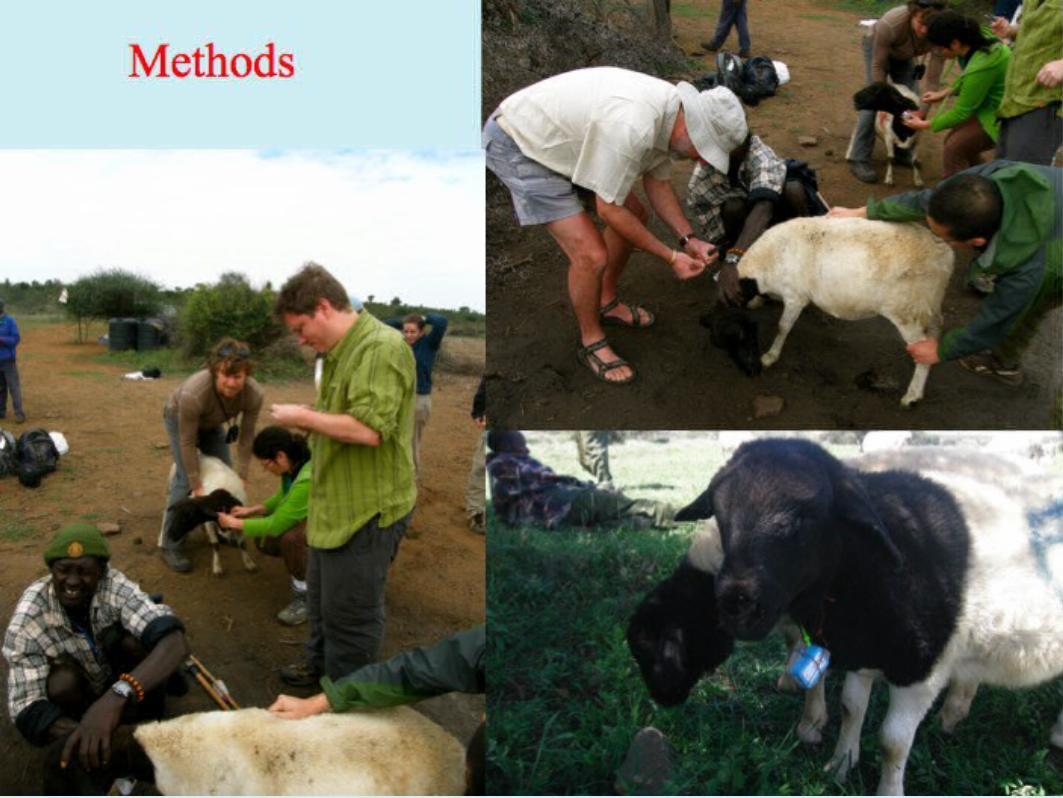
Data Collection
General Statistics Map with GPS readings overlaid (Khairi)
Use k-means algorithm to spatially cluster gps readings. Any two sheep in the same cluster have an edge between them.
Use the Simple Structure Index (SSI) to determine the number of optimal clusters in each time interval
Using different graph theoretic measures, the goal is to identify sampling rates at which the measures contain minimal noise while still being informative of the underlying dynamics in the network.
What is the right temporal resolution?
Apply information theoretic concepts to quantify noise and information and compute the best trade-off across different sampling rates.
Algorithm TWIN
For w < wmax
* Compute the interaction network.
* Compute the different structure measures such
as density, and centrality, etc.Quantify the amount of noise and information inherent
in the network measure.Compute a measure of goodness of fit based on a
trade-off between the two.
TWIN Results
Optimal interval = 3min Optimal interval = 5min
GPS data - issues
Data Quality
Discrepancy of sensor readings on the same sheep Missing Values
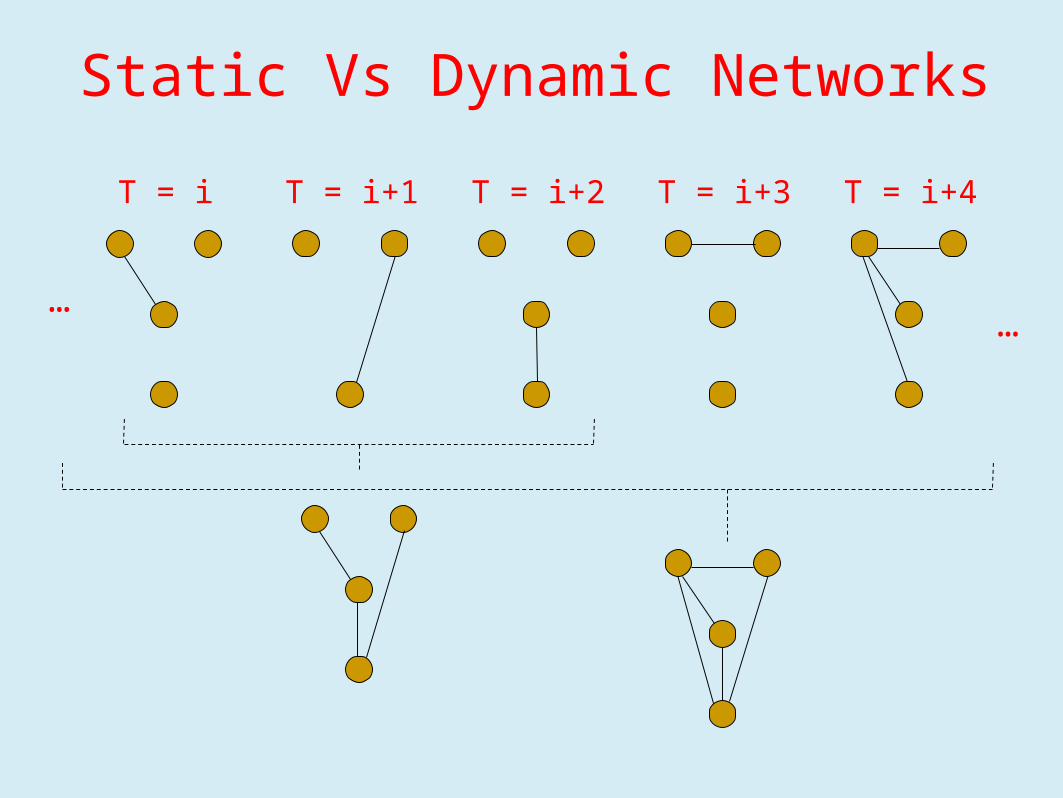
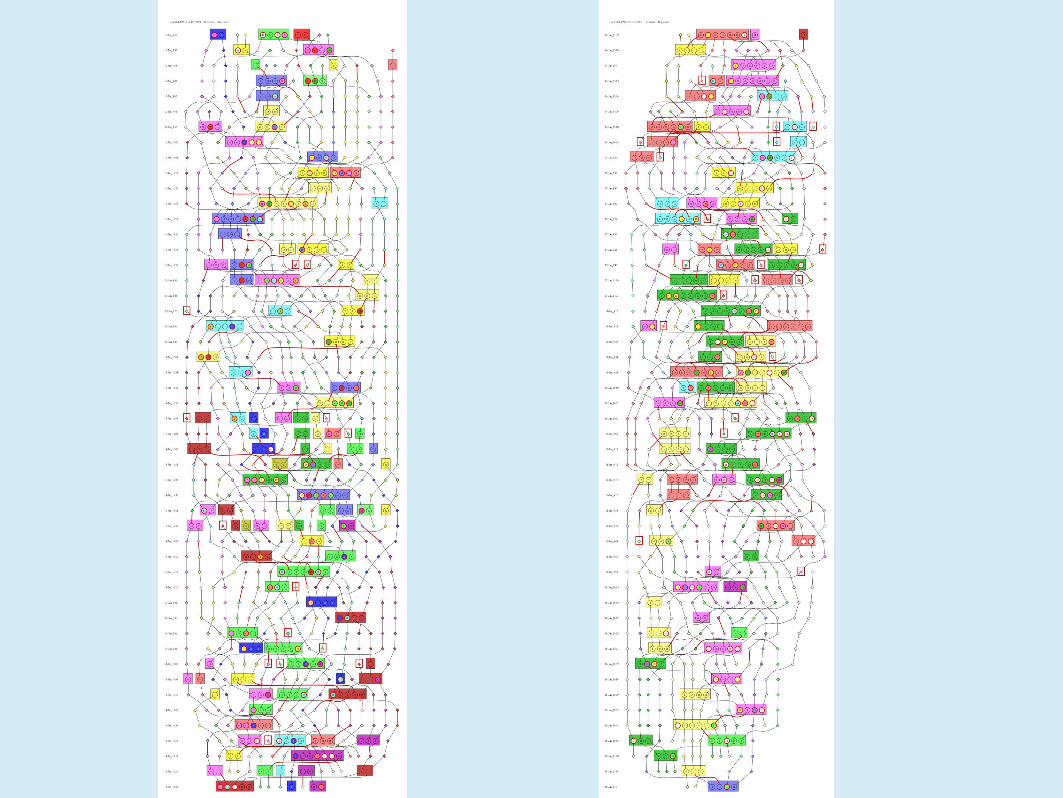
Static Vs Dynamic Networks
T = i
…
T = i+1 T = i+2 T = i+3 T = i+4
…
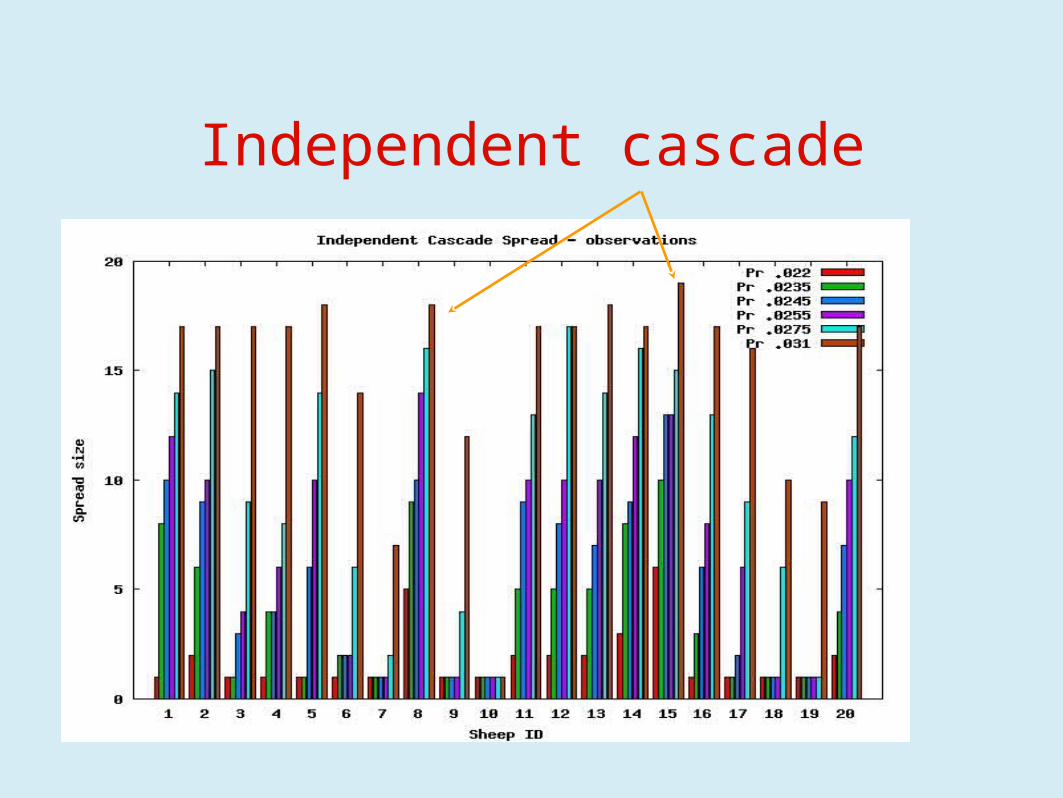
Diffusion Process
• Independent Cascade Diffusion Model
pr
prprpr
pr
Diffusion Process
• Linear Threshold Diffusion Model
өi өj
өk
өl
bi,j
bj,lbi,l
bk,l
bi,k
Independent cascade
Independent cascade
Independent cascade
Text
Linear threshold model
Community Identification
•A dynamic community is a subset of individuals that stick together over time.
•NOTE: Communities ≠ Groups
5 4 32 1
5
4
5
4
1
4
12 3 4
5 2
2 3
5 2 3 1
t=1
t=2
t=3
t=4
t=5
Approach: Assumptions
• Individuals and groups represent exactly one community at a time.
• Concurrent groups represent distinct communities.
Desired
Required
•Conservatism: community affiliation changes are rare.•Group Loyalty: individuals observed in a group belong to the same community.•Parsimony: few affiliations overall for each individual.
Approach: Color = Community
Valid coloring: distinct color of groups in each time step
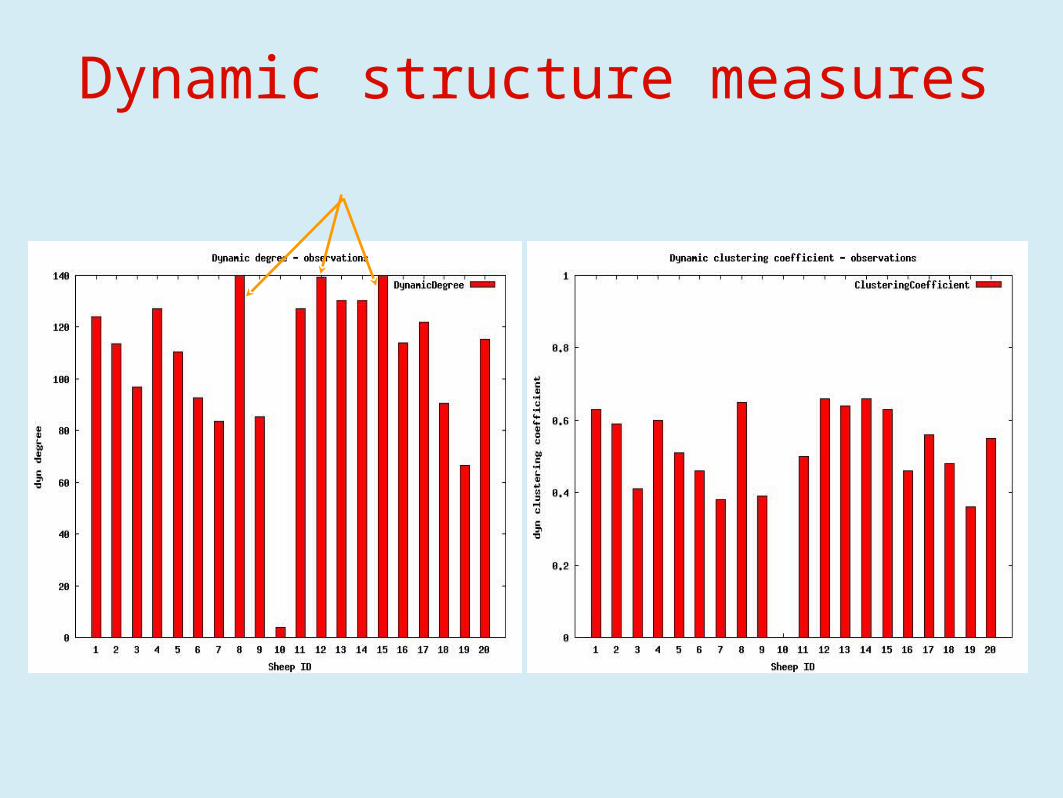
Dynamic structure measures
Dynamic structure measures
• Interesting behavioral aspects to model– Social foraging• Alignment• Sub-group formation from local interactions• “Exploratory” random walks
– Foraging strategy• How do sheep find good food in patchy landscape?• How does information about food resources spread in the
herd?• Competition
– Pull and push
Agent-based model
– Sheep watch closest N neighbors and react to their behavior
– No personality variance among agents– Agents assumed to be “hungry”. They graze
continuously without rest– Agents have 3 states: GRAZE, WALK, PANIC– Low vegetation quality and patchy landscape;
agents need to move frequently to maximize gain
Assumptions
• Agents switch back and forth between grazing and social walking
• State transition governed by a Gaussian timer– Grazing bouts: mean=6 sec, SD=2 sec– Social walking: mean=2-8 sec (depending on
isolation), SD=2.5 sec
• Certain events cause agents to switch state– Agents minimize grazing and take longer walks if
they are isolated from subgroup
Timing
Local rules
Collision avoidance Cohesion Alignment
Random biased-walksP = 0.05 (when walking)
Pulling
Agents that find themselves drifting away turn back and rejoin the subgroup
Subgroup awareness
Demo
Conclusions
Sheep 15 – an influential individual??
• Central in the observational networks– High betweeness and degree– Highest number of successful pulls
• Role in correlational plots– Often an outlier– Makes trends more significant
• GPS – doesn’t stand out• Why?? Missing data…
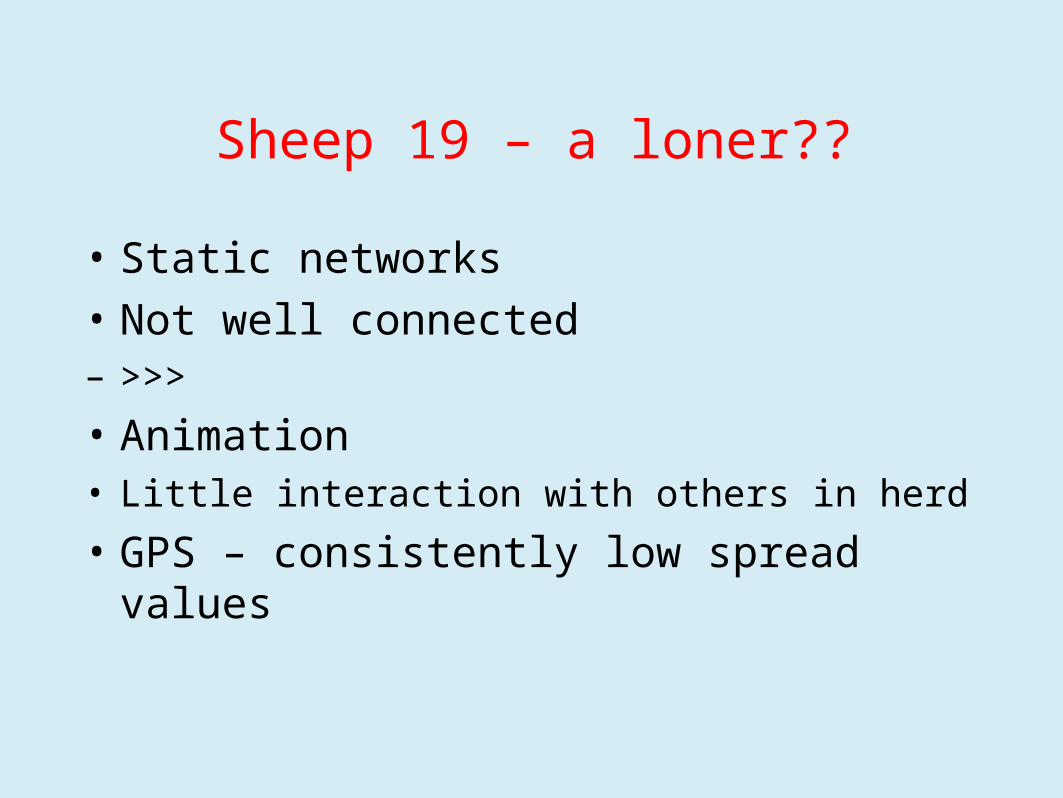
Sheep 19 – a loner??
• Static networks
• Not well connected– >>>
• Animation• Little interaction with others in herd
• GPS – consistently low spread values
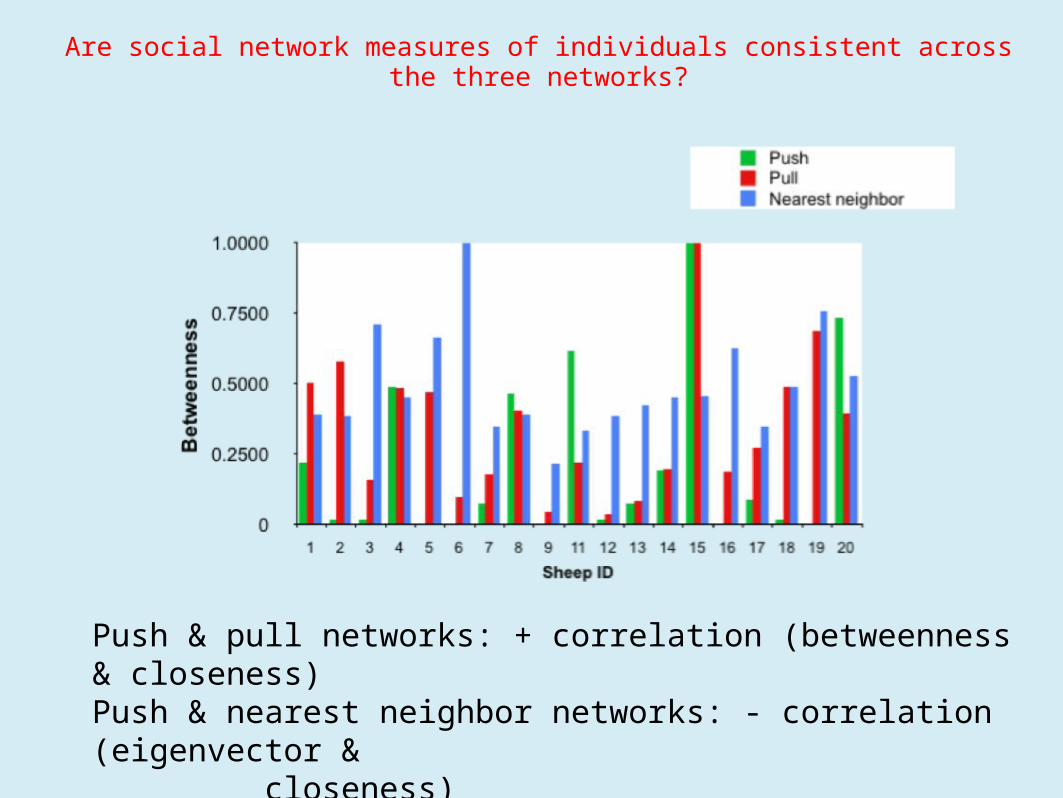
Are social network measures of individuals consistent across the three networks?
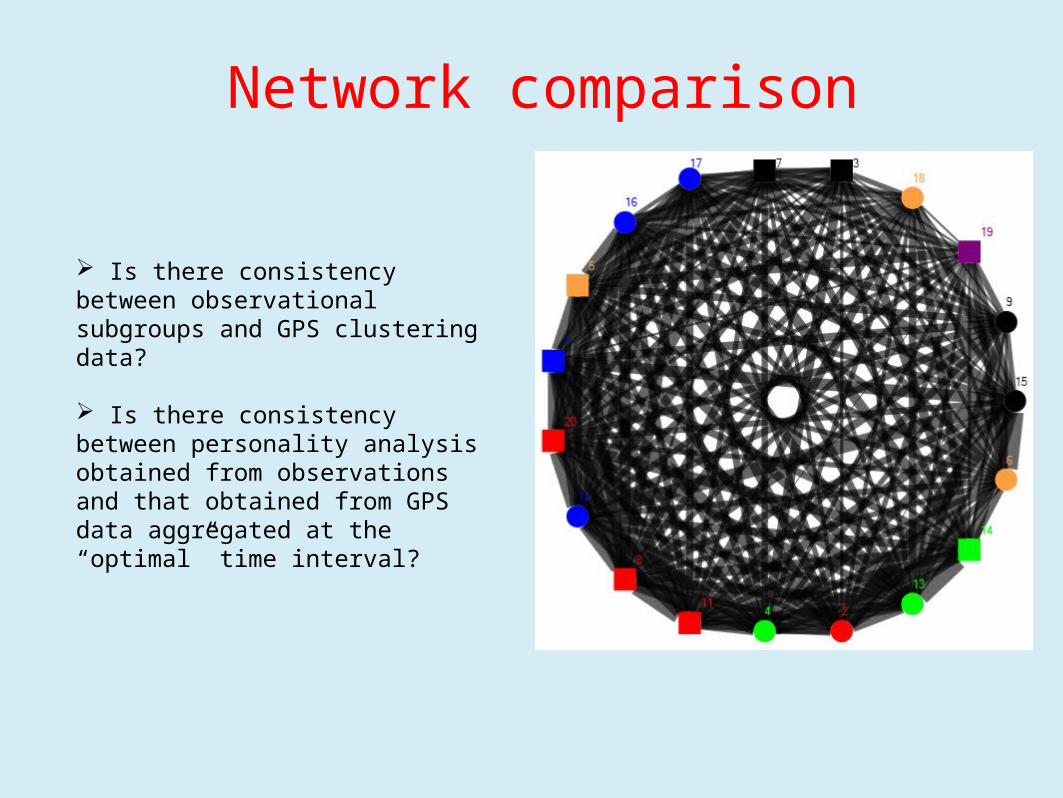
Is there consistency between observational subgroups and GPS clustering data?
Is there consistency between personality analysis obtained from observations and that obtained from GPS data aggregated at the “optimal” time interval?
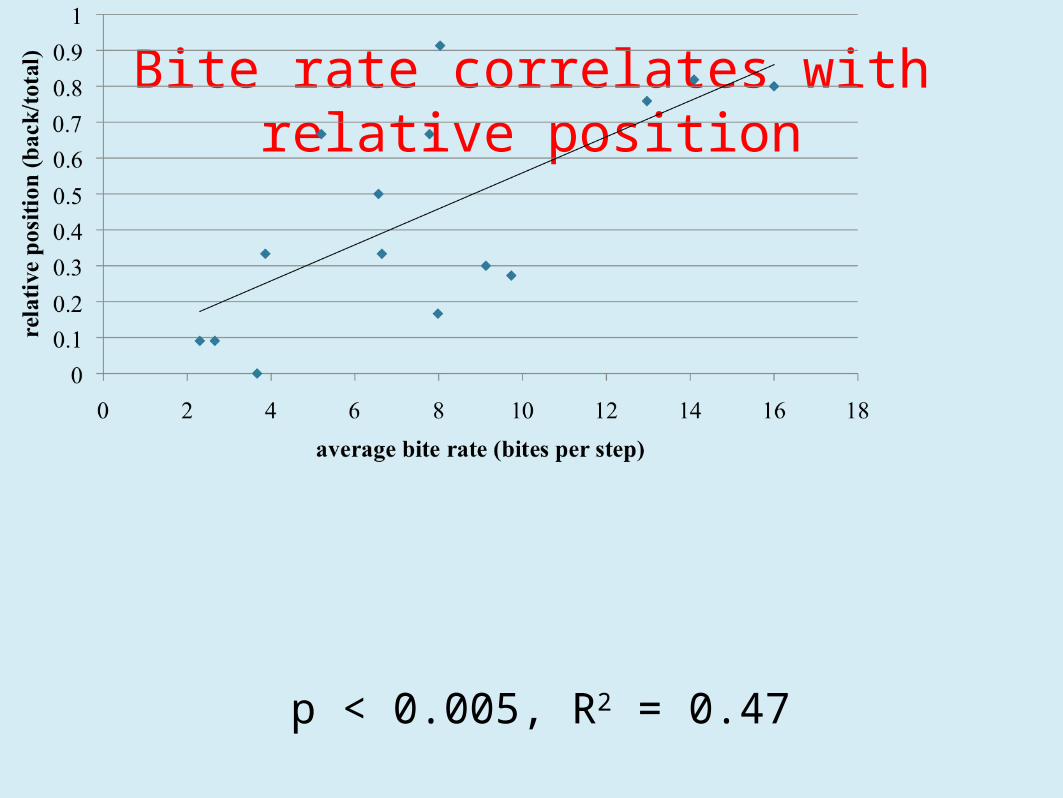
Bite rate correlates with relative position
p < 0.005, R2 = 0.47
CS future directions
•Community structure evolution.
•Compare the observational data with “unsupervised” data collection and interpretation methods.
•Network comparison of different population to discover their social dynamics independent of their environment and other factors.


![MENU BOUFFE kevin [Recovered] - Philémon Barale britannique, farnham, qc· 5% 473ml · 8 rhums & cachaça barbancourt, rhum agricole· haïti 8,5 ron barcelo gran anejo· rep. dominicaine](https://static.documents.pub/doc/80x56/5fe808da024c9873e9217062/menu-bouffe-kevin-recovered-philmon-bar-ale-britannique-farnham-qc-5-473ml.jpg)


![Currents and Objects - videsinstituts.lv · [Barale & Gade, 2014] ... (1996-99) SAR Applications Martin Gade - SAR Marine Applications - 3 – Currents & Objects 37 . Universität](https://static.documents.pub/doc/80x56/5ee3deb0ad6a402d666d6d13/currents-and-objects-barale-gade-2014-1996-99-sar-applications.jpg)


