Social and Economic Impacts of TUUNGANE I | Mock Report 2011 1 Social and Economic Impacts of TUUNGANE I: Mock Report Macartan Humphreys 1 Columbia University Raul Sanchez de la Sierra Columbia University Peter van der Windt Columbia University Abstract This is a mock report: it provides the structure of basic analysis of survey-based and behavioral measures for assessing the impacts of the impact of TUUNGANE I, a major UK government funded Community Driven Reconstruction Program implemented by IRC and CARE in Eastern DRC. We provide tests of the effects of TUUNGANE on governance outcomes, social cohesion and welfare using a structure consistent with very preliminary data presently being collected in the field. We emphasize that this data is a non-representative sample of the ultimate data and that it has been scrambled for the purpose of the drafting of this mock report. 1 We have many many people to thank for their input into this document and design. At IRC thanks head of research Jeannie Annan and her predecessor Jodi Nelson, Research and Evaluation Advisor Tom Shaw and Charles Lor before him. Project directors have also provided tremendous insight; we thank Jana Frey, Sophie Dieselhorst, and Liz McBride especially. TUUNGANE area coordinators, evaluation, and project staff have also been very generous. We thank especially Deogracias Mulewa and Jean Paul Zibika. Our warm appreciation too to Professor Chimanuka Bantuzeko and Gabriel Kalaba who are leading data collection efforts in the field. Lots of support has also come from Columbia, we thank Caroline Peters for a million things, Eric Mvukiyehe for piloting many survey questions at baseline, Simon Collard-Wexler for piloting key endline questions, and Grant Gordon for piloting the behavioural measures (and a lot more besides). We thank members of CAPERS as well as participants at the Bukavu 2010 summer workshop and the CSDS social cohesion workshop. Other colleagues we thank for generous advice are Don Green, Kosuke Imai, Jake Bowers, Chris Udry, Chris Blattman. We acknowledge financial support for Columbia’s role from 3IE, and DFID for funding for the implementation of the evaluation.
Transcript
Social and Economic Impacts of TUUNGANE I | Mock Report 2011 1
Social and Economic Impacts of TUUNGANE I:
Mock Report
Macartan Humphreys1
Columbia University
Raul Sanchez de la Sierra
Columbia University
Peter van der Windt
Columbia University
Abstract
This is a mock report: it provides the structure of basic analysis of survey-based and behavioral measures for
assessing the impacts of the impact of TUUNGANE I, a major UK government funded Community Driven
Reconstruction Program implemented by IRC and CARE in Eastern DRC. We provide tests of the effects of
TUUNGANE on governance outcomes, social cohesion and welfare using a structure consistent with very
preliminary data presently being collected in the field. We emphasize that this data is a non-representative sample
of the ultimate data and that it has been scrambled for the purpose of the drafting of this mock report.
1 We have many many people to thank for their input into this document and design. At IRC thanks head of research Jeannie Annan and her predecessor Jodi Nelson, Research and Evaluation Advisor Tom Shaw and Charles Lor before him. Project directors have also provided tremendous insight; we thank Jana Frey, Sophie Dieselhorst, and Liz McBride especially. TUUNGANE area coordinators, evaluation, and project staff have also been very generous. We thank especially Deogracias Mulewa and Jean Paul Zibika. Our warm appreciation too to Professor Chimanuka Bantuzeko and Gabriel Kalaba who are leading data collection efforts in the field. Lots of support has also come from Columbia, we thank Caroline Peters for a million things, Eric Mvukiyehe for piloting many survey questions at baseline, Simon Collard-Wexler for piloting key endline questions, and Grant Gordon for piloting the behavioural measures (and a lot more besides). We thank members of CAPERS as well as participants at the Bukavu 2010 summer workshop and the CSDS social cohesion workshop. Other colleagues we thank for generous advice are Don Green, Kosuke Imai, Jake Bowers, Chris Udry, Chris Blattman. We acknowledge financial support for Columbia’s role from 3IE, and DFID for funding for the implementation of the evaluation.
Social and Economic Impacts of TUUNGANE I | Mock Report 2011 2
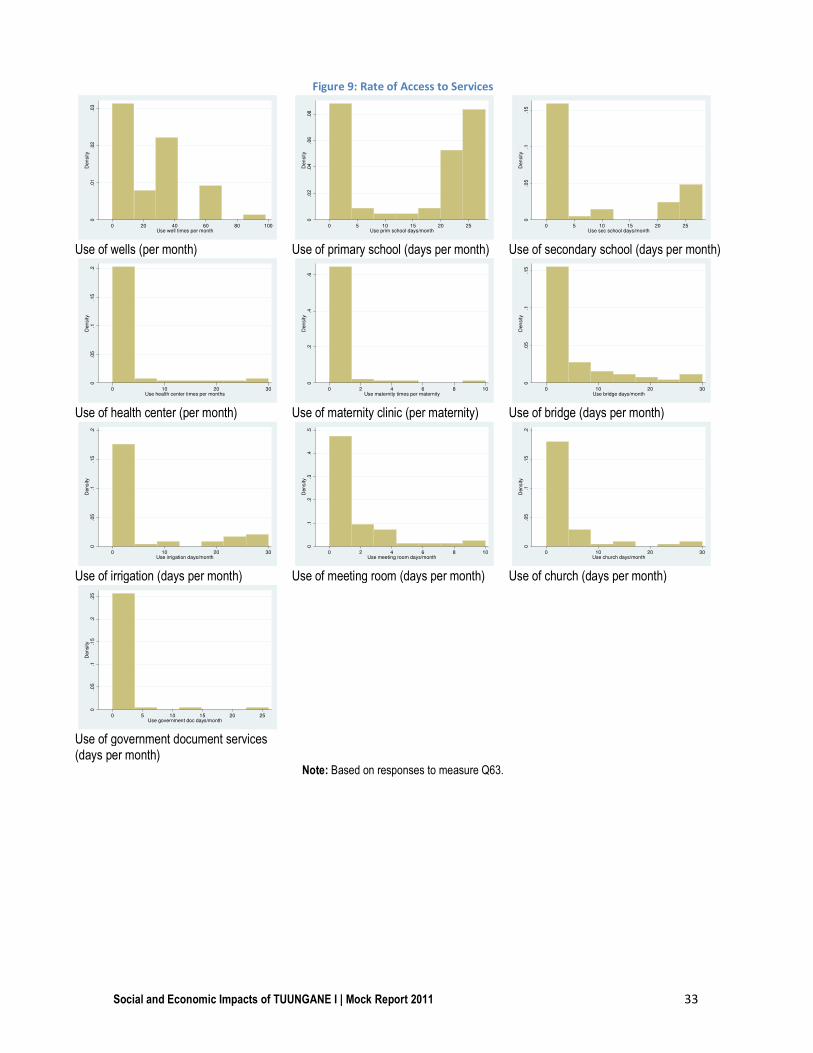
Figure 9: Rate of Access to Services .......................................................................................................... 33
Social and Economic Impacts of TUUNGANE I | Mock Report 2011 6
1 Introduction We describe mock results from an evaluation of the impacts of a major post conflict development program in East
Congo, TUUNGANE. TUUNGANE is a Community Driven Reconstruction intervention, funded by the UK
government and implemented by the International Rescue Committee (IRC) and CARE between 2007 and 2011.
The program is designed both to support economic recovery and to improve the quality of governance and social
cohesion. This research is designed to measure whether these objectives are in fact met.
In order to measure the effectiveness of TUUNGANE, our research uses a method of randomized intervention
which allows us to observe a set of control communities that are similar (in expectation) to the TUUNGANE
communities in every respect except for the presence of the program. In all 280 communities have been assigned to
treatment conditions through public lotteries. Among a subsample of those selected, a random set of communities
implement a variation of the program in which community development committees are required to have gender
parity. Outcome measures include both survey-based measures and behavioral measures.
The primary hypotheses of our study in the areas of governance, cohesion, and welfare are shown in Table 1.
These hypotheses were formed jointly by the research team and IRC in 2007 and are contained in the Tuungane
Impact Evaluation Framework2. A broader set of secondary hypotheses relating to variations in implementation,
heterogeneous effects, contextual factors, unintended consequences, behavioral outcomes, and measurement
strategies are described in the document TUUNGANE I: Outcomes and Data Sources (“ODS”).
Table 1: Primary Hypotheses
# Category Hypothesis Table(s)
H1 Cohesion Individuals in TUUNGANE communities will exhibit higher levels of acceptance of others into their communities.
Table 23, Table 25, Table 26
H2 Cohesion Individuals in TUUNGANE communities will exhibit higher levels of trust in other members of their communities.
Table 27
H3 Cohesion /Participation
TUUNGANE communities will be more willing to contribute time and effort individually to collective goods.
Table 9
H4 Cohesion TUUNGANE target communities will be more likely to work together to solve local development problems.
Table 28
H5 Accountability Communities will be more proactive in seeking support from local government and NGOs for community initiatives and the private sector.
Table 18
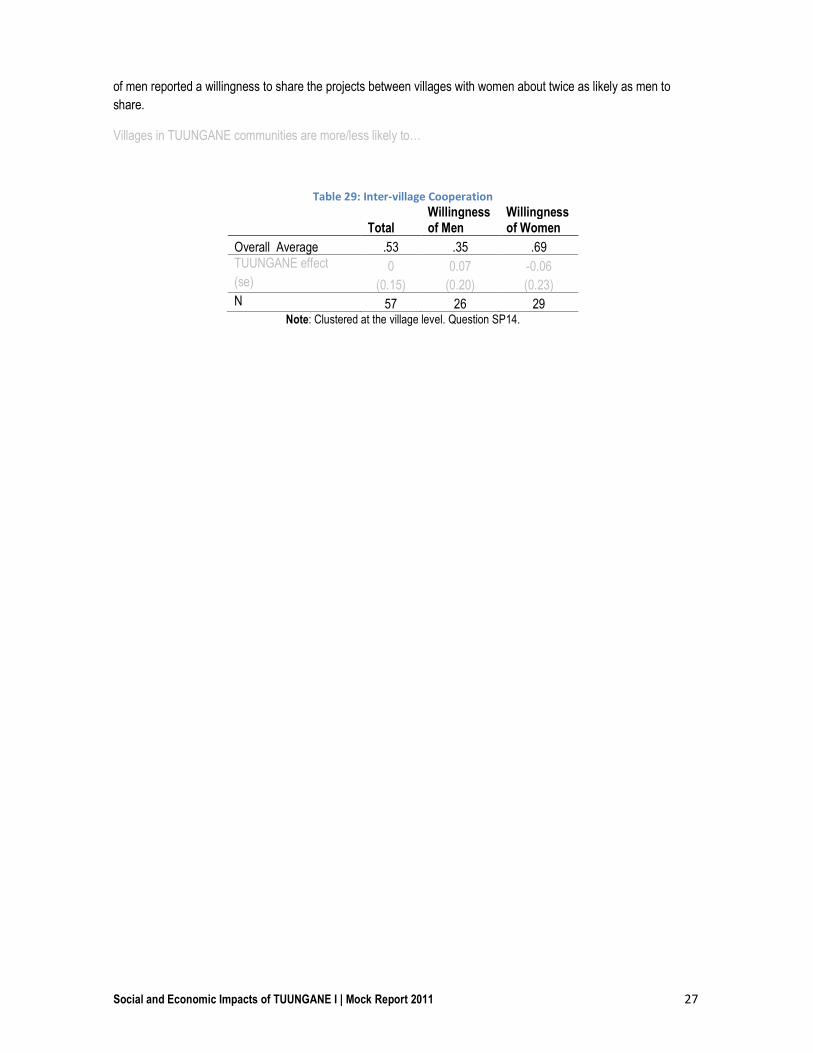
H6 Cohesion Villages in TUUNGANE communities will have a greater propensity to work collectively with other villages to address development challenges.
Table 29
H7 Participation Individuals in TUUNGANE communities will report a greater sense of a right to take part in local decisions.
Table 4,
H8 Participation Individuals in TUUNGANE communities will report a greater sense of obligation to take part in local decisions.
Table 12
H9 Transparency Individuals in TUUNGANE communities will report greater knowledge about local decision-making processes and outcomes
Table 17, Table 19, Table 20
H10 Accountability Individuals in TUUNGANE communities will report an increased willingness to hold traditional and political leaders accountable.
Table 13, Table 14, Table 15
H11 Participation Individuals in TUUNGANE communities are more likely to believe that local leaders should be elected rather than selected through an alternative mechanism.
Table 5, Table 6
H12 Welfare Access to community utilities and infrastructure, including those not directly supported by TUUNGANE, will be greater in TUUNGANE communities. [As evidenced by improved health and education indicators]
Table 35, Table 36, Table 37
H13 Welfare Household Income and asset holdings will be greater in TUUNGANE communities.
Table 30, Table 33, Table 34
H14 Welfare Households will allocate a greater share of their time to productive activities in TUUNGANE communities.
Table 31, Table 32
H15 Welfare Time devoted to productive activities not directly associated with TUUNGANE projects will increase.
Table 31, Table 32
Note: Primary hypotheses from the 2007 design document. For further hypotheses see Outcomes and Data Sources (2011).
Social and Economic Impacts of TUUNGANE I | Mock Report 2011 7
In this report we provide mock results on key measures to test these primary hypotheses as well as a set of related
behavioral hypotheses that capture further dimensions of the quality of local governance. We organize our
presentation by theme rather than by hypothesis number, first examining impacts on five dimensions of governance,
(Section 2) then examining impacts on social cohesion (Section 3) and on welfare (Section 4).
1.1 RAPID Measurement Strategy
As with other evaluations, the reliability of the lessons learned from this evaluation depends not just on the
identification strategy (here, randomization) but also on the quality of outcome measures. Since community driven
reconstruction (CDR) programs seek to affect social outcomes they confront particular measurement challenges. In
particular it can often be difficult to determine from responses to survey questions alone whether there have been
real changes in attitudes and behavior. Recent evaluations of CDR programs have thus found the use of behavioral
measures to be a stronger and less ambiguous method of measurement than relying solely on survey measures.
Table 2: The RAPID process
Description Duration Lead Features
A Team A schedules
VILLAGE meeting
2 days
Project
Team
The project team has an initial visit with the chief to ask that he
convene a public meeting at which a minimum share of the village
population is required to attend.
VILLAGE meeting
and Project
Description Forms
Project
Team
The RAPID project is described to the village. Measures of the quality
of participation are taken at these meetings. The village is asked to
take steps towards determining how to use of project funding.
B Collection of Forms Brief visit Project
Team
Measures of the village’s decisions regarding how to use funding and
who is entrusted to manage it are collected.
C Disbursement of
Funds by IRC Brief visit
IRC/
CARE
Funds are disbursed. Measures of accountability, transparency, and
capture are taken with respect to the way that funds are received and
how they are subsequently reported.
• Auditing procedures are confirmed, with 50% of villages told that the audit is certain and 50% that is simply possible. Broad results from audits are reported at village meetings.
• The amount provided to villages will be $1000, $100 more than the minimum guaranteed. This difference provides a means of measuring the extent to which financial information is communicated in communities beyond what is stipulated by the project structures.
D Auditing
2 days
Audit
Team
Auditing is undertaken to examine capture, efficiency, transparency,
and steps towards accountability that are taken.
Follow-up Surveys Survey
Team
Measures are included in the final survey and a supplementary survey
to determine the transparency of the process, the quality of
participation in village decision-making, and the efficiency and equity
of outcomes.
Given the importance and scale of the current evaluation we seek strong outcome measures. In particular we seek
measures that record behavioral change in terms of outcomes of direct interest to policy formulation. The key
features of our strategy are as follows:
• 560 villages (half of which have participated in TUUNGANE and half of which have not) are participating in
a new unconditional cash transfer program (RAPID: Recherche-Action sur les Projets d’Impact pour le
Développement) in which they determine how to make use of $1000 of unconditional project funding.
Social and Economic Impacts of TUUNGANE I | Mock Report 2011 8
• Detailed measurement strategies will be employed to assess the extent to which funds are used in a more
accountable and transparent manner in TUUNGANE treatment relative to control areas.
The RAPID project involves four steps spread out over the course of two to three months. The key features of these
steps are described in Table 2.
1.2 Note on Interpretation of Mock Report results
The results presented in this report provide the simple comparisons of outcomes in treatment and control
communities.3 Because of the random assignment to treatment this comparison gives unbiased estimates of the
causal effect of the program on outcomes of interest.
The results presented in the present report are however preliminary in a number of ways. First the data is at present
extremely limited in quantity. Data is gleaned from the initial stages of data collection in two out of the 4 provinces
slated for evaluation and represent between about 2% and 15% of the data on various measures. Second, since the
order of implementation is not random, this data cannot be considered a representative sample of the ultimate
dataset. Third, the data used here is only partially cleaned as cleaning operations are most efficiently done in large
batches.
With such a small and unrepresentative dataset any results reported here, positive or negative, should be treated
with great caution. Focus at this stage should be on the form of hypothesis testing being employed and not on any
particular results.
Moreover it should be noted that the kinds of results that can be reported for small samples is different for what can
be reported for large samples. For example our scope to disaggregate data (for example by area, by gender, by
background characteristics) is very weak, as is our ability to make use of baseline data.
Finally for the mock report, the data used is not only of limited quantity, unrepresentative, and not fully cleaned, it
has also been “scrambled”: in particular we deliberately employ a false indicator of whether a village took part
in TUUNGANE or not.4 This helps in maintaining the present focus on design rather than on results. Discussion of
mock results are grayed out in the present text.
2 Results I: Governance We examine five dimensions of governance: participation, accountability, efficiency, transparency, and capture.
2.1 Participation
We define participation as the extent to which villagers are willing and able to be part of public decision
making. The behavioral data collection is designed to provide multiple natural points to measure the quality of
participation in public decision making, both in terms of who takes part and how they take part.
3 As per the analysis plan these will be weighted by inverse propensity weights and sampling weights in future iterations. The analysis plan also provides a specification with controls which is expected to provide more precise estimates as well as two robustness checks. 4 All hypotheses examined here were developed ex ante (in 2007) and specified without reference to evidence on treatment
effects. In all but three cases, tables were developed by the research team without accessing actual data on treatment and data has not been accessed by the researchers at the time of circulation of this mock report. The exceptions are indicated here and in the Outcomes and Data Sources document with a dagger marking†.
Social and Economic Impacts of TUUNGANE I | Mock Report 2011 9
2.1.1 RAPID meeting turnout
One of the first measures of participation collected during the behavioral exercise is the number of people that
attend the initial meeting to learn about the RAPID project. Given the opportunity costs of participating in a meeting
of this form (no compensation was provided), we interpret attendance to indicate interest in civic participation (either
on the part of the villager or on the part of the chief or other mobilizers).
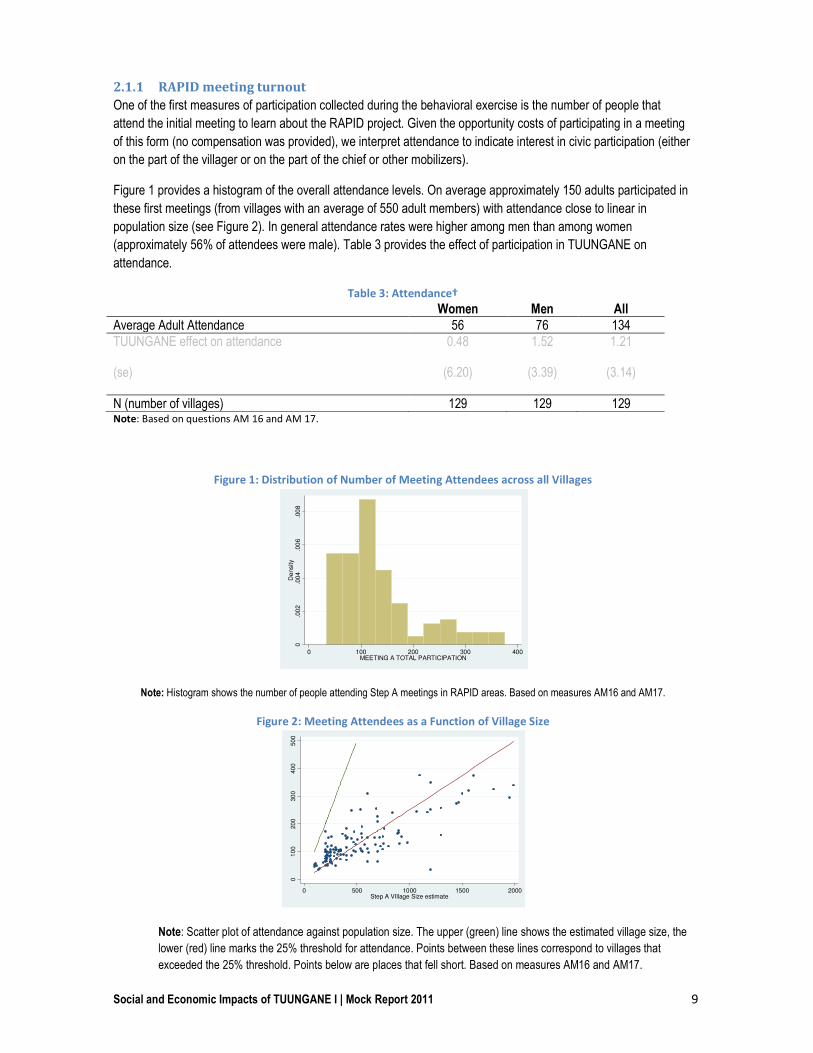
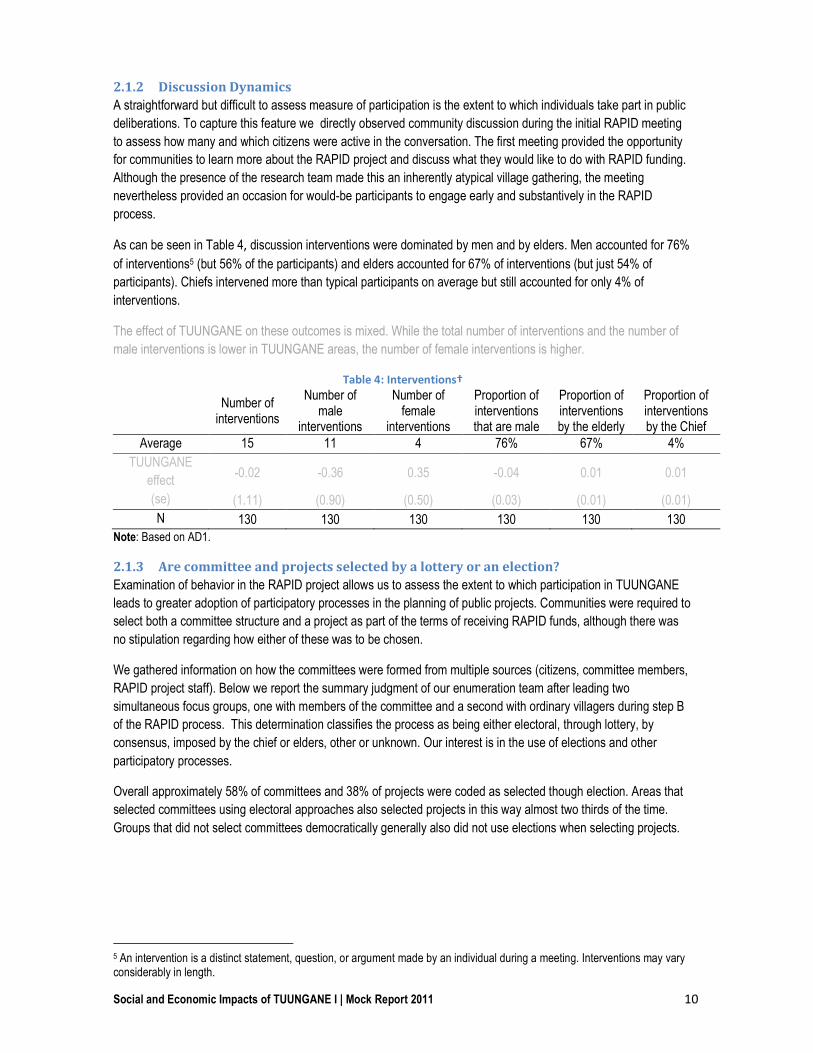
Figure 1 provides a histogram of the overall attendance levels. On average approximately 150 adults participated in
these first meetings (from villages with an average of 550 adult members) with attendance close to linear in
population size (see Figure 2). In general attendance rates were higher among men than among women
(approximately 56% of attendees were male). Table 3 provides the effect of participation in TUUNGANE on
attendance.
Table 3: Attendance†
Women Men All Average Adult Attendance 56 76 134 TUUNGANE effect on attendance 0.48 1.52 1.21
(se) (6.20) (3.39) (3.14)
N (number of villages) 129 129 129 Note: Based on questions AM 16 and AM 17.
Figure 1: Distribution of Number of Meeting Attendees across all Villages
Note: Histogram shows the number of people attending Step A meetings in RAPID areas. Based on measures AM16 and AM17.
Figure 2: Meeting Attendees as a Function of Village Size
Note: Scatter plot of attendance against population size. The upper (green) line shows the estimated village size, the
lower (red) line marks the 25% threshold for attendance. Points between these lines correspond to villages that
exceeded the 25% threshold. Points below are places that fell short. Based on measures AM16 and AM17.
0.0
02
.00
4.0
06
.00
8D
en
sity
0 100 200 300 400MEETING A TOTAL PARTICIPATION
01
00
20
030
040
050
0
0 500 1000 1500 2000Step A VIllage Size estimate
Social and Economic Impacts of TUUNGANE I | Mock Report 2011 10
2.1.2 Discussion Dynamics
A straightforward but difficult to assess measure of participation is the extent to which individuals take part in public
deliberations. To capture this feature we directly observed community discussion during the initial RAPID meeting
to assess how many and which citizens were active in the conversation. The first meeting provided the opportunity
for communities to learn more about the RAPID project and discuss what they would like to do with RAPID funding.
Although the presence of the research team made this an inherently atypical village gathering, the meeting
nevertheless provided an occasion for would-be participants to engage early and substantively in the RAPID
process.
As can be seen in Table 4, discussion interventions were dominated by men and by elders. Men accounted for 76%
of interventions5 (but 56% of the participants) and elders accounted for 67% of interventions (but just 54% of
participants). Chiefs intervened more than typical participants on average but still accounted for only 4% of
interventions.
The effect of TUUNGANE on these outcomes is mixed. While the total number of interventions and the number of
male interventions is lower in TUUNGANE areas, the number of female interventions is higher.
Table 4: Interventions†
Number of
interventions
Number of male
interventions
Number of female
interventions
Proportion of interventions that are male
Proportion of interventions by the elderly
Proportion of interventions by the Chief
Average 15 11 4 76% 67% 4%
TUUNGANE
effect -0.02 -0.36 0.35 -0.04 0.01 0.01
(se) (1.11) (0.90) (0.50) (0.03) (0.01) (0.01)
N 130 130 130 130 130 130 Note: Based on AD1.
2.1.3 Are committee and projects selected by a lottery or an election?
Examination of behavior in the RAPID project allows us to assess the extent to which participation in TUUNGANE
leads to greater adoption of participatory processes in the planning of public projects. Communities were required to
select both a committee structure and a project as part of the terms of receiving RAPID funds, although there was
no stipulation regarding how either of these was to be chosen.
We gathered information on how the committees were formed from multiple sources (citizens, committee members,
RAPID project staff). Below we report the summary judgment of our enumeration team after leading two
simultaneous focus groups, one with members of the committee and a second with ordinary villagers during step B
of the RAPID process. This determination classifies the process as being either electoral, through lottery, by
consensus, imposed by the chief or elders, other or unknown. Our interest is in the use of elections and other
participatory processes.
Overall approximately 58% of committees and 38% of projects were coded as selected though election. Areas that
selected committees using electoral approaches also selected projects in this way almost two thirds of the time.
Groups that did not select committees democratically generally also did not use elections when selecting projects.
5 An intervention is a distinct statement, question, or argument made by an individual during a meeting. Interventions may vary considerably in length.
Social and Economic Impacts of TUUNGANE I | Mock Report 2011 11
Table 5: Selection Mechanisms
Project selected by election? No Yes Total Committee selected by election?
No 49 2 51 Yes 28 45 73
Total 77 47 124 Note: Based on measures B 32 and B33.
Table 6: Influence of TUUNGANE on Selection Mechanisms
Average .32 .14 .71 .11 .79 .43 .29 TUUNGANE effect: -0.33 0 -0.1 -0.05 0.48** 0.19 0.19 (SE) (0.24) (0.17) (0.16) (0.16) (0.17) (0.23) (0.20) N 28 28 28 28 28 28 28 Note: Clustered at the village level. Female and Male observations do not add up to the Total number of observations because
of several observations missing gender information. Based on measure Q77.
From Table 12 we see that … Moreover overall in TUUNGANE areas respondents are X percentage points more
likely to provide an influence response than a support response, compared to Y percentage points in control areas.
This different is / is not significant at…
2.2 Accountability
We define accountability as the willingness and ability of community members to sanction leaders for poor
performance and the willingness of leaders to respond to citizen requests. We gather measures from multiple
sources during and following the implementation of project RAPID to determine whether communities put in place
and/or make use of any mechanisms of accountability to oversee the RAPID process.
2.2.1 Presence of Accountability Mechanisms
We examine the presence of accountability mechanisms that the village puts in place to oversee the use of
TUUNGANE funding as a measure of a culture of accountability in villages. At no point during the RAPID process
do we encourage or suggest to communities that they ought to put such measures in place. To find out whether they
did implement such mechanisms out of their own volition, we gather measures from three separate sources (1) from
a focus group meeting with RAPID committee representatives (for these results an item is marked if any one
member reports it) (2) from a simultaneous interview with two RAPID committee members and (3) a random sample
of 10 villager respondents.
Three different measures are created:
1. Whether an external accountability measure (such as a distinct committee) has been put into place 2. Whether the committee has been required to report its actions to the community as a whole
Social and Economic Impacts of TUUNGANE I | Mock Report 2011 15
3. Whether no mechanism has been put in place or the committee has been tasked with overseeing itself
Table 13 provides a summary of results. In most cases villages reported no oversight mechanisms of any form.
Each data source generally corroborated the numbers reported by the other two, with the community respondents
more likely to say that their community as a whole was holding the RAPID project committee responsible.
Table 13: Presence of Accountability Mechanisms
Focus Group with RAPID
Committee Member Interview with two RAPID
Committee Members Interview with Random
Villagers
External Community None External Community None External Community None
Our most important measure of capture is the amount of the $1000 grant that our auditors are unable to account for
during their two day community audit. The auditors were trained to rule out as many strategies as possible that
committees can use to divert funds. They operate using a checklist of 32 possible strategies that the committees
can use, including exchange rate manipulations, quantity manipulations, quality manipulations and quality over
reporting. Auditors are asked to verify prices in the market whenever possible (constrained by time, they can in last
resort obtain information from prices by women in the village) and they use group discussions to assess the actual
price to minimize the risk of over-reporting at any step. In addition, they interview a random sample of beneficiaries
and evaluate how much was transferred to them, obtaining proofs when possible. This also provides us an estimate
of how many “ghost” beneficiaries were added to the list.
Social and Economic Impacts of TUUNGANE I | Mock Report 2011 22
To date we have very few (7) units with data on this measure. Figure 6 shows this distribution of the measure. On
average $160 of the $1000 could not be verified by our teams.
Figure 6: Amount Not Verifiable
Note: Based on measure DA 109.
Table 21: Traceability of money
Amount not traceable TUUNGANE effect 143.49 (se) (-112.96) N 7
Note: Based on measure DA 109.
As seen in Table 21 we find no evidence for an effect of TUUNGANE on capture of project funds.
2.5.2 RAPID: Number of Beneficiaries
A second measure of capture is the extent to which benefits are distributed broadly or narrowly in villages. Table 22
shows the average number of household beneficiaries per project. We restrict the analysis here to villages in which
at least one respondent is recipient of private transfer to eliminate villages with projects that do not involve cash
transfers.
While on average 70% of the households in the villages with projects of private distribution claim to have received
private transfers from the RAPID project, households in TUUNGANE areas where the villages chose to have
distribution RAPID projects are 42% less likely to have received private transfers, given a same project amount of
$1000. In other words, our most direct estimate of the number of beneficiaries (taken directly from potential
beneficiaries) indicates that the distribution of benefits from equal sized projects ($1000) is, on average, more
concentrated around a fewer number of individuals in TUUNGANE villages.
We would interpret this as a result against the hypothesis of Capture, suggesting that benefits from public
development projects are more concentrated in the hands of few in TUUNGANE villages than in non TUUNGANE
villages.
0.0
02
.00
4.0
06
.00
8D
en
sity
0 100 200 300 400Amount not verifiable
Social and Economic Impacts of TUUNGANE I | Mock Report 2011 23
Table 22: Proportion of respondents who received transfers from RAPID
Percent of Village
Households Benefiting
Average 70%
Min 25% Max 100% TUUNGANE effect -42** (se) (15) N 8
Note: Based on measure QR 3.
2.5.3 RAPID: Inequality of the distribution of Benefits
What of the overall inequality of distributions, conditional on receipt of some benefits? Given the small sample size,
we focus attention on the dispersion of the benefits. This is best captured by a Gini coefficient, but for interpretation
purposes we will focus on a simple standard deviation.
Table 23 provides the TUUNGANE effect on the mean distance from the mean transfer offered by RAPID. In
particular, it indicates that the mean dispersion in TUUNGANE communities is $3.24 higher than in non-
TUUNGANE communities, suggesting a higher spread, and hence inequality in the distribution of benefits from
RAPID.
Table 23: Mean deviation of benefits distributed
Benefits spread
TUUNGANE effect 3.24
(se) 3.54
N 11
Note: Based on measure QR 3.
2.5.4 RAPID: Dominance of Chief’s Preferences over other villagers’ preferences (Power)
A fundamental measure of capture is the extent to which actual decisions reflect the preferences of different sorts of
villagers. We focus on the dominance of the preferences of the Chief over preferences of a random sample of
villagers. Hence, we produce a measure of power by comparing the stated preferred project realization by the Chief
in a private meeting during our first visit and the actual project realization and comparing the predictive power of the
chiefs preferences to those of the population.
To operationalize the measure, we provide a 0-1 score to each individual, whereby if his ex-ante preferences
coincide with the actual project realization he gets a score of 1, and 0 otherwise. The interpretation in the analysis
will be the probability to successfully have his preferences represented in the project realization. The hypothesis that
TUUNGANE villages will exhibit lower levels of capture of outcomes by the Chief conditional on the villagers should
result in TUUNGANE having a negative effect on the ability of the Chief’s ex ante preferences to “predict” the project
realization over and above the preferences of ordinary citizens.
Table 24 presents first the mean of the binary variable for all villagers, which should be interpreted as the proportion
of villagers (including the chief) for whom the project realization coincides with their stated preferences. The two
columns indicate that we collect the individuals’ preferences at two stages before observing the outcome: before
and after the village meeting, that takes place on the second day of the first visit. We include both points of time is
because these represent very different quantities. During the village discussion, villagers interact and there is
substantive deliberation that may potentially produce agreement. Not taking into account the preferences after the
village meeting risks confounding influence of the chief over power, since the Chief could have greater knowledge of
the village needs and convince the villagers during the meeting.
Social and Economic Impacts of TUUNGANE I | Mock Report 2011 24
While the mean reported in Table 24 includes all villagers interviewed for that question (chief included), the
TUUNGANE effect must be interpreted as the effect of TUUNGANE on the extent to which the Chief preferences
are reflected in the actual project realization at the margin (hence, on top of what the preferences of randomly
selected villagers are reflected in project choice). On average, the preferences of 16% of individuals interviewed
before the group meeting “predicted” the final project choice, increasing to 29% following the group meeting.
Table 24: TUUNGANE effect on Chief dominance†
Relative to Pre Group Meeting
Citizen Preferences Relative to Post Group Meeting
Citizen Preferences
Average 0.16 0.29 TUUNGANE effect -0.11 0.07 (se) (-0.07) (-0.07) N 758 1464
Note: Based on data from AC-17 † (AV-14-bis,B-23).
Social and Economic Impacts of TUUNGANE I | Mock Report 2011 25
3 Results II: Social Cohesion
3.1.1 RAPID: Distribution of benefits across social categories
To test the hypothesis that TUUNGANE improves social cohesion we look at the access of identifiable categories to
benefits available to the communities. Participation in the RAPID process provides a unique opportunity to detect
changes in the access of target social categories to the benefits of the program. This is particularly straightforward
to measure when communities choose to use the RAPID funds for direct distribution of small assets or consumption
goods. Since we collect socio-economic data of a random sample of respondents in RAPID villages (10 per village)
as well as their benefits from the RAPID project, we can measure the impact of TUUNGANE on cohesion by the
difference in per capita amounts received by marginalized social categories (relative to the average amount
received in the village) in TUUNGANE against non-TUUNGANE communities. The difference will be interpreted as
the average treatment effect on the access of those categories to benefits of public projects in their respective
communities.
Table 25 displays the average level of private transfer for the set of 30 respondents for whom we presently have this
data. The average transfer is of $5.50 per household and ranges from $0 to $45.7
Table 25: Distribution of Benefits
Private Benefits
Mean $5.5
Standard Deviation (6.7)
Max 45
Min 0
N 30 Note: Average benefits reported received by respondents
(household) Based on measure QR 3.
Table 26 restricts attention to the migration status of respondents. In particular, it provides the estimated
TUUNGANE effect on the per capita benefit earned by a villager who is not born in the village. Its interpretation is
the number of additional dollars that migrants receive as direct transfers from the RAPID project if they happen to be
in TUUNGANE communities.8
Table 26 presents a coefficient of 0.85, suggesting that migrants in TUUNGANE communities would earn 0.85 more
dollars on average as direct transfer from RAPID than in non- TUUNGANE communities.
Table 26: Distribution of Benefits to Migrants
Migrants
TUUNGANE effect 0.85
(se) 0.1
N 22
Note: Based on measure QR 3, SP 1.
7 Note: In Table 25, we restrict attention to villages where at least one person out of our random sample received anything. This prevents us from considering villages with no clear distribution projects as having a perfectly equal distribution. With large samples, we may be losing villages where, by chance, none of the 10 respondents received anything while in fact they had a distribution project 8 A more precise test would to restrict attention to migrants that arrived before the launch of the TUUNGANE program, since we cannot rule out the possibility that TUUNGANE attracted new migrants of a different type, or changing the patterns of integration of new migrants, while not improving the access to benefits of the rest of migrants. Low sample size prevents us from conducting this analysis in the current report.
Social and Economic Impacts of TUUNGANE I | Mock Report 2011 26
Restricting the analysis to pre-determined categories is only half the story, however. We will incorporate responses
from the survey about which of these categories are most salient at the village level (hence self-reported by the
respondents and also subject to biases) into later analysis and target more accurately relevant categories.
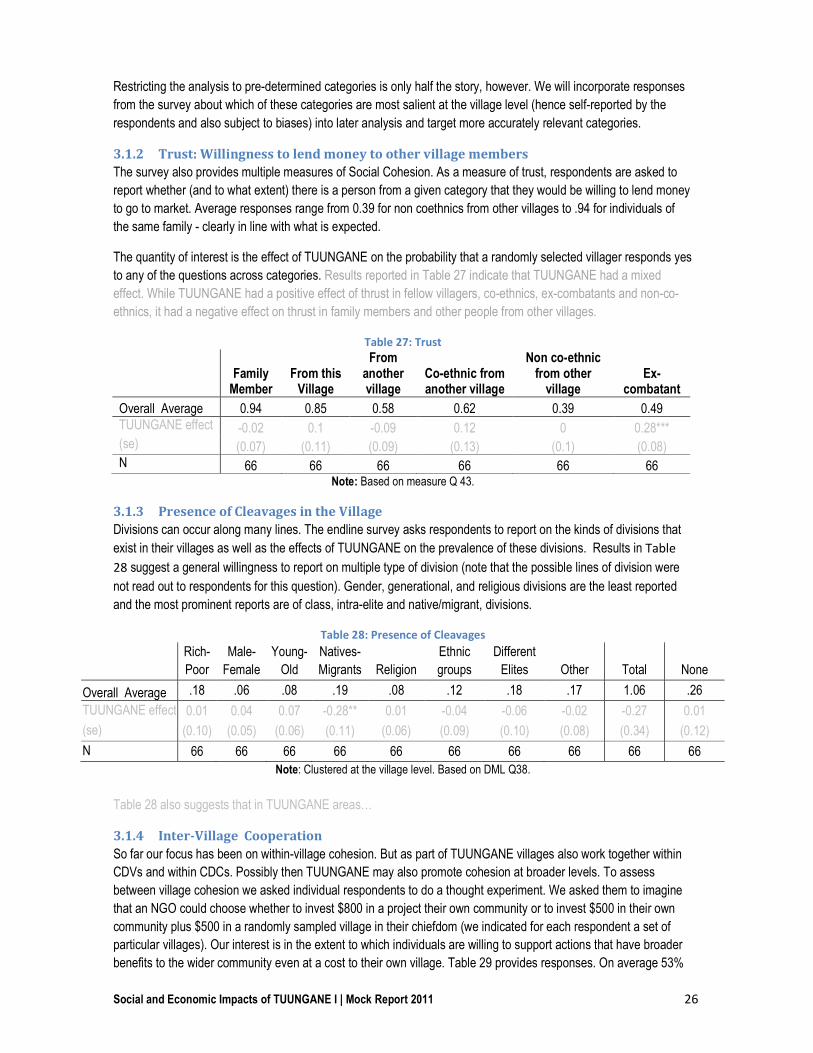
3.1.2 Trust: Willingness to lend money to other village members
The survey also provides multiple measures of Social Cohesion. As a measure of trust, respondents are asked to
report whether (and to what extent) there is a person from a given category that they would be willing to lend money
to go to market. Average responses range from 0.39 for non coethnics from other villages to .94 for individuals of
the same family - clearly in line with what is expected.
The quantity of interest is the effect of TUUNGANE on the probability that a randomly selected villager responds yes
to any of the questions across categories. Results reported in Table 27 indicate that TUUNGANE had a mixed
effect. While TUUNGANE had a positive effect of thrust in fellow villagers, co-ethnics, ex-combatants and non-co-
ethnics, it had a negative effect on thrust in family members and other people from other villages.