Abstract—Today due to rising levels of housing’ necessities, several problems have been raised regarding to urban quality of life. The aim of the research is to study social and spatial aspects of housing environment and to find out their interaction with the urban quality of life. As a case of study two pilot areas of Famagusta city in North Cyprus, were selected: Baykal, considered as an established urban district and Tuzla, a newly developed peri-urban district. In order to determine urban quality of life in planning and developing of housing areas, social and spatial aspects of selected areas have been examined, differences between them according to the planning policy have been pointed out, advantages and disadvantages of housing planning have been found. As a practical implementation of the research a number of households in each selected area have been interviewed in order to draw a conclusion. Keywords—housing development, Famagusta, quality of life, social and spatial aspects. I. INTRODUCTION VERY country and city faces several housing shortages and increase in the stun of housing would be valuable in each of them. The decision whether or not new structures should be built in each case, in each city should not be made on the basis of how much money can be earned from residential development. Instead, planning a new building in a particular area should commence by considering the quality of the local people’s life. In other words, the decision of land use will not be determined by commercial market forces, but rather be a public policy decision [1]. Today due to rising levels of housing’ necessities, several problems have been raised regarding to urban quality of life. Housing development and its environment is the reflection of the socio-cultural and economical characteristics of the L. Cazacova is with the Department of Architecture and Interior Architecture, European University of Lefke, North Cyprus, phone +90 542 881 1268 , (e-mail: [email protected]) A. Erdelhun is with the Department of Architecture and Interior Architecture, European University of Lefke, North Cyprus, (e-mail: [email protected]) A. M. Saymanlier is with the Department of Architecture and Interior Architecture, European University of Lefke, North Cyprus, (e-mail: [email protected]) N. Cazacova is with the School of Tourism Management and Information Sciences, European university of Lefke, North Cyprus, (e-mail: [email protected]) U. Ulbar is with the Department of Architecture and Interior Architecture, European University of Lefke, North Cyprus, (e-mail: [email protected]) society. However, in most of the cases these environments do not suit residents and do not provide the expected quality of life, both for private areas - houses and public places in their neighborhood. During the new district planning process it is significant to consider the role of the residents in the process in order to be able to meet their expectations and desires. The aim of the following research is to study spatial aspects of housing environment and to find out their interaction with the urban quality of life. As a case of study two pilot areas of Famagusta city, in North Cyprus were selected: Baykal, considered as an established urban district and Tuzla and a newly developed peri-urban district. In order to determine urban quality of life in planning and developing of housing areas, social and spatial aspects of selected areas have been examined. The differences between two districts according to the planning policy have been pointed out, as well as advantages and disadvantages of housing planning have been found. As a practical implementation of the research a number of residents in each selected area have been interviewed in order to draw a conclusion. II. IMPLEMENTATIONS The residential environment is composed of physical and social elements, residents’ lifestyles and experiences. The characteristics of the residential environment are reflected by the relational structure among these elements [2]. In the housing areas, rewarding user needs is an obligatory issue. Two basic desires, which have to be considered, are: psychological and physical needs. One hundred inhabitants from each selected area have been questioned with the aim to obtain and analyze the social and spatial characteristics of both neighborhoods, in order to compare them, and find the advantages and disadvantages in selected districts’ urban planning and quality of life. The results of the questionnaires were evaluated through SPSS in order to get statistical and concrete numerical outputs. III. SOCIAL ASPECTS EXAMINATION A. Age Group The definitions of inhabitants special needs differ according to their age, marital status, and number of family members, education, occupation and even nationality [3]. Social and Spatial Aspects of Housing Development Affecting Urban Quality of Life - the Case of Famagusta L. Cazacova, A. Erdelhun, A.M. Saymanlier, N. Cazacova, U. Ulbar E World Academy of Science, Engineering and Technology International Journal of Humanities and Social Sciences Vol:4, No:6, 2010 1016 International Scholarly and Scientific Research & Innovation 4(6) 2010 Digital Open Science Index, Humanities and Social Sciences Vol:4, No:6, 2010 waset.org/Publication/8077
Transcript
Abstract—Today due to rising levels of housing’ necessities,
several problems have been raised regarding to urban quality of life. The aim of the research is to study social and spatial aspects of housing environment and to find out their interaction with the urban quality of life. As a case of study two pilot areas of Famagusta city in North Cyprus, were selected: Baykal, considered as an established urban district and Tuzla, a newly developed peri-urban district. In order to determine urban quality of life in planning and developing of housing areas, social and spatial aspects of selected areas have been examined, differences between them according to the planning policy have been pointed out, advantages and disadvantages of housing planning have been found. As a practical implementation of the research a number of households in each selected area have been interviewed in order to draw a conclusion.
Keywords—housing development, Famagusta, quality of life, social and spatial aspects.
I. INTRODUCTION VERY country and city faces several housing shortages and increase in the stun of housing would be valuable in each of them. The decision whether or not new structures
should be built in each case, in each city should not be made on the basis of how much money can be earned from residential development. Instead, planning a new building in a particular area should commence by considering the quality of the local people’s life. In other words, the decision of land use will not be determined by commercial market forces, but rather be a public policy decision [1].
Today due to rising levels of housing’ necessities, several problems have been raised regarding to urban quality of life. Housing development and its environment is the reflection of the socio-cultural and economical characteristics of the
L. Cazacova is with the Department of Architecture and Interior
Architecture, European University of Lefke, North Cyprus, phone +90 542 881 1268 , (e-mail: [email protected])
A. Erdelhun is with the Department of Architecture and Interior Architecture, European University of Lefke, North Cyprus, (e-mail: [email protected])
A. M. Saymanlier is with the Department of Architecture and Interior Architecture, European University of Lefke, North Cyprus, (e-mail: [email protected])
N. Cazacova is with the School of Tourism Management and Information Sciences, European university of Lefke, North Cyprus, (e-mail: [email protected])
U. Ulbar is with the Department of Architecture and Interior Architecture, European University of Lefke, North Cyprus, (e-mail: [email protected])
society. However, in most of the cases these environments do not suit residents and do not provide the expected quality of life, both for private areas - houses and public places in their neighborhood. During the new district planning process it is significant to consider the role of the residents in the process in order to be able to meet their expectations and desires. The aim of the following research is to study spatial aspects of housing environment and to find out their interaction with the urban quality of life. As a case of study two pilot areas of Famagusta city, in North Cyprus were selected: Baykal, considered as an established urban district and Tuzla and a newly developed peri-urban district. In order to determine urban quality of life in planning and developing of housing areas, social and spatial aspects of selected areas have been examined. The differences between two districts according to the planning policy have been pointed out, as well as advantages and disadvantages of housing planning have been found. As a practical implementation of the research a number of residents in each selected area have been interviewed in order to draw a conclusion.
II. IMPLEMENTATIONS The residential environment is composed of physical and social elements, residents’ lifestyles and experiences. The characteristics of the residential environment are reflected by the relational structure among these elements [2].
In the housing areas, rewarding user needs is an obligatory issue. Two basic desires, which have to be considered, are: psychological and physical needs. One hundred inhabitants from each selected area have been questioned with the aim to obtain and analyze the social and spatial characteristics of both neighborhoods, in order to compare them, and find the advantages and disadvantages in selected districts’ urban planning and quality of life. The results of the questionnaires were evaluated through SPSS in order to get statistical and concrete numerical outputs.
III. SOCIAL ASPECTS EXAMINATION
A. Age Group The definitions of inhabitants special needs differ according to their age, marital status, and number of family members, education, occupation and even nationality [3].
Social and Spatial Aspects of Housing Development Affecting Urban Quality of Life -
the Case of Famagusta L. Cazacova, A. Erdelhun, A.M. Saymanlier, N. Cazacova, U. Ulbar
E
World Academy of Science, Engineering and TechnologyInternational Journal of Humanities and Social Sciences
Vol:4, No:6, 2010
1016International Scholarly and Scientific Research & Innovation 4(6) 2010
Dig
ital O
pen
Scie
nce
Inde
x, H
uman
ities
and
Soc
ial S
cien
ces
Vol
:4, N
o:6,
201
0 w
aset
.org
/Pub
licat
ion/
8077
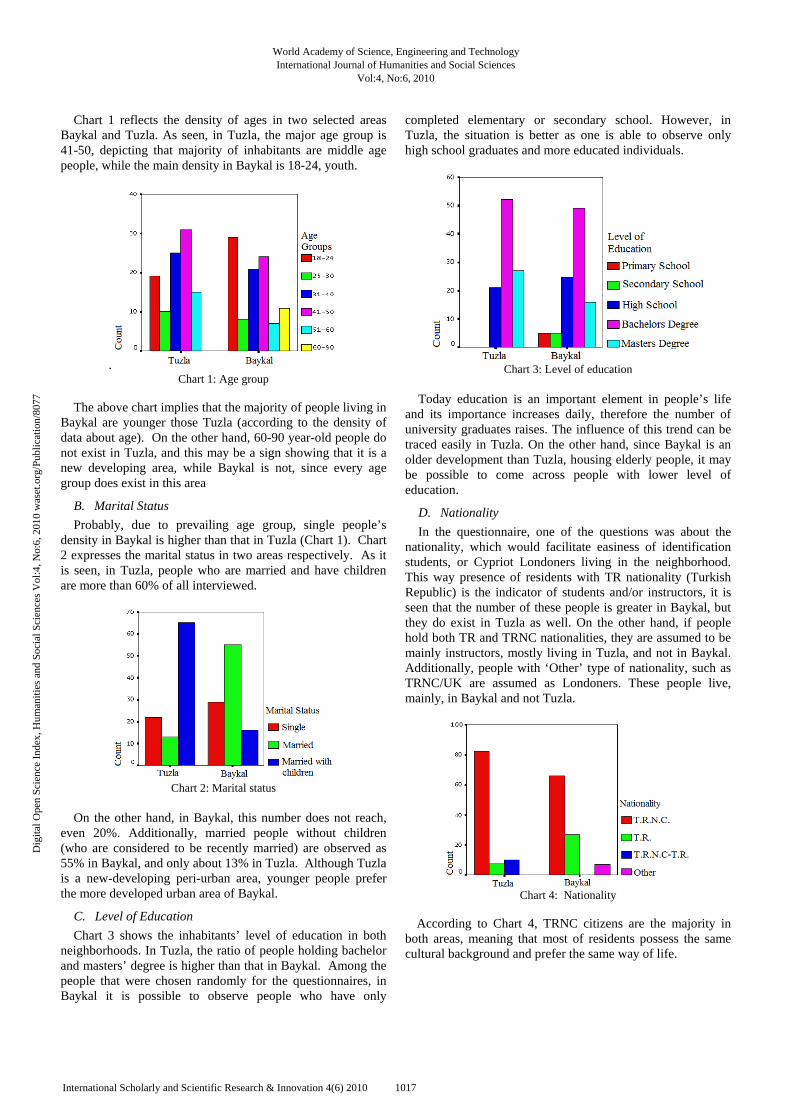
Chart 1 reflects the density of ages in two selected areas Baykal and Tuzla. As seen, in Tuzla, the major age group is 41-50, depicting that majority of inhabitants are middle age people, while the main density in Baykal is 18-24, youth.
. Chart 1: Age group
The above chart implies that the majority of people living in Baykal are younger those Tuzla (according to the density of data about age). On the other hand, 60-90 year-old people do not exist in Tuzla, and this may be a sign showing that it is a new developing area, while Baykal is not, since every age group does exist in this area
B. Marital Status Probably, due to prevailing age group, single people’s
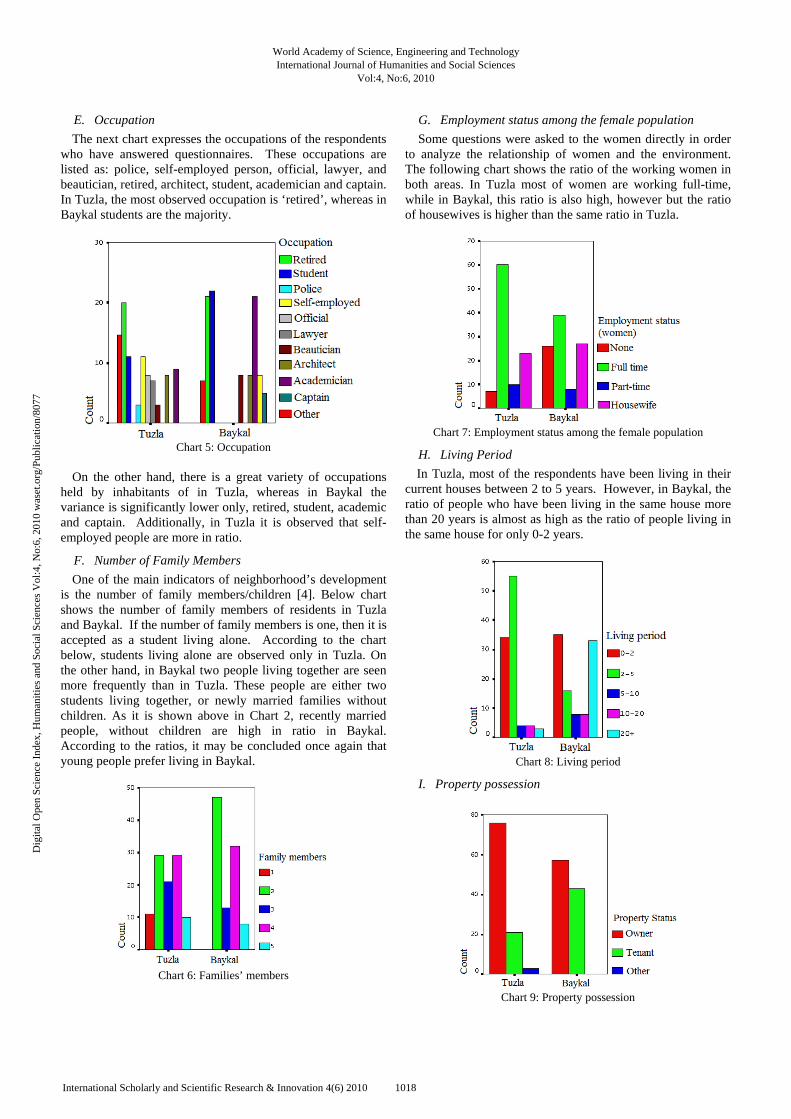
density in Baykal is higher than that in Tuzla (Chart 1). Chart 2 expresses the marital status in two areas respectively. As it is seen, in Tuzla, people who are married and have children are more than 60% of all interviewed.
Chart 2: Marital status
On the other hand, in Baykal, this number does not reach,
even 20%. Additionally, married people without children (who are considered to be recently married) are observed as 55% in Baykal, and only about 13% in Tuzla. Although Tuzla is a new-developing peri-urban area, younger people prefer the more developed urban area of Baykal.
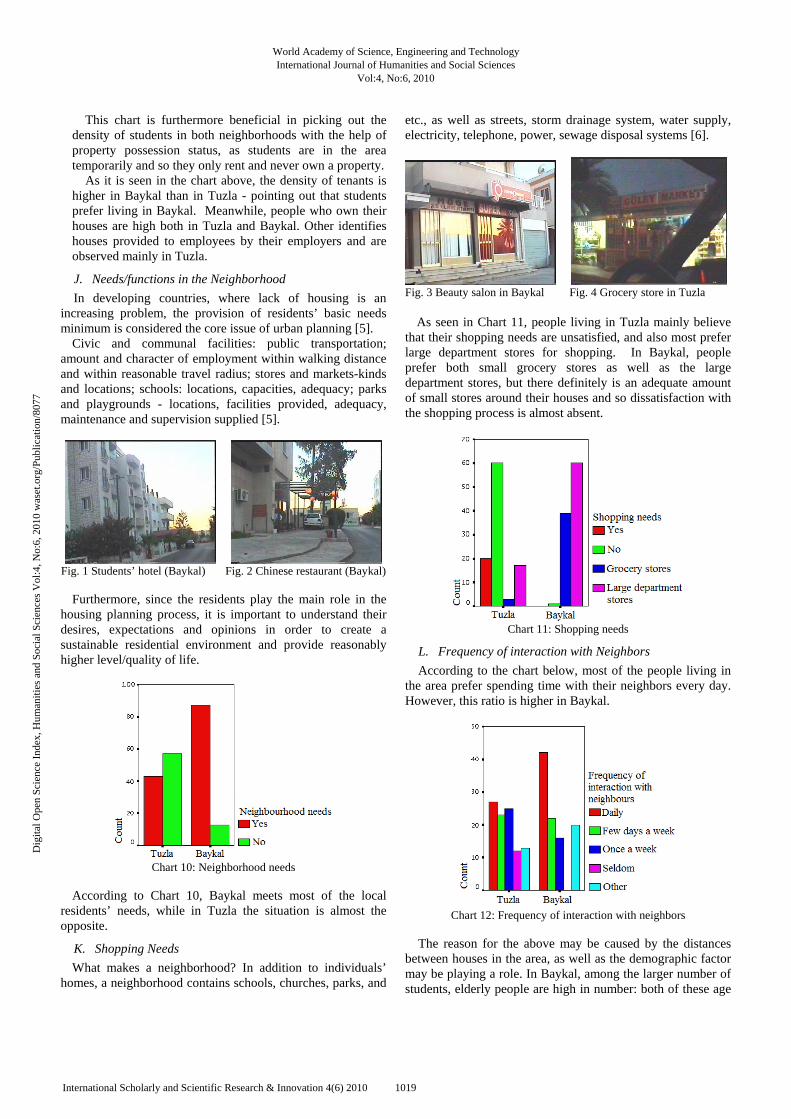
C. Level of Education Chart 3 shows the inhabitants’ level of education in both neighborhoods. In Tuzla, the ratio of people holding bachelor and masters’ degree is higher than that in Baykal. Among the people that were chosen randomly for the questionnaires, in Baykal it is possible to observe people who have only
completed elementary or secondary school. However, in Tuzla, the situation is better as one is able to observe only high school graduates and more educated individuals.
Chart 3: Level of education
Today education is an important element in people’s life and its importance increases daily, therefore the number of university graduates raises. The influence of this trend can be traced easily in Tuzla. On the other hand, since Baykal is an older development than Tuzla, housing elderly people, it may be possible to come across people with lower level of education.
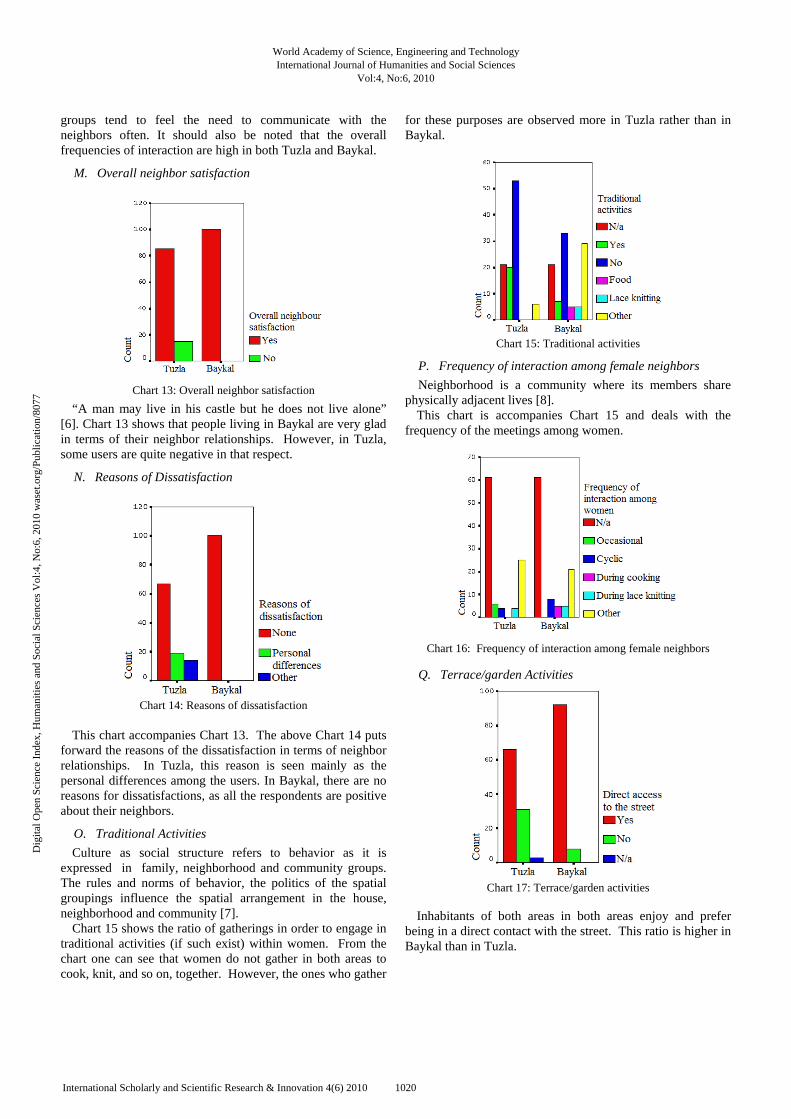
D. Nationality In the questionnaire, one of the questions was about the nationality, which would facilitate easiness of identification students, or Cypriot Londoners living in the neighborhood. This way presence of residents with TR nationality (Turkish Republic) is the indicator of students and/or instructors, it is seen that the number of these people is greater in Baykal, but they do exist in Tuzla as well. On the other hand, if people hold both TR and TRNC nationalities, they are assumed to be mainly instructors, mostly living in Tuzla, and not in Baykal. Additionally, people with ‘Other’ type of nationality, such as TRNC/UK are assumed as Londoners. These people live, mainly, in Baykal and not Tuzla.
Chart 4: Nationality
According to Chart 4, TRNC citizens are the majority in both areas, meaning that most of residents possess the same cultural background and prefer the same way of life.
World Academy of Science, Engineering and TechnologyInternational Journal of Humanities and Social Sciences
Vol:4, No:6, 2010
1017International Scholarly and Scientific Research & Innovation 4(6) 2010
Dig
ital O
pen
Scie
nce
Inde
x, H
uman
ities
and
Soc
ial S
cien
ces
Vol
:4, N
o:6,
201
0 w
aset
.org
/Pub
licat
ion/
8077
E. Occupation The next chart expresses the occupations of the respondents who have answered questionnaires. These occupations are listed as: police, self-employed person, official, lawyer, and beautician, retired, architect, student, academician and captain. In Tuzla, the most observed occupation is ‘retired’, whereas in Baykal students are the majority.
Chart 5: Occupation
On the other hand, there is a great variety of occupations held by inhabitants of in Tuzla, whereas in Baykal the variance is significantly lower only, retired, student, academic and captain. Additionally, in Tuzla it is observed that self-employed people are more in ratio.
F. Number of Family Members One of the main indicators of neighborhood’s development is the number of family members/children [4]. Below chart shows the number of family members of residents in Tuzla and Baykal. If the number of family members is one, then it is accepted as a student living alone. According to the chart below, students living alone are observed only in Tuzla. On the other hand, in Baykal two people living together are seen more frequently than in Tuzla. These people are either two students living together, or newly married families without children. As it is shown above in Chart 2, recently married people, without children are high in ratio in Baykal. According to the ratios, it may be concluded once again that young people prefer living in Baykal.
Chart 6: Families’ members
G. Employment status among the female population Some questions were asked to the women directly in order
to analyze the relationship of women and the environment. The following chart shows the ratio of the working women in both areas. In Tuzla most of women are working full-time, while in Baykal, this ratio is also high, however but the ratio of housewives is higher than the same ratio in Tuzla.
Chart 7: Employment status among the female population
H. Living Period In Tuzla, most of the respondents have been living in their current houses between 2 to 5 years. However, in Baykal, the ratio of people who have been living in the same house more than 20 years is almost as high as the ratio of people living in the same house for only 0-2 years.
Chart 8: Living period
I. Property possession
Chart 9: Property possession
World Academy of Science, Engineering and TechnologyInternational Journal of Humanities and Social Sciences
Vol:4, No:6, 2010
1018International Scholarly and Scientific Research & Innovation 4(6) 2010
Dig
ital O
pen
Scie
nce
Inde
x, H
uman
ities
and
Soc
ial S
cien
ces
Vol
:4, N
o:6,
201
0 w
aset
.org
/Pub
licat
ion/
8077
This chart is furthermore beneficial in picking out the density of students in both neighborhoods with the help of property possession status, as students are in the area temporarily and so they only rent and never own a property. As it is seen in the chart above, the density of tenants is higher in Baykal than in Tuzla - pointing out that students prefer living in Baykal. Meanwhile, people who own their houses are high both in Tuzla and Baykal. Other identifies houses provided to employees by their employers and are observed mainly in Tuzla.
J. Needs/functions in the Neighborhood In developing countries, where lack of housing is an
increasing problem, the provision of residents’ basic needs minimum is considered the core issue of urban planning [5]. Civic and communal facilities: public transportation; amount and character of employment within walking distance and within reasonable travel radius; stores and markets-kinds and locations; schools: locations, capacities, adequacy; parks and playgrounds - locations, facilities provided, adequacy, maintenance and supervision supplied [5].
Fig. 1 Students’ hotel (Baykal) Fig. 2 Chinese restaurant (Baykal) Furthermore, since the residents play the main role in the housing planning process, it is important to understand their desires, expectations and opinions in order to create a sustainable residential environment and provide reasonably higher level/quality of life.
Chart 10: Neighborhood needs
According to Chart 10, Baykal meets most of the local residents’ needs, while in Tuzla the situation is almost the opposite.
K. Shopping Needs What makes a neighborhood? In addition to individuals’ homes, a neighborhood contains schools, churches, parks, and
etc., as well as streets, storm drainage system, water supply, electricity, telephone, power, sewage disposal systems [6].
Fig. 3 Beauty salon in Baykal Fig. 4 Grocery store in Tuzla As seen in Chart 11, people living in Tuzla mainly believe that their shopping needs are unsatisfied, and also most prefer large department stores for shopping. In Baykal, people prefer both small grocery stores as well as the large department stores, but there definitely is an adequate amount of small stores around their houses and so dissatisfaction with the shopping process is almost absent.
Chart 11: Shopping needs
L. Frequency of interaction with Neighbors According to the chart below, most of the people living in
the area prefer spending time with their neighbors every day. However, this ratio is higher in Baykal.
Chart 12: Frequency of interaction with neighbors
The reason for the above may be caused by the distances
between houses in the area, as well as the demographic factor may be playing a role. In Baykal, among the larger number of students, elderly people are high in number: both of these age
World Academy of Science, Engineering and TechnologyInternational Journal of Humanities and Social Sciences
Vol:4, No:6, 2010
1019International Scholarly and Scientific Research & Innovation 4(6) 2010
Dig
ital O
pen
Scie
nce
Inde
x, H
uman
ities
and
Soc
ial S
cien
ces
Vol
:4, N
o:6,
201
0 w
aset
.org
/Pub
licat
ion/
8077
groups tend to feel the need to communicate with the neighbors often. It should also be noted that the overall frequencies of interaction are high in both Tuzla and Baykal.
M. Overall neighbor satisfaction
Chart 13: Overall neighbor satisfaction
“A man may live in his castle but he does not live alone” [6]. Chart 13 shows that people living in Baykal are very glad in terms of their neighbor relationships. However, in Tuzla, some users are quite negative in that respect.
N. Reasons of Dissatisfaction
Chart 14: Reasons of dissatisfaction
This chart accompanies Chart 13. The above Chart 14 puts forward the reasons of the dissatisfaction in terms of neighbor relationships. In Tuzla, this reason is seen mainly as the personal differences among the users. In Baykal, there are no reasons for dissatisfactions, as all the respondents are positive about their neighbors.
O. Traditional Activities Culture as social structure refers to behavior as it is expressed in family, neighborhood and community groups. The rules and norms of behavior, the politics of the spatial groupings influence the spatial arrangement in the house, neighborhood and community [7]. Chart 15 shows the ratio of gatherings in order to engage in traditional activities (if such exist) within women. From the chart one can see that women do not gather in both areas to cook, knit, and so on, together. However, the ones who gather
for these purposes are observed more in Tuzla rather than in Baykal.
Chart 15: Traditional activities
P. Frequency of interaction among female neighbors Neighborhood is a community where its members share
physically adjacent lives [8]. This chart is accompanies Chart 15 and deals with the frequency of the meetings among women.
Chart 16: Frequency of interaction among female neighbors
Q. Terrace/garden Activities
Chart 17: Terrace/garden activities
Inhabitants of both areas in both areas enjoy and prefer being in a direct contact with the street. This ratio is higher in Baykal than in Tuzla.
World Academy of Science, Engineering and TechnologyInternational Journal of Humanities and Social Sciences
Vol:4, No:6, 2010
1020International Scholarly and Scientific Research & Innovation 4(6) 2010
Dig
ital O
pen
Scie
nce
Inde
x, H
uman
ities
and
Soc
ial S
cien
ces
Vol
:4, N
o:6,
201
0 w
aset
.org
/Pub
licat
ion/
8077
R. Games preferred by children, living in the areas Below chart puts forward the types of games that children enjoy in the selected towns. In both areas, children rather prefer to play outdoor games, however this ratio is higher in Tuzla than Baykal. Answer “N/a” refers to the respondents who do not have children living with them.
Chart 18: Games prefered by local children
S. Potential Interaction among children We argue that ‘a city for all’ should include sensitivities to children both as a social group, with all its complexities, and to children as individuals. A key part of these sensitivities involves understanding city life from children’s perspectives. We need to know how they see the city in order to reform the city within children-sensitive framework [9]. In both areas, children can find the possibility to set up a group of friends among themselves.
Chart 19: Potential interaction among children
T. Neighbor Relations Generally people desire living in neighborhoods that are attractive, safe, healthy, unpolluted, with high quality local facilities, access to green space, and excellent connections to other areas [10].
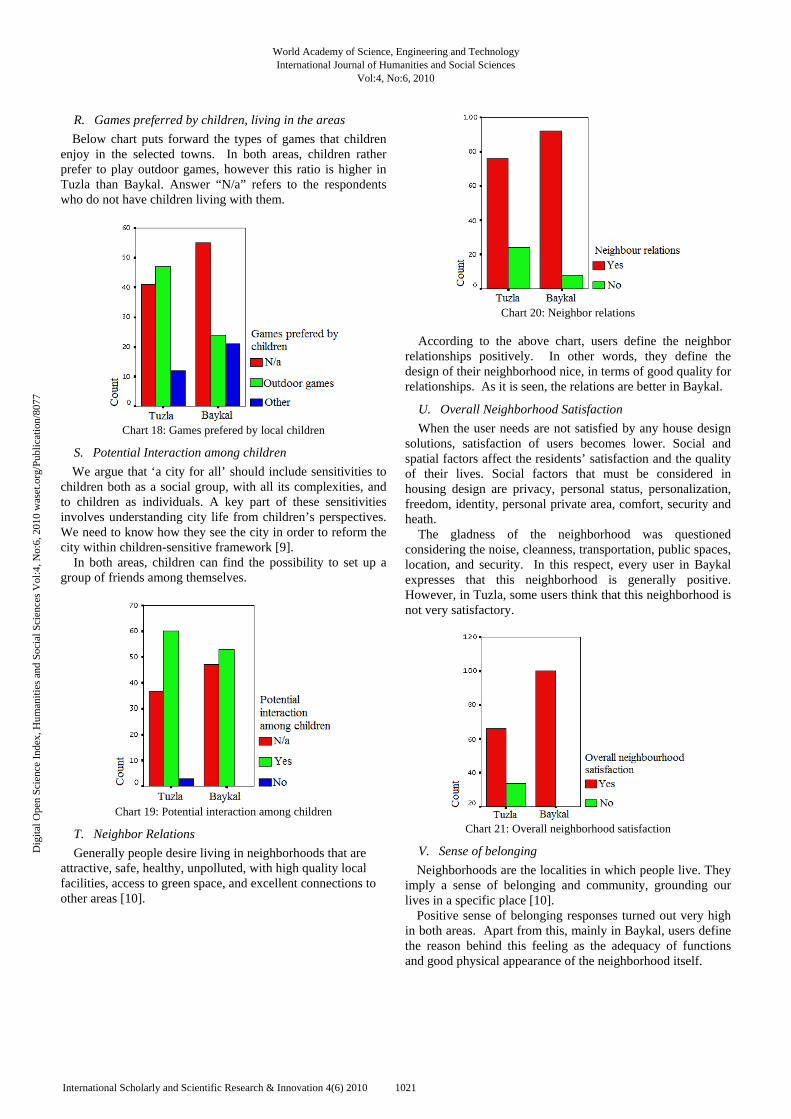
Chart 20: Neighbor relations
According to the above chart, users define the neighbor relationships positively. In other words, they define the design of their neighborhood nice, in terms of good quality for relationships. As it is seen, the relations are better in Baykal.
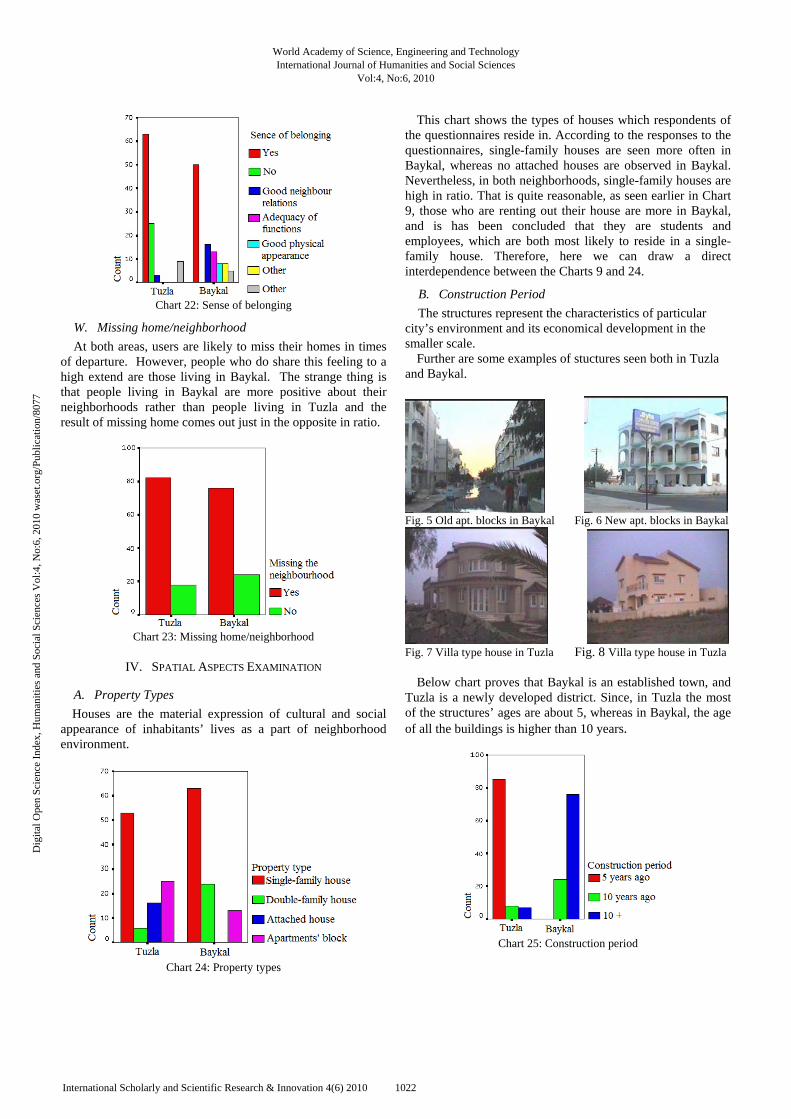
U. Overall Neighborhood Satisfaction When the user needs are not satisfied by any house design solutions, satisfaction of users becomes lower. Social and spatial factors affect the residents’ satisfaction and the quality of their lives. Social factors that must be considered in housing design are privacy, personal status, personalization, freedom, identity, personal private area, comfort, security and heath. The gladness of the neighborhood was questioned considering the noise, cleanness, transportation, public spaces, location, and security. In this respect, every user in Baykal expresses that this neighborhood is generally positive. However, in Tuzla, some users think that this neighborhood is not very satisfactory.
Chart 21: Overall neighborhood satisfaction
V. Sense of belonging Neighborhoods are the localities in which people live. They imply a sense of belonging and community, grounding our lives in a specific place [10]. Positive sense of belonging responses turned out very high in both areas. Apart from this, mainly in Baykal, users define the reason behind this feeling as the adequacy of functions and good physical appearance of the neighborhood itself.
World Academy of Science, Engineering and TechnologyInternational Journal of Humanities and Social Sciences
Vol:4, No:6, 2010
1021International Scholarly and Scientific Research & Innovation 4(6) 2010
Dig
ital O
pen
Scie
nce
Inde
x, H
uman
ities
and
Soc
ial S
cien
ces
Vol
:4, N
o:6,
201
0 w
aset
.org
/Pub
licat
ion/
8077
Chart 22: Sense of belonging
W. Missing home/neighborhood At both areas, users are likely to miss their homes in times of departure. However, people who do share this feeling to a high extend are those living in Baykal. The strange thing is that people living in Baykal are more positive about their neighborhoods rather than people living in Tuzla and the result of missing home comes out just in the opposite in ratio.
Chart 23: Missing home/neighborhood
IV. SPATIAL ASPECTS EXAMINATION
A. Property Types Houses are the material expression of cultural and social appearance of inhabitants’ lives as a part of neighborhood environment.
Chart 24: Property types
This chart shows the types of houses which respondents of the questionnaires reside in. According to the responses to the questionnaires, single-family houses are seen more often in Baykal, whereas no attached houses are observed in Baykal. Nevertheless, in both neighborhoods, single-family houses are high in ratio. That is quite reasonable, as seen earlier in Chart 9, those who are renting out their house are more in Baykal, and is has been concluded that they are students and employees, which are both most likely to reside in a single-family house. Therefore, here we can draw a direct interdependence between the Charts 9 and 24.
B. Construction Period The structures represent the characteristics of particular
city’s environment and its economical development in the smaller scale. Further are some examples of stuctures seen both in Tuzla and Baykal.
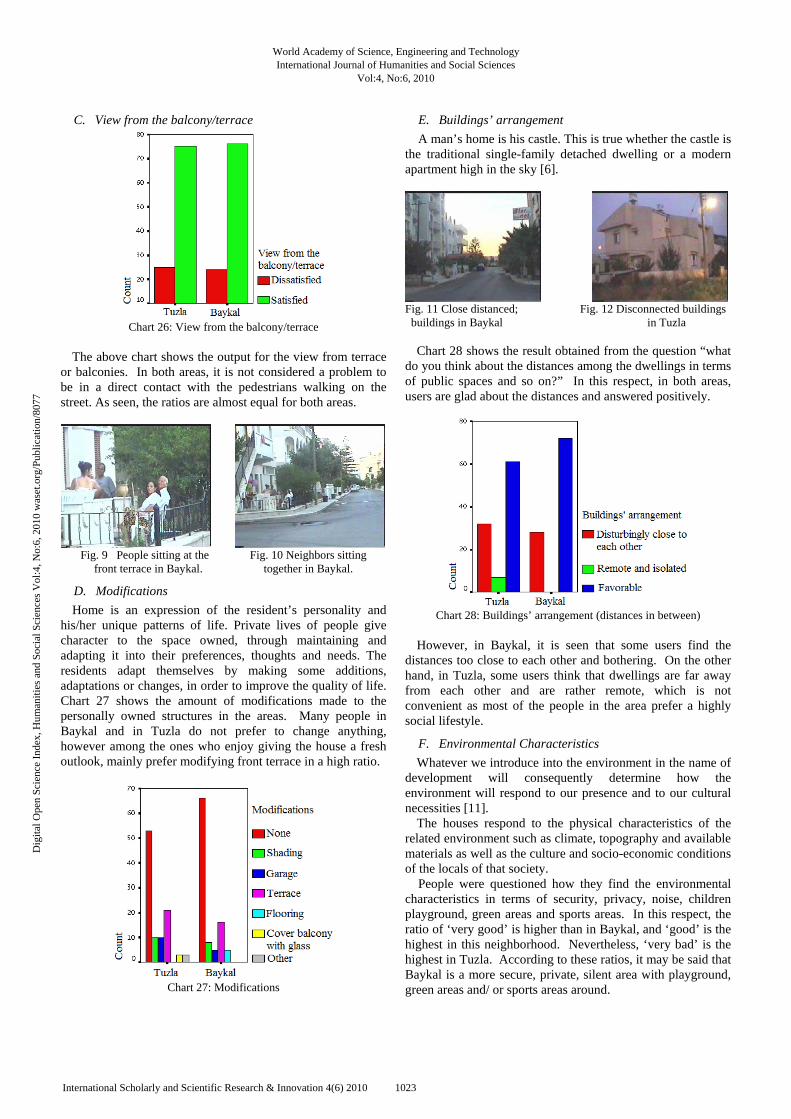
Fig. 5 Old apt. blocks in Baykal Fig. 6 New apt. blocks in Baykal
Fig. 7 Villa type house in Tuzla Fig. 8 Villa type house in Tuzla Below chart proves that Baykal is an established town, and Tuzla is a newly developed district. Since, in Tuzla the most of the structures’ ages are about 5, whereas in Baykal, the age of all the buildings is higher than 10 years.
Chart 25: Construction period
World Academy of Science, Engineering and TechnologyInternational Journal of Humanities and Social Sciences
Vol:4, No:6, 2010
1022International Scholarly and Scientific Research & Innovation 4(6) 2010
Dig
ital O
pen
Scie
nce
Inde
x, H
uman
ities
and
Soc
ial S
cien
ces
Vol
:4, N
o:6,
201
0 w
aset
.org
/Pub
licat
ion/
8077
C. View from the balcony/terrace
Chart 26: View from the balcony/terrace
The above chart shows the output for the view from terrace or balconies. In both areas, it is not considered a problem to be in a direct contact with the pedestrians walking on the street. As seen, the ratios are almost equal for both areas.
Fig. 9 People sitting at the Fig. 10 Neighbors sitting
front terrace in Baykal. together in Baykal.
D. Modifications Home is an expression of the resident’s personality and his/her unique patterns of life. Private lives of people give character to the space owned, through maintaining and adapting it into their preferences, thoughts and needs. The residents adapt themselves by making some additions, adaptations or changes, in order to improve the quality of life. Chart 27 shows the amount of modifications made to the personally owned structures in the areas. Many people in Baykal and in Tuzla do not prefer to change anything, however among the ones who enjoy giving the house a fresh outlook, mainly prefer modifying front terrace in a high ratio.
Chart 27: Modifications
E. Buildings’ arrangement A man’s home is his castle. This is true whether the castle is
the traditional single-family detached dwelling or a modern apartment high in the sky [6].
Fig. 11 Close distanced; Fig. 12 Disconnected buildings buildings in Baykal in Tuzla Chart 28 shows the result obtained from the question “what do you think about the distances among the dwellings in terms of public spaces and so on?” In this respect, in both areas, users are glad about the distances and answered positively.
Chart 28: Buildings’ arrangement (distances in between)
However, in Baykal, it is seen that some users find the distances too close to each other and bothering. On the other hand, in Tuzla, some users think that dwellings are far away from each other and are rather remote, which is not convenient as most of the people in the area prefer a highly social lifestyle.
F. Environmental Characteristics Whatever we introduce into the environment in the name of development will consequently determine how the environment will respond to our presence and to our cultural necessities [11]. The houses respond to the physical characteristics of the related environment such as climate, topography and available materials as well as the culture and socio-economic conditions of the locals of that society. People were questioned how they find the environmental characteristics in terms of security, privacy, noise, children playground, green areas and sports areas. In this respect, the ratio of ‘very good’ is higher than in Baykal, and ‘good’ is the highest in this neighborhood. Nevertheless, ‘very bad’ is the highest in Tuzla. According to these ratios, it may be said that Baykal is a more secure, private, silent area with playground, green areas and/ or sports areas around.
World Academy of Science, Engineering and TechnologyInternational Journal of Humanities and Social Sciences
Vol:4, No:6, 2010
1023International Scholarly and Scientific Research & Innovation 4(6) 2010
Dig
ital O
pen
Scie
nce
Inde
x, H
uman
ities
and
Soc
ial S
cien
ces
Vol
:4, N
o:6,
201
0 w
aset
.org
/Pub
licat
ion/
8077
Chart 29: Environmental characteristics
G. Common Use Area Since the mid-fifties there has been a growing interest in recreation, conservation, open space, beautification, pollution abatement, and a myriad of other ways to improve the “quality of the environment” [12]. In Tuzla, common public spaces do not exist and a higher ratio of people emphasizes this downfall of the neighborhood. On the other hand, in Baykal, the situation is different.
Chart 30: Common use area
H. Frequency of Open Common Spaces’ Use From the previous chart it is known that in Tuzla open public spaces do not exist.
Chart 31: Frequency of Open Common Spaces’ Use However, in Baykal such spaces are available; people prefer enjoying their time outdoor mostly one or two times a week.
I. Common Areas’ Solutions For convenience of day-to-day living and involvement in
local affairs there must be easy access to post office, bank, building society, shops, health centre, church, community centre, library, adult education, and leisure facilities generally. Leisure facilities can range from passive pursuits such as cinema and theatre to active participation in swimming, bowls, golf etc [13].
Chart 32: Common Areas’ solutions
In Tuzla, the solutions for common public spaces are said to be average, mainly. However, in Baykal, they are accepted as good. Meanwhile, some users think that these spaces are designed positively and no one seems to be dissatisfied. Briefly, the common areas’ solution is more satisfying in Baykal than in Tuzla.
J. Interaction with neighbors Some people prefer spending more time at home, while
others enjoy socializing with neighbors to feel emotionally attached to their communities [14].
Respondents were questioned where they rather prefer to spend time with their neighbors during summer time. As a result of the interviews, it has been determined that the favorite place is the front gate/terrace and then the balconies. In this way, it is understood that users prefer direct contacts with their surroundings.
World Academy of Science, Engineering and TechnologyInternational Journal of Humanities and Social Sciences
Vol:4, No:6, 2010
1024International Scholarly and Scientific Research & Innovation 4(6) 2010
Dig
ital O
pen
Scie
nce
Inde
x, H
uman
ities
and
Soc
ial S
cien
ces
Vol
:4, N
o:6,
201
0 w
aset
.org
/Pub
licat
ion/
8077
Chart 33: Interaction with neighbors
K. Children’s Playground Behavioral, social, emotional, and physical development of a child depends on the ability of the child’s family to provide an appropriate home environment as well as on a correct neighborhood environment [15].
Fig. 13 Children playground Fig. 14 Children gathering
together in Baykal in the street in Tuzla. Questions regarding children’s play areas were asked as well. In this respect, children in Tuzla mostly prefer playing outdoors, even on the streets. However, children in Baykal mostly prefer to play indoors and specially designated children’s playground.
Chart 34: Children’s playground
L. Private vehicle ownership The number of cars available in each family was asked as well. According to the chart below, many families in both areas own two vehicles.
Chart 35: Private vehicle ownership
Only a small number of people living in Baykal (presumably students) do not possess a car. On the other hand, a little amount of people living in Tuzla do have more than three cars.
M. Parking Space Availability According to this chart, the number of car-parks is adequate
in Tuzla, whereas it is vice versa in Baykal.
Fig. 15 Car parking at the street Fig. 16 Baykal street
in Baykal
Chart 36: Parking Space Availability
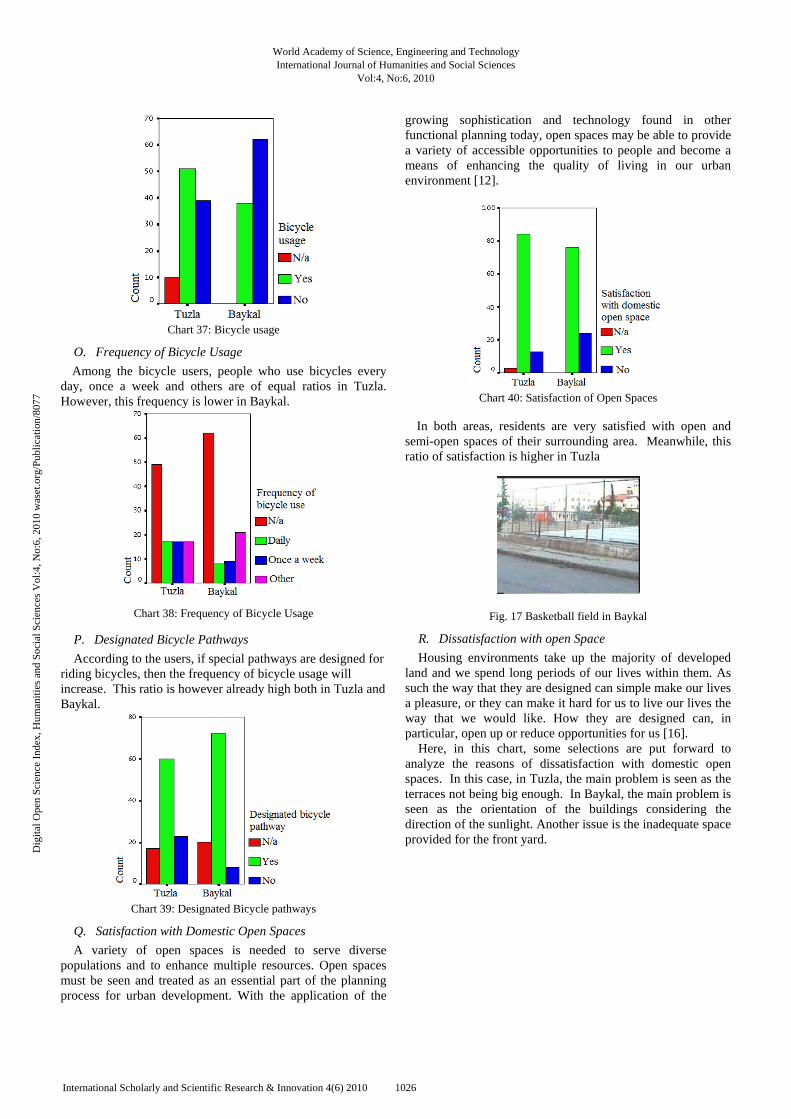
N. Bicycle Usage According to Chart 37, many people living in Tuzla prefer
to use bicycle, which is opposite in Baykal.
World Academy of Science, Engineering and TechnologyInternational Journal of Humanities and Social Sciences
Vol:4, No:6, 2010
1025International Scholarly and Scientific Research & Innovation 4(6) 2010
Dig
ital O
pen
Scie
nce
Inde
x, H
uman
ities
and
Soc
ial S
cien
ces
Vol
:4, N
o:6,
201
0 w
aset
.org
/Pub
licat
ion/
8077
Chart 37: Bicycle usage
O. Frequency of Bicycle Usage Among the bicycle users, people who use bicycles every day, once a week and others are of equal ratios in Tuzla. However, this frequency is lower in Baykal.
Chart 38: Frequency of Bicycle Usage
P. Designated Bicycle Pathways According to the users, if special pathways are designed for riding bicycles, then the frequency of bicycle usage will increase. This ratio is however already high both in Tuzla and Baykal.
Chart 39: Designated Bicycle pathways
Q. Satisfaction with Domestic Open Spaces A variety of open spaces is needed to serve diverse
populations and to enhance multiple resources. Open spaces must be seen and treated as an essential part of the planning process for urban development. With the application of the
growing sophistication and technology found in other functional planning today, open spaces may be able to provide a variety of accessible opportunities to people and become a means of enhancing the quality of living in our urban environment [12].
Chart 40: Satisfaction of Open Spaces
In both areas, residents are very satisfied with open and semi-open spaces of their surrounding area. Meanwhile, this ratio of satisfaction is higher in Tuzla
Fig. 17 Basketball field in Baykal
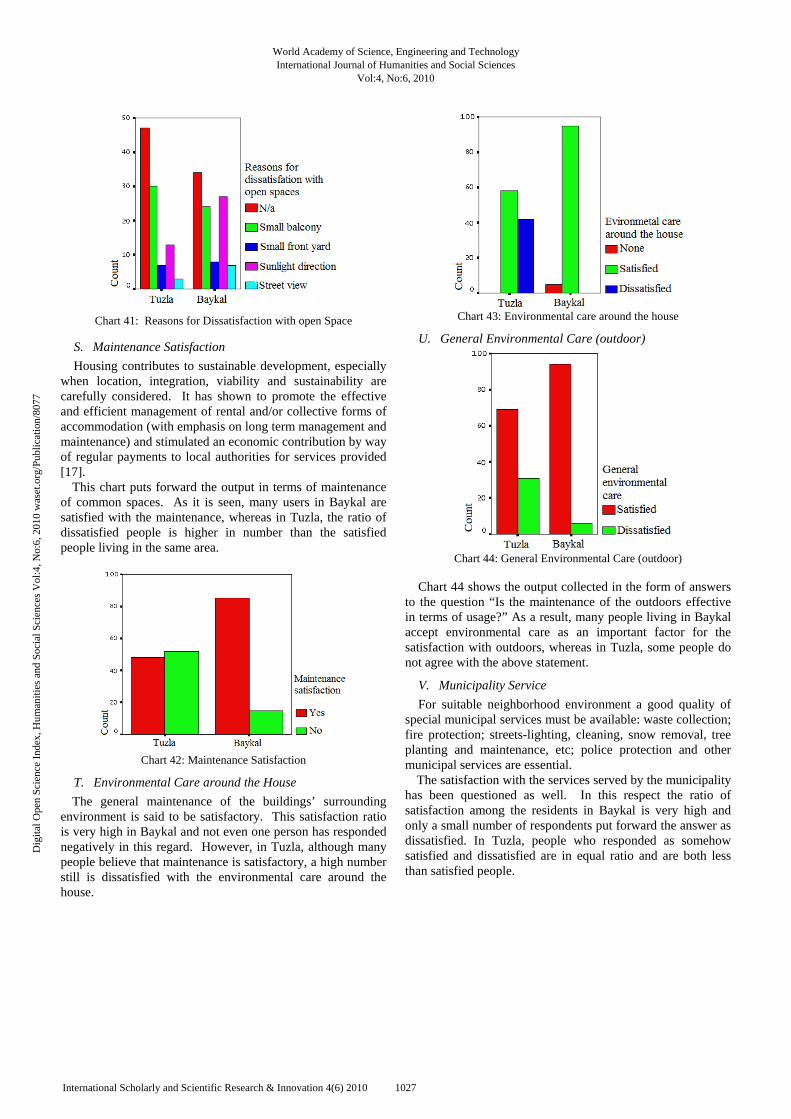
R. Dissatisfaction with open Space Housing environments take up the majority of developed land and we spend long periods of our lives within them. As such the way that they are designed can simple make our lives a pleasure, or they can make it hard for us to live our lives the way that we would like. How they are designed can, in particular, open up or reduce opportunities for us [16]. Here, in this chart, some selections are put forward to analyze the reasons of dissatisfaction with domestic open spaces. In this case, in Tuzla, the main problem is seen as the terraces not being big enough. In Baykal, the main problem is seen as the orientation of the buildings considering the direction of the sunlight. Another issue is the inadequate space provided for the front yard.
World Academy of Science, Engineering and TechnologyInternational Journal of Humanities and Social Sciences
Vol:4, No:6, 2010
1026International Scholarly and Scientific Research & Innovation 4(6) 2010
Dig
ital O
pen
Scie
nce
Inde
x, H
uman
ities
and
Soc
ial S
cien
ces
Vol
:4, N
o:6,
201
0 w
aset
.org
/Pub
licat
ion/
8077
Chart 41: Reasons for Dissatisfaction with open Space
S. Maintenance Satisfaction Housing contributes to sustainable development, especially
when location, integration, viability and sustainability are carefully considered. It has shown to promote the effective and efficient management of rental and/or collective forms of accommodation (with emphasis on long term management and maintenance) and stimulated an economic contribution by way of regular payments to local authorities for services provided [17]. This chart puts forward the output in terms of maintenance of common spaces. As it is seen, many users in Baykal are satisfied with the maintenance, whereas in Tuzla, the ratio of dissatisfied people is higher in number than the satisfied people living in the same area.
Chart 42: Maintenance Satisfaction
T. Environmental Care around the House The general maintenance of the buildings’ surrounding environment is said to be satisfactory. This satisfaction ratio is very high in Baykal and not even one person has responded negatively in this regard. However, in Tuzla, although many people believe that maintenance is satisfactory, a high number still is dissatisfied with the environmental care around the house.
Chart 43: Environmental care around the house
U. General Environmental Care (outdoor)
Chart 44: General Environmental Care (outdoor)
Chart 44 shows the output collected in the form of answers to the question “Is the maintenance of the outdoors effective in terms of usage?” As a result, many people living in Baykal accept environmental care as an important factor for the satisfaction with outdoors, whereas in Tuzla, some people do not agree with the above statement.
V. Municipality Service For suitable neighborhood environment a good quality of
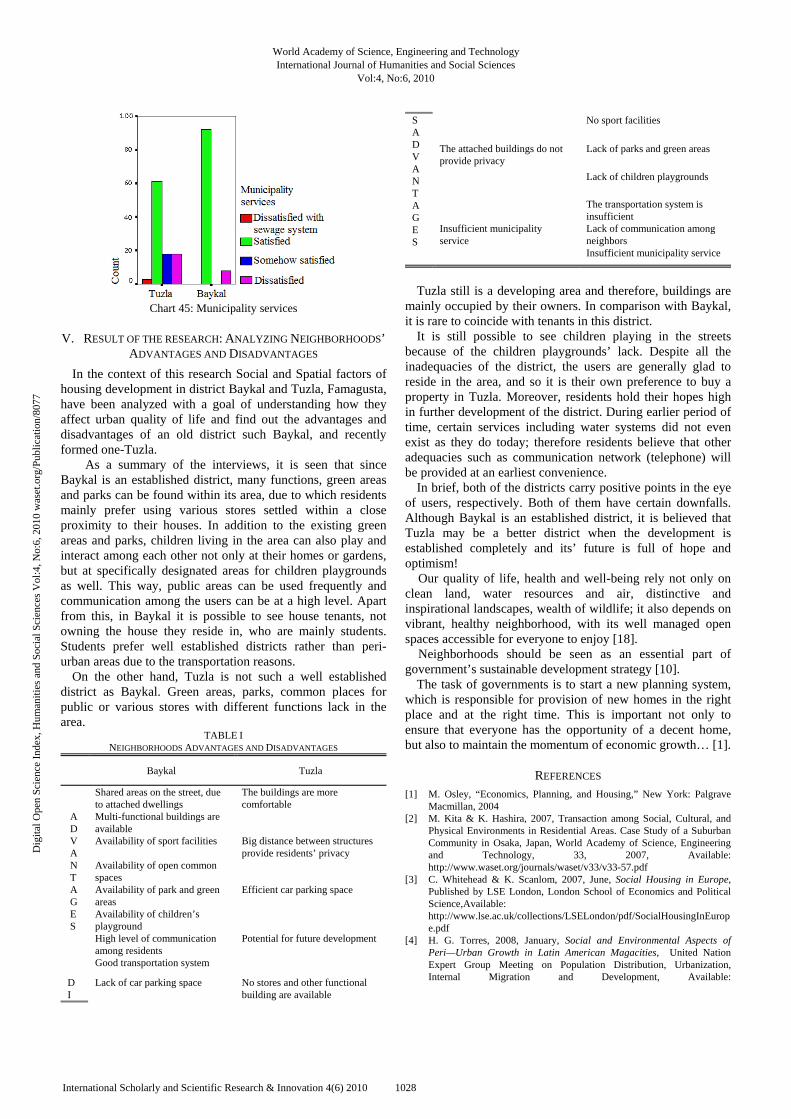
special municipal services must be available: waste collection; fire protection; streets-lighting, cleaning, snow removal, tree planting and maintenance, etc; police protection and other municipal services are essential. The satisfaction with the services served by the municipality has been questioned as well. In this respect the ratio of satisfaction among the residents in Baykal is very high and only a small number of respondents put forward the answer as dissatisfied. In Tuzla, people who responded as somehow satisfied and dissatisfied are in equal ratio and are both less than satisfied people.
World Academy of Science, Engineering and TechnologyInternational Journal of Humanities and Social Sciences
Vol:4, No:6, 2010
1027International Scholarly and Scientific Research & Innovation 4(6) 2010
Dig
ital O
pen
Scie
nce
Inde
x, H
uman
ities
and
Soc
ial S
cien
ces
Vol
:4, N
o:6,
201
0 w
aset
.org
/Pub
licat
ion/
8077
Chart 45: Municipality services
V. RESULT OF THE RESEARCH: ANALYZING NEIGHBORHOODS’ ADVANTAGES AND DISADVANTAGES
In the context of this research Social and Spatial factors of housing development in district Baykal and Tuzla, Famagusta, have been analyzed with a goal of understanding how they affect urban quality of life and find out the advantages and disadvantages of an old district such Baykal, and recently formed one-Tuzla. As a summary of the interviews, it is seen that since Baykal is an established district, many functions, green areas and parks can be found within its area, due to which residents mainly prefer using various stores settled within a close proximity to their houses. In addition to the existing green areas and parks, children living in the area can also play and interact among each other not only at their homes or gardens, but at specifically designated areas for children playgrounds as well. This way, public areas can be used frequently and communication among the users can be at a high level. Apart from this, in Baykal it is possible to see house tenants, not owning the house they reside in, who are mainly students. Students prefer well established districts rather than peri-urban areas due to the transportation reasons. On the other hand, Tuzla is not such a well established district as Baykal. Green areas, parks, common places for public or various stores with different functions lack in the area.
TABLE I NEIGHBORHOODS ADVANTAGES AND DISADVANTAGES
Baykal Tuzla
A D V A N T A G E S
Shared areas on the street, due to attached dwellings
The buildings are more comfortable
Multi-functional buildings are available
Availability of sport facilities Big distance between structures provide residents’ privacy
Availability of open common spaces
Availability of park and green areas
Efficient car parking space
Availability of children’s playground
High level of communication among residents
Potential for future development
Good transportation system
D I
Lack of car parking space No stores and other functional building are available
S A D V A N T A G E S
No sport facilities
The attached buildings do not provide privacy
Lack of parks and green areas
Lack of children playgrounds
The transportation system is insufficient
Insufficient municipality service
Lack of communication among neighbors
Insufficient municipality service
Tuzla still is a developing area and therefore, buildings are mainly occupied by their owners. In comparison with Baykal, it is rare to coincide with tenants in this district. It is still possible to see children playing in the streets because of the children playgrounds’ lack. Despite all the inadequacies of the district, the users are generally glad to reside in the area, and so it is their own preference to buy a property in Tuzla. Moreover, residents hold their hopes high in further development of the district. During earlier period of time, certain services including water systems did not even exist as they do today; therefore residents believe that other adequacies such as communication network (telephone) will be provided at an earliest convenience. In brief, both of the districts carry positive points in the eye of users, respectively. Both of them have certain downfalls. Although Baykal is an established district, it is believed that Tuzla may be a better district when the development is established completely and its’ future is full of hope and optimism!
Our quality of life, health and well-being rely not only on clean land, water resources and air, distinctive and inspirational landscapes, wealth of wildlife; it also depends on vibrant, healthy neighborhood, with its well managed open spaces accessible for everyone to enjoy [18].
Neighborhoods should be seen as an essential part of government’s sustainable development strategy [10]. The task of governments is to start a new planning system, which is responsible for provision of new homes in the right place and at the right time. This is important not only to ensure that everyone has the opportunity of a decent home, but also to maintain the momentum of economic growth… [1].
REFERENCES [1] M. Osley, “Economics, Planning, and Housing,” New York: Palgrave
Macmillan, 2004 [2] M. Kita & K. Hashira, 2007, Transaction among Social, Cultural, and
Physical Environments in Residential Areas. Case Study of a Suburban Community in Osaka, Japan, World Academy of Science, Engineering and Technology, 33, 2007, Available: http://www.waset.org/journals/waset/v33/v33-57.pdf
[3] C. Whitehead & K. Scanlom, 2007, June, Social Housing in Europe, Published by LSE London, London School of Economics and Political Science,Available: http://www.lse.ac.uk/collections/LSELondon/pdf/SocialHousingInEurope.pdf
[4] H. G. Torres, 2008, January, Social and Environmental Aspects of Peri—Urban Growth in Latin American Magacities, United Nation Expert Group Meeting on Population Distribution, Urbanization, Internal Migration and Development, Available:
World Academy of Science, Engineering and TechnologyInternational Journal of Humanities and Social Sciences
Vol:4, No:6, 2010
1028International Scholarly and Scientific Research & Innovation 4(6) 2010
[5] M. Filfil, 1999, The Housing Environment and Women’s Helth: The case Study of Ramallah al-Tahta, Institute of Community & Public Health, Berzeit University, Available: http://icph.birzeit.edu/Books/The%20Housing%20Environment%20.pdf
[6] J. Chiara, J. Panero & M. Zelnik, M., “Time-Saver Standards for Housing and Residential Development,” 2nd Edition, Singapore: McGraw-Hill, Inc., 1995
[7] S. M. Low, 1988, Cultural Aspects of Design: An Introduction to the Field, Arch & Compn/Arch. Behav, Vol. 4, n. 3, p. 187-190, Available: http://lasur.epfl.ch/revue/A&C%20Vol%204%20No.3/LOW_en.pdf
[8] P. Purcell, “Networked Neighborhoods: The Connected Community in Context,” London: Springer, 2006
[9] P. Chistensen & O’Brien, “Children in the City: Home Neighborhood & Community (Future of Childhood),” London: RoutledgeFalmer, 2003
[10] R. Giuse, H. Barton & M. Grant, “Neighborhoods: A Guide for Health, Sustainability, Vitality,” London: Spon Press, 2003
[11] C. Maser, “Social-Environmental Planning, The design Interface Between Everyforest and Everycity,” USA: CRC Press, 2009
[12] W. Goodman, “Principles and Practice of Urban Planning,” Washington: International city Managers’ Association, 1968
[13] F. & F. Weal, “Housing the Elderly,” London: Mitchell Publishing, 1988 [14] M. Wen, K. A. Cagney, N. A. Christakis, 2005, March, Effects of
specific aspects of community social environment on the mortality of Individuals diagnosrd with serious illness, Social Science & Medicine, 61, 2005, 1119-1134, Available: http://health.bsd.uchicago.edu/FileStore/WenCagneyChristakis.2005.pdf
[15] L. M. Anderson, M. T. Fullilove, S. C. Scimshaw, J. E. Fielding, J. Normand, C. Shinn, J. S. Charles, Chapter 3. The Social Environments. Risk Behaviors and Environmental Challenges, Available: http://www.thecommunityguide.org/social/Social-Environment.pdf
[16] M. Biddulh, “Introductoin to Residential Layout,” London: Elselvier, 2007
[17] A Social Housing Policy for South Africa. Towards an enabling environment for social housing development, Available: http://www.housing.gov.za/content/legislation_policies/Social%20Housing%20Policy.pdf,
[18] D. Tyldesly & Associates, 2005, June, Environmental Quality in Spatial Planning. Incorporating the nature, built and historic environment, and rural issues in plans and strategies. Guidance to help in the preparation of Regional Spatial Strategies and Local Development Frameworks, Available: http://www.english-heritage.org.uk/upload/pdf/Envir_Quality.pdf
World Academy of Science, Engineering and TechnologyInternational Journal of Humanities and Social Sciences
Vol:4, No:6, 2010
1029International Scholarly and Scientific Research & Innovation 4(6) 2010