Marco Manacorda Queen Mary University of London; CEP, London School of Economics; CEPR and IZA IEN LACEA Buenos Aires August 22-23 2011 Social Assistance and Labor Market Outcomes Lessons from the evaluation of the Uruguayan PANES M1 M7
Transcript
Marco ManacordaQueen Mary University of London;
CEP, London School of Economics; CEPR and IZA
IEN LACEABuenos Aires
August 22-23 2011
Social Assistance and Labor Market OutcomesLessons from the evaluation of the Uruguayan PANES
M1
M7
Diapositiva 1
M1 Subsidy to infromalityDynamic incentivesThere are laso good outcomes (dpeite lower insurance) - reduciton in poverty
income and sub effectsincome and Proxy means testingMarco, 06/04/2011
M7 govt amazingand so BPSMarco, 07/04/2011
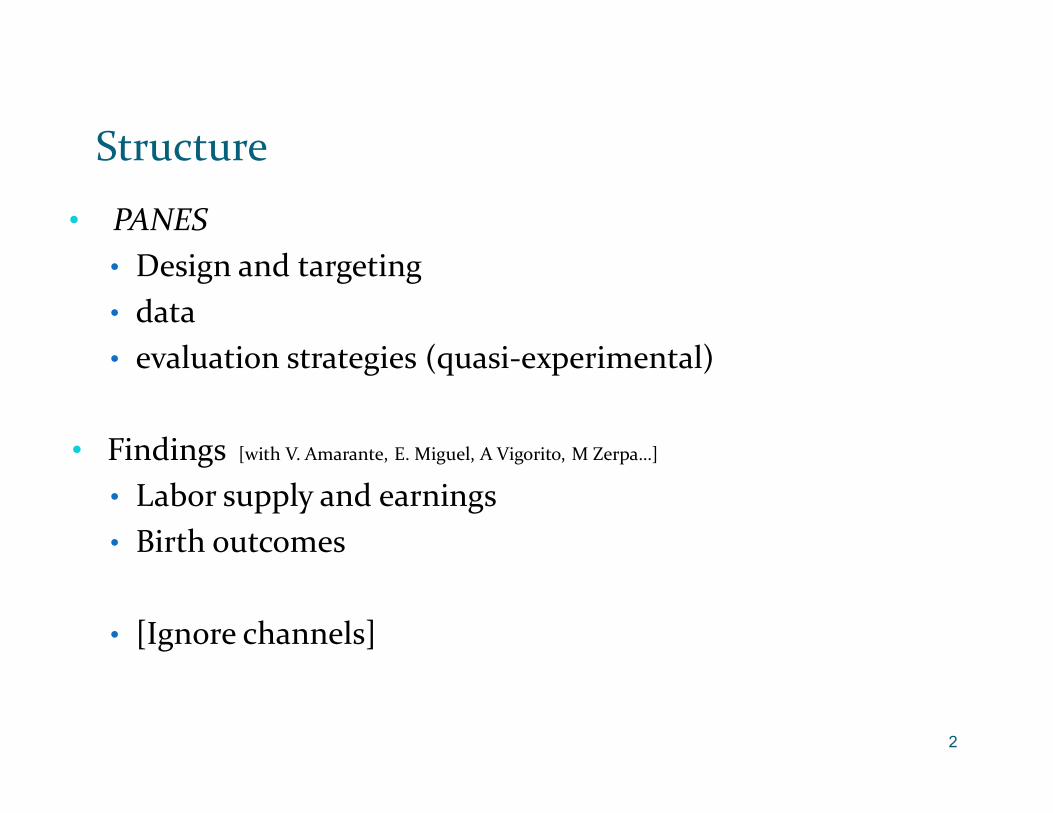
• PANES
• Design and targeting
• data
• evaluation strategies (quasi-experimental)
• Findings [with V. Amarante, E. Miguel, A Vigorito, M Zerpa…]
• Labor supply and earnings
• Birth outcomes
• [Ignore channels]
2
Structure
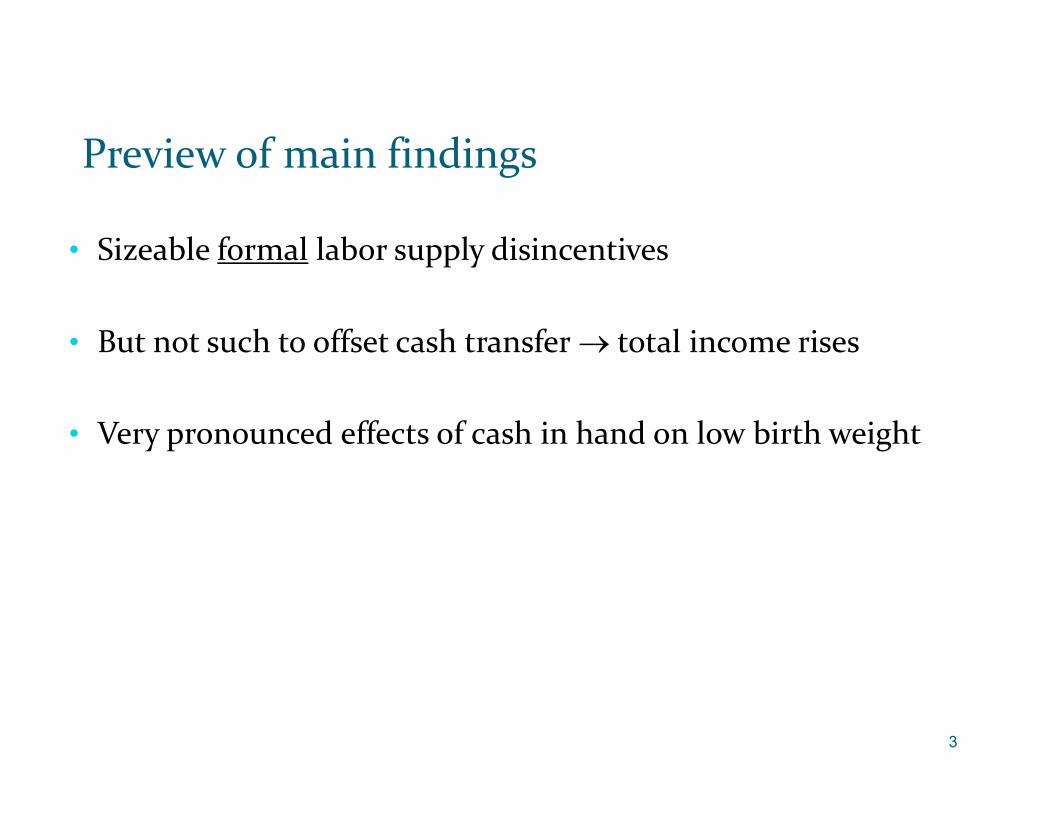
• Sizeable formal labor supply disincentives
• But not such to offset cash transfer total income rises
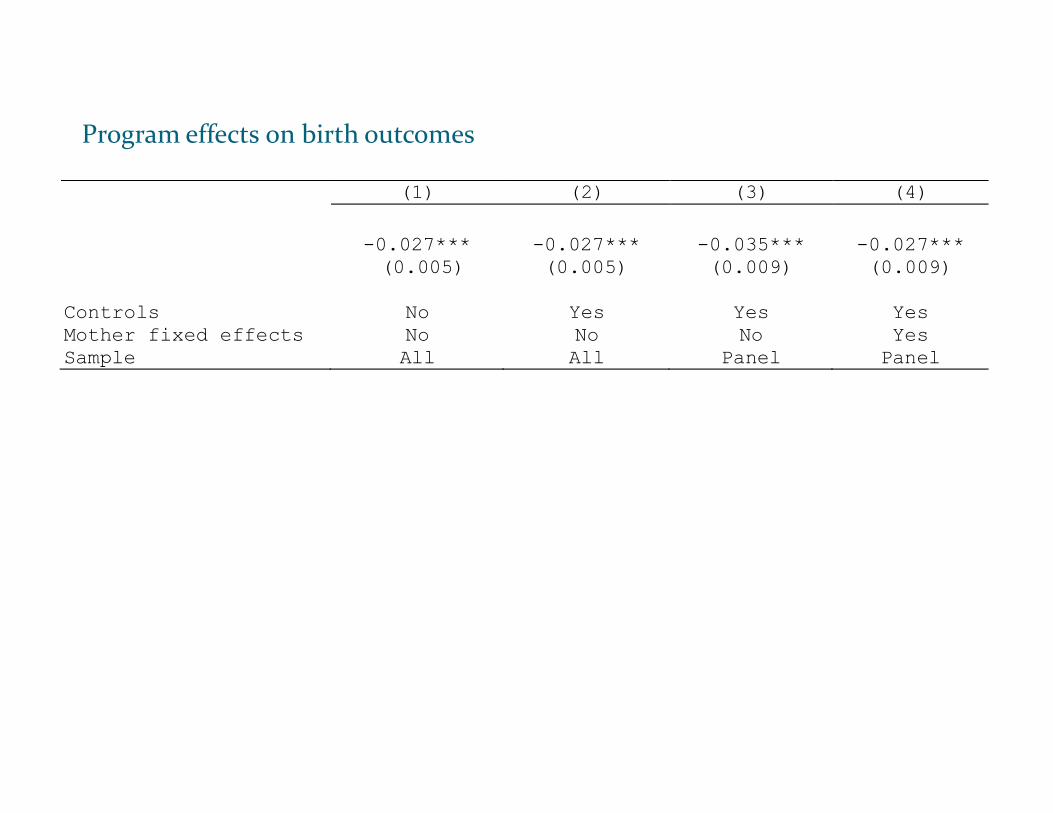
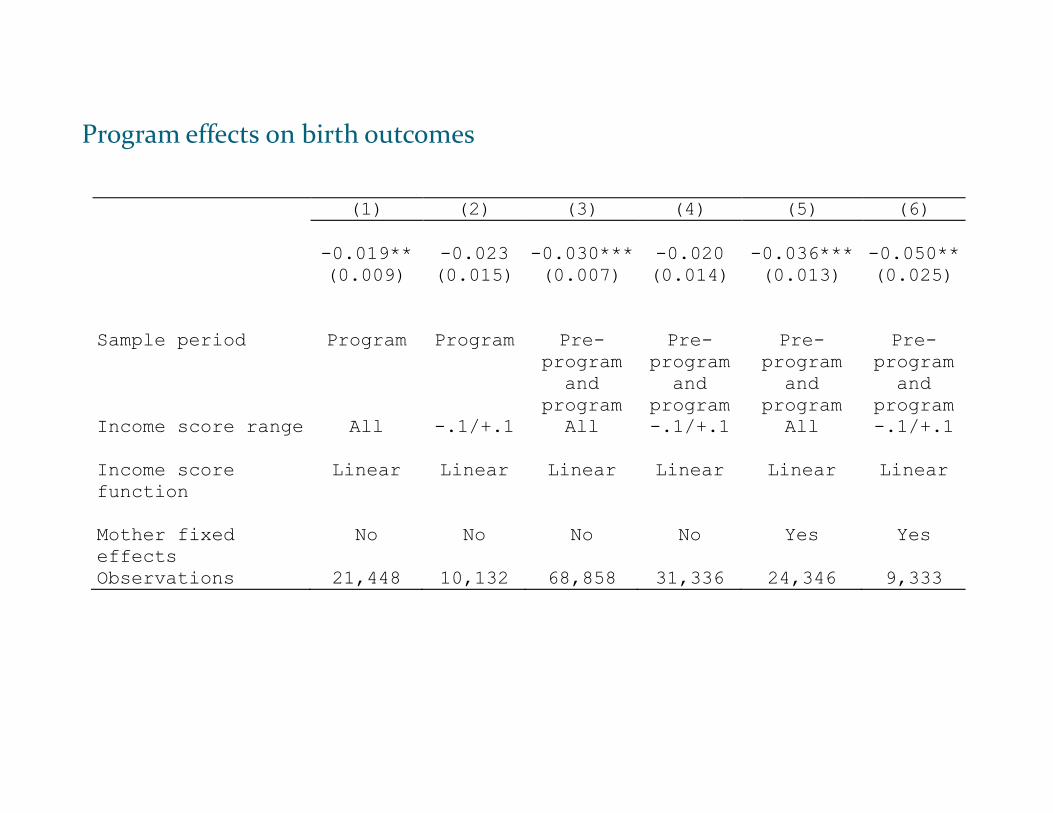
• Very pronounced effects of cash in hand on low birth weight
3
Preview of main findings
Plan de Atención Nacional a la Emergencia Social
• 2001/02 economic crisis
• Temporary (o4/05 -12/07) [ Plan de Equidad (01/08)]
• Monthly cash transfer UY$=1,360=US$56 (=PPP US$100)
=50% of self-reported pre-treatment income
(Food Card -US$13 -US$306)
+other minor ingredients (TxU, RdS..)
4
Eligibility
5
Target population: poorest 10%
190k applicant/100k beneficiary households = 750k
individuals (14% pop.)
Explicitly ruled out randomization
Proxy means-test: discontinuous function of poverty score (linear combination of baseline “exogenous” characteristics)
+ Income means-test
De facto unconditional
Entry into the program staggered
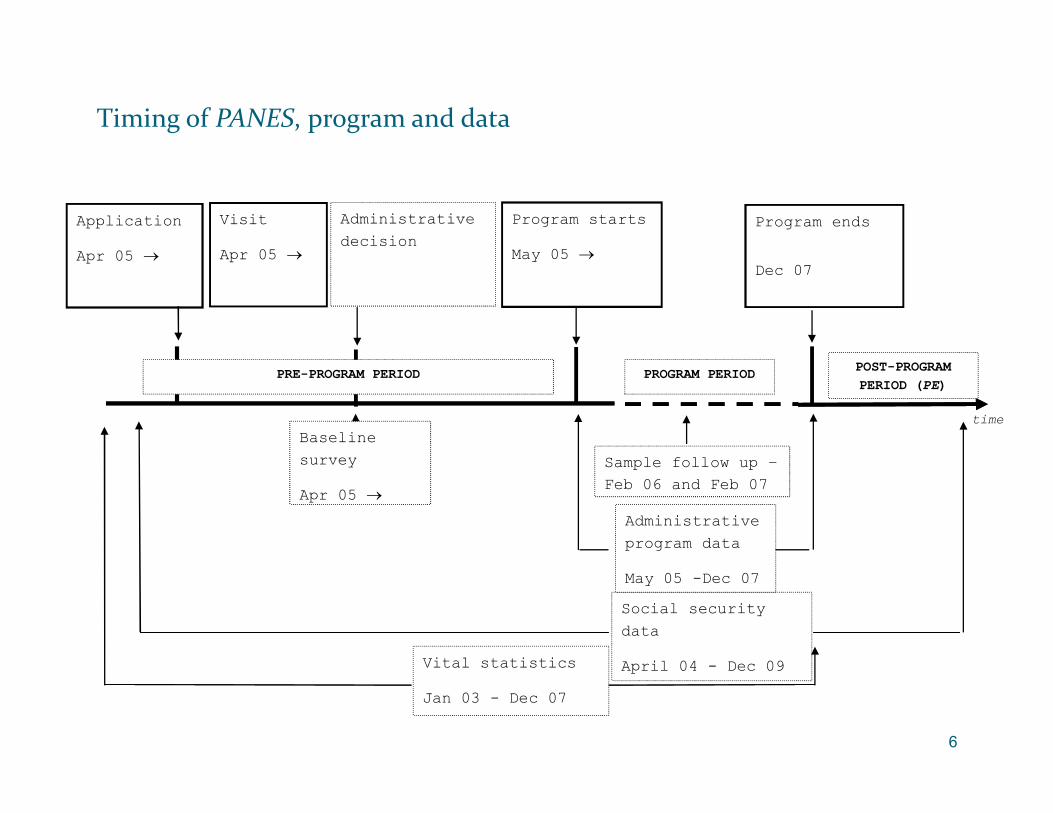
Timing of PANES, program and data
6
Program starts
May 05
Program ends
Dec 07
Application
Apr 05
Visit
Apr 05
Administrative
decision
time
Baseline
survey
Apr 05
Social security
data
April 04 - Dec 09
Administrative
program data
May 05 -Dec 07
Vital statistics
Jan 03 - Dec 07
PROGRAM PERIODPRE-PROGRAM PERIODPOST-PROGRAM
PERIOD (PE)
Sample follow up –
Feb 06 and Feb 07
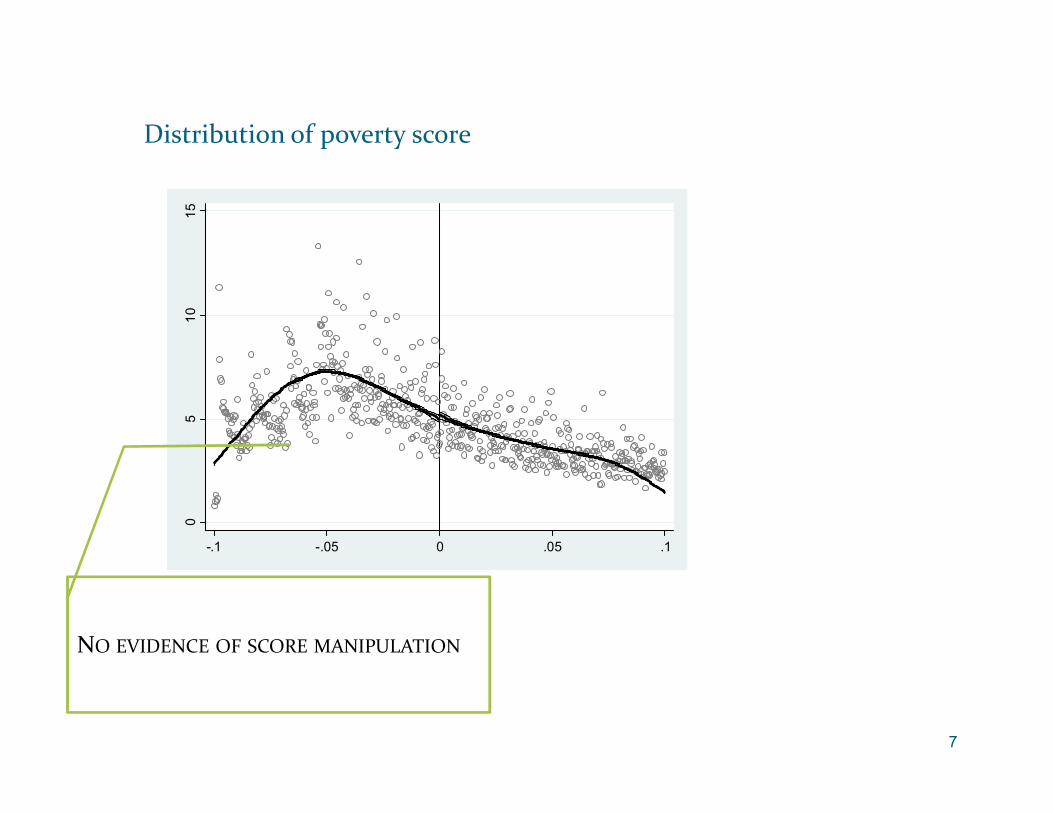
Distribution of poverty score
7
05
10
15
-.1 -.05 0 .05 .1
NO EVIDENCE OF SCORE MANIPULATION
8
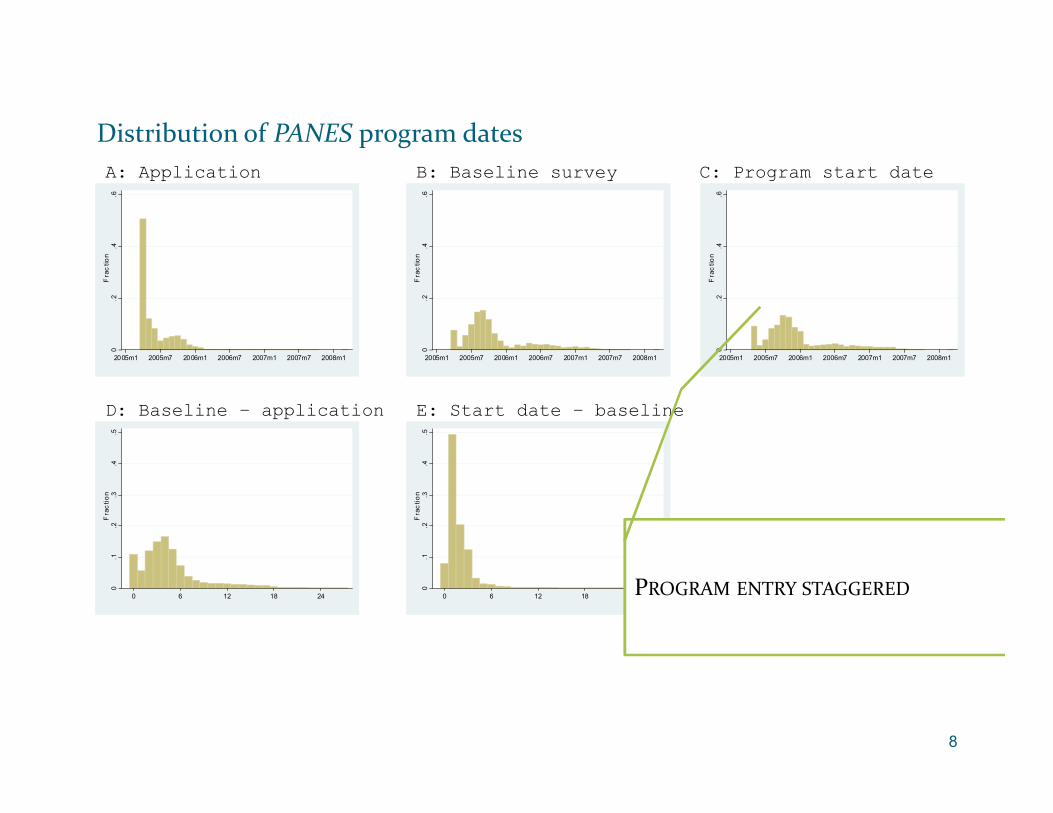
Distribution of PANES program dates
A: Application B: Baseline survey C: Program start date
D: Baseline – application E: Start date – baseline
0.2
.4.6
Fra
ctio
n
2005m1 2005m7 2006m1 2006m7 2007m1 2007m7 2008m1
0.2
.4.6
Fra
ctio
n
2005m1 2005m7 2006m1 2006m7 2007m1 2007m7 2008m1
0.2
.4.6
Fra
ctio
n
2005m1 2005m7 2006m1 2006m7 2007m1 2007m7 2008m1
0.1
.2.3
.4.5
Fra
cti
on
0 6 12 18 24
0.1
.2.3
.4.5
Fra
cti
on
0 6 12 18 24
PROGRAM ENTRY STAGGERED
Social Assistance and LM outcomes
Negative labor supply effect, income + substitution
(increase in informality?)
Potentially positive LT effects
LAC evidence mixed
Identification strategy: RD - Compare eligible (treatment) and ineligible (control) individuals in neighborhood of poverty score threshold
9
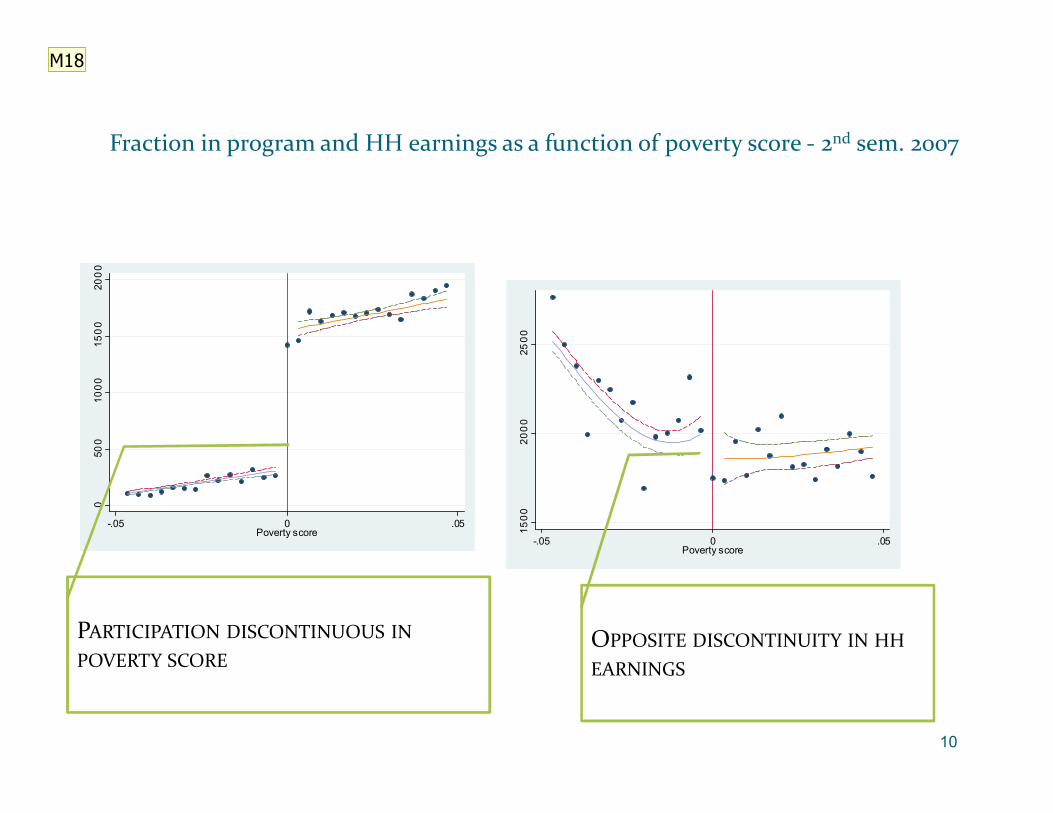
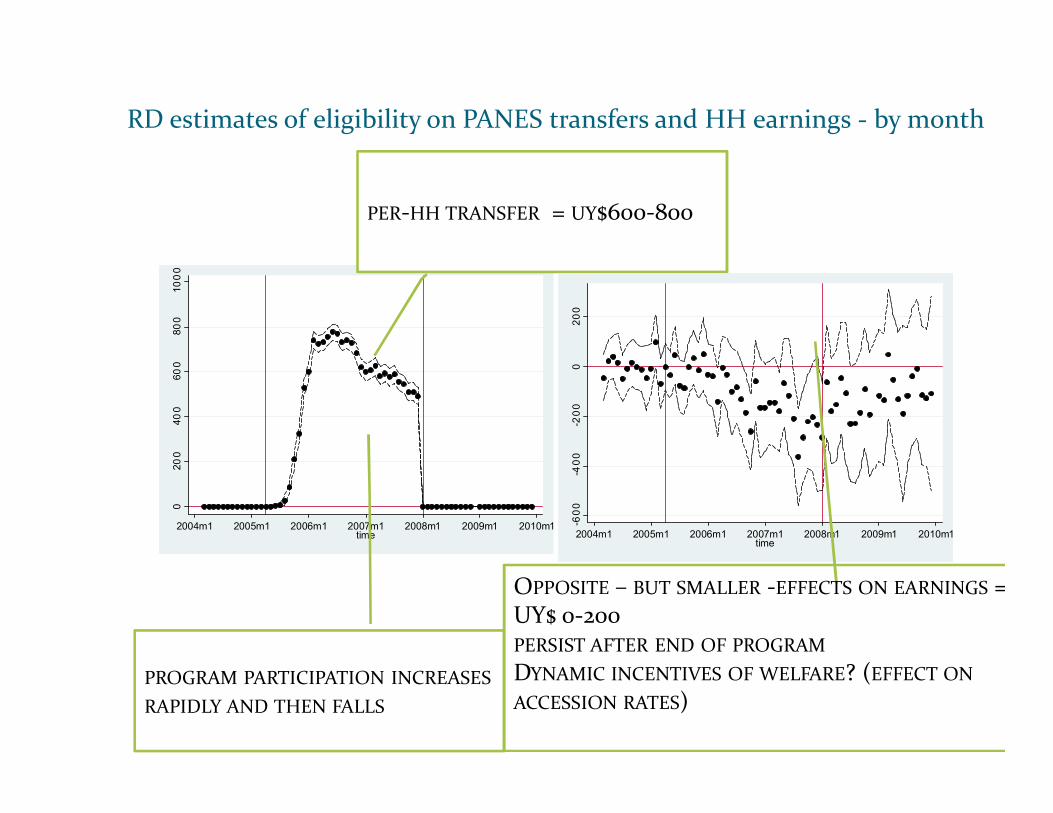
Fraction in program and HH earnings as a function of poverty score - 2nd sem. 2007
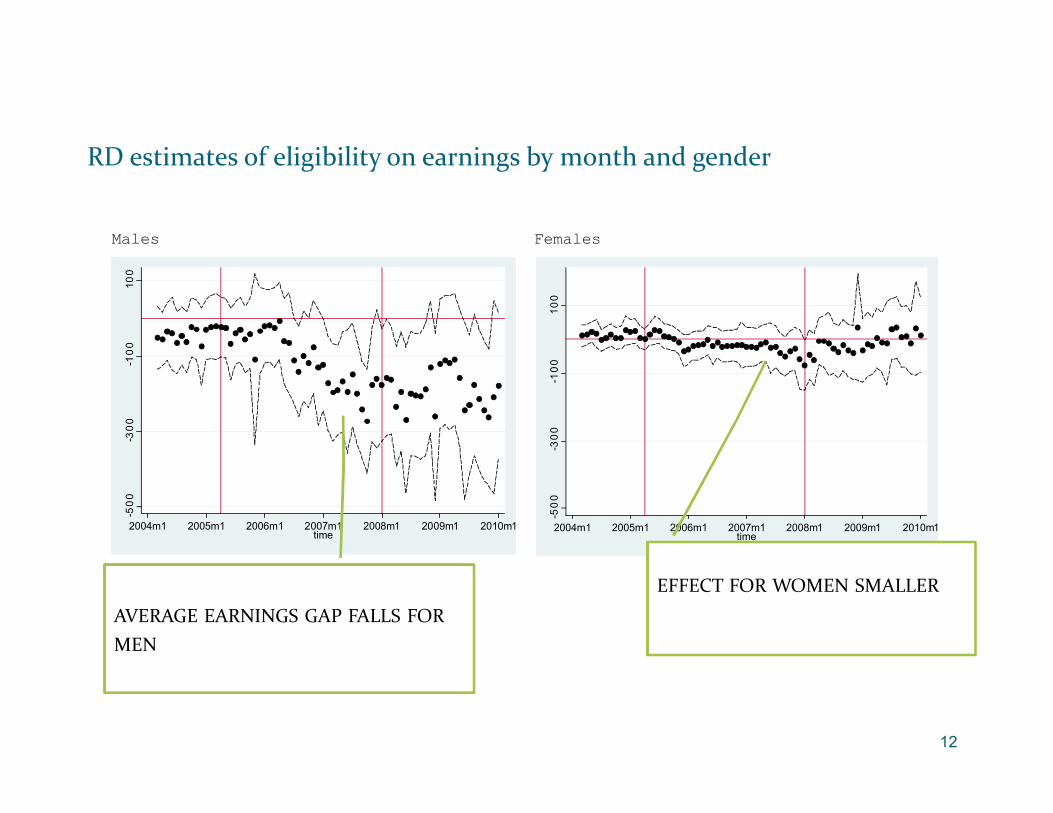
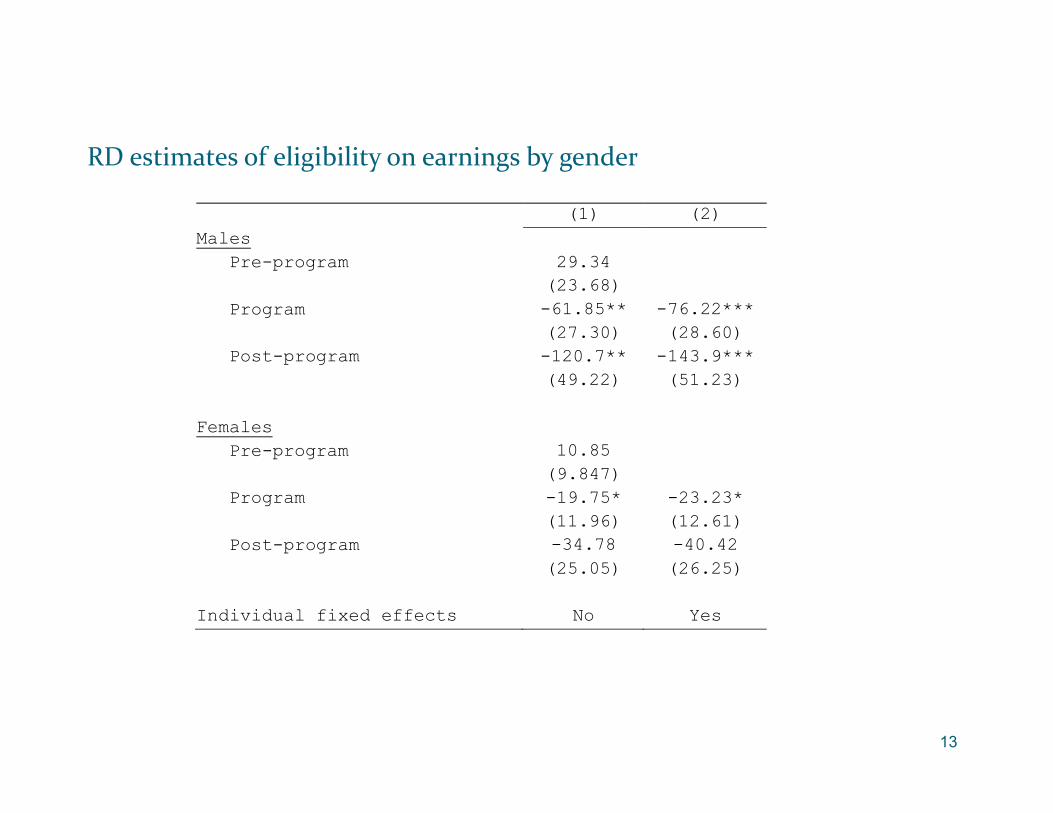
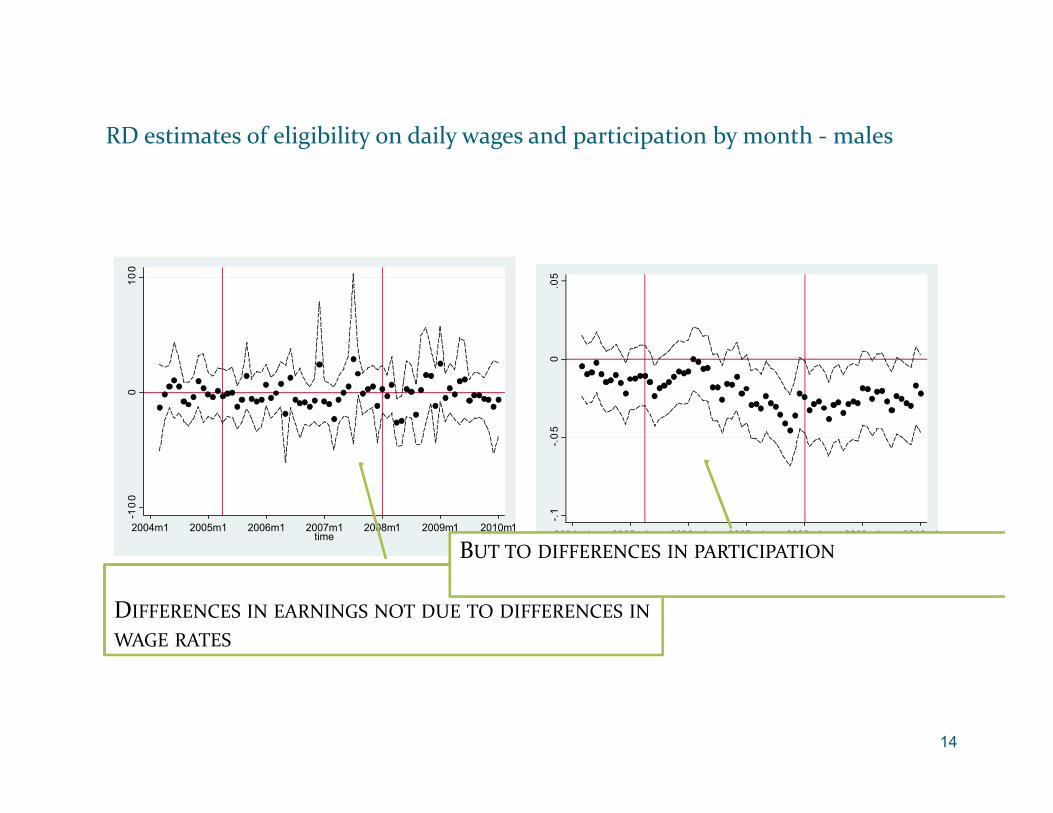
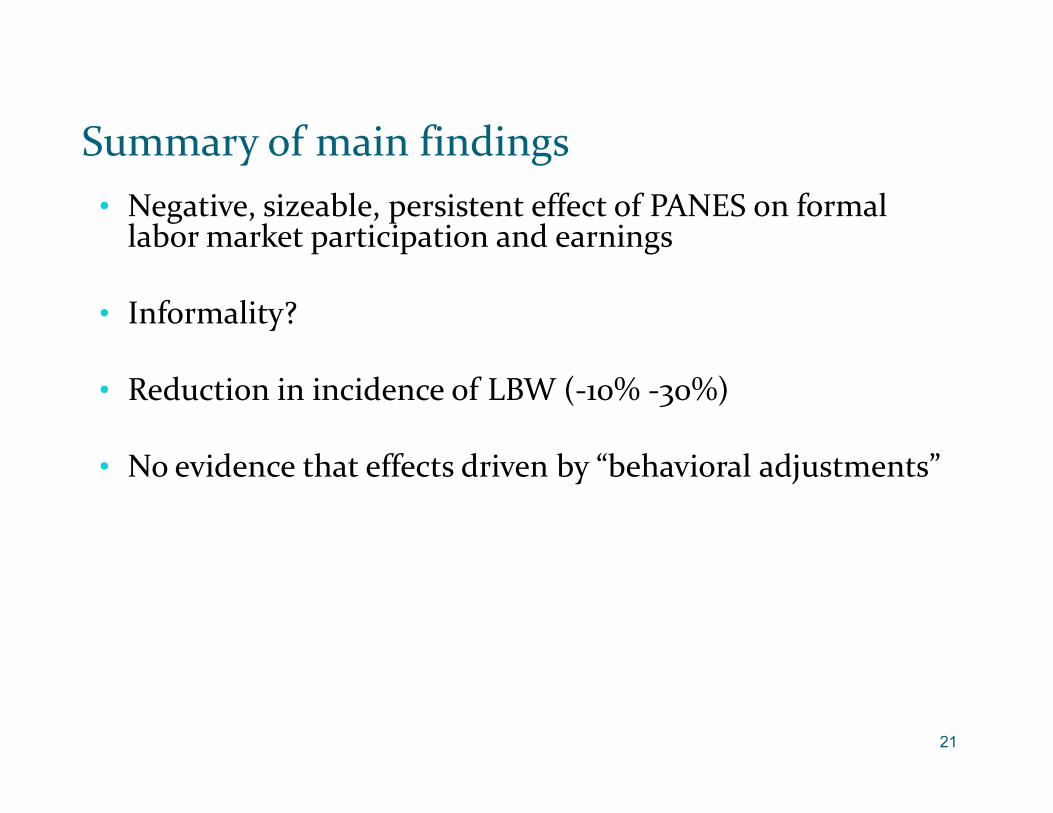
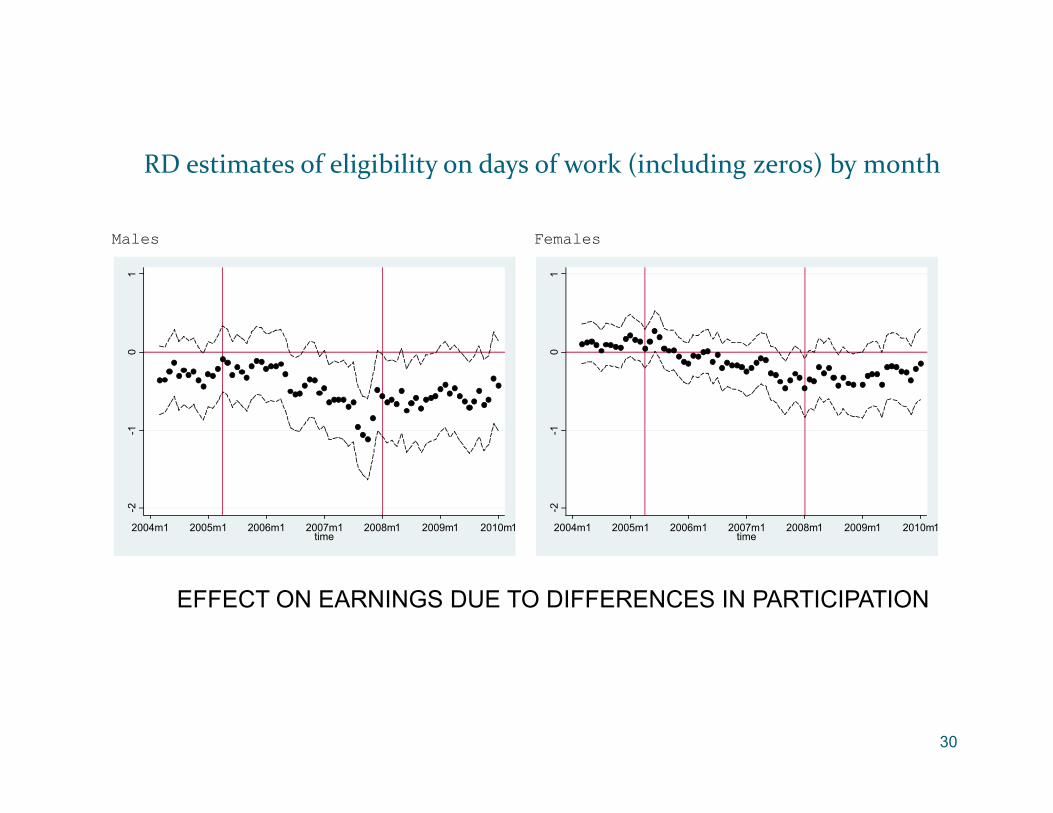
• Negative, sizeable, persistent effect of PANES on formal labor market participation and earnings
• Informality?
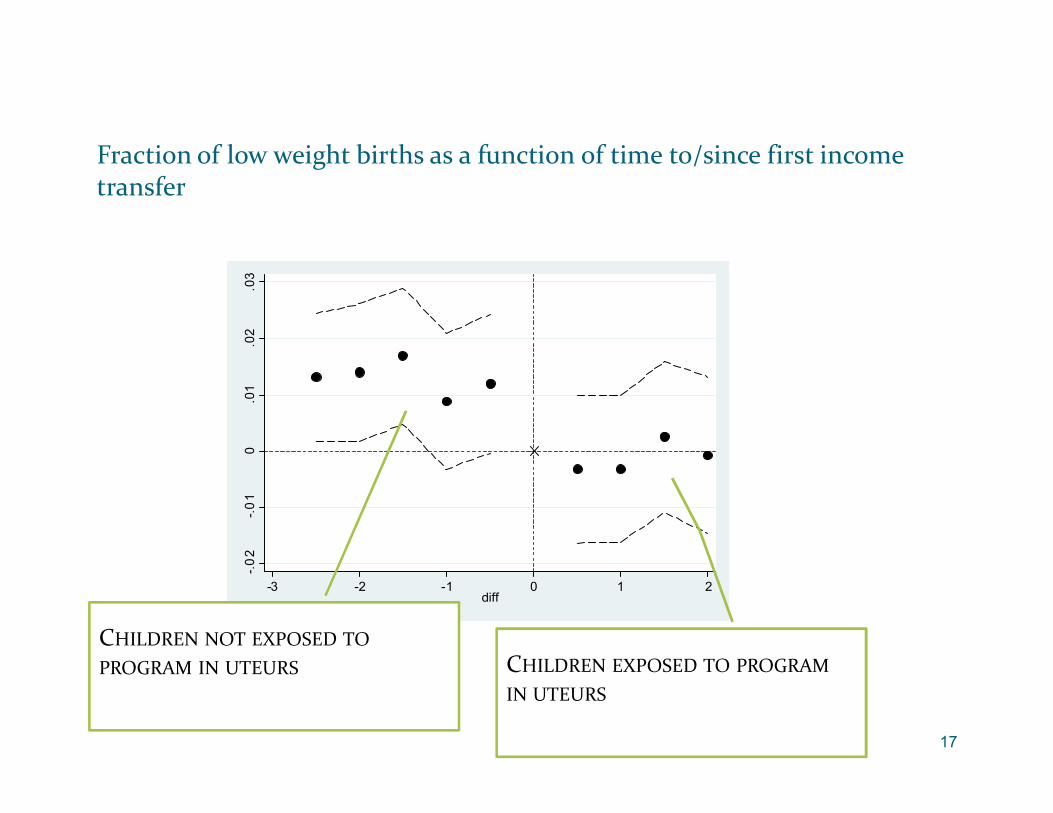
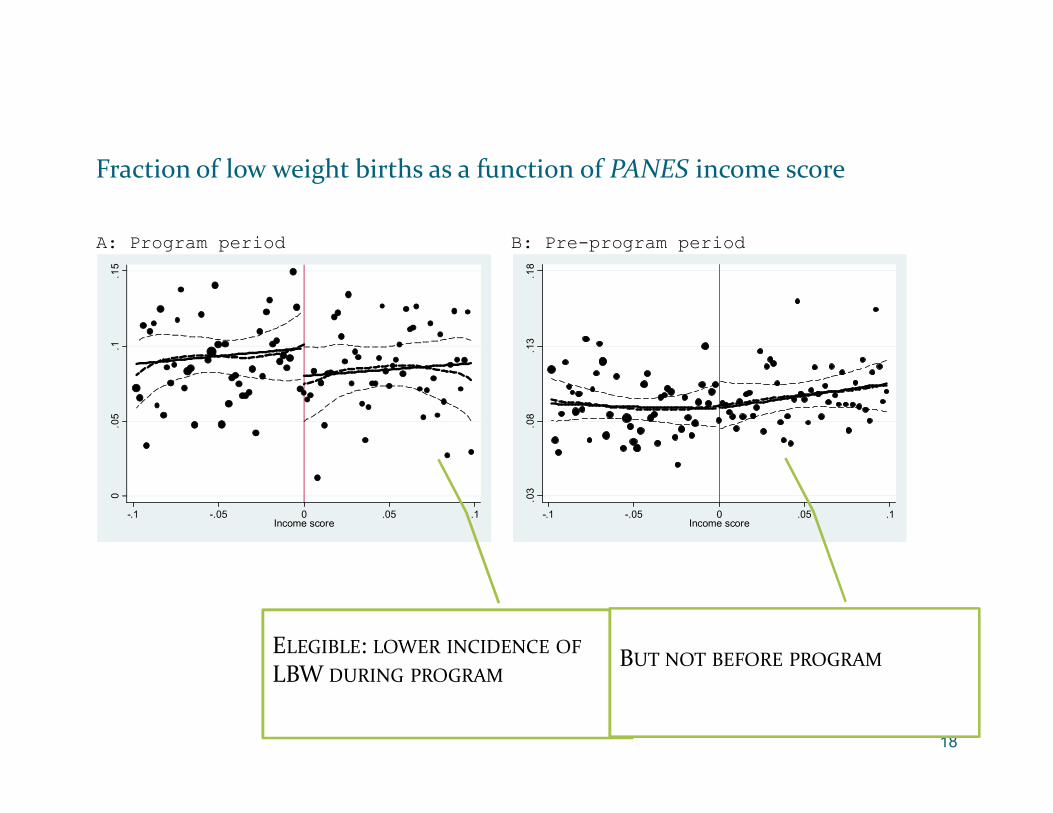
• Reduction in incidence of LBW (-10% -30%)
• No evidence that effects driven by “behavioral adjustments”
21
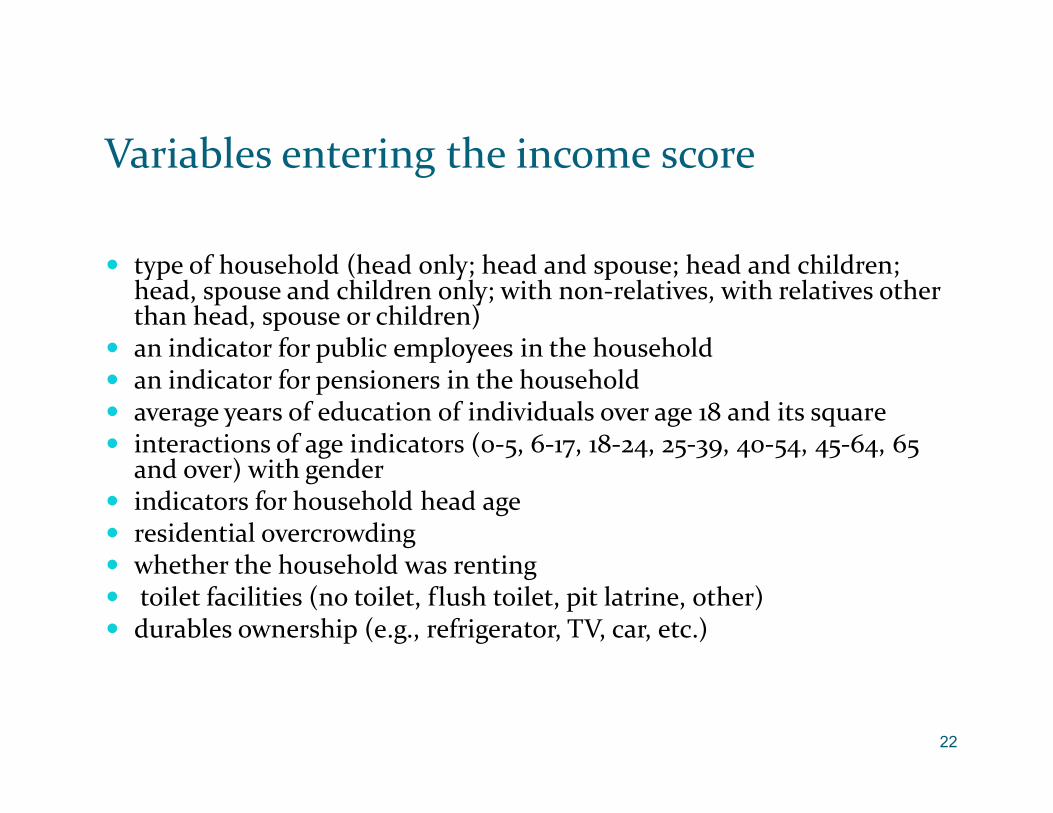
Variables entering the income score
type of household (head only; head and spouse; head and children; head, spouse and children only; with non-relatives, with relatives other than head, spouse or children)
an indicator for public employees in the household an indicator for pensioners in the household average years of education of individuals over age 18 and its square interactions of age indicators (0-5, 6-17, 18-24, 25-39, 40-54, 45-64, 65
and over) with gender indicators for household head age residential overcrowding whether the household was renting toilet facilities (no toilet, f lush toilet, pit latrine, other) durables ownership (e.g., refrigerator, TV, car, etc.)
22
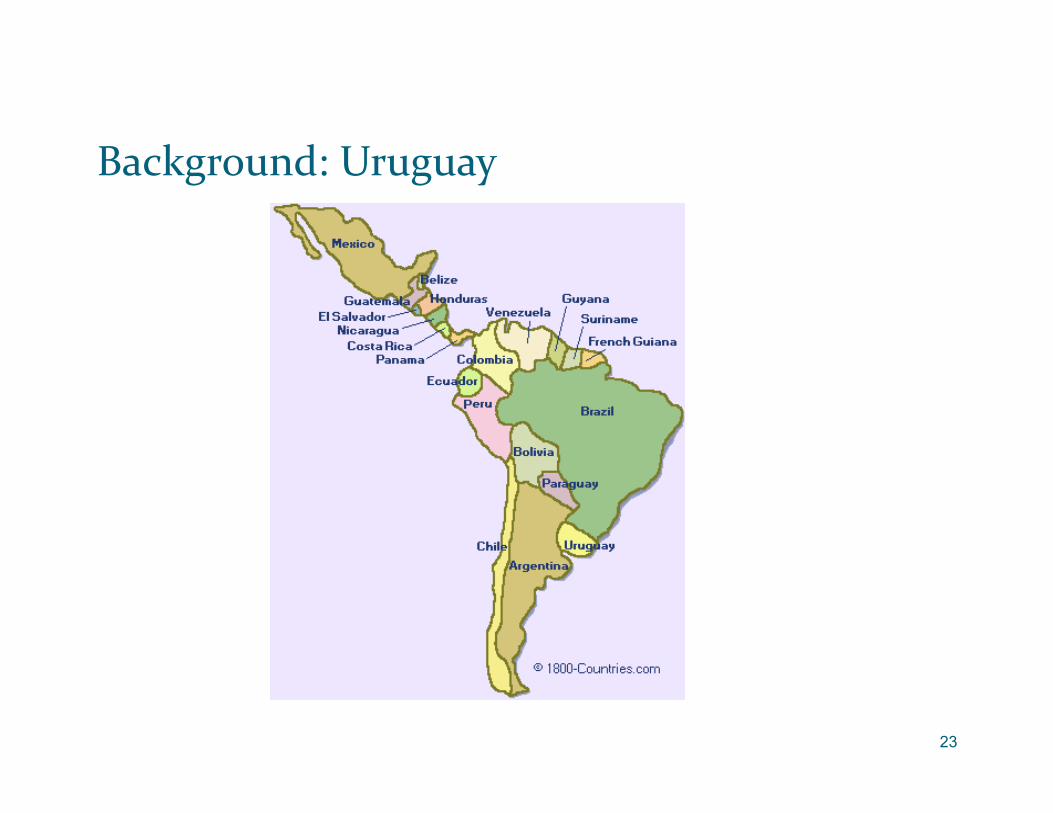
Background: Uruguay
23
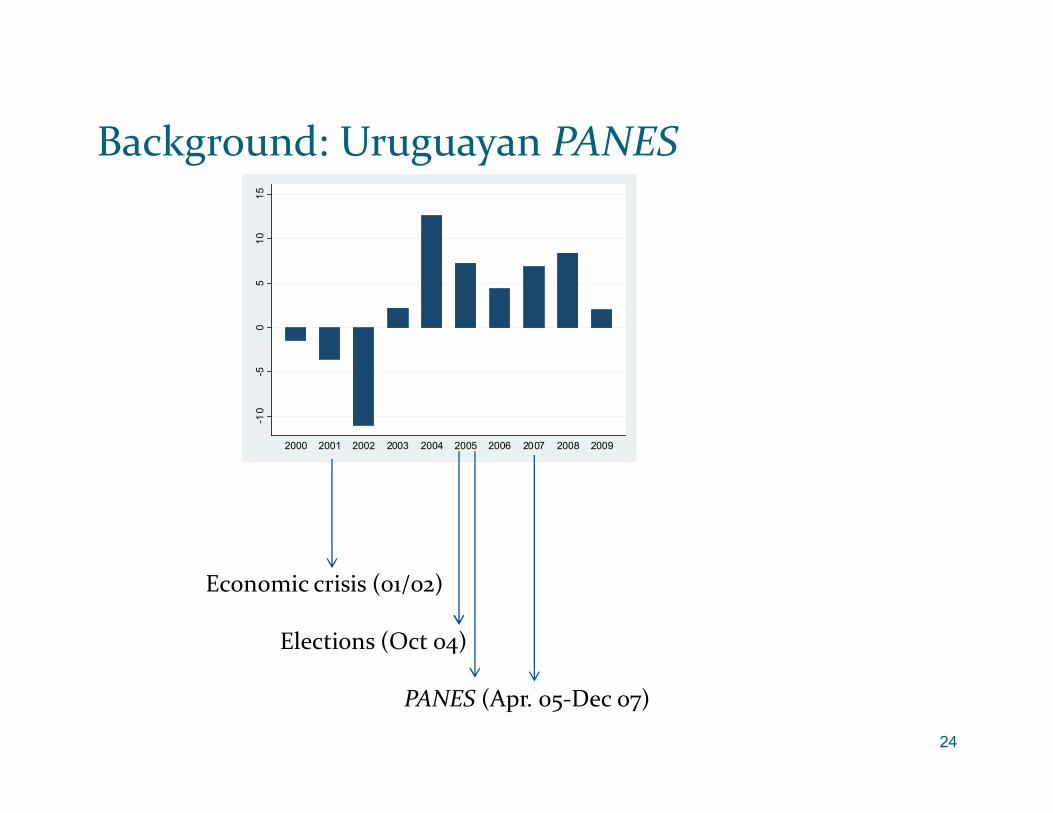
Background: Uruguayan PANES
24
-10
-50
51
01
5
2000 2001 2002 2003 2004 2005 2006 2007 2008 2009
Economic crisis (01/02)
Elections (Oct 04)
PANES (Apr. 05-Dec 07)
25
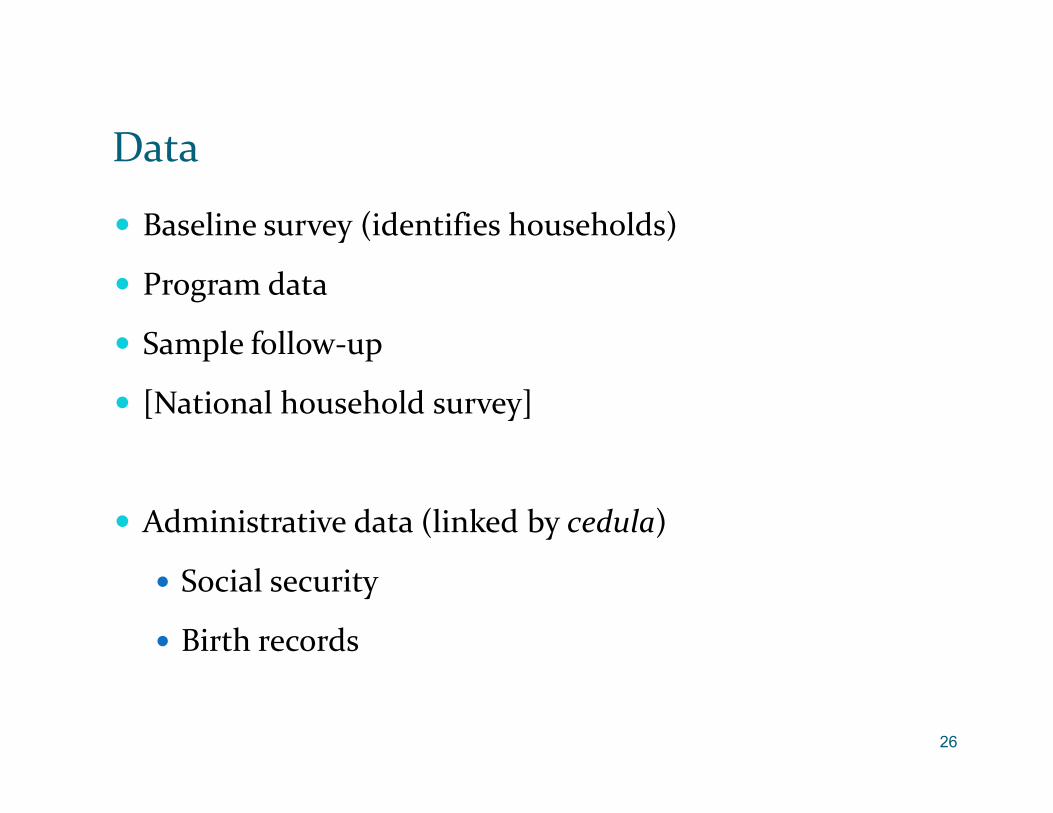
Data
26
Baseline survey (identifies households)
Program data
Sample follow-up
[National household survey]
Administrative data (linked by cedula)
Social security
Birth records
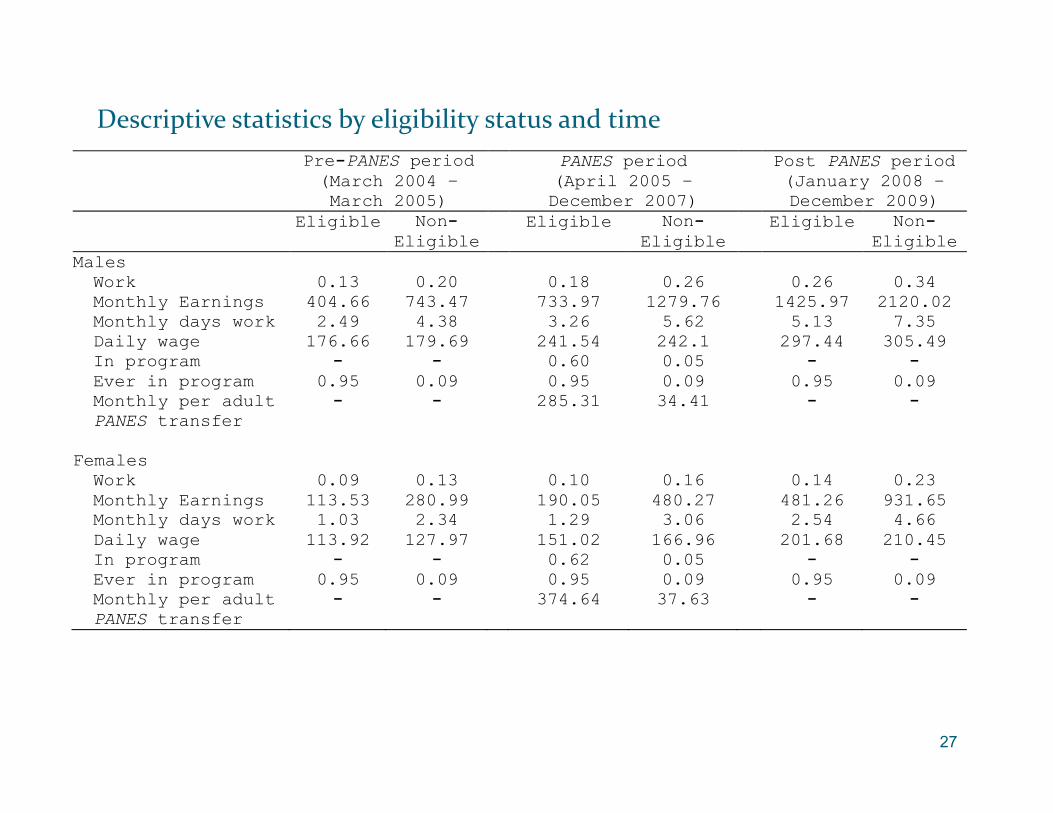
Descriptive statistics by eligibility status and time
27
Pre-PANES period (March 2004 – March 2005)
PANES period (April 2005 – December 2007)
Post PANES period (January 2008 – December 2009)
Eligible Non-Eligible
Eligible Non-Eligible
Eligible Non-Eligible
Males Work 0.13 0.20 0.18 0.26 0.26 0.34 Monthly Earnings 404.66 743.47 733.97 1279.76 1425.97 2120.02 Monthly days work 2.49 4.38 3.26 5.62 5.13 7.35 Daily wage 176.66 179.69 241.54 242.1 297.44 305.49 In program - - 0.60 0.05 - - Ever in program 0.95 0.09 0.95 0.09 0.95 0.09 Monthly per adult PANES transfer
- - 285.31 34.41 - -
Females Work 0.09 0.13 0.10 0.16 0.14 0.23 Monthly Earnings 113.53 280.99 190.05 480.27 481.26 931.65 Monthly days work 1.03 2.34 1.29 3.06 2.54 4.66 Daily wage 113.92 127.97 151.02 166.96 201.68 210.45 In program - - 0.62 0.05 - - Ever in program 0.95 0.09 0.95 0.09 0.95 0.09 Monthly per adult PANES transfer
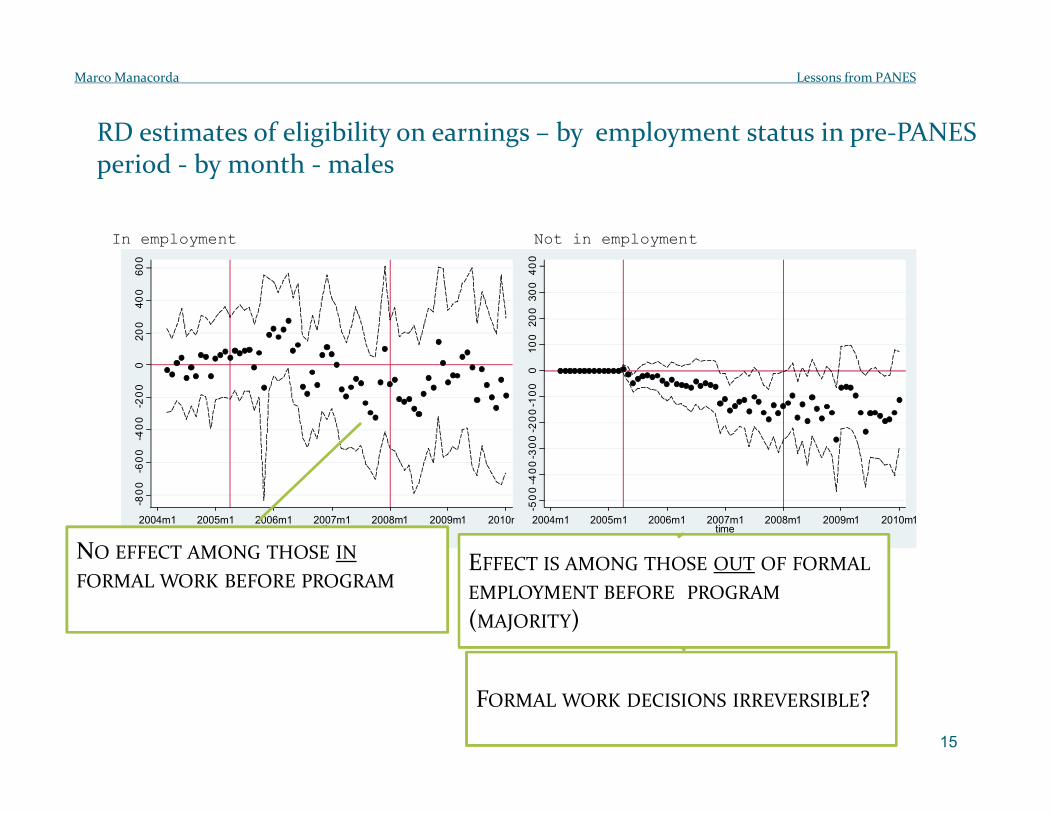
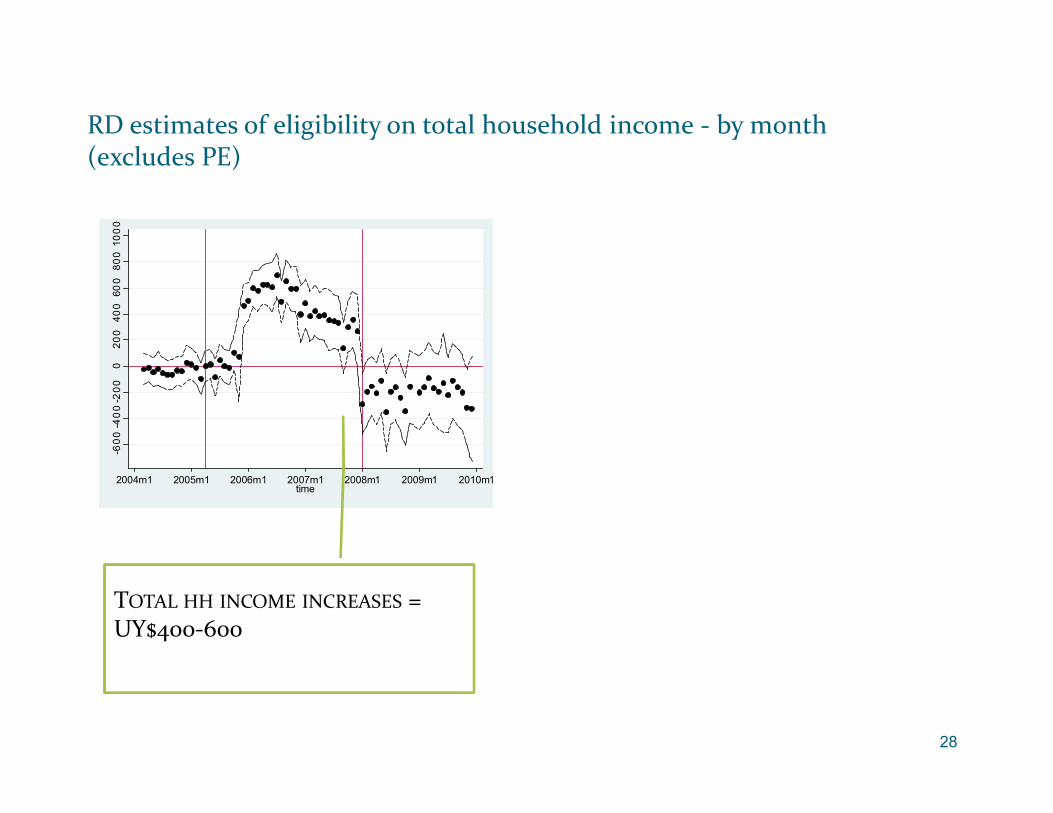
RD estimates of eligibility on total household income - by month (excludes PE)
TOTAL HH INCOME INCREASES = UY$400-600
29
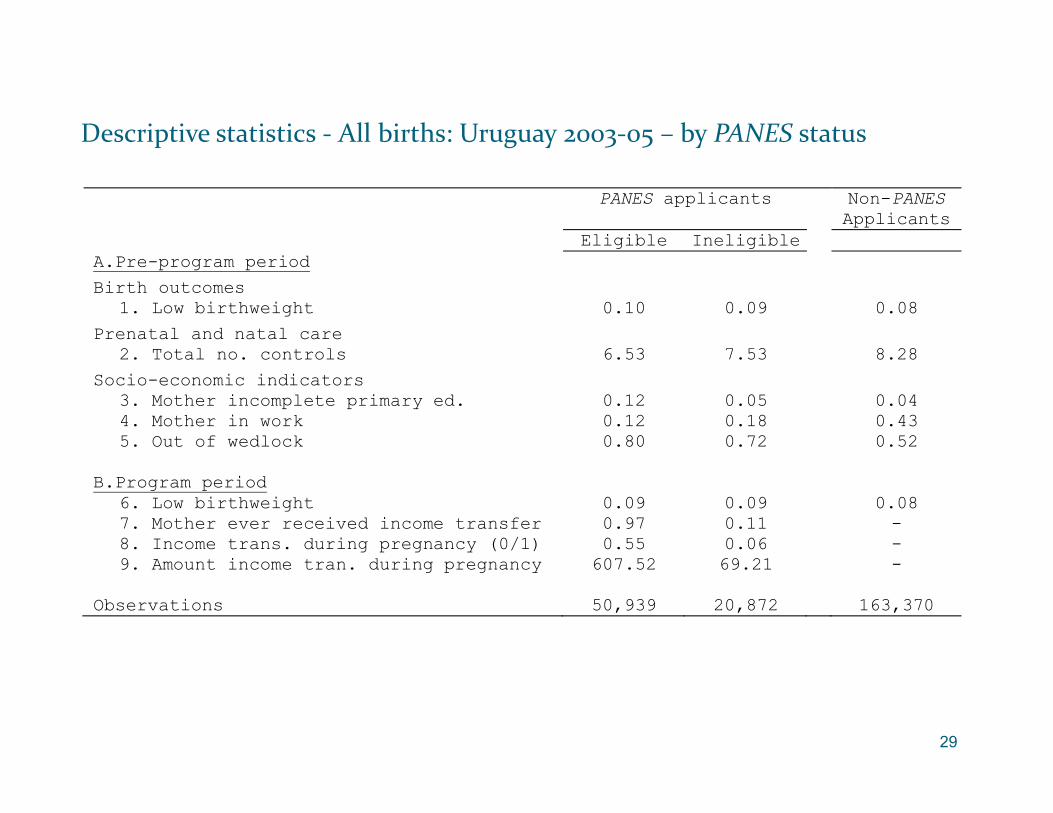
Descriptive statistics - All births: Uruguay 2003-05 – by PANES status
PANES applicants Non-PANES Applicants
Eligible Ineligible A.Pre-program period
Birth outcomes
1. Low birthweight 0.10 0.09 0.08
Prenatal and natal care
2. Total no. controls 6.53 7.53 8.28
Socio-economic indicators
3. Mother incomplete primary ed. 0.12 0.05 0.04 4. Mother in work 0.12 0.18 0.43 5. Out of wedlock 0.80 0.72 0.52
B.Program period
6. Low birthweight 0.09 0.09 0.08 7. Mother ever received income transfer 0.97 0.11 - 8. Income trans. during pregnancy (0/1) 0.55 0.06 - 9. Amount income tran. during pregnancy 607.52 69.21 -
Observations 50,939 20,872 163,370
RD estimates of eligibility on days of work (including zeros) by month