Social assistance in South Africa: Its potential impact on poverty. Submitted in partial fulfilment of the requirements for the degree of Doctor of Philosophy in Development Studies at the Institute for Social Development, University of the Western Cape Supervisors: Prof. P. le Roux and Prof. R. Botman (Full text version but printed in smaller fonts) written by: Claudia Haarmann e-mail: [email protected]date: 30.08.2000
Transcript
Social assistance in South Africa: Its potential impact on poverty.
Submitted in partial fulfilment of the requirements for the degree of
Doctor of Philosophy in Development Studies at the Institute for Social Development,
University of the Western Cape
Supervisors: Prof. P. le Roux and Prof. R. Botman (Full text version but printed in smaller fonts)
Acknowledgments I would like to use this opportunity to thank my promoters Pieter le Roux and Russel Botman for their extraordinary help, support and encouraging friendship during the whole process of this research.
Many thanks to COSATU for initiating this research and for the debate about a comprehensive social security system in South Africa. Special thanks to the members of the reference group for their com-mitment: Oupa Bodibe, Kenneth Creamer, Neil Coleman, Sandy Liebenberg, Neva Makgetla, Ravi Naidoo, Viviene Taylor and Eddie Webster. The discussions, inputs and invaluable comments at the workshops were key to the success of this project.
Thanks to Conrad Barberton, Jacqui Boulle, Kenneth Creamer, Tania Flood, Ute and Hanns Hedrich-Lessing, Sandy Liebenberg, Johann Magerman, and Alison Tilley. First of all for their very special friendship, but also for many critical discussions on the topic which were so essential for the research.
Thanks to Murray Leibbrandt and James Midgley for making time to discuss the research and for their highly appreciated comments.
To the chairperson of the Portfolio Committee on Welfare, Cassim Saloojee: Thanks for the friend-ship, trust and encouragement throughout the process. The discussions enabled me to focus on the needs of the South African people.
Thanks to all my friends and to my family for their special ways of much needed support, encourage-ment and distraction during the last years.
Thanks to the Friedrich Ebert Foundation and the Evangelische Kirche in Deutschland (EKD) for their financial support.
Thanks to Gerhard Haarmann, not only for his computer during the last weeks, but more so for the tireless effort to correct my English grammar.
Last but not least, thanks to Dirk Haarmann for his wonderful love and for the commitment to the work, which made this project possible. But also thanks for all the patience and his computer skills, which carried me through the countless computer breakdowns.
Table of Contents III
Table of Contents ACKNOWLEDGMENTS II
TABLE OF CONTENTS III TABLES V FIGURES VII
ABBREVIATIONS IX
INTRODUCTION 10
CHAPTER 1: FROM A ‘WHITES’ ONLY WELFARE SYSTEM TOWARDS A DEVELOPMENTAL APPROACH12 1.1.) THE BACKGROUND OF SOCIAL SECURITY IN SOUTH AFRICA 12
1.1.1.) History of Social Security in South Africa 12 1.1.2.) The White Paper on Social Welfare and the concept of developmental social welfare 14
1.1.2.1.) The main features of the approach of the White Paper 15 1.1.2.2.) Developmental Social Security 16
1.2.) THE EXISTING PROGRAMMES 16 1.2.1.) Social assistance 18 1.2.2.) Social insurance 19 1.2.3.) Other Programmes 20
CHAPTER 2: SOCIAL SECURITY IN AN INTERNATIONAL CONTEXT - DEFINITIONS, MODELS AND POSSIBLE LESSONS 24
2.1.) DEFINITIONS AND CONCEPTS OF SOCIAL SECURITY 24 2.2.) SOCIAL SECURITY IN DIFFERENT PARTS OF THE WORLD 28
2.2.1.) Social security in capitalist societies 28 2.2.1.1.) History of social security 28 2.2.1.2.) Characteristics and differences of social security in capitalist countries 30 2.2.1.3.) Preconditions and causes of different types of welfare-state regimes 32 2.2.1.4.) Responses to the crisis 33
2.2.2.) Social security in East Asia 33 2.2.2.1.) Distinct features of selected East Asian social security systems 37
2.2.3.) Social security in developing countries 38 2.2.3.1.) Latin America and the Caribbean 38 Problems of social security in Latin America 40 Response to the crisis 40 2.2.3.2.) Africa 42
2.3.) LESSONS FOR SOUTH AFRICA 43 2.3.1.) Lessons from the capitalist countries 43 2.3.2.) Lessons from East Asian countries 44 2.3.3.) Lessons from developing countries 45
CHAPTER 3: THE DATA BASE 46 3.1.) THE CURRENT DATA SITUATION IN SOUTH AFRICA 46
3.1.1.) SALDRU 47 3.1.2.) October Household Surveys 48 3.1.3.) 1996 Census 49 3.1.4.) The data set chosen for this thesis 50
3.2.) THE DEBATE ABOUT THE POPULATION DATA 50 3.3.) REWEIGHTING THE SALDRU DATA 52
3.3.1.) Adjusting the SALDRU data for the time period of 1993 - 1996 according to Sadie 52 3.3.2.) Adjusting the SALDRU data to match the Census 1996 by race and province 53 3.3.3.) Adjusting the SALDRU data to match the Census 1996 by race, age group, and gender. 56
3.4.) FEATURES OF THE ADJUSTED SALDRU DATA 58 3.5.) UPRATING THE SALDRU DATA 61
3.5.1.) Income-, regional and national based CPI figures 62 3.6.) EMPLOYMENT AND INCOME FIGURES IN THE ADJUSTED SALDRU DATA COMPARED TO THE CENSUS 1996 65
Table of Contents IV
3.7.) CONCLUSION 67 CHAPTER 4: BUILDING A MICROSIMULATION MODEL TO EVALUATE POVERTY AND SOCIAL ASSISTANCE IN SOUTH AFRICA 68
4.1.) THE STRUCTURE OF THE MODEL 68 4.2.) ASSEMBLING THE SALDRU DATA 68 4.3.) CREATE POVERTY INDICES 70
4.3.1.) Defining employment and unemployment rates 70 4.3.2.) Defining consumption quintiles and deciles based on adult equivalents 72 4.3.3.) Deprivation index 72
4.4.) THE INCLUSION OF HIV INFECTIONS AND AIDS IN THE MODEL 74 4.5.) CALCULATE AGGREGATED HOUSEHOLD FIGURES AND ANALYSE HOUSEHOLD TYPES 76 4.6.) MODEL CURRENT AND POTENTIAL SOCIAL ASSISTANCE SCHEMES 78 4.7.) ANALYSING THE RESULTS 86
CHAPTER 5: POVERTY, HOUSEHOLD STRUCTURE AND THE CURRENT SOCIAL ASSISTANCE PROGRAMMES 88
5.1.) POVERTY IN SOUTH AFRICA 88 5.1.1.) A comparison of consumption and income measures and a deprivation index 88
5.1.1.1.) Comparing expenditure and income with regard to accuracy in identifying the poor 90 5.1.2.) Summary of the poverty situation in South Africa according to quintiles 92
5.1.2.1.) The percentage of the population living in the different quintiles 98 5.1.2.2.) The division according to ‘race-groups’ within the quintiles 98 5.1.2.3.) The division according to provinces within the quintiles 98 5.1.2.4.) The division according to rural and urban areas within the quintile 98 5.1.2.5.) Analysis of consumption and spending patterns 99 5.1.2.6.) Analysis of various indicators 99
5.2.) HOUSEHOLD STRUCTURE AND POVERTY 100 5.2.1.) The definition of a household 100 5.2.2.) An analysis of the household structure 102 5.2.3.) An analysis of household structure and poverty 104 5.2.4.) HIV/AIDS and its effect on the household structure 107
5.3.) THE POTENTIAL COVERAGE OF THE PRESENT SYSTEM 111 5.3.1.) Household structure, poverty and social assistance programmes 111
5.3.1.1.) The old system 111 5.3.1.2.) The current system 114
5.3.2.) HIV/AIDS, poverty and social assistance programmes 122 5.3.3.) Concluding remarks 129
CHAPTER 6: OPTIONS FOR SOCIAL ASSISTANCE PROGRAMMES IN SOUTH AFRICA 130 6.1.) THE DIFFERENT OPTIONS ARISING FROM THE PUBLIC DEBATE 130 6.2.) THE OPTIONS AND THEIR UNDERLYING CONCEPTS IN THE SOUTH AFRICAN CONTEXT 132
6.2.1.) A Basic Income Grant 132 6.2.2.) Unemployment Benefit 133 6.2.3.) A household grant 134 6.2.4.) The extension of the Child Support Grant 134
CHAPTER 7: THE POTENTIAL IMPACT OF SOCIAL ASSISTANCE ON POVERTY ALLEVIATION AND ECONOMIC DEVELOPMENT 135
7.1.) ANALYSING THE DIFFERENT OPTIONS 135 7.1.1.) A Basic Income Grant 135 7.1.2.) An Unemployment Benefit 141 7.1.3.) A household grant 148 7.1.4.) An extension of the CSG 154
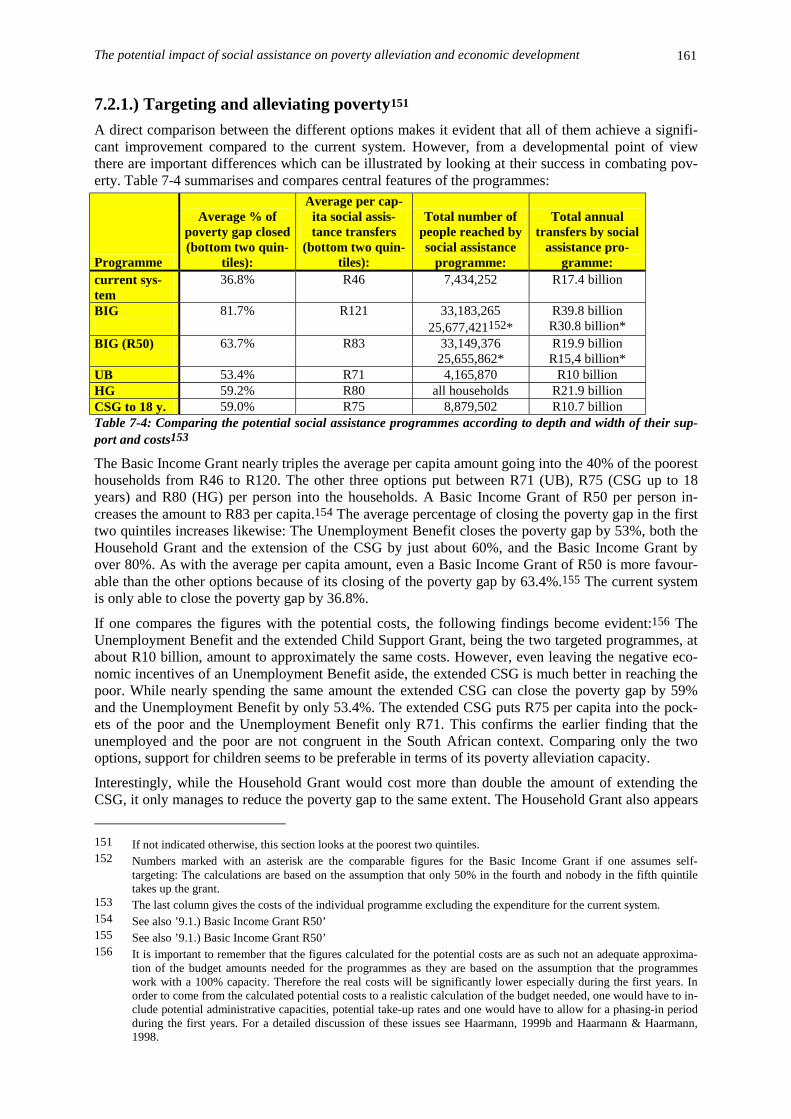
7.2.) AN EVALUATION OF THE IMPORTANT SOCIAL AND ECONOMIC FACTORS 160 7.2.1.) Targeting and alleviating poverty 161 7.2.2.) Economic development, redistribution and costs 165
7.2.2.1.) Evaluating the reliability of the calculations given the data choices made 167 7.2.2.2.) Taxing a Basic Income Grant 168
7.2.3.) Administration 175 7.2.4.) The options in an international context 176 7.2.5.) HIV/AIDS 177
CHAPTER 8: CONCLUSION 180 8.1.) METHODOLOGY 180 8.2.) THE NECESSITY FOR A DECISIVE INTERVENTION 180 8.3.) TOWARDS A COMPREHENSIVE STRATEGY 185
Table of Contents V
ABSTRACT 190
CHAPTER 9: APPENDIX 191 9.1.) BASIC INCOME GRANT R50 192 9.2.) HIV/AIDS AND THE VARIOUS OPTIONS 198
BIBLIOGRAPHY 206
BOOKS 206 JOURNALS, PERIODICALS AND MAGAZINES 209 NEWSPAPER ARTICLES 209 RESEARCH REPORTS, PAPERS AND UNPUBLISHED DOCUMENTS 210
Tables Table 1-1: Current social assistance programmes 19 Table 1-2: Current social insurance programmes 20 Table 1-3: Current other programmes 20 Table 2-1: Chronological order of the introduction of social insurance in Western Europe 29 Table 2-2: Types of welfare regimes according to Esping-Andersen, 1990 31 Table 2-3: Features of East Asian social security systems 36 Table 2-4: Social security systems in Latin America and the Caribbean according to Mesa-Lagos, 1991, 1991a & 1997 39 Table 2-5: Coverage of EAP in different regions according to Gruat as quoted by Sooth, 1992:57-58 43 Table 3-1: Comparison of the total fertility rates (Source: Dorrington, 1999:21) 51 Table 3-2: Comparison of the SALDRU data 1993 vs. Census 1996 according to the distribution of race and province -
without adjustments 54 Table 3-3: Weighting table for the SALDRU data 1993 to Census 1996 according to the distribution of race and province -
with adjustments 55 Table 3-4: Weighting table for the SALDRU data 1993 to Census 1996 according to race, age-group, and gender 57 Table 3-5: Socio-economic CPIs 62 Table 3-6: Regional CPIs 63 Table 3-7: Economic sector amongst the employed aged 15 - 65 years 66 Table 3-8: Individual monthly income amongst the employed, aged 15 - 65 years 66 Table 4-1: Strict and expanded unemployment definition 71 Table 4-2: Classification of the different indicators into ranking groups (Source: Haarmann, D; 1999a:27) 73 Table 4-3: Ranking groups in relation to the poverty line (Source: Haarmann, D; 1999a:31) 74 Table 4-4: Ranking groups in relation to the poverty line 74 Table 4-5: Seven household types 77 Table 5-1: The percentage of the population living in the different quintiles 98 Table 5-2: The division according to ‘race-groups’ within the quintiles 98 Table 5-3: The division according to rural and urban areas within the quintile 98 Table 5-4: Analysis of average consumption and spending patterns 99 Table 5-5: Analysis of various indicators 100 Table 5-6: Household structure 103 Table 5-7: Poverty 106 Table 5-8: Without HIV/AIDS 1996 108
Table of Contents VI
Table 5-9: HIV/AIDS 2011 110 Table 5-10: Social assistance and poverty – the old system 113 Table 5-11: Social assistance and poverty – Potential of the current system 115 Table 5-12: Potential current system 1996 without HIV/AIDS 123 Table 5-13: Potential current system 2011 with HIV/AIDS 125 Table 5-14: Potential current system 2011 with HIV/AIDS – assuming that people with HIV/AIDS receive a Disability Grant
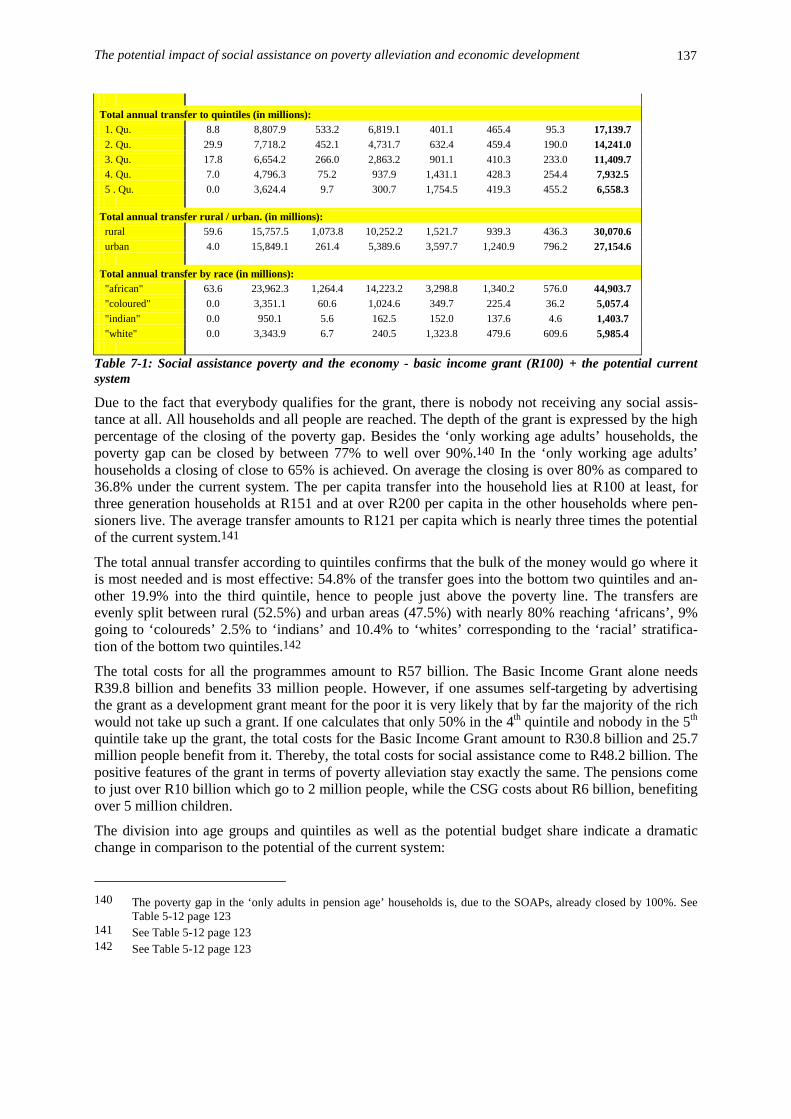
128 Table 7-1: Social assistance poverty and the economy - basic income grant (R100) + the potential current system 137 Table 7-2: Social assistance poverty and the economy – Household Grant (R200) + the potential current system 150 Table 7-3: Social assistance poverty and the economy – extension of CSG (0-18 years) + the potential current system 156 Table 7-4: Comparing the potential social assistance programmes according to depth and width of their support and costs 161 Table 7-5: Comparing the potential social assistance programmes by the average percentage of the poverty gap closed
(bottom two quintiles) 162 Table 7-6: Comparing the potential social assistance programmes by the percentage of people whose poverty gap is fully
closed 163 Table 7-7: Comparing the potential social assistance programmes by the percentage of people living in HH receiving no
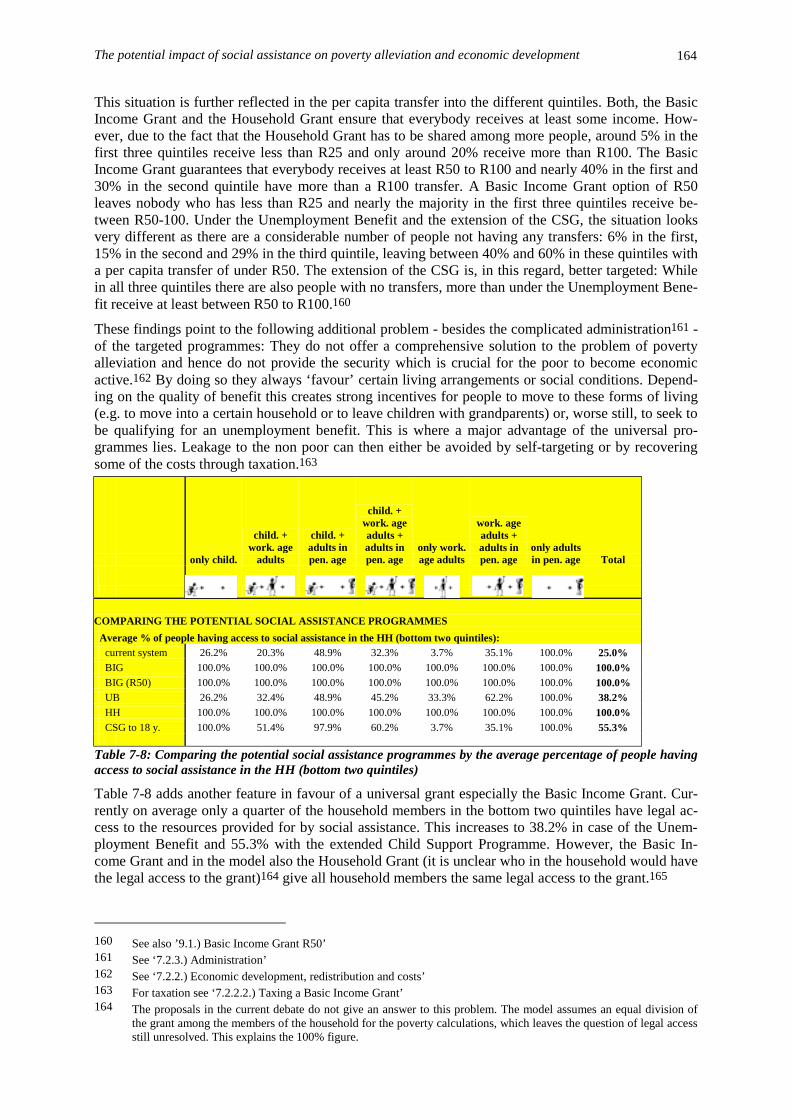
social assistance (bottom two quintiles) 163 Table 7-8: Comparing the potential social assistance programmes by the average percentage of people having access to social
assistance in the HH (bottom two quintiles) 164 Table 7-9: Comparing the potential social assistance programmes according to their rural focus and transfers by race 166 Table 7-10: Percentage in- / decrease in the number of beneficiaries and the total annual transfers, if the programme is run
with SALDRU-age weight instead of SALDRU-prov. weight 167 Table 7-11: Number of beneficiaries and total annual transfers, if the programme is run with SALDRU-prov. Weight
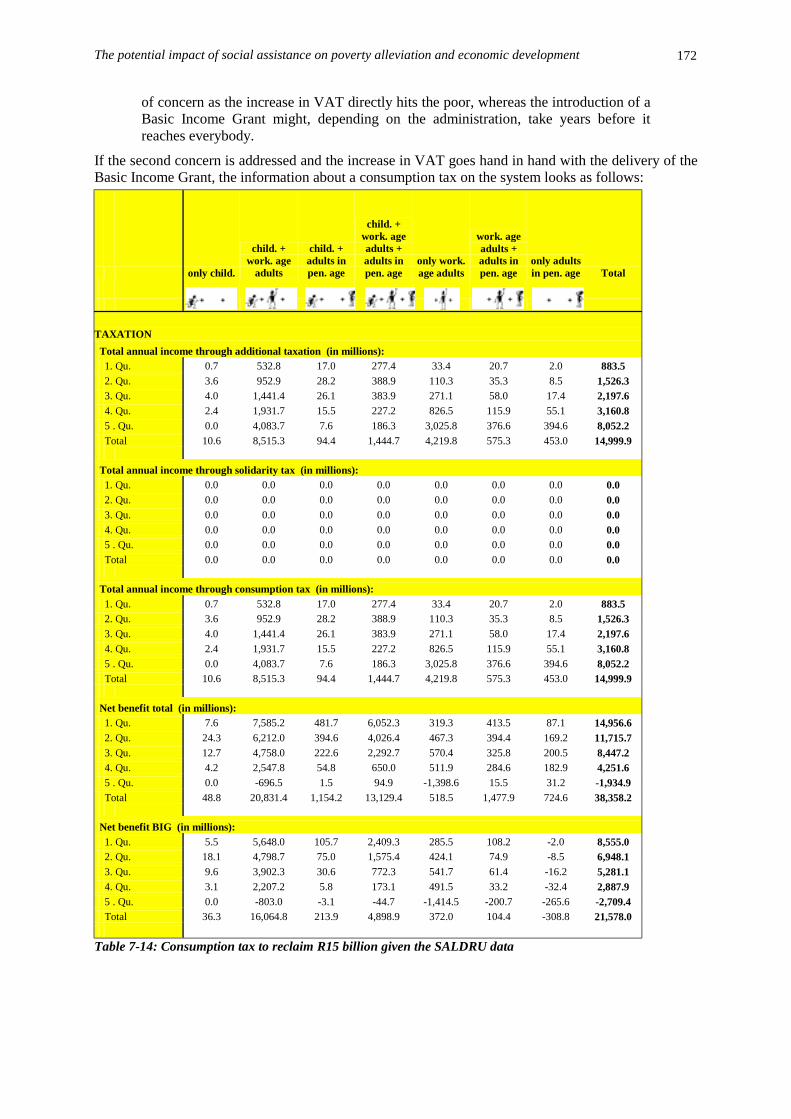
(Default) 168 Table 7-12: Number of beneficiaries and total annual transfers, if the programme is run with SALDRU-age weight 168 Table 7-13: Income tax to reclaim R15 billion given the SALDRU data 170 Table 7-14: Consumption tax to reclaim R15 billion given the SALDRU data 172 Table 7-15: Income tax to reclaim R15 billion + a consumption tax to reclaim R15 billion given the SALDRU data 174 Table 7-16: Comparing the potential social assistance programmes according to depth and width of their support and costs –
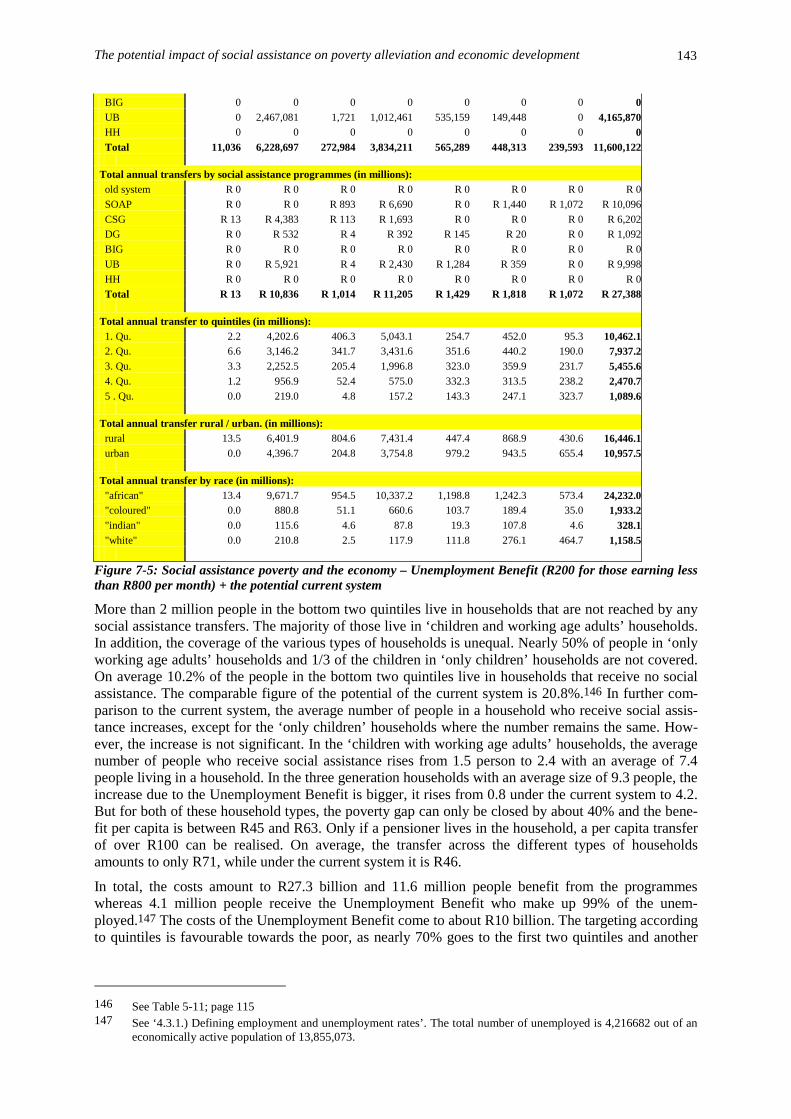
with the effects of HIV/AIDS 2011 177 The Unemployment Benefit while even being far from comprehensive in reaching the adult population in poverty leaves
especially families where a breadwinner has died without support e.g. children living in households where the adults have died (see Table 7-17). The Unemployment Benefit is only able to provide children living on their own with R37 and working age adults with children with R47. Working age adults living on their own receive R80 while all the other households receive more than R100. As such the Unemployment Benefit nor the extended CSG are equipped to address the severe effects of the epidemic on poverty in South Africa. However, the impending HIV/AIDS epidemic in South Africa makes it imperative to now choose a system that is able to provide at least some support for those most affected in society. 178
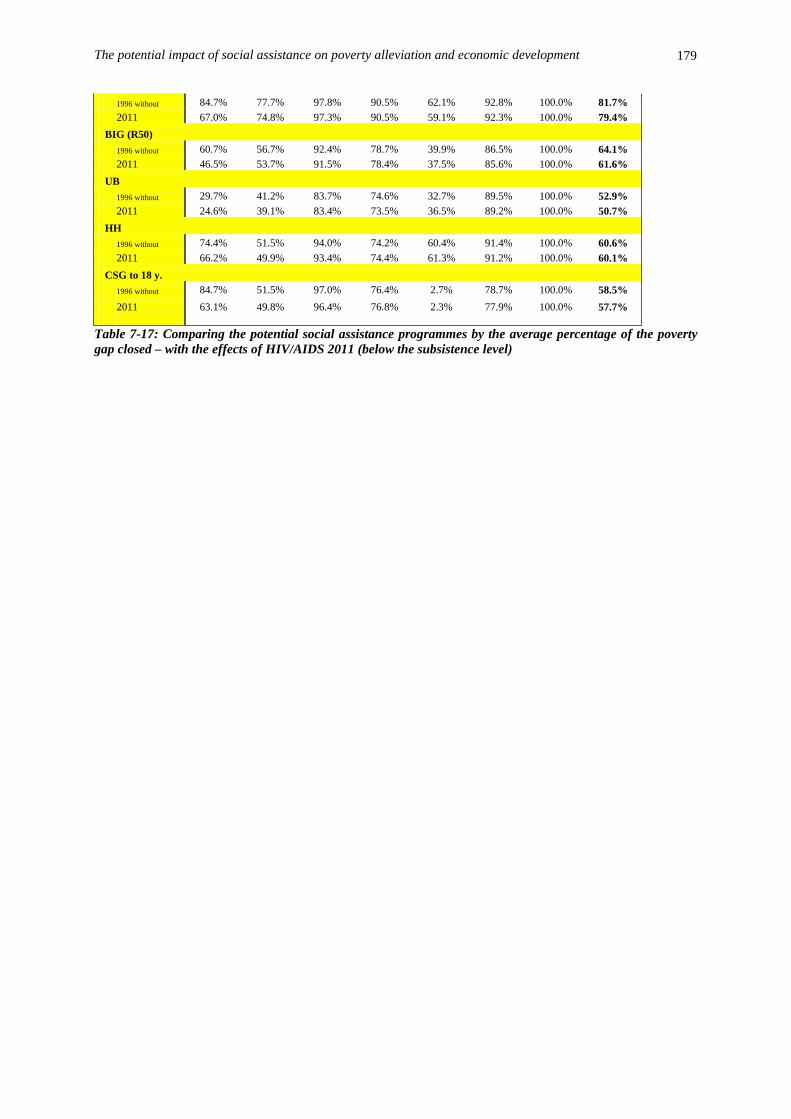
Table 7-18: Comparing the potential social assistance programmes by the average percentage of the poverty gap closed – with the effects of HIV/AIDS 2011 (below the subsistence level) 179
Table 9-1: Error of inclusion of the poor if poverty is measured by expenditure quintiles vs. deprivation index 191 Table 9-2: Error of inclusion of the poor if poverty is measured by income quintiles vs. deprivation index 191 Table 9-3: Social assistance poverty and the economy – Basic Income Grant (R50) + the potential current system 193 Table 9-4: BIG (R100) and HIV/AIDS in 2011 198 Table 9-5: UB and HIV AIDS in 2011 200 Table 9-6: HG and HIV AIDS in 2011 201 Table 9-7: CSG and HIV AIDS in 2011 203 Table 9-8: BIG (R50) and HIV AIDS in 2011 204
Table of Contents VII
Figures Figure 2-1: The ILO-model 26 Figure 3-1: Features of the differently adjusted SALDRU data 59 Figure 3-2: Inflation rate from January 1990 to March 1999 (source data Stats SA) 61 Figure 3-3: Comparison of the national CPI figure with the income- and regional based CPI figures from October 1993 to
October 1996 64 Figure 4-1: Excel default interface page 1 79 Figure 4-2: Excel default interface page 2 80 Figure 4-3: Excel default interface page 3 81 Figure 4-4: Excel default interface page 4 82 Figure 4-5: Programming the SOAP 83 Figure 4-6: Programming the CSG 84 Figure 4-7: Programming the DG 84 Figure 4-8: Programming the BIG 85 Figure 4-9: Programming the Unemployment Benefit 85 Figure 4-10: Programming the HG Grant 86 Figure 4-11: Interface to choose the scenarios calculated 87 Figure 5-1: Differences in capturing the poor: The ranking groups versus consumption quintiles 90 Figure 5-2: Differences in capturing the poor: Ranking groups versus income quintiles 91 Figure 5-3: Number of people in the ranking groups 91 Figure 5-4: The poverty situation in the FIRST quintile 93 Figure 5-5: The poverty situation in the SECOND quintile 94 Figure 5-6: The poverty situation in the THIRD quintile 95 Figure 5-7: The poverty situation in the FOURTH quintile 96 Figure 5-8: The poverty situation in the FIFTH quintile 97 Figure 5-9: Potential coverage through existing programmes according to age and quintiles 117 Figure 5-10: Potential per capita social security transfers to households 119 Figure 5-11: Potential reduction of poverty gap in percentage according to quintiles, budget share spent in quintiles and
percentage of people who do not live under poverty line 120 Figure 5-12: Total monthly income distribution per adult equivalent - potential of the current social assistance system (dotted
line = without any social assistance programme) 121 Figure 5-13: Total monthly income distribution per adult equivalent - potential of the current social assistance system and the
impact of HIV/AIDS in 2011 (dotted line = potential of the current social assistance system without HIV/AIDS) 126 Figure 5-14: Total monthly income distribution per adult equivalent - potential of the current social assistance system and the
impact of HIV/AIDS in 2011 - assuming that people with HIV/AIDS receive a disability grant (dotted line = potential of the current social assistance system without HIV/AIDS) 129
Figure 7-1: Potential coverage by age group and quintile - basic income grant (R100) + the potential current system 138 Figure 7-2: Potential social assistance transfers per capita - basic income grant (R100) + the potential current system 139 Figure 7-3: Potential reduction of poverty gap - basic income grant (R100+ the potential current system 140 Figure 7-4: Total monthly income distribution per adult equivalent - basic income grant (R100) + the potential current system
(dotted line = only potential of the current social assistance system) 141 Figure 7-5: Social assistance poverty and the economy – Unemployment Benefit (R200 for those earning less than R800 per
month) + the potential current system 143 Figure 7-6: Potential coverage by age group and quintile – Unemployment Benefit (R200 for those earning less than R800
per month) + the potential current system 145 Figure 7-7: Potential per capita social assistance transfers – Unemployment Benefit (R200 for those earning less than R800
per month) + the potential current system 146
Table of Contents VIII
Figure 7-8: Potential reduction of poverty gap – Unemployment Benefit (R200 for those earning less than R800 per month) + the potential current system 147
Figure 7-9: Total monthly income distribution per adult equivalent – Unemployment Benefit (R200 for those earning less than R800 per monthly) + the potential current system (dotted line = only potential of the current social assistance system) 148
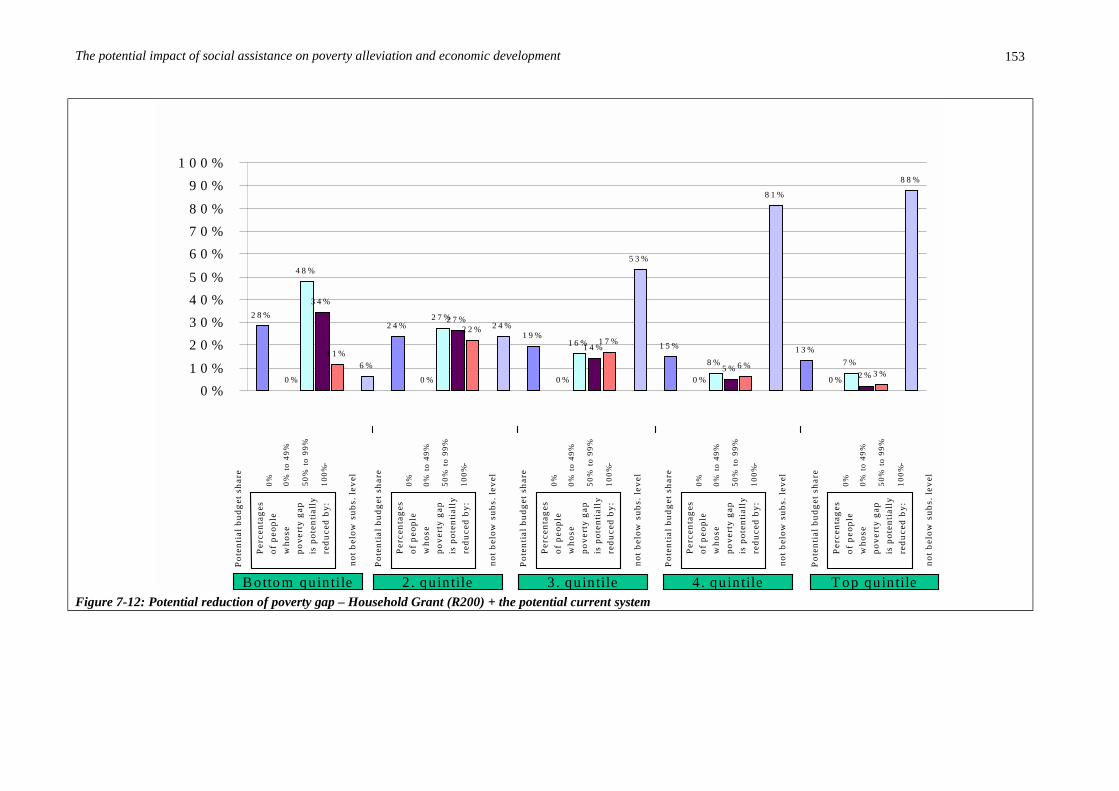
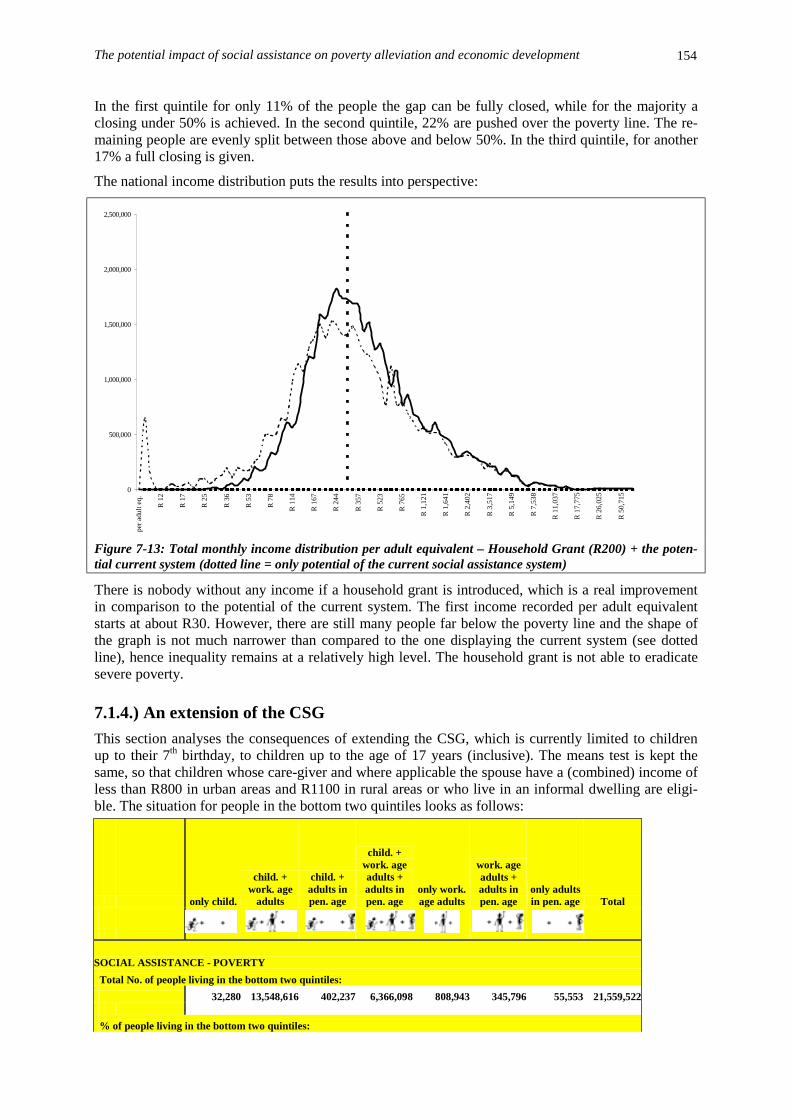
Figure 7-10: Potential coverage by age group and quintile – Household Grant (R200) + the potential current system 151 Figure 7-11: Potential per capita social assistance transfers – Household Grant (R200) + the potential current system 152 Figure 7-12: Potential reduction of poverty gap – Household Grant (R200) + the potential current system 153 Figure 7-13: Total monthly income distribution per adult equivalent – Household Grant (R200) + the potential current system
(dotted line = only potential of the current social assistance system) 154 Figure 7-14: Potential coverage by age group and quintile – extension of CSG (0-18 years) + the potential current system 157 Figure 7-15: Potential per capita social assistance transfers – extension of CSG (0-18 years) + the potential current system158 Figure 7-16: Potential reduction of poverty gap – extension of CSG (0-18 years) + the potential current system 159 Figure 7-17: Total monthly income distribution per adult equivalent – extension of the CSG (0-18 years) + the potential
current system (dotted line = only potential of the current social assistance system) 160 Figure 7-18: Total monthly income distribution per adult equivalent - income tax to reclaim R15 billion given the SALDRU
data (dotted line = Basic Income Grant without taxation) 170 Figure 7-19: Net effect of a Basic Income Grant and a consumption based tax 171 Figure 7-20: Total monthly income distribution per adult equivalent - consumption tax to reclaim R15 billion given the
SALDRU data (dotted line = Basic Income Grant without taxation) 173 Figure 7-21: Total monthly income distribution per adult equivalent - income tax to reclaim R15 billion + a consumption tax
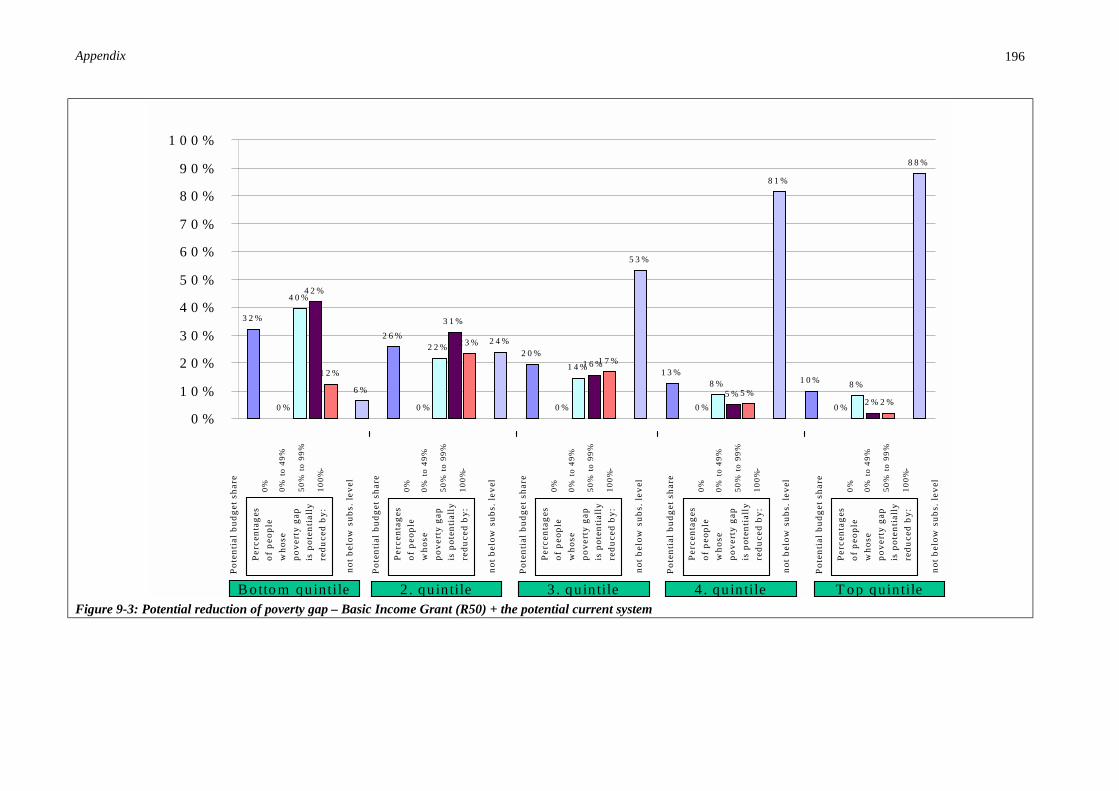
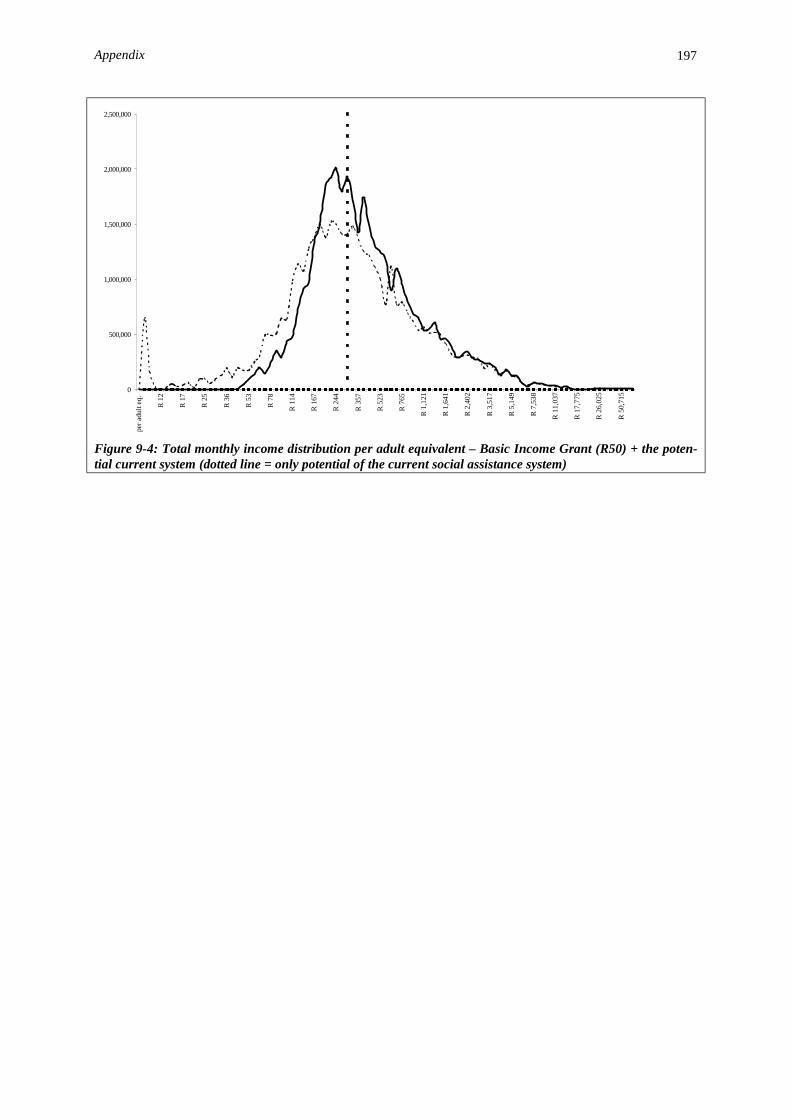
to reclaim R15 billion given the SALDRU data (dotted line = Basic Income Grant without taxation) 174 Figure 9-1: Potential coverage by age group and quintile – Basic Income Grant (R50) + the potential current system 194 Figure 9-2: Potential per capita social assistance transfer – Basic income grant (R50) + the potential current system 195 Figure 9-3: Potential reduction of poverty gap – Basic Income Grant (R50) + the potential current system 196 Figure 9-4: Total monthly income distribution per adult equivalent – Basic Income Grant (R50) + the potential current system
(dotted line = only potential of the current social assistance system) 197 Figure 9-5: Total monthly income distribution per adult equivalent – BIG (R100) and HIV/AIDS in 2011 (dotted line = only
potential of the current social assistance system with HIV/AIDS in 2011) 199 Figure 9-6: Total monthly income distribution per adult equivalent – UB and HIV AIDS in 2011 (dotted line = only potential
of the current social assistance system with HIV/AIDS in 2011) 200 Figure 9-7: Total monthly income distribution per adult equivalent – HG and HIV AIDS in 2011 (dotted line = only potential
of the current social assistance system with HIV/AIDS in 2011) 202 Figure 9-8: Total monthly income distribution per adult equivalent – CSG and HIV AIDS in 2011 (dotted line = only
potential of the current social assistance system with HIV/AIDS in 2011) 203 Figure 9-9: Total monthly income distribution per adult equivalent – BIG (R50) and HIV AIDS in 2011 (dotted line = only
potential of the current social assistance system with HIV/AIDS in 2011) 205
Abbreviations IX
Abbreviations ANC African National Congress ASSA Actuarial Society of South Africa BIG Basic Income Grant COIDA Compensation for Industrial Accidents and Diseases COSATU Congress of South African Trade Unions CPF Central Provident Fund CPI Consumer Price Index CSG Child Support Grant CSS Central Statistical Services DG Disability Grant DIB Demographic Information Bureau DP Democratic Party EA Enumerator Areas EAP Economic Active Population ESD Enumerator Sub-Districts FFC Fiscal and Financial Commission GDP Gross Domestic Product GEAR Growth Employment and Redistribution GNP Gross National Product HG Household Grant HH Household HSL Household Subsistence Level ILO International Labour Organisation IMF International Monetary Fund LAC Latin America and the Caribbean LSMS Living Standards Measurement Survey NGO Non Governmental Organisation NIEP National Institute for Economic Policy OHS October Household Survey PAC Pan African Congress PES Post Enumerate Survey PIR Poverty and Inequality Report PSNP Primary School Nutrition Programme RDP Reconstruction and Development Programme SA South Africa SALDRU Southern Africa Labour and Development Research Unit SANGOCO South African NGO Coalition SAP Structural Adjustment Programme SMG State Maintenance Grant SOAP State Old Age Pension STD Sexual Transmitted Disease TBVC states former so called 'independent' states: Transkei, Bophuthatswana, Venda and Ciskei UB Unemployment Benefit UIF Unemployment Insurance Fund UN United Nations UNAIDS United Nation AIDS Program UPE University of Port Elizabeth
Introduction 10
Introduction The democratic South Africa inherited a fragmented social security system which was not based on comprehensive coverage for the population as a whole, but started as a social security net for mainly 'whites'.1 Although it has been extended to other groups over time, the coverage remains inadequate. The White Paper on Social Welfare adopted by the new government commits itself to an integrated and national comprehensive social security system (White Paper, 1997:51) and states that every South African should have a minimum income, sufficient to meet basic subsistence needs, and should not live below minimum acceptable standards. (White Paper, 1997:49). The constitution supports this goal by entrenching the rights to social security and appropriate social assistance. [s 27 (1)(c); (2)]
This commitment was made in a situation where the majority of the population faced severe poverty. The Reconstruction and Development Programme (RDP) document 'Key Indicators in South Africa' identifies 52% of the population as living in poverty (World Bank, 1995). Government's most recent study on poverty estimates that about 19 million people are poor, given a monthly household expendi-ture level of below R353 per adult equivalent (Poverty and Inequality Report, 1998:5).
This research systematically evaluates the links between social assistance and poverty alleviation in the South African context and, taking the commitment of government as its starting-point, aims at revealing potential routes for the future. The focus of the research is on the analysis of the current so-cial assistance system, its potentials and its gaps, as well as on options of extending social assistance to those poor who are not included in the current social assistance provisions. The analysis is based on an evaluation of the impact of social assistance on various social, economic and developmental fac-tors.
First and foremost, the ability of different programmes to target the poor and vulnerable and to change their poverty situation is looked at. This goes hand in hand with a scrutiny of the links between pov-erty and different household structures in South Africa, establishing which kind of household is more likely to live in poverty than another type, and how to reach such a type of household most effectively. Furthermore, the redistributive potential of different options is analysed by observing the changes they would entail in the overall income distribution and how they in this way would contribute to the reduc-tion of inequality. Another crucial point is the question of how far these options are able to reach and put resources into the often underdeveloped rural areas in South Africa. This is closely connected to a discussion about the wider economic factors of social assistance, by not only calculating the financial costs of the programmes but by pointing to the economic benefits like their potential for economic development in rural areas, or an increase in productivity.
Given the high HIV infection rate in South Africa, the research further attempts to integrate the impact of the epidemic on poverty, the household structure, and the resulting implications for social assis-tance.
The research is informed by and draws on a study done by Dirk Haarmann and the author for the Con-gress of South African Trade Unions on a comprehensive social security system, which was compiled at the end of 1997 and in the beginning of 1998. This thesis further develops these ideas and adds new aspects and more in depth analyses. It is hoped that in this way the current debate about the extension of social assistance will be enhanced.
Qualitative and quantitative methods will be applied throughout the research. Besides a review of na-tional and international literature on the subject, the data of the Project for Statistics on Living Stan- 1 The author regards racial naming as in itself racist and hence it should in principle be avoided. However, in a study of
this nature the author felt compelled to use this terminology in order to be able to describe the different social realities created by the apartheid regime. Ironically, one thus has to use racist terminology to analyse the injustice still present in today’s South Africa.
Introduction 11
dards and Development (PSLSD), collected by the Southern Africa Labour and Development Re-search Unit (SALDRU) at the University of Cape Town in co-operation with the World Bank in Octo-ber 1994, is used.
Based on this data set a microsimulation model is built for the evaluation of the different policy op-tions. This model is used to assess the social, financial, economic and developmental impact of the different options. Here, also the SALDRU data is needed to evaluate the impact on a household level.
The dissertation starts with a description of the current social assistance system in South Africa. It outlines its history, which dates back to the beginning of the century, as well as the recent policy de-velopments and efforts of the new government. In order to get an overview of the programmes which are currently in place, a detailed synopsis of the existing programmes is given.
Chapter 2 provides an international perspective to the debate on social security. Different definitions and concepts are discussed and various systems throughout the world are described. The final part of the second chapter draws lessons from this for the current South African situation.
Chapters 3 and 4 explain in detail the quantitative methods applied. Chapter 3 clarifies the choice for the SALDRU data and discusses the different weights (population and income) used to update the data to 1996 standard by evaluating them against other data bases in South Africa. Given the fact that the latest census was done in 1996, it was decided for comparative reasons to do the research on this stan-dard. Chapter 4 specifies how the microsimulation model was built to evaluate the current poverty situation in South Africa as well as the social, economic and financial impact of the current system as well as of the different options. Here also the incorporation of the projections of the influence of HIV/AIDS in the model is outlined.
To start with, Chapter 5 provides an in depth analysis of the current poverty situation in South Africa combines this with an examination of prevailing household structures. Furthermore, by projecting the influence of HIV/AIDS for the next 15 years, the impact of the epidemic on poverty and the various types of households is looked at. The final part illuminates the potential impact of the current social assistance programmes on poverty. By doing so, their current potential in poverty alleviation, redistri-bution and targeting those affected by HIV/AIDS are described and the gaps in the coverage of the current system are clearly identified. This provides the basis for a further discussion and analysis of the different options for the extension of the current system.
Chapter 6 delineates the different options for such an extension that have been brought forward by various role players in the public debate and deliberates on their concepts and underlying logic .
This discussion is followed in Chapter 7 by an in depth analysis of each one of the different options. Here, by applying the same tools and procedures as in Chapter 5, the potential of the different options in terms of their poverty alleviation and redistributive ability, their targeting of different groups, needs and household structures is analysed. The costs and the distribution of resources into different sectors and areas are calculated. Furthermore, a second part analyses and compares the different options di-rectly, grouping and summarising their potential according to various social, economic and develop-mental factors. This part also includes an analysis of how to use the tax system as a method of clawing back some of the money.
The concluding Chapter 8 recapitulates and sums up the findings of the thesis.
From a ‘whites’ only welfare system towards a developmental approach 12
Chapter 1: From a ‘whites’ only welfare system towards a developmental approach This chapter starts by outlining the history of social security in South Africa. Doing so it sets the con-text in which the first democratically elected government developed the White Paper for Social Wel-fare. The chapter then summarises the content and aims of the overall policy directions as formulated in the White Paper. The last section describes in detail the current programmes and explains the strate-gies and the important changes made to the programmes by the Welfare department in the last four years from a policy point of view. It also outlines the UIF and other social programmes which belong to the broader social security milieu. The social assistance programmes are then analysed in Chapter 5 in terms of the coverage they provide for the poor.
1.1.) The background of social security in South Africa South Africa inherited a fragmented social security system. Its main objective was to protect 'whites' against certain contingencies either by way of social insurance or social assistance. In the past, the purpose of extending parts of the system to other groups was not to create a comprehensive coverage for the whole population, but was often determined by political, electoral and economic considera-tions.2
1.1.1.) History of Social Security in South Africa The main features of the social security system, namely short-term benefits for workers which are financed by contributions, and social assistance for the elderly, disabled and children, financed by the state, started as early as 1910.3 'Formal' social security schemes first introduced benefits for workers and maintenance for children. The Workmen's Compensation Act of 1914 and the Children's Protec-tion Act of 1913 regulated these benefits. Workers could claim income support in case of illness and injuries sustained at work. Parents could receive maintenance grants. Although formally 'urban afri-cans' were included in the maintenance system, Bhorat (1995:595) points out that:
Very few of these grants reached African parents and none were given to rural Africans.
The provision for the elderly was introduced in 1928 through the Old Age Pensions Act. It provided grants for 'coloureds' and 'whites'. The exclusion of 'africans' was based on the argument that rural kinship provides security in the old age. In 1937, the same racial groups benefited from the introduc-tion of a disability grant, which evolved out of the pensions for blind persons (Bhorat, 1995:596). Old-age pensions and disability grants were extended to 'indians' and 'africans' in 1944 and 1947 respec-tively. However, inequality on the basis of race remained due to the level of the grants.
In 1947, the maximum pension for whites was five times that of Africans. Coloured and Indian pensioners were paid half as much as whites. (Bhorat, 1995:597)
2 See Van der Berg, 1994 3 South Africa also has occupational retirement insurance in form of pension funds, which started in the 1920s. The
1956 Pension Funds Act and in the 1960s and early 1970s coverage was extended to 'black' workers. However, the majority of the black labour force, who are either unemployed or in jobs not covered by social retirement insurance, remain outside the security net. (Van der Berg, 1997:486) The future development of this insurance is important in particular with regard to the SOAPs. However this is a long-term issue, and due to the focus of the research on social assistance, the pension funds are not discussed in further detail.
From a ‘whites’ only welfare system towards a developmental approach 13
The support for children developed in a similar manner. The Children's Act of 1937 extended the cov-erage of the maintenance grants, but still 'whites' benefited most.4
At the same time the Unemployment Benefit Act was passed. This first scheme was industry-based. It covered 88 000 workers, but excluded agricultural, domestic and mining workers as well as 'african' workers earning less than 78 pounds per annum. In 1946, the Unemployment Insurance Act replaced the former with an unemployment insurance on a national scale (Weth, Naidoo, Shipman, 1996:App2:28). It removed the 78 pounds restriction, but the other exclusion remained and as Van der Berg (1994:40) points out:
Until the late 1970s, the UIF usually did not cover black workers.
The Workmen's Compensation Act was also subject to a change in 1941. (…) [it] nullified workers' common law rights in favour of administrative provisions, insured all employ-ees irrespective of payment of the levy by employers and increased the number of diseases covered by the law. (Bhorat, 1995:597)
These and other changes by the United Party were described by Schneider and Marshall (1998:9) as (…) rudimentary, imperfect attempts at extending social security provisions to all races.
However, when the National Party came to power in 1948, it reversed even these imperfect attempts and instead tried to protect white workers from the rapidly urbanising 'african' workforce (Bhorat, 1995:597). The National Party introduced a minimum income level for 'africans' to qualify for benefits from the Unemployment Insurance Fund, and by doing so effectively excluded them. Hence the bene-fits for 'africans' decreased continuously and by 1954 most of the resources in the fund were paid to 'whites'.
A similar development took place in the social assistance scheme. While 'white' state old-age pensions saw a constant increase over the years, 'african' pensions were reduced and the gap between the two grew steadily until 1971.5 The situation was aggravated by the fact that there were eleven different pension rates until 1960 and eight afterwards. Discrimination was further reinforced through adminis-trative delays, corruption, and inefficiency, particularly in rural areas.
In the beginning of the 1970s, the economy started to stagnate and this influenced social policy as well: The period between 1972 until 1990 is often described as a trend towards re-incorporation and reduced inequality (Van der Berg, 1994:3).6 Bhorat (1995:600) argues that the National Party realised the economic imperative to integrate 'blacks' into the economy and this entailed changes to the social security system.
Job reservation laws were abandoned. Trade Unions for blacks could be registered (…). It was accepted that fiscal intervention in social services needed to be based on need rather than race.
In 1977, the racial differentiation of benefits from the Unemployment Fund was removed, but the in-come restriction remained in place. On the side of state social assistance, 'african' old-age pensions were increased, so that by 1993 these pensions had reached a level of 85% of 'white' pensions.7 How-ever, one has to bear in mind that this process included the erosion of the 'white' pension level, as fis-cal constraints would not allow a 'topping-up'. Van der Berg (1994:4) points to the fact that the nega-tively effected group - poor elderly 'whites'- was politically marginal and hence this change was possi-ble without 'fear of political backlash' (Van der Berg, 1994:4). With regard to maintenance and foster care grants, fiscal considerations are said to be the reason why there was not any tangible change dur-ing that period.
African grants were 17 per cent of white grants in 1987. (Bhorat, 1995:600)
Furthermore, the discrimination within the administration of these grants remained, excluding most 'africans' by way of inefficiency and inequitable delivery (Lund Report, 1996:10). This situation was
4 In 1942 59,5% of 'white' children in comparison to 0,9% of 'african' children received maintenance grants. (Kruger as
quoted in Bhorat, 1995:596) 5 Bhorat, 1995:598-599 6 See also Nattrass & Seekings, 1997:464 7 See Bhorat, 1995:600
From a ‘whites’ only welfare system towards a developmental approach 14
supported and aggravated by the complicated structure of the administration in which different de-partments were responsible for national strategy on the one hand and delivery to the different popula-tion groups on the other hand. The 'homelands' again had their own structure (Luiz, 1995:585).
Surveying the history of social security in South Africa, one can realise that the new government took over a very unusual system: The rationale behind the system was first and foremost to provide social security to a ‘white’ minority. The development of the system was also financially possible as it was only meant to cover a minority. From a comparative point of view, some of the features created for the 'white' population are similar to parts of the system in industrialised countries. ‘White’ people had social insurance-based-access to unemployment and sickness benefits, as well as to compensation benefits in case of work related accidents and illness. Social assistance covered old age and disability for the uninsured and maintenance for families with children in case of a nuclear family break up. However, these benefits in so far differ from the ones in industrialised countries, as the intended bene-ficiaries - due to apartheid policies like job reservation - faced very different circumstances from em-ployees in industrialised countries. For example, the relatively short period covered by unemployment benefits8 is explicable from a 'white' employee's perspective, who was very likely to find a new job in that period, whereas the comparable period for an employee in an industrialised country is considera-bly longer. The unintended extension of parts of the system to other ‘population’ groups over time therefore has two sides: On the one hand it did not take account of their circumstances and hence did not cover their needs. On the other hand, the extension of the SOAPs has put South Africa in an ex-traordinary situation:
It (South Africa) is one of the few countries in the world which provides social old age pensions to every one in need … (Le Roux, 1996:59)
The new government was hence faced with the task of developing an approach that transformed the existing system in two ways: It had to be able to use and build on the positive aspect of the current system. Furthermore, it had to change current programmes and develop new features and benefits in such a way that they serve the population as a whole and are based on the circumstances and needs in South Africa.
The next section outlines the approach adopted by the first democratically elected government and summarises the basic principles and policy strategies.
1.1.2.) The White Paper on Social Welfare and the concept of developmental so-cial welfare In line with the policies of the RDP, the approach which the first democratically elected government chose, is based on the concept of developmental social welfare as it has emerged from the World Summit for Social Development in 1995, and as defined by J. Midgley.9 The White Paper on Social Welfare, which was written in 1996 and gazetted in 1997, contains the policy framework for the re-structuring of social welfare in South Africa on the basis of the concept adopted.
The policy makers did not only face the challenge of formulating strategies to restructure the existing social security system, they also had to address another, though interrelated, legacy of the apartheid regime; poverty. Chapter 5 provides an in-depth analysis of poverty in South Africa, but the following gives a first impression of the extent of poverty: Poverty in South Africa is severe and apartheid poli-cies have created a country that still today has one of the highest income inequalities in the world. While South Africa is, according to its per capita income, a middle-income country, its social indica-tors (health, education, safe water, fertility etc.) are comparable with those of some low-income sub-Saharan African countries (World Bank, 1995:3). Over 50% of the population live in the poorest 40% of households. In 1993, these households had an expenditure level of below R301 per month per adult equivalent (World Bank, 1995:8). Poverty in South Africa has a strong rural, age and gender dimen-sion: 75% of the poor live in rural areas, 60-70% of children under the age of 7 live below any com-
8 See ‘1.2.2.) Social insurance’ 9 See: Midgley, 1993, 1995 & 1996; White Paper, 1997:93
From a ‘whites’ only welfare system towards a developmental approach 15
monly defined poverty line (Haarmann, D, 1999a:48) and female-headed households have a 50% higher poverty rate than male-headed households (World Bank, 1995:4-14).
While the task of formulating a new policy in this context was formidable, at the same time it opened the historic chance of looking afresh at the role and the vision of welfare, so to speak from scratch. The White Paper documents the outcome of an important shift in the understanding and role of welfare in the South African context today.
1.1.2.1.) The main features of the approach of the White Paper
The main feature of the developmental approach is that social development and economic develop-ment are interdependent and mutually reinforcing. It acknowledges that economic growth without social development is meaningless, as growth on its own does not benefit the whole population. By the same token, social development cannot take place without economic development (Midgley, 1996:3).
The White Paper on Social Welfare bases its policy framework on this interrelationship between social and economic development:
Social security, social services and related social development programmes are investments which lead to tangible economic gains and in turn lead to economic growth. Without such social investments economic growth will be compromised. (…) Welfare expenditure will only be able to expand as higher economic growth rates are achieved. (…) Understanding the impact of social spending on growth is critical to en-sure that trade-offs do not bias spending against social development or growth. (White Paper, 1997:15)
This basic principle entails that welfare is not only concerned with needy individuals, but has a broader perspective. It looks at wider social processes and structures and aims at changes in the soci-ety as a whole. The collaboration of social and economic agencies is strongly advocated to harmonise their interventions and to develop and put in place strategies that ensure the use of economic growth for the reduction of poverty and inequality. This is needed to prevent 'distorted development'; a situa-tion in which the economy grows but poverty and inequality are not being reduced (Midgley, 1995:4). The meeting of the basic needs of the people through redistributive social service programmes as well as job creation programmes and self-employment programmes that foster people's participation in the economy are examples of such strategies (Midgley, 1996:3; White Paper, 1997:18). At the same time, the positive impact of social programmes on economic development must be ensured. Mobilisation of human capital and opportunities for productive employment can fulfil this task as they are able to gen-erate rates of return (Midgely, 1996:3; White Paper, 1997:18). The White Paper very clearly spells out its goal with regard to poverty reduction and human capital development:
Social welfare policies and programmes will be developed which will be targeted at poverty prevention, alleviation and reduction and the development of people's capacity to take charge of their own circum-stances in a meaningful way. (White Paper, 1997:18)
These strategies are backed by the strong belief in intervention into the economy and the social sphere. (…) [S]ocial development thinkers believe that societies can be improved through direct action. (Midgley, 1995:84)
The approach further promotes the involvement of different agents at different levels, namely indi-viduals, communities and government. The different agents should apply different strategies according to their potential: Individuals can get engaged in an enterprise approach, communities can foster community development and participation, while national programmes like a basic needs strategy, the redistribution of resources, or a sustainable development strategy lie in the sphere of the government (Midgley, 1995:103+138).
To achieve the application of different strategies, an institutional perspective is adopted, which com-bines the different strategies and creates a multi-strategy approach. Government plays a key role by bringing the various role-players together. That includes business and labour, especially when it comes to the harmonisation of social and economic policies. Likewise, the co-ordination of the different strategies of NGOs, communities, and local structures is important. The strength of such an approach lies in the usage of different forces within society for the welfare of all people as well as in the foster-ing of the participation of the people concerned. The White Paper on Social Welfare (1997:30) ex-plains the vision for the facilitation of that process as follows:
From a ‘whites’ only welfare system towards a developmental approach 16
Government will facilitate the development of an inclusive and effective partnership with all the role-players in civil society (…). The resources and the unique characteristics of each of the partners will be harnessed to maximum effect. Underpinning the partnership is the recognition of the role of organisa-tions of civil society as essentially developmental and as strengthening democracy.
The ultimate goal of this policy and the underlying approach is to facilitate the provision of appropriate developmental social welfare services to all South Africans, es-pecially those living in poverty, those who are vulnerable and those who have special needs. These ser-vices should include rehabilitative, preventative, developmental and protective services and facilities, as well as social security, including social relief programmes, social care programmes and the enhancement of social functioning. (White Paper, 1997:15)
1.1.2.2.) Developmental Social Security
The restructuring of the social security system as part of the overall social welfare system is also based on the concept of developmental social welfare. The White Paper defines the role of social security as follows:
A social security system is essential for healthy economic development, particularly in a rapidly changing economy, and will contribute actively to the development process. In a society of great inequality the so-cial security system can play a stabilising role. It is important for immediate alleviation of poverty and is a mechanism for active redistribution. (White Paper, 1997:51)
To fulfil this vision, the government committed itself to the provision of a comprehensive national social security system which was to be built on two pillars:
Firstly, it will require comprehensive social assistance to those without other means of support, such as a general means tested social assistance scheme. Secondly, it will require the restructuring of social insur-ance (…) (White Paper, 1997:51)
Social security is to intervene if firstly a person is - for various reasons - unable to avoid poverty or secondly, children have to be maintained (White Paper, 1997:48).
In the context of 'Third World Poverty', Midgley (1993:136) assigns different functions to the different elements of the social security system. Social insurance has a preventive, social assistance and allow-ances mainly an ameliorating, and human capital mobilisation a developmental function.
Midgley, (1993:140) highlights the importance of social assistance as a poverty alleviation pro-gramme:
The use of social assistance as a subsidizing mechanism has relevance for policymakers who are seeking to identify ways of targeting low-income groups
He points out that it is imperative to extend coverage of social assistance schemes to the poor and vul-nerable. Often ineffectiveness and poor administration hamper the success of a social security system as a tool for poverty alleviation. Resolving these problems enhances the developmental function of the system, as resources are more effectively used and they reach the people in need (Midgley, 1993:141). The White Paper stresses this point by committing government to administrative improvements and the creation of an information system for cost effectiveness (White Paper, 1997:52).
In conclusion it becomes obvious that South Africa did not only undertake to restructure the existing welfare system in an equitable and non-racial way but also to radically redefine the role and responsi-bilities of welfare. As pointed out above, the unintended extension of the welfare system in the past - originally intended to serve a minority who normally had stable and high paying employment and low levels of poverty - poses a particular challenge to the restructuring. Moreover, South Africa committed itself to proactively use and devise welfare as a poverty alleviation programme, linking social and economic development strategies and assigning an interventionist role to the state to bring about change and well-being in society as a whole.
1.2.) The existing programmes This section describes the existing social assistance and social insurance programmes which are tar-geted at the poor and disadvantaged (e.g. long-term unemployed, children, etc.) in South Africa. Pri-
From a ‘whites’ only welfare system towards a developmental approach 17
vate pensions and medical funds will therefore not be considered any further as they provide social security for people in formal employment.
The following table indicates the kind of programmes existing at the moment and who qualifies for them.10
10 Only the most important conditions and elements of the programmes are explained.
From a ‘whites’ only welfare system towards a developmental approach 18
1.2.1.) Social assistance Who is eligible? What does the benefit provided look like?
Amount Duration
a) Old age pension Female person over the age of 59 / male person over the age of 64 whose income is less than R1250 (individual) or R2500 (combined); a sliding scale means-test is applied
Up to R430 per month For the rest of their lives, unless the income situation changes. (long-term)
b) Disability grant Disabled person (with a medical certificate that the disability will continue for lon-ger than six months) earning less than R1250 (individual) or R2500 (combined); a sliding scale means-test is applied.
Up to R430 per month Until the income or medical situa-tion improves. (long-term)
c) Child support
grant
(replaces the SMG)
Children from 0-7 years living with a care-giver earning less than R800 per month or R1,100 per month if he/she lives in a rural area or the dwelling is informal11. In addition, the care-giver has to comply with certain conditions:
The care-giver also has to ensure that
• he/she shall continue to be the primary care-giver;
• the child shall have accommodation and is properly fed and clothed;
• he/she shall allow the DG reasonable access to the child and the dwell-ing;
• he/she shall ensure that the child receives immunisation and other health services where such services are available without charge;
• he/ she shall carry out any instructions regarding the use of the grant.
The programme aims to reach 3 million children by the year 2003
R100 per month Up to the seventh birthday of the child or until the income situation changes. (medium-term)
d) Foster care grant Parent/s who take a child (0-18) which was placed in their custody R374 per month Until the child turns 18 or the child is no longer in custody. (long-
11 At the introduction of the child support grant in April 1998, the financial means-test was more restrictive as it tested the household income. In addition there were several conditions the
primary care-give had to comply with in order to qualify for the grant, the following conditions have been taken away: ·- proof of immunisation where such services are available; - proof of efforts to obtain maintenance from the parent; - proof of effort to find employment or proof of effort to join a developmental programme. The means-test was changed in June 1999 to test the income of the primary care-giver or if she/he is married the combined income. This is in contrast to the SOAP means-test, which tests half the combined income in case the beneficiary lives with a spouse.
From a ‘whites’ only welfare system towards a developmental approach 19
term)
e) Care-dependency grant
Parent/s of a child (0-18) with disabilities who requires and receives permanent home care (medical report needed), subject to a means-test (annual income of the family may not exceed R48 000)
R430 per month Until the child is 18 (can then apply for a disability grant) or no longer in custody of the parents or the child is admitted to a state institution. (long-term)
e) Grant in aid Any person receiving a social grant who requires and receives regular care at home by another person. Not payable if the beneficiary stays in an institution which re-ceives a state subsidy.
R94 Death of beneficiary ((long-term)
f) Social relief Persons in need of temporary material assistance due to one of the following condi-tions: (1) awaiting permanent aid; (2) medically unfit to work for a period of less than 6 months; (3) non-receipt of maintenance; (4) deceased breadwinner & insuffi-cient means or breadwinner admitted to institution for a period of less than 6 months; (5) affected by a disaster or any other emergency situation.
Up to R430 per month (not exceeding the max. social grant payable; for children the maximum CSG)
No longer than three successive months (in exceptional cases an-other three months). (short-term)
Table 1-1: Current social assistance programmes
1.2.2.) Social insurance a) Unemployment Insur-
ance Fund In general: Workers earning less than R82,992 per annum (R6,619 per month) can contribute. However certain groups of workers are excluded: Independent contract workers, piece workers, casual workers working less than eight hours a week, domestic workers, employees in central government.12
45% of the last earnings Maximum duration: 26 weeks (6 months) (short-term)
Unemployment benefit Unemployed person who contributed for at least 13 out of the last 52 weeks; seeks work; must apply personally.
45% of last earnings Maximum of 6 months (short-term)
Benefit for dependants of deceased people
Widow/er (or dependent children), if the deceased has contributed for at least 13 weeks within the last five years.
A lump sum equivalent to 6 months of benefit pay-ments
Once-off-payment. (short-term)
Illness benefits Contributors who receive less than one third of their wages from their employers during period of illness.
45% of the last earnings Up to 6 months. (short-term)
12 The UIF is currently under review.
From a ‘whites’ only welfare system towards a developmental approach 20
Maternity benefits Female contributors who receive less than one third of their wages from their employers during maternity leave.
45% of the last earnings Up to 6 months. (short-term)
Adoption benefits Unemployed female contributors who have contributed at least 13 weeks out of the last 52 weeks.
45% of the last earnings Up to 6 months. (short-term)
b) Compensation for industrial accidents and diseases (COIDA)
Workers injured or disabled by accidents arising out of and occurring in the course of their employment.13
Temporary or permanent disability benefit (75% of earnings up to R6064,50 a month); medical benefits; survivor benefit
- medical benefit up to 2 years
- permanent benefit as a pension
(long-term)
Table 1-2: Current social insurance programmes
1.2.3.) Other Programmes a) Public health care Everybody in need of medical care (means-tested) Subsidy towards the costs
of medical care according to income
b) Special health care programme
Pregnant women and children under the age of six Full costs of medical care
c) Public works pro-grammes
Low wages are used as screening mechanism: Programme designed for the 'most needy'.
R7 - R25 per day
d) Flagship programme Unemployed women with children under five (the projects will reach about 120 women in each province)
Employment and training project
e) Primary school nutri-tion
programme (PSNP)
Children in primary schools. The original objective was to reach 50% (3.8 mil-lion) of all primary school children who should be provided with 30% of a child's RDA energy.
Food
Table 1-3: Current other programmes
13 It covers employees regardless of their earnings, although currently earnings over R6,669 are disregarded as fare as compensation is concerned. (Meth, Naidoo, Shipman, 1996:30)
From a ‘whites’ only welfare system towards a developmental approach 21
I. Social Assistance
In the White Paper the Department states that about 2.8 million people in South Africa receive a grant14. Due to the deracialisation of the SOAPs over time, the SOAPs are the largest social assistance programme with about 1.7 million beneficiaries. The positive and redistributive effect of this pro-gramme is widely acknowledged.15 In the introduction to the 1997/98 budget Finance Minister Man-ual outlined that the SOAPs constitute one of the biggest poverty alleviation programmes of govern-ment. The White Paper (1997:49) points to that fact as well and sees ways for improvement in cover-age.
The number of elderly South African beneficiaries has stabilised, with fairly good coverage (80%), but there are still particular pockets where many eligible people do not get a grant. The impact of a grant in-come on household income for people in poverty is dramatic. The majority of people in poverty who are not white live in three-generation households, and the grant is typically turned over for general family use. In 1993, there were 7,7 million people in households which received a state grant. For black South Africans, each pensioner’s income helped five other people in the household.16
In the White Paper government committed itself to provide the grants for people who qualify accord-ing to the means-test.17 Simultaneously, government aims at improving the coverage of retirement schemes for people in formal employment and self-employed people in the informal sector as far as it is appropriate for their economic realities.18
With regard to Disability Grants, the Department commissioned research to investigate and develop a strategy for social security for people with disabilities at the end of 1997. The report of the task team was published in June 1998, and according to this latest research, there are about 730,000 beneficiaries of the disability grant (Schneider & Marshall, 1998:83). Eligibility for the grant is currently based on a medical diagnosis assessing the percentage of disability and on a means-test. Depending on the level of disability and on the level of poverty, eligibility is determined. The task team recommends chang-ing the test by moving from assessment of functional capacity only to evaluation of a range of needs and economic factors and hence developing a 'profile of needs' of the applicant. This profile should, besides the medical and financial indicators, also include indicators like the costs related to the spe-cific disability, the support mechanisms, a socio-economic profile of the area and possible vulnerabil-ity to discrimination. The rationale for this recommendation is the appreciation that each disability creates a range of needs. This is especially the case in the South African situation where other social security measures like accessible health care, re-training, vocational rehabilitation and transport are largely absent. The task team inter alia recommends the employment of 'evaluators' in each district for evaluating the needs of people with disabilities, an improvement in the administration and information system of the grant and a stronger intersectoral collaboration of the different departments. Strategies for people with disabilities which were already set out in the White Paper ranged from improvement of accessibility to the welfare system, to training opportunities, transport and the labour market.
The Department has not yet commented on the report of the task team. The future development of the grant will depend on this response and further policy decisions.
The introduction of the CSG has been the major shift in social assistance carried out by the Depart-ment during the past 4 years. The CSG replaced the SMG, the state support programme for single par-ents created by the apartheid regime. The SMG system had to be restructured, as although it had been formally equalised during the transitional phase, it was in practice still mainly accessible to so called ‘white’, ‘indian’ and ‘coloured’ families. At the time of the restructuring about 1.3 billion was spent on the SMGs and a de facto extension to all eligible children could have cost up to R13.7 billion. (Haarmann, 1999b:12-22) An extension of the SMGs seemed financially not feasible.
14 White Paper, 1997:48 15 COSATU, 1996b:9 16 See also Ardington & Lund, 1995 17 See Table 1-1 18 White Paper, 1997:54
From a ‘whites’ only welfare system towards a developmental approach 22
Under the SMG system a benefit of up to R700 was paid to single parents, depending on their finan-cial situation. The benefit was limited to two children under the age of 19 years (in special cases up to 21 years). A committee appointed to investigate possibilities for the restructuring recommended the introduction of a grant on a much lower level and only for younger children. The distinctive feature of the proposal, however, was the concept of ‘follow the child’, meaning that the benefit is independent of the family structure the child lives in. In April 1998, the new grant was introduced paying R100 per month per child for children under the age of seven. The declared goal of the Department of Welfare is to reach 3 million children within the next five years. At the same time, the phasing-out of the SMG with about 350,000 beneficiaries started. The Department decided to phase-out the grant over a period of 3 years.
The Department introduced a means-test for the selection of the eligible children and their care-givers. According to this means-test, a child who lives in a household with a total income of less than R800 in urban areas and R1100 in rural areas or in an informal dwelling is eligible. Furthermore, the care-giver has to comply with certain conditions like providing proof of effort to find employment or proof of effort to join a developmental programme, proof of immunisation of the child, proof of efforts to ob-tain maintenance from the parent (Department of Welfare, 1998). The care-giver also has to ensure that the child has accommodation and is properly fed and clothed. The Department’s declared goal for the first year was to put 390 000 children on the system (Fraser-Moleketi, 9.2.1998). However, accord-ing to a press statement of the Minister in February 1999, only 23 823 children were on the system at that time (Fraser-Moleketi, 18.2.1999). As will be discussed in Chapter 5 in more detail, research (See Haarmann, 1999b:30-46) conducted before the introduction of the programme has shown that the adopted means-test was very likely to critically hamper the take-up of the grant and that the goal to reach 3 million children would be jeopardised. Alternatively, it was proposed to base the means-test on the income of the primary care-giver without any further conditions. With effect from 25 June 1999, the Minister changed the means-test based on the household income to only testing the income of the primary care-giver and where applicable of his/her spouse (Department of Welfare, 1999). However, in case of a couple the combined income is tested and not as in the case of all other grants half the combined income. At the same time, the Department embarked on an information campaign to inform the public about the accessibility of the CSG. It can be assumed that these two measures will improve the take-up of the grant, however, their success has to be evaluated at a later stage.
The foster-care grant supports parents who have adopted a child. The committee investigating the SMGs suggested that this grant needs further investigation.
The care-dependency grant is meant for parents taking care of a disabled child at home. At the age of 18, the child can then apply for a disability grant. The “grant in aid” supports people caring for the aged or people with disabilities at home. The task team on people with disabilities highlighted that these grants need restructuring in particular with regard to accessibility and number of people eligible. However, the team was of the opinion that more research was necessary before recommendations could be made.
The social relief grant is a measure for bridging a temporary situation of crisis for an individual or a family with no other support or insurance. The grant is payable for only up to six months in situations like a period after a disaster, a temporary disability, a sudden death in the family or a waiting period for another social grant. However, the award of this grant is discretionary and not guaranteed.
In terms of numbers of beneficiaries, the SOAPs, the DGs and the CSGs are the biggest programmes.
II. Social insurance
The Unemployment Fund provides benefits for employees who are in formal employment and who are regularly paying into the Fund. The employer is also required to contribute. The Fund covers different contingencies:
• unemployment
• death
• illness
From a ‘whites’ only welfare system towards a developmental approach 23
• maternity
• adoption
for a maximum of 6 months or a lump sum to the dependants in case of death of the insured. Of the benefits paid by the Fund, the payment of unemployment benefit is by far the most prominent one, taking up 80% of the total benefits paid.19 A task team to investigate the UIF was set up in 1995 and their report was published at the end of 1996. The report highlighted the fact that for various reasons most unemployed workers are not covered by the current fund20 and they recommended the setting up of an inter-ministerial social security co-ordinating committee to look into the wider social security framework. In terms of the UIF in particular the most important recommendations are that coverage should be extended to all workers (i.e. domestic workers, high-income workers etc.), gender discrimi-nation should be addressed and a more progressive benefit schedule should be introduced. The task team further pointed out that the Fund was liable to undergo a financial crisis if no changes were made. They presented different options based on employees’ and employers’ contributions to avert the crisis but also called on government to get involved in the financing of the UIF.
The recommendations are still under consideration and this research will hence work with the current regulations but it seems imminent that changes will be made.
III. Other programmes
The special health care programme that provides free health care for pregnant women and children under the age of six was one of the first programmes implemented by the new government. It aims at covering the health needs of this vulnerable group for a limited period of time.
The public works programmes are targeted at very poor people who are prepared to work for very low wages. The Labour Market Commission stated that by January 1996 28,158 jobs had been created and an 'upper bound estimate of the employment creation would be 100 564 jobs'21.
The Department of Welfare set up the Flagship Programme as part of the strategy outlined in the White Paper to alleviate poverty. Its goal is to provide economic and developmental opportunities and services for unemployed women with children under the age of six. Between 1-3 projects have been implemented in each province, benefitting 1043 women and 1535 children.
The primary school nutrition programme aimed at providing 50% of primary school children with 30% of a child's RDA for energy. The programme was announced by President Mandela in 1994 as a presidential lead project under the RDP and received funding of R496 million per year (Child Health Unit, 1997).
This outline gave a description of the state social programmes which provide social security for the poor and vulnerable. After surveying the international experience in the field of social security espe-cially with regard to poverty alleviation in the next chapter, Chapter 5 then provides an in-depth analy-sis of the current social programmes in terms of their coverage and impact for poverty reduction in South Africa.
19 Meth, Naidoo, Shipman, 1996:19 20 Meth, Naidoo, Schipman, 1996 21 Report of the Presidential Commission to Investigate Labour Market Policy, par. 402
Social security in an international context - definitions, models and possible lessons 24
Chapter 2: Social security in an international context - definitions, models and possible lessons This chapter provides an international perspective to the debate on social security in South Africa. The overview aims at contributing insights into other countries' experiences which might be able to en-hance the discussion on the development of the South African system.
The first part presents different definitions and concepts of social security to cover the various systems and schemes in different countries. The second part of the chapter delineates various social security systems in different parts of the world, starting with capitalist countries and passing on to the more recent build-up of social security schemes in East Asia and the situation in developing countries. For comparative purposes, countries are not looked at individually, but rather grouped according to the characteristics of their systems. The third part attempts to draw lessons for the current South African situation, focusing in particular on the poverty alleviation capacity of social security.
2.1.) Definitions and concepts of social security When discussing social security one has to be aware that the use of the term varies considerably and might refer to different programmes and schemes depending on the country, the context, and the ideo-logical background of the researcher. Historically, the term was coined by the United States with the first ‘Social Security Act of 1935’. Social security in the United States, therefore, refers to the benefits provided in this first Social Security Act, which covered insurance funded retirement, invalidity and survivor’s benefit. The term does not refer to social assistance or unemployment benefits, schemes which in other countries like Britain, Sweden or South Africa are naturally included. The problem of the different use of the term arises on a practical level as well as in theoretical discourse. While some only regard provision of monetary benefits by the state as social security, others consider regulated services by both public and nongovernmental organisations as part and parcel of the system (Midgley, 1996a:2). Looking especially at the developing context, one has to add at least two other dimensions: the traditional and the informal social security systems. Often, the two are used as interchangeable, but while there are overlaps, it has been argued for a distinction (Schmidt, 1993 & Zedlitz von 1994). Tra-ditional social security can be seen as having links to social tradition and is binding on a community level on the basis of common law or custom. Informal social security has developed - in most cases - independently from traditional origins and is based on solidarity and reciprocity (Schmidt, 1992:23).
This obvious broadness of the topic and the complexity of the various social security systems make it difficult to find a satisfactory definition:
The more concretely the term is defined, the greater the chances that it will be practicable in one given context, but the less likely that it will be transferable to other social conditions. If one attempts to sidestep this difficulty by proposing a very broad sweeping definition, the definition becomes less specific and the demarcation between it and the field of other economic activities becomes, at best, unclear. (Schmidt, 1992:22)22
The International Labour Organisation (ILO) has tried to overcome this situation by providing a defi-nition for the international context:
22 See also Midgley, 1984:79-81 & 1996:2
Social security in an international context - definitions, models and possible lessons 25
...the protection which society provides for its members, through a series of public measures, against the economic and social distress that otherwise would be caused by the stoppage or substantial reduction of earnings resulting from sickness, maternity, employment injury, unemployment, invalidity, old age and death; the provision of medical care; and the provision of subsidies for families with children’. (ILO, 1984:2-3)
This definition is based on a contingency approach: Social security has the task to provide protection against life-cycle contingencies which cause reduction or loss of earnings. In the Social Security Con-vention (No. 102) of 1952, the ILO determined 9 branches of benefit [(1) sickness benefit; (2) mater-nity benefit; (3) employment injury benefit; (4) unemployment benefit; (5) invalidity benefit; (6) old age benefit; (7) survivor benefit; (8) medical care; (9) family benefits] and laid out minimum require-ments as to the coverage of the population and the content as well as the level of benefits.
Usually, different programmes are combined in a social security system and Midgley (1996:3) indi-cates that a distinction can be drawn on the basis of their funding approach and eligibility criteria:
a) Social insurance: occupationally based approach which is funded by workers and employers and includes the pooling of risks.23
b) Social assistance: benefits from general revenue for people eligible according to a means-test.
c) Employers' mandate: employers are responsible for benefits to employees who en-counter specific contingencies.
d) Social allowances schemes: benefits from general revenues to all who encounter specific contingencies, but without applying a means-test.
Similar, to Midgley’s first three categories, the ILO has put forward an ideal model showing the rela-tionship between social assistance, social insurance and private arrangements:
23 The provident funds can be regarded as a special form of social insurance. While they are also based on contributions,
they do not share or pool risks but are rather a means of compulsory saving. (Midgley, 1996:3-4 & ILO, 1984:6)
Social security in an international context - definitions, models and possible lessons 26
The ILO model - 3 tier social security scheme
• comprehensive coverage
• basic needs approach
• considerably less than social insurance
Social assistance
• compulsory• moderate universal benefit• redistributive: relative high benefit for the poor
and relative low for high income groups
Social insurance
• private arrangements• arrangements with
the employer
Privatearrangements
Gov
ernm
ent a
sre
gula
tor
Gov
ernm
ent a
sad
min
istra
tor
1. Incentives to join the social in-surance scheme rather than tomanage the assets in a way as toqualify for social assistance.
2. Social insurance takes pressureoff overburdened social assis-tance.
3. Incentives to encourage privatearrangements.
4. If private arrangements fail,people fall back on social insur-ance and not on social assis-tance.
1
43
2
Figure 2-1: The ILO-model24
24 Presented at an ILO conference in Johannesburg in November 1997.
Social security in an international context - definitions, models and possible lessons 27
This three tier system aims at a comprehensive coverage of the population.25 Social assistance is meant to provide a ‘safety net’ for those not covered by any other scheme. The benefit provided should be guided by a basic needs approach, it should, however, be considerably less than the one provided by social insurance schemes. The rationale behind this is that the relatively low level of benefit should be an incentive for people to move into social insurance, which is considered to be the norm, instead of relying on social assistance.
Social insurance is the main pillar of the system. It is compulsory and distributes moderate universal benefits based on a redistributive system. Government functions as administrator of both systems, the social assistance and the social insurance schemes.
In addition, a system of private arrangements should be encouraged, either on an individual basis or together with the employer. These arrangements are meant to ‘top-up’ the social insurance benefits. Unlike with the other tiers, Governments have only a regulating role instead of an administering role in this sphere.
Looking at industrialised nations which mostly rely on formal social security systems, this definition and concept of the ILO is readily understood and allows for a comparative discussion on the topic. Yet one should be aware that, as the example of the United States shows, some highlighting of a narrower or broader use of the term in a specific country is needed.26
The situation is different when analysing social security in developing countries. The ILO’s definition and concept, while being broad enough to cover most varieties of systems in a developed context, has been increasingly criticised for not being applicable to the developing context.27 The main points of criticism are their reliance on the developed economies and labour relations and hence the focus on formal social security systems. In a developing context, where the majority of people are not em-ployed in the formal economy and hence are not part of formal social security structures, social secu-rity necessarily has a different face. Not only do the structures that offer social security vary consid-erably but equally important are the different causes of insecurity.
In industrialised nations, the main aspect of social security, as outlined above, is the provision of pro-tection against the decline in living standards caused by a reduction in earnings. While this is of course an aspect in a developing context as well, another in a developing context even more important aspect, is promotion, aiming at enhancing the normal living conditions and dealing with regular and often persistent deprivation (Drèze & Sen, 1991:3-4).
The distinction between these two aspects of social security at the same time reveals two underlying reasons for it: The need for promotional social security measures is caused by chronic or structural socio-economic insecurities which prevent a person from meeting his/her basic needs (like adequate nutrition, housing, health care etc.). This ‘first-order’ type of social insecurity is ascribed to an insuffi-cient degree of overall economic development. In contrast, the need for protective social security measures is caused by ‘conventional’ contingencies as outlined above. This insecurity can be called a ‘second-order’ type social insecurity (Getubig, 1992:1-2).
Necessarily, strategies dealing with the ‘first-order’ type of social insecurity have to differ. Many pro-grammes and policies of government and civil society are regarded as part of this ‘first-order’ type or promotional social security. For example, these strategies can range from government policies aiming at equitable economic growth, job creation programmes, infrastructure improvements, and social ser-vices to co-operatives, charitable activities, savings-schemes (Subbarao, Bonnerjee, Braithwaite et al, 1997: 3 & Getubig, 1992:2).
While the strategies might differ substantially, there are, at the same time, significant complementari-ties. Burgess and Stern (1991:46), for example, argue that
25 The ILO argues in favour of a distinction between social security, mainly cash benefits, and social services. Therefore
social services are also not included in this ideal-typical model. Nevertheless, the two are regarded as two sides of the same coin which have developed together and are inseparable linked on a policy level (ILO, 1984:7).
26 See also ‘2.2.1.) Social security in capitalist societies’ 27 Midgley, 1984; Getubig, 1992; Ahmad, Drèze, Hills, et al. 1991
Social security in an international context - definitions, models and possible lessons 28
... the probability of occurrence of extreme hardship would generally be reduced if the mean income (standard of living) is raised, provided the distribution (in the appropriate sense) is not widened.
Drèze and Sen (1991:4) see the same interdependence when saying that ...success with the promotional objectives may make protection easier (for example, individual insurance may be less difficult when one’s normal level of prosperity is higher).
A definition of social security taking account of these circumstances in developing countries, reads as follows:
Any kind of collective measures or activities designed to ensure that members of society meet their basic needs (such as adequate nutrition, shelter, health care and clean water supply), as well as being pro-tected from contingencies (such as illness, disability, death, unemployment and old age) to enable them to maintain a standard of living consistent with social norms, (Getubig, 1992:1)
This definition is sensitive towards the circumstances of a developing country where social security cannot be restricted to formal structures but has to include a variety of efforts to improve the living conditions of the poor which remove social insecurity. At the same time, though, the problematic na-ture of a broad definition becomes obvious: Here the term social security, while rightly integrated into the wider discussion on poverty alleviation, economic and social development, might become too vague and indistinguishable to allow for a concrete analysis.
This discussion has spelled out the difficulties which arise when analysing social security in an inter-national context. On the one hand, the ILO definition would not do justice to the developing context, on the other hand, a broader definition is in danger of being too unclear and imprecise. It is therefore of importance for a comparative analysis which includes both, capitalist and developing countries, to be aware of this dilemma. The decision for a particular definition depends inevitably on the focus of the specific research. Given the fact that this thesis focuses on social assistance and the role of the state in providing it, the ILO definition with its concentration on formal social security suits the re-search best - and this is true also for this comparative section. However, the author is aware of the different context of social security in developing countries and hence the broader point of view will be kept in mind. This will be of particular importance as the South African White Paper for Social Wel-fare explicitly speaks of both, promotional and protective measures as part of social security.28
2.2.) Social security in different parts of the world
2.2.1.) Social security in capitalist societies
2.2.1.1.) History of social security The Elizabethan Poor Law, enacted in England in 1601, is often cited as the turning point for the in-volvement of governments in social welfare matters. Precursors of this legislation came from France and Germany, but here for the first time a national system of poor-relief managed by central govern-ment was introduced. While traditionally the family, the clan, trade guilds or religious philanthropy were regarded as primary providers for social security, the Poor Law served as the first example of a more comprehensive state involvement by means of social assistance (Midgley, 1984:86-90 & Midg-ley, 1997: 76f).
Stigma was always attached to these poverty relief programmes and the doctrines of liberalism in the nineteenth century saw a tightening of eligibility rules and the abolition of outdoor relief. The New Poor Law of 1834 intended the incarceration of the recipients aiming at the prevention of fraud as well as the coercion to seek an honest living. However, its cruelty was attacked by philanthropists and the legislation was not as harshly implemented. Over time, the concept of the ‘deserving poor’ gained acceptance, and more human ways were followed. In Denmark, in 1891, the first means-tested social pension scheme was introduced, whereby people over the age of 70 were paid a regular pension fi-nanced from taxation. Led by this example, similar social assistance schemes were introduced at the
28 See ‘1.1.2.2.) Developmental Social Security’
Social security in an international context - definitions, models and possible lessons 29
turn of the century in several other countries like France, Australia, and New Zealand, and over time the support was extended to the disabled, widows and deserted dependants (Midgley, 1984:86-90 & Midgley, 1997: 76f).
The development of social insurance is linked to the industrial revolution and the rise of capitalism. With the commodification of labour, families started to be increasingly dependent on their wages. Unemployment, sickness or work injuries had often devastating effects and impoverished families. Mutual aid and corporative societies developed the insurance principle already in the nineteenth cen-tury by basing their support for sickness, funerals and widows with children on regular contributions. The state became later involved as a regulator by registering and supervising the activities of these societies.
The beginning of the development of social insurance schemes by the state is usually ascribed to the system introduced by the German Chancellor Bismarck between 1883 and 1889. The scheme pro-tected certain categories of workers against the loss of income caused by sickness, industrial injury, invalidity, and old age. In contrast to the stigma attached to the benefits received under social assis-tance schemes, here guaranteed benefits based on the individual’s monthly contributions were paid. The schemes were compulsory. It is noteworthy that the underlying motivation behind the introduction of these schemes was not the idea to bring about greater equality, but to maintain the existing order by suppressing working class movements.
Following the German example, similar schemes were established in other European countries at the turn of the century and increasingly the systems were linked to health insurance. It is interesting to note that the introduction of unemployment benefits based on the insurance principle occurred rela-tively late, in most countries after 1920 and in the United States only after 1930 (Liebenberg, 1999, Midgley, 1984 & 1997; George & Pager, 1995).
Accordingly, one can arrange the contingencies covered by social insurance schemes in Western Europe and North America in the following chronological order:
Industrial injury circa 1870 - 1900
Old Age
Sickness
Invalidity
circa 1890 - 1915
Unemployment
Death of breadwinner
circa 1920 - 1939
Table 2-1: Chronological order of the introduction of social insurance in Western Europe29
Further improvements of social security systems manifested themselves in a move towards a more universal coverage of the population which resulted in the expansion of provisions and the inclusion of more categories of workers and more people into the schemes. The United States’ Social Security Act of 1935 introduced a universal retirement, survivor, and invalidity scheme for all employers and to-day’s system in the USA is still influenced by this Act. The Act was part of the so-called New Deal under President Roosevelt. As a response to the Great Depression, Roosevelt promoted the idea that the government was responsible for the well-being of its citizens and introduced many new social pro-grammes (Midgley, 1997:78).
A cornerstone of the development towards universal and comprehensive coverage of the population is the publication of the Beveridge Report in Britain in 1942. This government report recommended a strong intervention of government into social affairs and that a social insurance scheme which was comprehensive, compulsory, contributory, and uniform should be introduced. This social insurance system should meet basic subsistence needs covering health care, housing and education as well (Sil-burn, 1995: 90-93). Similar developments and an increase of government intervention in social secu-rity took place in European countries, in particular in Scandinavia.
29 See Zwanecki, 1999: 2 & George & Page, 1995: 2-4
Social security in an international context - definitions, models and possible lessons 30
The time between 1945 and 1975 is often referred to as the ‘golden era’ of the welfare state in which the principle that the state is responsible for the well-being of the population was politically well ac-cepted. In a time of economic growth and high employment figures, the ‘Keynesian Consensus’ pro-duced a climate in which social security and economic growth, equality and efficiency went together. This was also reflected in the increasing involvement of governments in economic and social affairs and rising levels of social expenditure (George & Page, 1995:7-8).
Since about 1975, the ‘welfare state’ has come under attack. Critique is being raised on an economic and political level. In the light of the oil price hike, declining growth rates, increasing and chronic unemployment, and an ageing population, the long-term fiscal viability of social security provided by the state is questioned. This is coupled with a political debate about the state’s involvement in social security provisions. It is argued that the market is better equipped to deal with social security concerns and hence privatisation is promoted (Esping-Andersen, 1996: 10-11 & 265-266 & George & Page, 1995:10).
On a political and ideological level, the need for a restructuring of the existing social security struc-tures is widely acknowledged. However, total expenditure levels have by and large not declined, but stagnated. In terms of regulations, some countries have introduced more restrictive changes to eligibil-ity criteria and individual benefits especially in some social assistance schemes, which indicates a shift from universalism to selectivity. When it comes to social insurance, the necessity to involve the pri-vate sector is promoted (Esping-Andersen, 1996: 10-11 & 265-266 & George & Page, 1995:10). However,
(…) In most countries, what we see is not radical change, but rather ‘frozen’ welfare state landscape (Esping-Andersen, 1996:24).
2.2.1.2.) Characteristics and differences of social security in capitalist countries
Esping-Andersen (1990) has grouped capitalist countries into three types of welfare states based on the concept of de-commodification or the ability of social programmes to reduce the extent to which la-bour is a commodity. This grouping and distinction is one of the most frequently cited one (Midgley, 997:94) and will be used here to highlight the characteristics and the differences in the formal social security systems in the currently dominant capitalist countries.
According to Esping-Andersen (1990:9-34), one can label the three types of welfare regimes: ‘liberal’, ‘conservative’ and ‘social-democratic’. As with every typology, there are always overlaps and the social security system of one country, while having predominantly elements of one type, is naturally not free of other elements as well.
Social security in an international context - definitions, models and possible lessons 31
Characteristics TYPES OF WELFARE REGIME Principles Role of the state Social security as a
social right
Examples
A.) Liberal System is based on traditional, liberal work-ethic; social assistance for low income class, strict entitlement rules associated with stigma, modest bene-fits.
Minimisation of state activities; security is seen as a private matter and hence there is encouragement of private arrangements; ‘relative equality’ of welfare recipients and market-differentiated welfare amongst the majority. Social insurance in form of occupational plans provided by the company.
Social security as a social right is not well developed.
USA, Canada, Aus-tralia, Great Britain
B.) Conservative (corporatist)
Preservation of status quo according to class and status; principle of subsidiar-ity; regime is shaped by the church.
Historical corporatist-statist legacy: therefore the state is seen as the administrator of welfare. Private insur-ance plays a marginal role. System does not have a strong redistributive character and aims at upholding traditional norms; Social insurance entitlements are linked to an ‘unbroken’ career of the bread-winner and exclude non-working wives. Family benefits encourage motherhood.
Social security as a social right is attached to class and status.
Germany, France, Austria, Italy
C.) Social democ-ratic
Principle of universalism and solidar-ity, welfare state should promote equal-ity on highest standard possible; strives towards full employment.
Redistribution is the task of the state, crowding out of the market, socialisation of the costs of familyhood and maximisation of the capacities of individual independ-ence, encouragement for women to work.
social security as a social right is naturally accepted and every-body enjoys the same right independently of class and status
Scandinavian coun-tries, Denmark
Table 2-2: Types of welfare regimes according to Esping-Andersen, 1990
Social security in an international context - definitions, models and possible lessons 32
Esping-Andersen (1990) has analysed the impact of the different types of welfare regimes and their organisations of social security in terms of their de-commodification of labour. Here it should suffice to shortly summarise the results without going into methodological details.
Esping-Andersen (1990:37) defines de-commodification as follows: (…) de-commodification should not be confused with the complete eradication of labour as commodity; it is not the issue of all or nothing. Rather, the concept refers to the degree to which individuals, or families, can uphold a socially acceptable standard of living independently of market participation.
Not surprisingly, the results show a high degree of de-commodification in the countries dominated by a social-democratic type, a low level in the countries dominated by liberal characteristics and a ‘mid-dle way’ in the conservative countries (Esping-Andersen, 1990:51). The explanation for this tendency can be found in the specific characteristics of the different types of welfare regimes with regard to the organisation of the relationship between the market, the family and the state.
Liberal types organise social security provisions on the paradigm that public obligation only starts where the market fails.30 In concrete terms this means:
A means-tested assistance system is, in a sense, a way of ensuring that non-market income is reserved for those who are unable to participate in the market anyhow. (Esping-Andersen, 1990:43)
When it comes to social insurance, actuarial and contractual principles have to be upheld so that rights and benefits are strictly bound to contributions. Charity has to be based on voluntarism. This system features
(…) one group at the bottom, primarily reliant on stigmatizing relief; one group in the middle predomi-nantly the clients of social insurance; and, finally, one privileged group capable of deriving its main wel-fare from the market. (Esping-Andersen, 1990:65)
Examples of such a system are the United States and, to a certain extent, also Britain.
In contrast, conservatism bases its organisation on corporate societies and structures which uphold traditional values. Moreover, etatism had also a strong influence, and this mixture produced a system where family, loyalty, morality and authority play an important role. Here also the church is active by promoting and supporting the traditional values of familyhood, the first provider of social security. Paternalism is also widespread in this system. These types of welfare regimes are prepared to provide social security independent of the market, however, the benefits are strongly conditional upon labour market attachment and contributions, and exert social control. Features of such a system are, for ex-ample, the privileges civil servants enjoy in countries like Germany and France. Social assistance schemes developed on the basis of a paternalistic approach.
The social democratic types aim at the emancipation of market dependence and therefore score highest in terms of de-commodification. Characteristic of this approach are universalism and solidarity which promotes equal rights for all and the reduction of inequality. Due to these principles, the system has a strong redistributive effect. The institutionalisation of social rights means strong entitlements inde-pendent of labour market attachment, and benefits for child-bearing, family responsibility and re-education are features of the system. A good example of this system is the Swedish model.
2.2.1.3.) Preconditions and causes of different types of welfare-state regimes
When trying to explain the causes for the development of the different types of welfare-state regimes, Esping-Andersen (1990) points to the interplay of three factors: The nature of class mobilisation, class-political coalition structures and the historical legacy of regime institutionalisation. Esping-Andersen (1990:29-33) argues that given the fact that the working class on its own was never an elec-torate majority, one has to analyse the political coalition between the working class and the middle class.
Looking at the historical circumstances of the social democratic type, the middle class developed out of a farmers' community which was dependent on state subsidies and where the private sector was relatively weak. The establishment of benefits provided by the state which suits both, the working
30 This paradigm express what Titmuss describes as residual welfare.
Social security in an international context - definitions, models and possible lessons 33
class as well as the middle class, had the effect of a middle class being devoted to social democracy. In the liberal model in contrast, the middle class was more attached to the market than to the state, and a dualism developed:
The [liberal] welfare state caters essentially to the working class and the poor. Private insurance and oc-cupational fringe benefits cater to the middle classes. (Esping-Andersen, 1990:31)
In Europe, agriculture was labour intensive and unions and left-wing parties were not welcomed in the sector. A class coalition, like in the Scandinavian countries, was therefore not possible. The conserva-tive regimes incorporated the farmers and were interested in maintaining the status quo. In the given corporate structure, social insurance which was occupationally segregated, status-distinctive and hier-archically developed. The middle class became loyal to this peculiar type of welfare organisation (Esping-Andersen, 1990:30-31).
2.2.1.4.) Responses to the crisis Faced with the changes in the economic conditions, the three types of welfare regimes have reacted differently to the current challenges of slower growth, higher unemployment rates and to the changes in the social conditions, to ageing societies and changes in the family structure.
The liberal welfare states have opted for a deregulation policy of labour markets, higher wage flexibil-ity, and a reduction of welfare services provided by the state. The basic idea behind the reforms is still the belief that the market is able to provide for the population. The effect of this policy is twofold: In terms of job creation, in particular in the United States, the outcome is favourable in comparison to other capitalist countries. However, the jobs created are mostly low-end jobs with wages below the poverty line, and often unskilled workers are in danger of being trapped in these jobs. The jobs are increasingly in companies without or with little occupational benefits and hence no social security provisions. This situation has seen an increase in inequality and poverty (Esping-Andersen, 1996:15-18).
The conservative welfare states responded with a labour reduction strategy and an attempt to maintain current social security provisions. Early retirement or disability pensions are a welcome method for labour supply reduction in the countries concerned, especially in the light of a social insurance system that bases its entitlement on the employment record. Naturally, this route included state subsidies. Problems associated with this route are high costs, a deficit in certain insurance funds, like miners', employment inflexibility (in order not to lose entitlements), long-term youth unemployment, and an increasing illegal market (Esping-Andersen, 1996:18-20).
The social democratic welfare regimes adopted an active labour market policy, a social investment strategy and gender equalisation. This resulted in an increase in public sector employment, in particu-lar in the 1980s. While that strategy absorbed workers, in particular women, into employment, the other side of the coin was an increasing pressure on public job creation coupled with decreasing fiscal capacity. The changes made to social security provisions included an attempt to reduce work disincen-tives and high absenteeism.31 The changes are assessed as marginal and not as a shift towards more neo-liberal principles. The still high unemployment rates question the social investment strategies, which aim at getting people back to work. However, the fact that the policies adopted are based on long-term planning, make a final assessment difficult at the moment (Esping-Andersen, 1996:10-15).
2.2.2.) Social security in East Asia The economic and social development in East Asia has been of growing interest in recent years. De-spite the financial crisis in 1997-1998, the region has an image of dynamic economies, coupled with social cohesion, a ‘health miracle’, low crime rates and low welfare expenditure (White & Goodman, 1998:3). From the point of view of this research, the question arises whether there is a specific ‘East Asian welfare model’ that differs substantially from those in western capitalist countries and from
31 Like: the reintroduction of waiting days for sickness leave, replacement rates for sickness, parental leave and unem-
ployment benefits have been reduced; benefits are more closely related to contributions (Esping-Andersen, 1996:13+14)
Social security in an international context - definitions, models and possible lessons 34
developing countries. Interestingly enough, the experience in East Asia has been used by neo-liberals and social democrats alike to argue the case for their specific social welfare systems. This overview will give a short history of social security in East Asia and then concentrate on summarising the cur-rent social security systems of Taiwan, Korea, Japan, Singapore, and Hongkong to capture the features of different social security systems in the region.
The development of formal social security systems in East Asia is relatively recent. Historically, the family and the local community determined by Confucian and Buddhist beliefs were primarily respon-sible for the well-being of its members.32 The state did offer some very limited public relief, but its main role until the end of the Second World War was, for example in Japan, restricted to regulating mutual aid and obligation among families and neighbours (Goodman & Peng, 1996:198-200). The Japanese colonial governments introduced similar systems in Korea and Taiwan during their rule.
Goodman & Peng (1996:199), however, contend that one has to look beyond these limited measures and realise that improvements in the material well-being of the population were obtained by the in-volvement of a centralised state into economic affairs.33 Lasting effects had the land reform that al-lowed peasant farmers to own land, the abolishment of the feudal class system, the introduction of compulsory education and investment into economic and social infrastructure.
The post-war development in Japan, Taiwan and Korea is marked by important changes in the econo-mies mainly through massive American investment resulting in high economic growth rates. Social security during the first three decades was by and large limited to the provision of health insurance, pensions and housing for workers by their specific companies. The national expenditure on welfare as a percentage of GNP remained relatively stable at a low level between 1945 and 1975. In all three countries, some basic safety net measures like medical relief and welfare for low-income families were set up, but the major developments in formal social security took place from the 1980s onwards. The following table will summarise them:
32 While the Confucian rhetoric extolled the virtues of filial piety, diligence, and conflict avoidance, the Buddhist teach-
ings further reinforced these values with the notions of karma - the idea of benefit and obligation - and of private charity and acceptance of the status quo. (Goodman & Pen, 1996:199)
33 Again, this refers to the Japanese government and the Japanese colonial governments in Taiwan and Korea.
Social security in an international context - definitions, models and possible lessons 35
Features of the system Role of the state34 Remarks
Singapore Central Provident Fund (CPF) (1955): Individual accounts, defined contributions by employers (20% of wages) and employees (20%); no risk-sharing, no income-transfers; covering pensions (1955); housing (1968), medical expenses (1984), special investment (1986), education (1989), no entitlements for people outside the CPF: Social assistance coverage very limited.
State enforces the scheme as compulsory. State acts as a regulator and provides no subsidies for the scheme.
Social security as a social right is very weak. Through the CPF the government has a large amount of assets and capital also for macroeconomic leverage.
Hong Kong Social assistance scheme (1971) based on a means-test covering poor households, health care, old-age and disability. Social allow-ance scheme (1973) without a means-test for the elderly (over 70 years) and severely disabled, it provides a subsidy for living ex-penses. Otherwise private arrangements, no system of contributory social insurance. The proposal for an old-age pension scheme based on a pay-as-you-go system was vetoed by the Chinese gov-ernment in 1994.
State as provider for limited social assis-tance and social allowance and a more substantial public housing scheme. Fami-lies, friends and neighbours are expected to take responsibility.
Minimalist, residual approach to social security. Politically, Hong Kong houses a large pool of immigrants who are pre-pared to emigrate again and see them-selves as being responsible for their own welfare
Taiwan National Health insurance: after government stepped in as pro-vider, it now covers almost the whole population, labour insurance and Government employees insurance.
Social assistance: Very limited to old-age people without families, homeless children and disabled people
Etatist character: Until 1989, provision of social security only for government and quasi-government employees, now government expands its role outside the public sector and is both regulator and provider. It s a complex and fragmented system and by no means comprehensive. Still influenced by the Japanese colonial government, the family and the commu-nity are expected to take responsibility
The democratisation process in the 1980s/90s also brought the issue of social welfare up and social demands are an important electoral issue. Health care is now a social right, but other contingen-cies like old-age are not covered at all.
South Korea Compulsory Social insurance for industrial accident (1963), health (1963, expanded 1975 and 1987), pensions (1988), employment (1995). Social assistance for the poor, but due to the strict means-test, two-thirds of the poor have no access.
In health insurance, the state acts as a provider for the poor, otherwise the state is regulator. Still influenced by the Japa-nese colonial government, the family and the community are expected to take re-sponsibility
Social security as a social right is poorly developed, especially in the social assis-tance schemes, but also the social insur-ance schemes have strict qualifying con-ditions.
34 The state can play the role of a provider or a regulator. If the state is the provider, the costs are borne by general taxation. If the state is the regulator, the costs are borne by public insurance
agencies.
Social security in an international context - definitions, models and possible lessons 36
Japan Medical care, income maintenance/support for children, disabled, old-age, housing, in particular: Two tier pensions scheme (1961 and reformed 1985): National basic pension to all citizens plus supplementary pensions to members of Employee’s schemes. Two tier health insurance: Company and community-based insurance and National Health Insurance for those not covered. Principle: modest public benefits plus private supplements based on em-ployment security and family care as the norm.
State made the public pensions scheme compulsory and acts as provider and regulator, the same applies to the health sector. Japanese tradition used to high-light the role of the family as provider of welfare.
Right of minimum standard of living entrenched in the constitution. Japan went through three different influences: ‘Catching up with the welfare states in the West’(1970-1973); ‘the Japanese-style welfare society’ (1973-1985) and being prepared for the ‘ageing society’ (1985- )
Table 2-3: Features of East Asian social security systems35
Social security in an international context - definitions, models and possible lessons 37
The comparative analysis of the five selected East Asian countries provides a mixed experience: First, while the social security systems are influenced by ‘Western’ models, they did develop distinct in-digenous features. Second, while the systems in the region as a whole share common elements, they also differ substantially among each other.
2.2.2.1.) Distinct features of selected East Asian social security systems
The role of the state in the systems is of particular interest. In most of the systems the state primarily plays the role of a regulator. The consequence from a financial point of view is that in comparison to ‘Western’ states, spending on welfare by these governments is relatively low. However, that does not entail a retreat of the state and a greater reliance on the market like in the liberal model. In fact, the states take over a very strategic role in economic and social affairs
(…) in directing a process of economic development with distributive as well as growth objectives, result-ing in a relatively egalitarian pattern of income distribution compared with other industrialising regions (…). (White & Goodman, 1998:13)
In comparison to ‘Western’ countries, this is mainly achieved through intervention in the economy and in education. However, the social security systems are not effective as regards redistribution. With the state as a regulator instead of a central provider, the social security systems in East Asia are more fragmented and have a limited capacity for risk sharing and pooling of income. Singapore’s CPF, al-though being an integrated system36, has no pooling of risks because of the individual account system. The systems in Japan, Taiwan and South Korea are fragmented along the line of kind of employment and different companies and hence the sharing is limited. The basis for income security therefore lies in the fostering of rapid economic growth with nearly full employment, resulting in a job guarantee at least for the breadwinner. The family and the community are in most countries expected to assume responsibility and besides the social allowances scheme for the elderly in Hong Kong, social assis-tance is very limited and recipients are stigmatised. Across the board, self-reliance is an important factor and social security as a social right is weakly developed (Kwon, 1998:66-67 & Esping-Andersen, 1996:24-25).
The approach manifests itself also in the funding of the systems. In general, social insurance or provi-dent funds which are partially or fully funded are preferred to pay-as-you-go systems or to schemes funded by general taxation. The funds created by the systems are also welcomed by governments for investment in industry and infrastructure (White & Goodman, 1998:14-15).
Looking at the political circumstances, the social security systems were chiefly introduced by authori-tarian rather conservative regimes with weak civil societies and weak political oppositions. In contrast to the experience in the ‘Western’ countries, no unions, social democratic parties or strong popular demand were involved.
The political circumstances, however, also reveal the differences between the nations. In Singapore, social policy was initiated to enhance national solidarity. The authoritarian regimes in Taiwan and Korea tried to use social security to build up legitimacy, and the public housing programmes in Hong Kong and Singapore are ascribed to their status of city-states with migrant populations (White & Goodman, 1998: 14 & Kwon, 1998:66-67). In Japan, the social security measures by the companies are regarded as a means to enhance loyalty and obedience. Moreover, the interpretation runs similar to the reasons behind the introduction of the first German social insurance:
(..) as part of a state-fostered ideology aimed at avoiding the development of strong unions and thwarting demands for greater welfare support for the population as a whole. (White & Goodman, 1998:16)
It is interesting to note, that with further democratisation processes, especially in South Korea and Taiwan, popular demand and pressure on government are growing and asking for more comprehensive social security measures and a greater role of the state in financing new schemes as well. The National Health Insurance in Taiwan is one example of this development (White & Goodman, 1998:19).
36 Meaning: The fund covers different risks under one administration.
Social security in an international context - definitions, models and possible lessons 38
In terms of the differences between the systems in the region one has to be aware that they range from a minimalist - albeit with universal old-age pensions - residual approach in Hong Kong to a more comprehensive coverage in Japan.
In so far as the systems show common elements and are based on the same principles37 attached to the specific East Asian development situation, the analysis of the individual systems reveals differences which can be attributed to the distinctive social, economic and political circumstances. Therefore, the systems cannot be reduced to one typical ‘East Asian model’. Possible lessons drawn from the region have to take account of both, the common elements and principles as well as the differences.
2.2.3.) Social security in developing countries
2.2.3.1.) Latin America and the Caribbean Social security in Latin America and the Caribbean (LAC) developed along the line of formal social insurance schemes based on the Bismarckian model starting in some countries as early as the 1920s. The background for the introduction of these contributory schemes was a large active work force, a low proportion of retirees, a life expectancy lower than that of today and a higher fertility rate (Mesa-Lagos, 1991a:177). The benefits provided by social insurance developed accordingly: 90% of benefits go to pensions and sickness-maternity leave, only 10% to employment injury, unemployment compen-sation and family allowance. Unemployment benefits are very rare and likewise social assistance is fairly underdeveloped (Mesa-Lagos, 1991a:183 & Huber, 1996:142). Extension beyond the insurance principle applies mostly to the health sector and that results in a situation where those living below the poverty line in LAC countries are not protected (Mesa-Lagos, 1991:371-373 & Gutiérrez, 1990:301-303).
Mesa-Lagos (1991) divides the LAC countries into three groups according to the stage of their devel-opment of social security systems:
37 The overview has intentionally left out a discussion on the cultural influence, in particular the influence of
Confucianism on the development of social security systems. This is due to the conflicting and not at all conclusive interpretations of its influence. Thus Confucianism comes in many forms: it can be made potentially democratic and potentially authoritarian, entre-preneurial or conservative, communitarian or particularistic. The particular version depends to a considerable extent on what the analyst wants do to with it. (White & Goodman, 1998:16)
Social security in an international context - definitions, models and possible lessons 39
Features of the system Examples
Pioneer countries
System emerges during 1920s
System evolved gradually and in piecemeal fashion - many subsystems according to occupation and through pressure on the state by the specific groups (military, civil servants, teachers etc.) resulting in a stratified system that lacks co-ordination and created legal confusion, administrative complexity, high operating costs, significant inequalities etc. Coverage of population was extended over time and is rela-tively high (62-96% of economically active population (EAP)). Some countries have limited social assistance benefits for the elderly and for families.
Most developed countries in the region, represent circa 15% of the LAC: Argen-tina, Chile, Brazil, Uruguay (Cuba)
Intermediate countries
System starts in 1940s +50s
Some countries started similarly to the pioneer countries, but eventually the influence by the ILO, the Beveridge Report and the motivation to avoid the mistakes of the pioneer countries, resulted in the establishment of a general managing agency. While some subsystems, for example for the military and the civil service, exist, it is a relatively unified and uniform system, however, with much lower coverage of risk and population: 18 - 50% of EAP
Lower level of industrialisation, rural sector dominates over the urban sector, represent circa 26% of the LAC: Colom-bia, Costa Rica, Mexico, Paraguay, Peru, Venezuela
Latecomer coun-tries
System starts be-tween 1950s + 60s
Unified and uniform system and general agency covers all insured persons, however, population coverage is very low and often limited to the capital city and heavily populated cities: 2-19%
Least developed of the region, represent circa 59% of the LAC: Central America (except Costa Rica and Panama) + Latin American Caribbean (except Cuba)
Table 2-4: Social security systems in Latin America and the Caribbean according to Mesa-Lagos, 1991, 1991a & 1997
Social security in an international context - definitions, models and possible lessons 40
Problems of social security in Latin America The systems in LAC face several problems:
1. Limited coverage because of a large and, due to the economic crisis in the 1980s, growing informal sector.
2. A high degree of fragmentation and of inequality of entitlements due to many subsys-tems with different regulations.
3. A financial imbalance due to the extension of benefits, the liberalisation of entitle-ments, the maturing of pension programmes, increasing life-expectancy, rising unem-ployment, high inflation and other factors related to the economic crisis of the 1980s.
The intermediate and late-comer countries are in particular confronted with the first problem, because extension has not yet taken place. The pioneer countries and, to a lesser extent, the intermediate coun-tries have to deal mainly with the second and third problem. The existence of many subsystems with different contributions and benefits has the effect of reproducing the inequalities of the labour market by imposing indirect taxes and by redirecting the employers' contributions onto the prices of the goods produced. This final imbalance of the social insurance systems must be seen in connection with the structural adjustment programmes implemented as a response to the economic crisis, including a re-duction of social expenditure and reductions in subsidies for basic food and transport. The effect is an increasing poverty rate in most of the LAC countries (Mesa-Lagos, 1991:358-367 & Huber, 1996: 141-145).
Response to the crisis The responses to the problems by LAC countries range from a radical neo-liberal reform package which includes the privatisation of the system based on a residual welfare state understanding, to a universalistic answer aiming at providing basic income security for the whole population. While often a mixture of these two extreme positions has been considered, Chile and Brazil present the examples for the ‘extreme’ positions and they will therefore be looked at in the following paragraph.
Chile developed a social security system that covered, by the 1970s, 60 - 70% of the population against most of the social risks. However, the system was highly fragmented along the line of ‘clientelistic links between different groups of employees and political parties’ and with spending of 9.9% of GDP in 1980 expensive in the Latin American context at that time.38 Moreover, the benefits differed substantially resulting in an inegalitarian structure. The state provided social assistance pensions and public health care for the uninsured (Huber, 1996:148 & Mesa-Lagos, 1991a:509).
By the mid 1970s, the military dictatorship under Pinochet started a neo-liberal reform package to consolidate the economy based on the principle that a free market allocates the resources best. The same understanding was applied to the reform of the social security system at the beginning of the 1980s. A new unified compulsory pension scheme based on private social insurance with contributions to an individual account only by the employee was established. The benefits are determined by the contributions plus the returns of the investments making them dependent on the performance of the Chilean economy, the level of real wages and the relationship between inflation and interest rates (Huber, 1996:166).39 The government regulates the private companies, provides guarantees in case of bankruptcy or if the investment yields below the required minimum. Government also guarantees a minimum pension for those under 20 years of contributions and for the period of transition. The re-form was and is costly for the state as it had to cover deficits in the old system, pay the pensioners who remained in the old public system and provide the minimum pension for the un - or underinsured. The assessment of the reform is mixed: The coverage of the EAP stands at about 90%, however, between 49 - 58% of the registered do not actively contribute. Furthermore,
(…) it is still unclear whether the administrative costs of the private system are lower or higher than in the prereform system. (…) There is neither a consolidated balance of revenue and expenditure of the
38 The spending was even higher - at 17 percent - in the beginning of the 1970s (Huber, 1996:148) 39 This is called a defined contribution scheme.
Social security in an international context - definitions, models and possible lessons 41
combined public and private systems, nor evidence that the reform has led to an increase in the national savings ratio. Finally, the reform has led to high financial costs for the state which have to be met (…) (Mesa-Lagos, 1991a:510)
The health system was restructured into a two-class system, where the middle and upper-income earn-ers have a private system and the lower-income and the unemployed are in the public system. In addi-tion, health and nutritional programmes for mothers with children have been established, resulting in an improvement of basic social indicators. The success of these programmes is attributed to the struc-ture and coverage accomplished under the old system (Huber, 1996:167). The loss of revenue for the public system due to absence of higher income groups has led to a deterioration of medical services.
Brazil’s social security systems developed in a corporatist manner, where the state officially recog-nised unions and by doing so exerted control also via social security organisations. The system was eventually occupation based and the administration of the different schemes was headed by a chairman appointed by the President. The first reform took place under the authoritarian regime from 1964 on-wards. The representation of unions on the boards was abolished and the organisation merged into one institution, however, privileges for certain groups (military and civil servants) remained. The biggest extension occurred through the inclusion of the rural workforce, based not on contributions but on tax levied on urban employers and agricultural products. The programme grants flat-rate benefits. This reform resulted in a coverage of nearly 93 percent of the population, excluding only the urban infor-mal sector. It is noteworthy that social expenditure was only 4.6 percent of GDP and made Brazil the lowest spender at that time. The problems attached to the system were the relatively low benefit for the rural population and the granting was tied to patronage. The health system was underdeveloped and insufficient, especially in the rural areas (Huber, 1996:149-150).
In the 1980s, Brazil was characterised by several recessions, galloping inflation and several stabilisa-tion programmes ranging from austerity policies to heterodox programmes. Up to now, inflation and the budget deficit are the main economic problems. Reformers of the social security systems attempted to universalise the whole system and to improve benefits for the poor. They proposed a reduction of contributions for the low paid, the abolishment of costly privileges for certain groups and the increase of benefits for the poor. However, not all proposals passed the Constituent Assembly and while im-provements towards the extension towards the poor were realised, the intended redistributive character of the system could not be entirely achieved.
The 1987 health reform unified the health systems and entitled everybody to free health care. How-ever, the inaccessibility or the lack of facilities particularly in poorer areas hampered the positive in-tention to a certain extent.
The assessments of the reforms are therefore mixed, like in the case of Chile: Legally, every Brazilian had the right to free health care based on his/her citizenship, over 90 per cent of the population was covered by social security, and the needy were entitled to social assistance pensions no lower than one minimum wage. (Huber, 1996:171)
However, putting these de jure universalistic entitlements into practice is hampered by severe prob-lems in the infrastructure, a lack of financial resources and the legacy of patronage which requires beneficiaries to go through an intermediary.
The examples have shown the differences in the approaches dealing with the problems of social secu-rity systems in LAC. Chile has created a two-class system, while Brazil opted for a universalistic and redistributive basis, both with mixed results. Chile has managed to get the EAP into a compulsory private system which accumulates large amounts of capital for investment. However, the contributions of the insured are relatively high in comparison to other countries, and the required period of 20 years of contributions is long considering the prevailing precarious employment conditions. The chance to integrate poorer sectors is therefore extremely limited. The state provides for those not covered, but the benefits are below the poverty line. The system is not redistributive and hence reproduces inequal-ity and has no poverty alleviation focus. While the accumulated capital has strengthened the capital market, it has not accomplished its goal to create secure and well-paid jobs which are needed to make a difference to reduce mass poverty (Huber, 1996:176-178). Brazil with its completely different basis moved towards a universalistic, redistributive, social security system which entitles every citizen to a ‘sufficient’ pension and health care. In addition, Brazil managed to integrate the large rural sector into
Social security in an international context - definitions, models and possible lessons 42
the system which is unusual for LAC countries. The aims of the system are, however, jeopardised by the legacy of a segmented and inegalitarian structure of the previous system and by a fiscal crisis of the state linked to the high inflation which causes high inequalities.
Many of the LAC countries have either a relatively unreformed system or they have opted for a mixed reform depending on the political and economic climate. In general, there is a correlation between economic liberalisation and moves to privatisation as well as between political liberalisation and less privatisation (Mesa-Lagos, 1997:503).
2.2.3.2.) Africa The development of formal social security systems in Africa was often predetermined by the colonial powers. Due to the fact that the coverage of formal social security systems in Africa is still very lim-ited, it should suffice here to look only broadly at the systems of those countries which were under British or French rule. After independence, the systems were often further developed, but the underly-ing principle remained.
In general, the francophone countries provide a better social protection in comparison to the anglo-phone countries (Gruat; 1990:406 & Zwanecki, 1999:5). Countries formerly under French rule have schemes based on social insurance principles and employer financed family allowances. In contrast, those under British rule have hardly any family allowances schemes and social security is mainly or-ganised through provident funds as compulsory savings schemes, which provide lump sum benefits without insurance elements based on solidarity principles. The only exception is compensation for employment injury which is based on social insurance (Sigg, 1994: 67 & Sooth, 1992:55 & Gruat, 1990: 408).
Social assistance is very much underdeveloped with the notable exceptions of Gabun, Mauritius, Zambia and Zimbabwe, where benefits or health care is provided for the poor after the application of a means-test (Sooth, 1992:56).40
In general, the social security systems still favour civil servants and their families, which is a legacy of the colonial history. Wage earners in the formal sector are predominantly only protected against em-ployment injury and old age. Unemployment benefits are largely non-existent. Many systems also experience administrative difficulties caused by over-centralisation which jeopardises the services (Sigg, 1994:68).
An outstanding example with regard to the development of a comprehensive social security system is Mauritius and it will therefore be looked at shortly:41
The development of a social security system in Mauritius started over 100 years ago and the social policy efforts after independence in 1968 had a good starting point as especially a fairly well devel-oped administration was already in place.
The social security system in Mauritius covers the following aspects and is built on a combination of social insurance and social assistance:
• health care
• pension scheme
• employment injury and invalidity
• social assistance for families, disabled persons, unemployment benefit
Government officials and the military are excluded from the schemes and have much better benefits than the rest of the population.
The state provides free health care for people below a certain income level (ten times the minimum wage). People with a higher income have to pay and hence contribute to the costs of the system. The
40 This is besides South Africa which as the main focus of the research is explained in detail in the other chapters. 41 Based on Sooth, 1992
Social security in an international context - definitions, models and possible lessons 43
remaining costs which amount to 9.2% of the overall budget are covered by the state and are well above the average of sub-Saharan countries (5-6%).
The state provides a basic pension for all citizens which is seen as a contribution from the side of the state to the living expenses of persons older than 59 years. In 1990, the level of the pension amounted to approximately 31% of the minimum wage. In addition, contributions to the National Pension Scheme are compulsory for people in formal employment. Employees and employers pay 3% and 6% respectively. Failure to pay from the side of the employer results in high penalties or up to 3 months in prison.
Insurance against employment injuries and invalidity is based on contributions and depends on the level of income. In case of permanent disability the pension amounts to 80% of the former wages which is higher than the normal pension. However in case of death, the widow/er receives only 50% and dependants only 7.5% of the wages.
The state provides social assistance for people who are disabled, who were deserted or who are unem-ployed for longer than six months and not able to support themselves or their families. The assistance is means-tested.
Looking at the system, one should be aware of the fact that Mauritius has only a population of circa 1.1 million and at the moment (1991) has a shortage of labour. In addition, due to large sugar planta-tions in rural areas and the compulsory insurance for the employees, the overall coverage rate is rela-tively high in comparison to other countries. However, those ‘self-employed’ in the informal urban sector are still excluded.
Thus, there are positive examples for the extension of coverage, and other countries are trying to im-prove the existing systems and trying to extend coverage as well. However, the biggest challenges for social security in Africa remains the integration of the large informal sector, rural as well as urban.
A comparison of the regions looked at here, reveals the differences in the coverage of the EAP, but it also shows that other developing regions have to fight the same battle:
Regions Coverage of EAP
Europe and North America 81%
Asia 23%
LAC 40%
Africa 16% Table 2-5: Coverage of EAP in different regions according to Gruat as quoted by Sooth, 1992:57-58
2.3.) Lessons for South Africa While the previous sections highlighted the developments and different aspects of social security on an international level, this section now draws conclusions from this international experience with regard to the specific South African situation. Of importance are the similarities and differences in the context under which social security systems were built. They are crucial to show where possible lessons are to be learned as well as to see where certain factors are not applicable to the South African context.
2.3.1.) Lessons from the capitalist countries The roots of social security systems in the capitalist countries where shown to be during the shift from feudal societies towards industrialisation. While some people might argue that South Africa is at a similar turning point, a closer look shows fundamental differences:
The industrial revolution was in need of a massive labour input. During most of the time it was not the issue that people could not find work. Most of the people were productive and working, however, they were in desperate need of a safety net, which prevented them from impoverishment in certain contin-gencies – e.g. sickness, work injuries, death of the breadwinner, and temporary unemployment through
Social security in an international context - definitions, models and possible lessons 44
fluctuations in the economy. Long-term unemployment was not the main threat for healthy people, therefore this function in social security was added relatively late.
South Africa is in a different situation. The majority of people are impoverished already. The economy suffers under structural high unemployment rates and competes on a global market for a niche to cre-ate jobs. Social security in the South African situation is more asked for a contribution towards inte-grating the long-term poor into the economic sphere. This directly contrasts with the situation in Europe and America where the construction of security measures against the loss of earnings was the focus.
Historically, developments of social security in capitalist countries focused on the working class. The state and the systems safeguarded people against the consequences of life-cycle contingencies. In the period of high economic growth and high employment rates the systems were extended. Especially the social democratic countries were able to use social security as a tool towards a more egalitarian society and combine this with economic growth for quite a long time. Again that situation was quite different from today’s South Africa.
The systems were built on the assumption that people could get jobs and that the economy was grow-ing. The crisis occurred, in all three types of social security systems, when it became apparent that on an international market labour becomes a global commodity and that increasingly international capital flow dominates the decisions even of powerful nation states. The systems were not equipped for this situation. They were not geared at empowering people to seek innovative employment chances. Often to the contrary, high benefits for the unemployed created economic incentives not to seek employ-ment. These ‘poverty traps’ opened the door for a wide scale attack from the political right against social security. While it was discussed that this critique did not lead to a massive reduction in real expenditure levels for social security, significant changes have been made to overcome the structural problems.
Despite all the differences with regard to the South African situation, several lessons from the experi-ence in capitalist countries are important:
• Social security has proved to be an essential tool for social stability.
• Social security can achieve more egalitarian societies.
• Market principles must not be neglected in the design of a social security system. Hence, social security has to proactively seek to empower people to become economi-cally active.
• There are limits to social security benefits. Especially, when unemployment benefits become so high that they create disincentives not to seek employment, this can have adverse effects on the economy.
• Social security systems must be linked to the overall economic development, so as not to overburden an economy in times of recession.
2.3.2.) Lessons from East Asian countries The East Asian countries were able to realise high economic growth with relatively low levels of gov-ernment spending on social security. The state seldom took the role of a provider for social security. Instead, often authoritarian governments regulated the economic and social spheres through direct interventions in the market e.g. obligations on business, land reform, building of infrastructure etc. Combined with high employment rates, these measures were the main reason for a reduction of ine-qualities.
It becomes clear that the East Asian countries differ quite substantially from the South African situa-tion with regard to the role the state plays in the economy and with regard to the circumstances of rapid economic growth through foreign investment.
Furthermore, the recent crisis in the East Asian economies has sparked critique that exactly the lack of social security was a reason why the crisis was so bad:
Social security in an international context - definitions, models and possible lessons 45
[…] [A]n important lesson from this crisis is the need for ex-ante social safety nets, that ensure appropri-ate, temporary, responses during crisis to protect the poor. (World Bank, 1999:107-108)
The employment focus without social security measures has severe effects on poverty levels during crises.
With increasing democratisation and the ability of pressure groups to voice their concerns, social secu-rity also becomes a more and more important tool for nation building in the region. However, one has to take into account that the ‘middle class’ is often better organised and able to voice their demands than the poor. In the South African situation where the need for poverty alleviation and reduction of inequality is important, these factors have to be taken care of.
2.3.3.) Lessons from developing countries The analysis of social security systems in developing countries exposes the problems attached to those systems which are mainly based on social insurance principles. In a context of a large informal sector, in general, the systems exclude the self-employed in the informal sector as well as in the rural sector. Here, social security could potentially fulfil both functions, as discussed above, protective and promo-tional ones. An extension of coverage would therefore be of utmost importance and would enhance the capacities of the state to address poverty and inequality through redistributive measures. Instead, the often fragmented systems which provide privileges for certain groups have the opposite (regressive) effect, if the state uses general tax to cover those privileges. While Mauritius also has problems in including the informal sector, it has set a positive example which managed to put in place a mixed system of social insurance and social assistance, with redistributive measures and poverty alleviation functions for the majority of the population.
The discussion on LAC countries and in particular on the two examples of Chile and Brazil is helpful in discovering the impacts and problems of very different reforms. The Chilean reform managed to accumulate a large amount of capital for the national economy and the focus on basic health care had positive effects on the overall health status of children. A good infrastructure for these basic services and a strong intervention, also from a financial point of view, of the state, made this possible. How-ever, the creation of a two-class system already shows dangerous effects. Complete privatisation makes redistributive measures very difficult and the financing of the public provisions precarious. Again, while the coverage of those with a long-term formal employment is very good, the state has to provide for those not covered, and the lack of pooling of risks, especially in the health sector, leads to a deterioration of the public provisions resulting in increasing poverty and inequality. Brazil has gone the opposite route, by trying to put in place a redistributive system based on an already existing inclu-sion of the large rural sector. However, the legacy of an inefficient administration, prevailing paternal-istic traditions, a weak infrastructure and existing high inequalities have severely hampered the suc-cess of the programmes. This is coupled with macro-economic instability, which does the country not allow to fulfil the goals set and to free finances.
The lessons for South Africa from this developing context are manifold: The existence of a large in-formal sector makes the going beyond a social insurance system imperative. The already existing ine-qualities and poverty levels call for redistributive measures from the side of the state. However, as the example of Brazil shows, this has to go hand in hand with building up capacities on an administrative and infrastructure level. At the same time, the macro-economic environment has to be conducive. The example of Chile privatising social insurance and by doing so accumulating capital for the national economy sounds appealing. However, it should be kept in mind, that the reform does not come with-out costs to the state and as seen, the job creation capacities of the accumulated capital have so far been limited.
The data base 46
Chapter 3: The data base This chapter clarifies the issues around the database chosen for this thesis. The outline of the extent of poverty in South Africa and microsimulation model which analyses of the coverage of the current system and tests the different options for the extension of social assistance in Chapter 7, require the following information from a data base:
• A reliable population estimate with breakdowns according to age, gender, race, prov-inces, urban/rural areas etc.
• The family and household structure people are living in, in order to reconstruct micro units, which is in particular important for the microsimulation model.
• Income/expenditure data of the individual, the family and the household to assess pov-erty levels and the impact of cash transfers.
• Different indicators such as access to water, health services, housing, education etc. to obtain a more complex picture of poverty.
Data from household surveys are normally most suitable to provide this kind of information. They often provide the latest information in the most detailed manner as they are based on a representative sample of the population and designed to collect data for poverty analysis and policy planning.42 A census in comparison aims at collecting information from each and every person in the country; first and foremost to obtain a reliable population estimate and in addition an overview of the living condi-tions. Household surveys are, therefore, able to obtain and provide more detailed information in a shorter period of time.
Moreover, detailed information on the individual, and on the family and household structure is needed for building a microsimulation model as the effect of policy is simulated on a micro unit level and then aggregated.43 Such information is normally only provided by household surveys.44 While Haarmann, D (1998b) developed the microsimulation method in the South African context to calculate the costs and administrative requirements for welfare policy, this research is going to extend this and focuses especially on the social effects of different policy options.45 Thereby, it strives to point especially to the poverty alleviation effect of different policy options on different levels.
To decide on the most suitable data set, this chapter first gives an overview of the different data sets currently available in South Africa. It discusses their reliability in particular in terms of their popula-tion estimates, the information on the household structure and the income/expenditure data. On this basis the case for taking the SALDRU data for this research is made. The second section explains and illustrates the assumptions and calculations for updating the SALDRU data to 1996 standards. The update has been done for the sake of comparison with the 1996 Census.
3.1.) The current data situation in South Africa Before the first democratic election in 1994, national data collection and evaluation were controversial issues due to the apartheid ideology of the government and the use of data to serve the political interest of the regime. Often the so-called 'independent states' (Transkei, Bophuthatswana, Venda and Ciskei)
42 See Grosh & Munoz, 1996: foreword and Ravallion, 1992:8-10 43 Haarmann, D 1999a:2-3 & 199b:3-11 44 See ‘3.1.3.) 1996 Census’ 45 See Harding, 1996:1 & Gilbert, 1998:5-6
The data base 47
were not at all or differently covered. The last full national census was conducted in 1970, whereas the censuses in 1985 and 1991 excluded the TBVC states. Public willingness to participate in the collec-tion process was low and the reliability of the data was therefore questionable.46 Furthermore, NIEP(1996:2) points out that data gathering during that period suffered inter alia from problems with the reporting procedures, with the classification of the data and with deficiencies in the actual informa-tion collected. Hence there was no reliable data for the entire country.
With a new government, this situation changed. Accurate and reliable information was regarded as highly important for the planning of the reconstruction and development of the country as a whole and the formulation of policies for the improvement of the living conditions of the people. The attitude of people to participate in surveys and censuses was also likely to change to a higher acceptance.47 Therefore attempts could be made to collect data which provide an accurate and detailed picture of South Africa. The sets which are relevant and suitable for this research are the SALDRU data, the yearly October Households surveys since 1995 and the 1996 Census.
3.1.1.) SALDRU Shortly before the 1994 elections, SALDRU in co-operation with the World Bank and the support of the ANC and the PAC, made a national household survey, visiting nearly 9,000 households and col-lecting information on more than 40,000 people. Details on the household structure, income, expendi-ture, employment, health status, education, transport, housing etc. was gathered. The survey aimed at providing information, in particular for policy makers, on the extent and faces of poverty, the relation-ship between poverty, education, gender, age and household income with a special focus on female headed households (SALDRU, 1994:i-iii).
For drawing a representative sample and for obtaining a national picture, SALDRU decided to use a two-stage self-weighting design using Census Enumerator Sub-districts (ESD) and households. In principle that meant the sample acquired a representative sample in an independent count and was not dependent on accurate census population estimates. However, due to problems during the data collec-tion like violence and under-representation of ‘whites’, adjustments to the weights have been made on a provincial level in order to match the racial distribution based on the 1991 Census as well as Sadie's projections (SALDRU, 1994:vii-viii). The population data is therefore relatively (although not en-tirely) independent of the formerly 'biased' census estimates. Based on the survey, SALDRU estimated a total population of 38.119 million people in 1993.
Looking at the information on the household structure, the record proved to be accurate: From the ‘flying’ that was done to check on the questionnaires after they had been completed, it was clear that many sections were not as reliably completed as one would have wished them to be. However, with a few exceptions, the detail on the household roster, which contains a good deal of basic information on the members of the household and their interrelationship seems to have been completed with a great deal of reliability. (Le Roux, 1995:1)
The survey has been criticised for undersampling certain groups like worker hostels' occupants and illegal immigrants. In certain areas some samples of the smaller 'population groups' were too small and while this has little effect on the national aggregated level, conclusions drawn for only these areas have to be approached with caution (e.g. Northern Cape).48 While working with the data one has to be aware of these shortcomings.
In general, care has to be taken when working with income data as this is often underreported. On the one hand income varies especially in poorer households. In addition, household members do often not know the income of the other members. Hence, the information captured in the data is not entirely representative. On the other hand people do not like to declare their income as they might be afraid of being caught for tax evasion even so confidentiality is being ensured. Consumption, i.e. expenditure,
46 See Haarmann, D. 1998a:95 47 However, as will be shown in ‘3.3.2.) Adjusting the SALDRU data to match the Census 1996 by race and province’
‘whites’ appear to be undercounted in these later surveys which indicates reluctance from their side to participate. 48 SALDRU, 1994:vii
The data base 48
tends to be smoothed over time49 and members of the same household have a better idea of what the other members spent in comparison to what they earn. Ravallion (1994: 15) summarises these obser-vations by saying:
i) current consumption will almost certainly be a better indicator than current income of current standard of living, and ii) current consumption may then also be a good indicator of long-term well-being, as it will reveal information about incomes at other dates, in the past and future.
Therefore expenditure data is preferred in poverty analysis.50 Haarmann, D. (1999a:16-18) analysed the difference of reported income and expenditure in the SALDRU data and concluded that while in-come tends to be undercounted in the poorer groupings and expenditure in the wealthier groupings, the difference is not exceptionally high. This is an indication that the data collection of these items is rela-tively reliable but for of the above-mentioned reasons, expenditure is the preferable indicator for pov-erty.51
Overall, it can be concluded that the SALDRU survey produced a reliable data set with a great variety of indicators which are able to provide a detailed picture of the South African living standards.
3.1.2.) October Household Surveys Since October 1994, the Central Statistical Services (CSS), now Statistics South Africa (Stats), has been conducting yearly household surveys which include the entire country. The surveys aim at pro-viding not only information on life in South Africa at a given point in time and but also aim at measur-ing changes in the living standards and circumstances of people over time (CSS, 1999:1). Very similar to SALDRU, data is collected on the household structure, income/expenditure level, educational status, health status, economic activity, access to social services, housing, access to water.
In 1994 and 1995, 30,000 households were interviewed. The main difference between the 1994 and 1995 surveys lies in the sampling. While in 1994 30 households from 1,000 Enumerator Areas (EAs) were sampled, the 1995 survey visited 10 households in 3,000 EAs. Hence, the 1995 survey is superior to the 1994 one in terms of its representativity, as more different areas were visited. Unfortunately, the 1996 and 1997 surveys have still not been released to the public52. Given this situation, the survey of 1995 is the only alternative to the SALDRU data that could be considered for this research.
In contrast to the self-weighting methods used for the SALDRU survey, the October Household Sur-vey was sampled and weighted according to the 1991 Census. On their own account, Stats SA (1999a:4-5) reports that there were problems in the process: The 1991 census did not include the TBVC states and hence their size had to be estimated. Certain areas, especially rural areas, were not divided into EAs and while in 1994 a 'sweep-census' was done covering an entire magisterial district, in 1995 these areas were further sub-divided. However, at the same time when the data for the survey was collected, new EAs were demarcated for the 1996 census. This led to confusion and problems during the collection process. Originally, the weighting was to be done by magisterial district, but because of the boundary problems, the provincial level was chosen. The survey arrived at a population estimate of 41,5 million people living in South Africa in 1994.
The information on the household structure is captured in a similar way to that of the SALDRU sur-vey. However, one has to be aware that while in the SALDRU questionnaire, the relevant question is right in the beginning, in the October Household survey it is not in the first section. Due to the fact that the first section is often completed with more accuracy than the later ones - as the flying of the SALDRU questionnaire proved - the information on the household structure in the October Household survey is likely to be less reliable than the SALDRU data.
49 Sautter & Serries, 1993:52 50 Ravallion, 1994:14-16; Carvalho & White, 1994:22-25 51 For a detailed analysis of the difference between the consumption figures and the income data, see ‘5.1.1.) A com-
parison of consumption and income measures and a deprivation index‘ 52 The decision which data set was to be used had to be made by April 1999 as at that time the work on the model
started. A change of the data set is not possible at a later stage.
The data base 49
In conclusion one can say that the advantage of the October Household survey lies in the size of its samples. Three times more households were visited than by SALDRU and one can hence expect a more representative picture. However, having a closer look at the data, several problems arise: The population estimate was based on the flawed Census' 91 and furthermore, there were admittedly prob-lems with the EAs during the collection process. Seeing that the population estimate of SALDRU on the other hand was a nearly independent one, more reliability can be expected.53 The managing of the subsequent surveys by Stats SA produces some doubt about the methods applied as well as their gen-eral reliability. The fact that the 1996 and 1997 surveys have not been released 2 1/2 years and 1 1/2 years respectively after the surveys were done, although several release dates were announced, may cause serious concern. First one has to assume that one of the reasons for the delay is a lengthy clean-ing up process because of mistakes, inconsistencies and outliers in the data. Furthermore, the exercise to repeat the survey on a yearly basis to monitor the development of the living conditions over time is of much less value if the surveys are not speedily released soon after they have been completed. Sec-ondly, Stats SA uses the data in their own publications54, but does not make it available to the public. By doing so they do not only have an information advantage but their claims and figures cannot be checked by independent researchers.
3.1.3.) 1996 Census The first census of the new government was conducted in October 1996. The census aimed at not only providing information on the size of the population with age, gender and 'race' distribution, but also on the language profile, educational profile, access to social services, unemployment figures, income levels etc. A census can because of the costs involved not be as detailed as household surveys. The most important difference from the point of view of this research between the census and household surveys is the information given on the household structure. The census questionnaire did not include a question on the interrelationship between the household members. Therefore, the family and house-hold structure cannot be reconstructed. For this reason, the census on its own is not suitable for this research. However, the 1996 census is the latest survey available on the South African population and these findings and indications can therefore not be ignored, especially in the light of the flawed cen-suses during the apartheid regime. However, as will be shown below, the 1996 census results also have to be treated with caution.
Immediately after the census, a nationwide post-enumeration survey (PES) was done covering 1% of the EAs to check the count55. This was done to adjust any undercount instead of using a population-projection model for that matter. This is said to be the reason for the differences of this new census and the older ones with regard to the size of the population, the age distribution, the extent of interna-tional migration and relative size of population groups and provinces (Stats SA, 1998:i). The PES sur-vey included
• basic demographic information (age, sex, language etc.)
• the question whether the household and each person was counted in the census,
• the opinion of the household regarding the census,
• the question whether the questionnaire and each person could be matched back to the census questionnaire. This last section was marked 'For office use only' (Stats SA, 1998:5).
The first - preliminary - adjustment to the census was simply based on the question whether the person had been counted in the census or not. This method produced an undercount of 6,8% and the accord-ingly adjusted population estimate arrived at 37.9 million people. In a second and more complicated stage, the PES questionnaires were matched with the census questionnaires. This process involved matching the EAs, the households and the persons. The completion of the process took nine months
53 For more detail see ‘3.2.) The debate about the population data’ 54 See, for example, Orkin, 1998 Unemployment and employment in South Africa
http://www.statssa.gov.za/U&E/prelim_p.htm (15.03.99) in which he uses the surveys from 1994 to 1997. 55 See Stats SA, 1999b:5
The data base 50
and the final undercount was determined to be 10.7% (Stats SA, 1998:2). The census was then ad-justed on the basis of this final undercount and arrived at a total population of 40.58 million people in South Africa in October 1996.
Problems and points of criticism have been raised against the method and process of arriving at the final population numbers. On Stats SA (1998:17-18) own accounts, the PES had its limitations: Due to the short planning time of one year for the census itself, there was even less time for planning the PES. The methodology used was only developed and revised during the PES and there was no testing done (e.g. of the questionnaire). The planned evaluation of the PES will only benefit the next census. Prob-lems were experienced especially during the matching process of the census and PES results. 22% of the sample was 'unmatched' which is fairly high and indicates an underestimate of the undercount. The undercount might be further understated as
(…) there is always a tendency for the PES and census alike to miss the same people who are difficult to contact or do not want to be identified (…) (Stats SA, 1998:18)
Besides these limitations which have been identified by Stats SA already, other deficiencies need to be highlighted: The advantage of a census is that in theory every person is counted and hence the popula-tion estimate should be quite accurate. However, the population estimate of this census was eventually based on a 1% survey and by doing so it lost its advantage and is less accurate. Research (Dorrington, 1999) comparing the adjusted count with demographic modelling concluded that the census results are therefore possibly deficient and that the population might be underestimated to an extent of one to two million. The research, while acknowledging that the count is in general superior to demographic mod-els, concludes that models do have an important role to play and should be applied for further in-depth investigation of the census. It is also of concern that only the adjusted data but not the raw census data is available to the public, thus preventing an important independent check on it.
3.1.4.) The data set chosen for this thesis The previous sections have discussed the different data sets, their underlying methodology and their advantages and disadvantages. It was argued that the Census on its own is not suitable for this research as it lacks the detail on the household structure, which is required for a research of this kind. It has also become clear that there is criticism of its population figure. Having looked at the SALDRU data and the 1995 OHS, SALDRU is the data base to be preferred because of its relatively independent count, fewer problems during the sampling and collection process in comparison to the OHS and the reliabil-ity of its information on the household structure. However, the problem arises that the data was col-lected in 1993 and for the research one would wish for a more up-to-date estimate. The next section therefore approaches the debate on the population figures and tries to find a satisfactory solution for updating the SALDRU data taking account of the issues raised in the debate.
3.2.) The debate about the population data Up to the 1996 Census, Sadie's model dominated the population debate. While there have been other population estimates in the meantime, Sadie’s data was usually used as a reference point.56 The main concern with his model is the fact that while the population development of ‘whites’, ‘indians’ and ‘coloureds’ was built on data gathered during the 1980s, the estimate of the 'african' population is based on the 1970 Census as later data proved to be even more deficient. The point of criticism is hence that for the largest proportion of the population, the model was built over the longest period of time and with the least reliable data. Therefore, all the censuses up to 1996 suffered from this uncer-tainty as they were adjusted according to Sadie's model.57
When the preliminary results of the 1996 Census were released, a controversy started. On the one hand Stats SA declared that there are ‘only’ 37.9 million South Africans. Sadie's model in contrast indicated
56 For example the FFC, up to the 1996 Census, defended a much higher population estimate than Sadie’s. For a de-
tailed debate about this issue see Haarmann, 1999a:2-12. 57 See Davis & Soggot, 1997 & Haarmann, D., 1999a & CSS, 1997
The data base 51
a population of about 42 million people. The discrepancy was mainly explained by the ‘african’ fertil-ity rate. Stats SA said that the preliminary results would still be readjusted after matching the census questionnaires with the PES questionnaire. However, they claimed that this final adjustment would be in the range of no more than 2%.58 As outlined above, however, the undercount increased by 3.9% from 6.8% to 10.7%. It was then stated that the final adjustment brought the total population to 40.58 million.
Strangely, this constitutes an increase of 7,1% to the preliminary results instead of the expected 3,9% in line with the increase of the undercount. Stats SA does not give an explanation for this discrepancy. In order to reconstruct and check the adjustments made, the release of the raw census data by Stats SA instead of only the adjusted data would be of utmost importance.59
In October 1998, a task team reviewed the census to establish whether the estimate of the population is accurate. The underlying methodology of the review was to compare the adjusted 1996 Census count with the results of a demographic model. Following Sadie’s approach, his estimate of the 1970 popula-tion was used as a base population for the demographic model. Dorrington, a member of the task team, then applied various assumptions to project the population to 1996. He described these assumptions in detail in the Aids and Demographic model of the Actuarial Society of South Africa (ASSA600). Dor-rington comparing different projection assumptions of other researchers defends his own choices:
(…) [I]t would appear that the basis used for the projections can certainly be justified. However, even if this conclusion is not accepted it is unlikely that the differences between the basis assumed and a pre-ferred basis would be large enough to negate the conclusions drawn in the report. (Dorrington, 1999:21)
The following table provides the total fertility rates of the ASSA model and those used in other models to indicate the range of the differences.
Year Sadie Udjo ASSA600
70 5.5 4.9 5.4
75 5.0 4.6 4.9
80 4.4 4.2 4.3
85 3.9 3.5 3.7
90 3.6 3.4 3.5
96 3.3 3.3 3.2 Table 3-1: Comparison of the total fertility rates (Source: Dorrington, 1999:21)
Based on the ASSA assumptions, the inconsistencies between the adjusted count and the model, which are of importance for this research, are identified by Dorrington (1999:15-18) as follows:
1. 0-4 year olds: In comparison to the model, it is argued that the census misses about 600 000 children in this age group. Dorrington attributes part of this phenomenon to a declining fertility rate, which is not accounted for in the model. However, he argues that the drop is quite dramatic in particular if compared to the next age group (5-9 years olds) and should hence have been reported by other surveys.
2. 10-14 year olds: In his projections, Dorrington identifies a smaller 10-14 year old age group and estimates the alleged over-count by the adjusted census at about 333,000 children in this age group. Possible explanations are age misstatement in the census or alternatively an underestimation of the fertility rate between 1980-1985 by the model.
3. Age group above 60: Based on his model, Dorrington reasons that there is an over-count of females above 60 and males above 65. He explains this by a peculiar pattern of age misstatement applied by people to qualify for the SOAPs. Furthermore, he ar-gues that there is a strange and unexplained pattern of excessive numbers at ages above 65 within the Census data.
58 Davis & Soggot, 1997 59 The raw data is currently not available form Stats SA.
The data base 52
4. Shortage of men relative to women: Dorrington argues that the Census under-counted men to an extent of up to 1.1 million over all age groups. This is attributed to the reported sex ratio of 52% females to 48% males. Dorrington states that
(…) such a ratio is impossible unless there has been significant in-migration of fe-males (or out-migration of males. (ASSA 600, 1999:Appendix 1)
5. Foreigners: Dorrington argues that while some 500,000 foreign-born men were iden-tified in the Census, according to his estimates one has to calculate a 50% lie factor into this. This would mean that 1 million foreign men were actually counted, whereas only half this number were identified as such. If this is the case the undercount of men in the Census could be larger than his model indicates, because the number of South African men in the model nearly equals the total number of men in the Census. Dor-rington concludes that one would have to add 1,000,000 more immigrants to the total number of 960,000 non-citizens counted in the Census.
6. Total number of population: Dorrington concludes that there is an undercount of 1-2 million, which would bring the population estimate to somewhere between 41.5 and 42.5 million people.
Dorrington’s research is the most comprehensive critique on the census so far. Therefore one has to take note of the contentious points mentioned above. However, the same critique which was brought forward against Sadie’s projection, namely that for the largest proportion of the population a demo-graphic model was built over a long period of time, has to be applied here as well.60
3.3.) Reweighting the SALDRU data For the sake of comparison with the official statistics used in South Africa, it was decided that the SALDRU data should be reweighted to 1996 standards. This allows one to compare the results directly with tables available from the Census 1996. Three different weights have been developed to adjust the SALDRU data to 1996 standard, and the underlying methodology of the calculations is discussed. The subsequent section then compares these three weights. The impact of the different weights is evaluated by looking at the age distribution of the population taking account of the issues raised by Dorrington and the distribution over the provinces. Finally, some concluding remarks will clarify how these dif-ferent weights are used in the following chapters of this thesis.
The following three weights are to be examined:
1. SALDRU 96 - Sadie: Using the original SALDRU weights adjusted by the population growth rates predicted by Sadie for the years between 1993 to 1996.
2. SALDRU 96 - prov: In/de-creasing the SALDRU weights to match the population figures of the Census 1996, according to race and province.
3. SALDRU 96 - age: In/de-creasing the SALDRU weights to match the population fig-ures of the Census 1996, according to race, age-group and gender.
The following paragraphs show how these three weights were calculated:
3.3.1.) Adjusting the SALDRU data for the time period of 1993 - 1996 according to Sadie The first adjusted weight is built on the original SALDRU weight and adjusted for the time period from the end of 1993 to October 1996 by the population increase Sadie predicted in his population model. The weights are increased by the following percentages:
• ‘african’ by 7.12%
60 See page 50
The data base 53
• ‘coloured’ by 4.16%
• ‘indian’ by 3.95%
• ‘white’ by 2.01%
3.3.2.) Adjusting the SALDRU data to match the Census 1996 by race and prov-ince The second weighting variable is based on the Census count according to province and race.
Table 3-2 now compares the SALDRU data collected at the end of 1993 and the results of the Census collected in October 1996. It further provides information about an in- or decrease from the perspec-tive of the SALDRU data.
The data base 54
Ea s te rn Ca pe Fre e S ta te Ga ute ng Kwa zulu-Na ta l Mpuma la ng a No rthe rn Ca peNo rthe rn P ro v inc e No rth We s t We s te rn Ca pe S o uth Afric a
Afric a n Census 5,448,495 2,223,940 5,147,444 6,880,652 2,497,834 278,633 4,765,255 3,058,686 826,691 31,127,631
in /de. vs S. 3 .2 5 % 0 .3 6 % 1 4.2 7% 7 .4 7 % -15 .9 7% 6 3.1 7% 5 .5 1 % 7 .6 7 % 1 3.3 3% 6 .4 7 % Table 3-2: Comparison of the SALDRU data 1993 vs. Census 1996 according to the distribution of race and province - without adjustments
The data base 55
Ea s te rn Ca pe Fre e S ta te Ga ute ng Kwa zulu-Na ta l Mpuma la ng a No rthe rn Ca peNo rthe rn P ro v inc e No rth We s t We s te rn Ca pe S o uth Afric a
Afric a n Census 5,479,664 2,233,491 5,188,861 6,937,875 2,512,294 282,741 4,797,277 3,073,928 853,024 31,359,154
in /de. vs S. 3 .2 1 % 0 .6 2 % 1 5.2 1% 8 .3 4 % -16 .2 8% 4 2.2 9% 5 .2 9 % 6 .2 8 % 1 4.4 2% 6 .4 7 % Table 3-3: Weighting table for the SALDRU data 1993 to Census 1996 according to the distribution of race and province - with adjustments
The data base 56
Looking at Table 3-2 three problems become evident:
1. While the census has a category of "unspecified / other” for the race group, the SALDRU data clearly identified everybody to a race group.
2. There are six cases (e.g. Northern Province / ‘coloured’) where the SALDRU data did not have representatives included in the data set.
3. Furthermore there are four cases (e.g. Mpumalanga / ‘coloured’) where the SALDRU data only included very few representatives in the sample. And this means that if they were to be reweighted to the Census results they would be multiplied by a number of times of their original weight in the sample.
These problems are solved in Table 3-3 in the following way:
1. The unspecified cases of the 1996 Census are allocated to the provinces according to the percentage each race group (vertically) occupies in the province. This vertical dis-tribution is based on the assumption that the unspecified cases occur randomly in each race group.
2. However, in the case of problem 2, where SALDRU included no data, the people identified in the Census are allocated to the provinces (horizontally) but within the same race group. The underlying assumption is that the socio-economic status of these missing cases is best represented by people in the same race group. Again this division is done according to the percentages represented by each province in the particular race group.
3. The underlying idea with regard to problem 3 is that if relatively few cases are weighted much higher than in the original data, this could potentially distort the data in ways which are not controlled. In order to avoid this, it was decided that the re-weighting should not be allowed to add more than two times the weight it originally had. Therefore those cases which exceeded the 200% mark were distributed horizon-tally similarly to the cases in problem 2.
Beside these problems, it is interesting to note that in most provinces the census undercounted 'whites' in comparison to SALDRU. This does not effect the national count on a large scale, however, it can be interpreted that 'whites' are more reluctant to participate in post 1994 surveys. One can only speculate on the reasons but less political acceptance of the new system, mistrust towards the new government, and suspicion towards the enumerators surely contribute to this reluctance. From the point of view of this research, the implications of these 'missing whites' might lead to more conservative cost calcula-tions, as there is a high correlation between 'whites' and ‘higher income’, and hence rather more than less people are counted as eligible for new social assistance schemes.
3.3.3.) Adjusting the SALDRU data to match the Census 1996 by race, age group, and gender. Following the approach Statistics South Africa is updating their earlier OHSs, it was felt that a third weighting approach should be explored.
(…) [T]he data in these surveys have been re-weighted by population group, gender and age group, on the basis of Stats SA’s preliminary estimates of the size of the population in 1996. (Orkin,1998)
Table 3-4 shows the weighting table for this variable. Note that the unspecified cases are also distrib-uted according to the percentages of each age-group within the race group of the specific gender.
Table 3-4: Weighting table for the SALDRU data 1993 to Census 1996 according to race, age-group, and gender
The data base 58
3.4.) Features of the adjusted SALDRU data This section analyses the features of the three differently adjusted SALDRU data in the light of the 1996 Census and the points of criticism raised by Dorrington. By doing so, the differences and trends in the data will become apparent which in turn will lay the ground for the decision which weight to choose for the reweighting. Furthermore, the implications of the different adjustments in the model can be evaluated. The data is presented below according to age group, race, province and sex ratio.
Note that while the SALDRU weight adjusted according to Sadie and according to the provincial fig-ures of the Census do not affect the household structure, the adjustment by age does.
The data base 59
C e n s u s 9 6
" A f r i c a n "7 6 %
" I n d i a n "3 %
" W h i t e "1 1 %
" O t h e r "1 %
" C o l . "9 %
S A L D R U 9 6 - S a d i e
" A f r i c a n "7 7 %
" C o l . "8 %
" I n d i a n "3 %
" W h i t e "1 2 % " O t h e r "
0 %
S A L D R U 9 6 - P r o v
" A f r i c a n "7 7 %
" C o l . "9 %
" I n d i a n "3 %
" W h i t e "1 1 % " O t h e r "
0 %
S A L D R U 9 6 - A g e
" A f r i c a n "7 7 %
" C o l . "9 %
" I n d i a n "3 %
" W h i t e "1 1 % " O t h e r "
0 %
0
1 ,0 0 0 ,0 0 0
2 ,0 0 0 ,0 0 0
3 ,0 0 0 ,0 0 0
4 ,0 0 0 ,0 0 0
5 ,0 0 0 ,0 0 0
6 ,0 0 0 ,0 0 0
0 - 4
5 - 9
1 0 - 14
1 5 - 19
2 0 - 24
2 5 - 29
3 0 - 34
3 5 - 39
4 0 - 44
4 5 - 49
5 0 - 54
5 5 - 59
6 0 - 64
6 5 - 69
7 0 - 74
7 5 - 79
8 0 - 84
8 5 +U
n spe c ifie
d
C e n s u s 9 6
S A L D R U 9 6 - S a d ie
S A L D R U 9 6 - P ro v
S A L D R U 9 6 - A g e
0
1 , 0 0 0 , 0 0 0
2 , 0 0 0 , 0 0 0
3 , 0 0 0 , 0 0 0
4 , 0 0 0 , 0 0 0
5 , 0 0 0 , 0 0 0
6 , 0 0 0 , 0 0 0
7 , 0 0 0 , 0 0 0
8 , 0 0 0 , 0 0 0
9 , 0 0 0 , 0 0 0
E a s t e r n C a p e F r e e S t a t e G a u t e n g K w a z u lu -N a t a l
M p u m a la n g a N o r t h e r nC a p e
N o r t h e r nP r o v in c e
N o r t h W e s t W e s t e r nC a p e
C e n s u s 9 6S A L D R U 9 6 - S a d ieS A L D R U 9 6 - P r o vS A L D R U 9 6 - A g e
C e n s u s 9 6
F e m a le5 2 %
M a le4 8 %
S A L D R U 9 6 - S a d i e
F e m a le5 3 %
M a le4 7 %
S A L D R U 9 6 - P r o v
F e m a le5 3 %
M a le4 7 %
S A L D R U 9 6 - A g e
F e m a le5 2 %
M a le4 8 %
A g e
S e x r a t i oP r o v in c e s
R a c e
1 2
3 4
Figure 3-1: Features of the differently adjusted SALDRU data
The data base 60
Analysing the different data sets it is interesting to note that the difference between the SALDRU data adjusted to Sadie's growth rate for the years of 1993-1996 compared to the SALDRU data reweighted to the 1996 Census results is negligibly small. The total population figures match nearly perfectly with a difference of as little as 110,000.
Figure 3-1 makes it obvious that there are great similarities in the results of the adjustment according to Sadie and according to the provincial Census figures. For simplification the two will therefore in the following jointly be referred to as the “SALDRU weights”. As was to be expected they differ in the distribution according to provinces. The main differences are represented in the count for Gauteng, Northern Cape, and the Western Cape, where the SALDRU data undercounts in comparison to the Census 1996 and in Mpumalanga, Eastern Cape, and the Free State, where it overcounts. It is interest-ing, however, that both arrive at nearly the same total population figures.
For comparative reasons the detailed analysis of the different adjustments follows the points of criti-cism identified by Dorrington of the Census61:
1. 0-4 year olds: Due to the fact that the SALDRU-Age variable was matched with the age structure of the Census, it indicates less children than the SALDRU-weights. Es-pecially in the age group 0-4 it indicates about 660,000 children less. Thereby the SALDRU data would confirm Dorrington’s claim that about 600,000 in this age group are missing.
2. 10-14 year olds: While Dorrington argued that the Census over-counts this age group, the SALDRU weights would not only confirm the Census pattern, but even exceed the Census count by about 290,000.
3. Age group above 60: The SALDRU weights confirm Dorrington’s projections that in the Census the age groups above 65+ years seem relatively high. The Census and ob-viously the SALDRU-age weight as well exceed the SALDRU weights by some 290,000.
4. Shortage of men relative to women: The sex-ratio of the SALDRU weights confirm the results of the Census. This stands in contrast to Dorrington’s projections. The sup-port of the higher female sex-ratio even in the SALDRU data is significant as SALDRU is the only more recent and relatively independent count to the Census.
5. Foreigners: The SALDRU data did not identify foreigners at all. The questionnaire did not allow for that and hence foreigners were either not counted or not identified as such. This would also explain why the SALDRU weights indicate - although only marginally - continuously fewer people in the age groups 25-60 than the Census does, as one can assume that in-migration or foreigners coming to South Africa are mostly in these age groups.
6. Total number of population: As mentioned earlier already, the SALDRU data ad-justed to Sadie strikingly arrives at the same total population figure as the Census. Dorrington, however, suggested that the total population was about 1-2 million people higher than this. Two arguments have to be taken into consideration here: First, Table 3-1 on page 51 has shown the fertility rate used by Dorrington for the years 1970 to 1985. He follows the higher fertility rates estimated by Sadie in comparison to the lower ones by Udjo.62 Although the difference in the rates cannot fully explain the dif-ference in the population estimate, the fertility rates during those years do show an ef-fect on the total population in particular over the working age adults. Second, while the SALDRU weights have a lower estimate of working age adults than the Census, SALDRU assumes that every person in the data set is South African whereas the Cen-sus has about 1 million foreign-born people. Given the fact that non-citizens do not qualify for social assistance, the issue is an important one for this research. If model-
61 Compare page 51 62 See Table 3-1
The data base 61
ling was done on the Census, foreign-borns would have to be excluded, lowering this estimate. By doing so, the estimate of the SALDRU weights for the working age group would then be in the same range as the new (meaning without foreign-born people) Census.63 The same applies to the demographic model and the SALDRU-age weight. Dorrington assumes about 2 million foreign-born people. If they are excluded due to the reasons mentioned above and only South Africans are considered, the SALDRU-age weight nears this estimate for the working ages.
3.5.) Uprating the SALDRU data In order to be able to model the economic impact of social security on the basis of household survey data one has to take into account that prices, wages and in fact all monetary values change over time. The two reasons for this are:
1. Inflation
2. Genuine changes in the economy
Inflation occurs due to the tendency of economies to increase the nominal values for goods, wages, and salaries over time faster than the real value. The inflation rate, meaning the rate at which nominal values increase over real values, is usually measured by the annual percentage change in the consumer price index (CPI). The CPI is based on survey data which compares the costs of a pre-determined “basket” on a monthly basis. This basket includes consumer goods (food, furniture and equipment, clothing and footwear, vehicles, other transport goods, beverages and tobacco, other goods) and ser-vices (housing, transport, other services). Each of these goods has a weight allocated to it, with which it is entered into the CPI formula. The CPI is then calculated on a monthly basis in comparison to a base year which is set at R100. Usually, the annual percentage change is given as well (Mohr & Fou-rie, 1995:112-115).
0%2%4%6%8%
10%12%14%16%18%
19901991
19921993
19941995
19961997
19981999
Figure 3-2: Inflation rate from January 1990 to March 1999 (source data Stats SA)
Figure 3-2 gives a graphic picture of the development of South Africa’s inflation rate from January 1990 to April 1999. Further down it will be outlined how and why this national CPI figure is used to account for this change in monetary values in the SALDRU data for the period of time from October 1993 to October 1996. Adjusting the base data for inflation is a standard procedure in microsimulation and is called ‘uprating’.64
63 The total population of South Africans would be higher, as the age group 0-4 years according to the SALDRU
weights is more than 600,000 higher than that of the Census. 64 For more detail see Haarmann, 1999b:7 and Harding 1996
The data base 62
The second reason for changes in monetary values are genuine changes in the economy. While infla-tion changes the monetary picture relatively quickly, genuine changes in the economy are usually much slower (except for external shocks - like complete market breakdowns). Examples for a genuine change in the economy are: increase / decrease in production, downsizing of businesses, job - creation etc. It is very difficult to actually quantify these changes and to model them on a household level. Given that the data has to be adjusted only for three years this is - as a standard practise with mi-crosimulation models elsewhere - not accounted for in this study.65
3.5.1.) Income-, regional and national based CPI figures Stats SA provides three different CPI figures:
• National cumulative CPI figures
• National CPI figures but broken down into income-/ expenditure groups: CPI according to income
groups until Dec. 1996 CPI according to expenditure
groups from Jan. 1997 on-wards
The three income group cate-gories were defined according to average direct annual in-come per household as in Oc-tober 1995 values as:
The five expenditure group categories or quintiles were defined according to total an-nual expenditure per household as in October 1995 as:
• Lower income group - up to R27,295
• Middle income group - R27,296 up to R68,239
• Higher income group - R68,240 and more
• Very low expenditure group - up to R6,340
• Low expenditure group - R6,341 up to R11,590
• Middle expenditure group - R11,591 up to R21,909
• High expenditure group - R21,910 up to R49,498
• Very high expenditure group - R49,499 and more
Table 3-5: Socio-economic CPIs
65 See also Haarmann, 1999:7
The data base 63
• Regional CPIs: Stats SA provides different CPIs for the following areas:
Western Cape Eastern Cape Northern Cape
• Cape Peninsula • Port Elizabeth / Uitenhage
• East London
• Kimberly
Free State KwaZulu-Natal North West
• Bloemfontein
• Free State Goldfields
• Durban / Pine-town
• Pietermaritz-burg
• Klerksdorp / Stilfontein / Orkney
Gauteng Mpumalanga Northern Province
• Pretoria / Centurion / Akasia
• Witwatersrand
• Nelspruit / Witbank (only from Jun 1994 onwards)
• Pietersburg (only from Jun 1994 onwards)
Table 3-6: Regional CPIs
No cumulative figures are provided for the Provinces until January 1997. It was only then that other areas besides the urban centres were included. From then onwards provincially weighted averages are available.
The SALDRU data was collected at the end of 1993 and as discussed earlier needs to be updated to October 1996 standards. Therefore it has to be decided which of the available figures is best suited to adjust the SALDRU data for the change within the 3 year period. Figure 3-3 gives a graphic picture of the differences between the various options:
The data base 64
8 0
8 5
9 0
9 5
1 0 0
1 0 5
1 1 0
Oc t .
De c .
Fe b .
Ap r .
J u n .
Au g .
Oc t .
De c .
Fe b .
Ap r .
J u n .
Au g .
Oc t .
De c .
Fe b .
Ap r .
J u n .
Au g .
N a t io n a l L o w e r - in c o m e M id d le - in c o m e H ig h e r - in c o m e
2 6 . 1 8 % 2 6 . 2 1 %2 7 . 3 5 %
2 5 . 9 2 %
0 %
5 %
1 0 %
1 5 %
2 0 %
2 5 %
3 0 %
3 5 %
N a t i o n a l L o w e r - i n c o m e M i d d l e - i n c o m e H i g h e r - i n c o m e
8 0
8 5
9 0
9 5
1 0 0
1 0 5
1 1 0
Oc t .
De c .
F e b .
Ap r .
J u n .
Au g .
Oc t .
De c .
F e b .
Ap r .
J u n .
Au g .
Oc t .
De c .
F e b .
Ap r .
J u n .
Au g .
N a t io n a l C a p e P e n in s u la P o r t E liz a b e th /U it e n h a g e E a s t L o n d o n
K im b e r le y P ie te r m a r t iz b u r g D u r b a n / P in e to w n P r e to r ia /C e n tu r io n /A k a s ia
W itw a te r s r a n d K le r k s d o r p /S t ilfo n te in /O r k n e y V a a l T r ia n g le F r e e S ta te G o ld fie ld s
B lo e m fo n te in N e ls p r u it / W itb a n k P ie te r s b u r g
2 6 .1 8 %2 7 .8 4 %
2 8 .8 1 %2 7 .1 7 %
2 5 .8 1 %2 7 .7 9 %
2 6 .5 5 %2 7 .5 3 %
2 4 .9 1 %2 5 .9 0 %
2 4 .2 3 % 2 3 .7 7 %
2 6 .1 5 %
0 %
5 %
1 0 %
1 5 %
2 0 %
2 5 %
3 0 %
3 5 %
Na tio
na l
C ap e Pe ninsu
la
P o rt E liz
a b e th/Uite
nhageE a s t
L o nd o n
Kim
b e r ley
P ie term
a rtizb
urgD urb
a n / P ine to
w n
P reto
r ia/C
enturio
n/Ak a s i
Witw
a ters r
a nd
Kle rk
sdo rp
/Stilf
o n te in/Ork
neV a a l T
r iangle
F ree S
tate G
o ldfie
ld sB lo em
fonte in
C P I - a c c o r d in g t o in c o m e g r o u p s
C P I - a c c o r d in g t o r e g io n s
1 2
34
Figure 3-3: Comparison of the national CPI figure with the income- and regional based CPI figures from October 1993 to October 1996
The data base 65
Chart 1 and 2 in Figure 3-3 compare the national CPI figures with those given for the low-, middle- and high- income groups. The maximum deviation from the national summary figure is 1.16%. The range within these three groups comes to 1.42%. It becomes obvious that in fact the difference be-tween using the national figure and the income based figures is negligibly small.
Furthermore, from a methodological point of view it has to be argued that matching the income figures with the household data seems to be unsatisfactory and unreliable for two reasons:
• The income groups are determined by household income rather than individual or adult equivalent income. Given the huge differences in household sizes in South Af-rica this division seems problematic.
• The figures are based on income and not on expenditure. Income tends to be more un-reliable, when it comes to analysing poverty.66 Given that South Africa’s poverty situation is exactly in the focus of this research, this seems to be an important argu-ment against using income based figures.
With regard to the regional CPIs (Chart 3 and 4 in Figure 3-3) the maximum deviation from the na-tional figure is 2.62% and the range 5.03%. Again this does not seem to be an excessively big differ-ence (e.g. on the R1,000 example the maximum deviation amounts to R26.2).
From a methodological point of view there are the following difficulties. As shown in Table 3-6 only from June 1994 onwards at least one area is located in each province. The question arises what CPI to allocate to Mpumalanga and the Northern Province for the 8 months prior to this. Even more impor-tantly, for the whole period of time no cumulative figures for the provinces are agreed on and only major urban areas are sampled. One cannot assume that a rural area is necessarily better represented by one urban area in the province than by the national summary. At least in this respect the national summary figure is more balanced.
In theory the superior method seems to be to choose the CPI figures which are the most detailed ones accounting for regional and socio-economic differences of inflation. However, given the data situation in South Africa and the finding that the differences are small, it was decided that the national summary figure of the CPI is the best and most transparent figure available for the specific period of time. Therefore the national CPI figure is used for uprating the SALDU data. In order to increase the mone-tary values from October 1993 to October 1996 an additional 26.18% are added.67
3.6.) Employment and income figures in the adjusted SALDRU data compared to the Census 1996 This last section analyses the employment and income figures of SALDRU and the 1996 Census.
66 For a detailed analysis of the discussion of the use of expenditure over income applied to the SALDRU data see
Haarmann, 1999:16-18. See also ‘5.1.1.) A comparison of consumption and income measures and a deprivation in-dex’
67 With regard to the income figures in the SALDU data there are 503 cases where the recorded net-payment is higher than the gross-payment. Out of these, only 8 cases of the gross-payment have recorded a positive income. To rectify this data entry error, the gross-payment for those cases has been set equal to the net-payment.
The data base 66
SA LD R U label C ensus label C ensus
SA LD R U
1996
SA LD R U
1996 - P rov
SA LD R U
1996 - A ge
Agriculture / fishing
Agriculture,
hunting, forestry
and fishing 814,350 933,343 908,244 1,067,201
M ining
M ining and
quarrying 541,546 567,674 559,599 660,257
M anufacturing M anufacturing 1,119,973 1,275,679 1,328,619 1,434,340
Electricity & water
Electricity, gas
and water supply 109,334 147,494 163,509 166,542
Construction Construction 555,129 428,644 459,705 481,582
Total 9,113,845 9,601,953 9,809,884 10,556,975 Table 3-8: Individual monthly income amongst the employed, aged 15 - 65 years68
Looking at employment figures in Table 3-7 and at the income data recorded in Table 3-8 it becomes clear that there are difficulties in comparing the two data sets, as the labelling has been different. However, it appears that the broad picture has not changed.
68 Individual income here consists of gross-pay and income from the casual job. The bonus, profit share, and income
from rent, pension, interest earnings are not included.
The data base 67
It is noteworthy that the SALDRU-age weight indicates more people in the working age group, as discussed already with the population figures. This tendency becomes obvious in the employment figures with between 700,000 to 900,000 more employed in the SALDRU-age weight than in the SALDRU weights. It is interesting that the SALDRU weights in fact are a more accurate reflection of the Census employment figures.
At first sight it is striking that in the group of “Missing / not adequately defined + other / unspecified” the SALDRU data recorded between 1,000,000 to 1,200,000 ‘employed’ people. Looking at the in-come figures in Table 3-8 it becomes clear that for these people no income has been recorded. One has to conclude that the definitions are different and not comparable. Therefore those people in question in the SALDRU data, one could argue, should not be regarded as ‘employed’. If one deducts those peo-ple, one comes to a relatively close match with the Census results.
3.7.) Conclusion The chapter analysed the current data sets available in South Africa, namely the SALDRU data, the October Household surveys and the 1996 Census, highlighting their advantages and disadvantages. It was then decided that the SALDRU data set was due to its independent count and reliable capturing of the household structure, the most suitable set for this research. However, the SALDRU data had to be reweighted according to more recent population estimates and to be uprated to 1996 standard. By re-weighting and uprating the set with different weights, it became apparent that the SALDRU-prov. weight, which weights SALDRU with the population figures of the 1996 Census according to race and provinces69, is the most balanced weight because of the following observations: The weight represents a more accurate reflection of the employment and income figures of the 1996 Census. Moreover, the strength of the SALDRU data lies in its reliable information on the household structure. Therefore, one wishes for a weight which builds on this strength. SALDRU-prov. in contrast to the adjustment according to age, leaves the household structure untouched. Looking at the population estimate, the advantage of SALDRU-prov. weight lies in the fact that while the adjustment by and large follows the Census estimate, it balances out some of the points of criticism of the Census. In particular, SALDRU-prov. evens out the missing children in the 0-4 age group and the overcount in the age groups above 60. The applied weight, however, entails also the apparent deficiency of an undercount of men in the 25 to 60 age groups. The research is aware of this problem and hence the important cost calculations will also be done with SALDRU-age to determine the degree of confidence of the results.
69 See ‘3.3.) Reweighting the SALDRU data’
Building a microsimulation model to evaluate poverty and social assistance in South Africa 68
Chapter 4: Building a microsimulation model to evaluate poverty and social as-sistance in South Africa A microsimulation model is best suited to evaluate the effects of social assistance programmes on poverty.70 As discussed earlier, Haarmann (1999b) developed the microsimulation method in the South African context to calculate the costs and administrative requirements for welfare policy. He simulated the introduction of the child support grant onto the SALDRU data. This research goes be-yond that by simulating all current and potential other options for social assistance programmes on the SALDRU data. The research takes advantage of this method to analyse the various effects of different programmes on poverty and other factors.
This section now is going to describe how the microsimulation model was built to:
• evaluate the current poverty situation and the effect of the current social assistance programmes on this,
• evaluate possible other social assistance programmes and their potential impact on poverty.
4.1.) The structure of the model The microsimulation model used for this thesis is built with the help of two different programmes. The interface is constructed in a spreadsheet programme which allows for a good overview of the variables chosen. However, at the heart of the model are 6 different programmes, written in SPSS, which
1. Assemble the SALDRU data
2. Create poverty indices
3. Model the influence of HIV/AIDS
4. Calculate aggregated household figures and analyse household types
5. Model current and potential social assistance schemes
6. Analyse the results
The results are then re-integrated into Excel and graphically drawn up.
4.2.) Assembling the SALDRU data The objective of this programme is to put the SALDRU data in such an order that it is suited for the use in all the later programmes. This programme therefore puts the variables needed from the various SALDRU files together into one file, in order to have all the necessary information on the households
70 See also Andreassen, Fredriksen and Ljones, 1993:329-360; Baekgaard, 1996:122-148; Beebout, 1986:83-97; Brajnik
and Lines, 1998; Cox and Paul, 1994; Citro 1991; De Lathouwer, 1996:69:92; Eklind, Bengt, Eriksson, Hussénius and Müller, 1993:313-328; Falkingham and Harding, 1993:233-266; Galler, 1993:293-312; Math 1998; Merz 1993; Nelissen, 1993:225-271&267-292; Ocrutt, Merz, Quinke, 1986; Salomaki, 1993:93-110
Building a microsimulation model to evaluate poverty and social assistance in South Africa 69
readily accessible. Besides this, the following calculations and alterations on the original SALDRU data were made:
While working on the household structure it became apparent that 10 people have an obvious mistake in the recording of their household structure (e.g. naming two people as father or mother, with the one indicating the opposite sex in his/her data row). These ten cases have been recoded to fit with the sexes of the people referred to.
As mentioned earlier, concerning the income data on formal employment there are 503 cases where the recorded net income is higher than the gross income. Out of these, only 8 cases have a positive gross income recorded. To rectify this data entry error, the gross income has been set equal to the re-corded net income for these cases.
The programme recalculates the total monthly household income for two reasons. First, the SALDRU calculations are at times faulty, e.g. the household net income being higher than the gross income. Secondly, the effects of HIV/AIDS modelled in a later programme change the household income.71
Household level:
• For the income data on the household level the variables by SALDRU are used as provided in the data set. This includes ‘Imputed Property Stream Value’, ‘Crop Rental Income’, ‘Grazing Rental Income’, ‘Rental Income’, ‘Value of Agricultural Income’, and ‘Value of Agricultural Subsidies’. Note, however, that the household income data file contained two duplicated households, which are deleted before matching it with the base file.
Individual level:
• Variables on an individual level are: ‘Total Monthly received’ ‘Total Monthly in kind’ ‘Household Net Wage’ ‘Household Casual 1 Wage’ ‘Household Casual 1 Food Sub-sidy’ ‘Household Casual 1 subsidy’ ‘Household Casual 2 Wage’ ‘Household Casual 2 Food Subsidy’ ‘Household Casual 2 subsidy’ ‘Household other income’ ‘Household profit value’
• The monthly ‘net income’, ‘gross income’, ‘household travel subsidy’, ‘household housing subsidy’, and ‘household food subsidy’ were recalculated depending on the period of payments indicated. In cases of a weekly payment the income is multiplied by 4.3, in case of fortnight payments they are multiplied by 2.7. The SALDRU pro-gramme only multiplies the fortnight payments by half the actual amount of weekly payments– namely 2.15. However, this is not entirely correct as one arrives at 4.3 by dividing 365.25 days by 12 months by 7 days and at 2.7 by dividing 365.25 days by 12 months by 14 days.
• The monthly bonus and profit-share are simply calculated by dividing the annual fig-ure by 12 months.
• For the income received as remittances also the annual figure is taken and divided by 12 months (like in CLCINC16.DO). This is seen as the superior method than just us-ing the variable ‘what has been sent last month’.
To be able to determine how men are supporting the mothers of their children, the re-mittances are kept as an individual income. The amount received is counted to the first true expression of relationship in the household in the sequence of: 1.)
71 This thesis by and large followed the calculations done for the total monthly income given by SALDRU. For details
see the following STATA programmes provided with the SALDRU data set: CLCINC04.DO (Calculates revenue from rent), CLCINC16.DO (Calculates revenue from remittances), CLCINC21.DO (Calculates revenue from regular wage), CLCINC22.DO (Calculates revenue from casual job 1), CLCINC23.DO (Calculates revenue from casual job 2), CLCINC25.DO (Calculates revenue from agriculture), CLCINC31.DO (Calculates revenue from self employ-ment), CLCINC32.DO (Calculates revenue from non employment), CLCINCTL.DO (Calculates total monthly in-come by summing up all the components from other files).
Building a microsimulation model to evaluate poverty and social assistance in South Africa 70
wife/husband/partner; 2.) father/mother; 3.) son/daughter - brother/sister; 4.) other family; and 5.) not related.72
Following this approach there are 13 cases where no information is recorded on which related person is receiving the money. In those cases the money is regarded as being paid to the household head.
• Income from self-employment is also calculated on an individual basis. The data set identifies up to 3 persons from a household to be involved in the self-employment business. In order to be able to later see the effects of HIV/AIDS on the household in-come, the income is divided equally over the persons involved.
• While the SALDRU calculations put together different income sources e.g. income from interest earnings together with income from the state old age pensions into the variable ‘other income sources’, this research requires more differentiation. The vari-able ‘other income sources’ is therefore divided into three sub-variables:
i) state old age pension, disability grant, maintenance grant, UIF, government food, workmen’s compensation, government poor relief, NGO food support, NGO transfers, sick benefit
ii) private pension/private provident fund, government civil servant pension
Besides this, one known problem with the SALDRU data is that the pension amounts recorded have to be cleaned. This is done in the following way: Benefici-aries who are too young and beneficiaries who received unacceptably high values (namely where pensions exceed R395 or in the case of Africans, the bi-monthly pension exceeds R790) are excluded. In the case of “african” pensions often the bi-monthly amount, due to bi-monthly payment, was recorded. This error is cor-rected by dividing the bi-monthly payment by two. In the cases where no pension is recorded this is replaced by the median of pension amount by race and province. People receiving between R0 to R89 are excluded.73
Finally, the weights are reweighted and the monetary values are uprated.74
4.3.) Create poverty indices The objective of this programme is to calculate unemployment and poverty indicators for the evalua-tion of the poverty situation in South Africa.
4.3.1.) Defining employment and unemployment rates In defining employment and unemployment this thesis follows by and large the approach of Klasen and Woolard (1999) in their paper: "Levels, trends and consistency of employment and unemployment figures in SA."
Stats SA introduced a new official definition for the unemployment rate in 1998 to be in line with the ILO definition. Table 4-1 compares this new official definition with how Klasen & Woolard define
72 This seems also to be the most accurate reflection of the realities to be expected with HIV/AIDS later on in the pro-
grammes. It seems likely that e.g. a man who sends maintenance to the mother of his child would stop the payment of remittances to this person once the mother has died of AIDS. However, one cannot state that with certainty, as there may be instances where the man might even increase his payments to his child. This may happen if he is financially able to and if he is not directly or indirectly affected by the epidemic.
73 The adjustments made to the SOAP follow the work of le Roux STATA programme 9 June, 1994 & 23 January 1995. 74 See for details ‘3.3.) Reweighting the SALDRU data’ and ‘3.5.) Uprating the SALDRU data’
Building a microsimulation model to evaluate poverty and social assistance in South Africa 71
unemployment in the case of the SALDRU data. Where not indicated otherwise this thesis follows the latter approach.7576
Stats SA calculated on OHS Klasen & Woolard calculated on SALDRU
Strict defi-nition
The unemployed are defined as those people within the economically active population who:
a) did not work during the seven days prior to the interview
b) want to work and are available to start work within a week of the in-terview, and
c) have taken active steps to look for work or to start some form of self-employment in the four weeks prior to the interview. (Orkin, 1998)
In order for persons to be classified as unemployed (…), they needed to be
a) aged 16-64
b) describe themselves as unemployed
c) and have actively sought work in the preceding fortnight77
To make the definition compatible with
OHS, those people who were employed
but worked less than five hours and
wanted more work, were also included
among the unemployed. Conversely,
people who reported to be unemployed
or out of the labour force but later on
reported economic activities (mostly
non-agricultural self-employment) were
counted among the employed if the peo-
ple undertaking these activities worked
at least 20 hours a month in them.
(Klasen & Woolard, 1998:8-9)
Expanded definition
a.) did not work during the seven days prior to the interview
b.) want to work and are available to start work within a week of the in-terview. (Orkin, 1998)
The second, more expanded definition of unemployment adds to the above group those persons that did not look for work for the reason that they believed no jobs to be available. This definition can thus be regarded as including “discouraged” work seekers. (Klasen & Woolard, 1998:9)
Table 4-1: Strict and expanded unemployment definition
It is noteworthy that: Despite having standardised the definitions, it should be noted that the SALDRU strict definition of un-employment remains stricter since it asked what activities were undertaken in the past 14 days to find work, while the OHS only asked for the past 4 weeks. (Klasen & Woolard, 1998:11)
75 The economically active population consists of both those who are employed and those who are unemployed. Its size
therefore varies according to the definition of unemployment used. The official unemployment rate is calculated as a percentage of the economically active population which is unemployed (…). (Orkin, 1998)
76 There is one case in the data set where the variable ‘look for work’ is set to 42, which is not a valid entry. However, the person then spent time looking for work, so the variable is changed into ‘looking for work’.
77 This is a mistake SALDRU only asked the question: “Did ___ look for work or for a job in the last week?” (SALDRU, 1994:128)
Building a microsimulation model to evaluate poverty and social assistance in South Africa 72
4.3.2.) Defining consumption quintiles and deciles based on adult equivalents The World Bank in their document ‘Key indicators of poverty in South Africa’ use adult equivalents (World Bank, 1995:5). However, they do not spell out what method they used to adjust the figures for age and gender.
A critique of adjusting the consumption figures for age was done by Dirk Haarmann arguing that the weight attached is arbitrary and thereby not transparent. Especially in the case of pensioners this weight is the reason for pensioners to be considered better off than other people in the USA. In the case of children it is shown not to have a drastic effect. In the absence of a consensus position in South Africa he calculates adult equivalents only adjusting them for economies of scale. The number of per-sons who stay in the household is raised by the power of 0.9 (Haarmann, D; 1999a:20; 31-32).
Ravallion (1992: 17-21) also points out several problems attached to using equivalence scales. He argues that
(…) child costs can also be financed by drawing on savings rather than consumption, so that the effect on consumption may occur at a later date than the survey.
Furthermore, the intra household distribution which could be very unequal based on the power rela-tions within the household cannot be taken into account as that would require information on individ-ual consumption within the household.78
The Poverty and Inequality Report (PIR), another recent study on poverty in South Africa, abandoned the idea of adjusting the consumption of pensioners but retained some adjustment for younger chil-dren:
In this study, all children younger than 15 years of age have been converted into 'half adults' (Poverty and Inequality Report, 1998 Appendix page 9).
Further economies of scale are included. The final formula is:
Total Household Expenditure / (Adults + 0.5 * Children)**0.9
As the thesis is concerned with allowing for a comparison within the South African context, the PIR approach has been adopted.79
4.3.3.) Deprivation index A great deal can be learnt about living standards from a sufficiently comprehensive measure of consump-tion. But there will be relevant aspects of well-being (from both welfarist and non welfarist perspectives) which are not reflected in that measure. This points to the need to supplement poverty measures based on distribution of household consumption with other indicators which (though possibly quite crude on their own) do have a better chance of picking up the omitted variables. (Ravallion, 1994:9-10)
Therefore the thesis also uses a deprivation index based on the notion of capability. In the later it will be used to check the robustness of the definition of poverty through consumption and income to see who is missed when the different methods are applied.
If not indicated otherwise, this approach follows the methodology of Dirk Haarmann (Haarmann, 1999a), which again is based on the work done by Stefan Klasen (Klasen, 1996). Dirk Haarmann used the following indices:
78 See also Sautter & Serries, 1993:59-60 79 Note that in 291 cases in the SALDRU date there is no valid age recorded. The people concerned are regarded as
adults except if the mother or the father are younger than 32 years of age, which is the case four times.
Building a microsimulation model to evaluate poverty and social assistance in South Africa 73
Score (1 = most deprived up to 5 = well off;
1 and 2 are regarded as below the poverty line)
Indicator 1 2 3 4 5
Expenditure standardised monthly HH ex-penditure (HH with 1 member)
average years of education among HH members 16+ years80
<2 3-5 6-9 10-11 12+
Table 4-2: Classification of the different indicators into ranking groups (Source: Haarmann, D; 1999a:27)
The calculations take account of economics of scale and, unlike Dirk Haarmann’s calculations, also of age81 by standardising the household to a single person household. Dirk Haarmann set the household expenditure's poverty line at the subsistence level for the lower-middle income group in Cape Town (UPE, 1997). While the score 1 is allocated to all who fall below the lowest minimum subsistence level of the low income group in the UPE data [see Uitenhagen in UPE, 1997], the score 2 indicates standardised expenditure below the lowest subsistence level of the middle income group [see Cape Town in UPE, 1997]. Following the UPE data, which, in its 1997 publication, also gives the increases from 6 months prior to the sample, meaning September 96, the figures of Uitenhage (being slightly lower than Cape Town and therefore the lowest middle income subsistence level provided by UPE) is
80 In order to compare the indicators to Klasen, note that here 16+ and not 18 is chosen. 81 For a detailed explanation see ‘4.3.2.) Defining consumption quintiles and deciles based on adult equivalents’
Building a microsimulation model to evaluate poverty and social assistance in South Africa 74
taken. (Potgieter, 1997:68) Therefore this thesis arrives at the following expenditure intervals for 1996:
Expenditure standardised monthly HH ex-penditure (HH with 1 member)
- R215 R215 - R305
R305 – R610
R610 - R1220
R1220 -
A further difference to Dirk Haarmann’s approach is the way in which unemployment is defined. To be consistent with one definition of ‘being employed’ in this thesis the definition explained earlier is used.82
Following Dirk Haarmann’s approach, the final score for each household is determined by first calcu-lating the average score for each indicator group: Expenditure, housing, health, and employment op-portunities. Then the final average score is calculated. This methodology ensures that each indicator group is not weighted by the number of indicators applied for each group but rather carries the same weight as the three other groups.
Dirk Haarmann’s approach puts its emphasis on defining a poverty line. However, it can be criticised for a somewhat arbitrary definition of the intervals. His index is ranked by:
ra. 1 ra. 2 ra. 3 ra. 4 ra. 5
Average Score 1.00 - 2.25
2.25 - 3.00
3.00 - 3.75
3.75 - 4.00
4.50 - 5.00
Range 1.25 0.75
poverty line
0.75 0.75 0.5 Table 4-3: Ranking groups in relation to the poverty line (Source: Haarmann, D; 1999a:31)
In order to keep the poverty line at below 3, meaning the standard, which is not considered to be fit for a healthy life, and to avoid this problem this thesis creates 10 ranking groups:
Table 4-4: Ranking groups in relation to the poverty line
4.4.) The inclusion of HIV infections and AIDS in the model The latest UNAIDS country report on South Africa (UNAIDS, 1999) estimates that there are ap-proximately 1600 new HIV infections in South Africa every day, accounting for ten percent of new HIV infections world wide. Due to this alarming figure and the devastating consequences in years to come, it seems imperative to try and include the effects in the model.
The goals of building the effect of HIV/AIDS into the microsimulation model are several:
• Analysis of the effect on total population figures (AIDS deaths)
• Analysis of the effect on the household structure (HIV infections in a family, AIDS sick cases, AIDS deaths). What are the impacts in terms of caring for the children, grandparents if the middle generation dies, especially with regard to social security payments.
• Analysis of the effect on income structure (Reduction of earning due to being AIDS sick and out of work)
82 See ‘4.3.1.) Defining employment and unemployment rates’
Building a microsimulation model to evaluate poverty and social assistance in South Africa 75
To incorporate this information into the model, estimates of the number of new HIV infections, AIDS sick persons and AIDS deaths over the next years are needed. ASSA has produced a national AIDS and demographic model which models the AIDS epidemic and its impact on population figures, on fertility and mortality rates over the next years. The ASSA model based its assumptions like fertility and mortality rates of HIV positive and negative persons, migration, new HIV infections, etc. on vari-ous national and international studies and checked them against empirical evidence (Dorrington, 1998). The model is widely accepted in South Africa (e.g. Department of Finance, 2000) and therefore it was chosen to provide the necessary information for the microsimulation model.
Dorrington (1998) describes the precise assumptions and methods of the ASSA model. Here it suffices to outline the information and estimates incorporated in the microsimulation model and the resulting potentials and limitations of the analysis.
The ASSA model divides the population into different risks groups: PRO: Individuals whose level of sexual activity is such that their HIV prevalence is similar to that of sex workers and their clients.
STD: Individuals whose level of sexual activity is such that their HIV prevalence is similar to that of peo-ple being treated for Sexually transmitted diseases at STD clinics.
RSK: Individuals with a lower level of sexual activity but who are still at risk from HIV.
NOT: Individuals who are not at risk of HIV infection. (Dorrington, 1998:Appendix 2)
The population is then divided into these different groups according to gender and age groups. The model assumes that the age group from 0-13 years is only at risk of HIV infection at birth (i.e. through the HIV positive status of the mother) and that sexual activity and hence risk of infection starts with the 14th birthday. People over the age of 60 are not at risk of further infection. The median term to death of an HIV positive infant is assumed to be 2 years and the median term to death of an HIV posi-tive adult is assumed to be 10 years. People are assumed to be AIDS sick for two years. On this basis, the ASSA model calculates the number of new HIV infections, of AIDS sick persons and the number of AIDS deaths for any year chosen from 1985 onwards. Besides these concrete numbers, one can further extract a variety of information from the ASSA model like the mortality rate, the fertility rate, the change in population estimates etc.
To build in the effect of HIV/AIDS into the microsimulation model one can use the SPSS random generator. The generator allocates values (in this case HIV status, AIDS sick status and AIDS deaths) to a randomly selected number of cases. The number of cases is determined by percentage points.
However, several questions arise when integrating the information produced by the ASSA model into the SALDRU survey, as a household survey contains different and more information than the ASSA model which potentially has an impact on HIV/AIDS:
• The own population estimate of the SALDRU survey
• The relationship between the people
• The poverty situation of the people
The following methods are applied to integrate the information from the ASSA model into the house-hold survey:
In terms of the population estimate, the microsimulation model uses Sadie's population growth rates for the years from 1996 to the chosen projection date. It then takes the percentage of the number of people who are HIV positive, AIDS sick or AIDS deaths according to age and gender from the ASSA model and allocates the values with the SPSS random generator. One hence arrives at a final popula-tion estimate by deducting the AIDS death cases from the total population.
The ASSA model does not take account of household or family structures meaning for example that an HIV positive child is not 'allocated' to its HIV positive mother. But children who die of AIDS or are HIV positive normally have parents or at the least a mother who is HIV positive. Also other correla-tions are not included in the ASSA model: For example, are certain kinds of household structures more at risk to be affected by AIDS than others? Are people with a spouse less or more likely to con-tract AIDS? Given the fact that there is no empirical data on the exact probability of certain kinds of
Building a microsimulation model to evaluate poverty and social assistance in South Africa 76
correlation, it is not possible to model them entirely correctly. However, the seriousness of the epi-demic makes it imperative to include it in the microsimulation model and to try and base it on the most reasonable assumptions while being aware that there are limitations.
Certain types of correlation are obvious, like the mother to child infection. When it comes to other correlations like the probability of infecting your partner, it is only possible to model a 'best guess' in terms of the probability as it also seems to be wrong to make no assumptions at all. The final analysis can then show how certain household structures are affected by HIV/AIDS, e.g. an increase in ‘only children’ households, households where the breadwinner dies etc. Furthermore, one can look into what this means in terms of poverty (income reduction and change in caring responsibilities) for certain household structures (e.g. a household where the middle generation died of AIDS) and in which sce-narios social assistance can be effective or not. The limitation is, however, that the total number of certain household structures cannot be predicted with certainty.
The same problem arises with the poverty data as the HIV/AIDS status is likely to be affected by pov-erty. Alone from a technical point of view, if one wants to incorporate the correlation between the poverty situation and HIV/AIDS into the model, one would have to create 2700 variables for the prob-ability according to age (0-90 years) gender and different quintiles. Secondly, there are no quantitative indications of the impact of poverty and the risk of infection in the ASSA model as it does not look at population groups or income groups. The international literature also does not have conclusive esti-mates. Therefore, and in contrast to the more logical correlation existing within a household, any as-sumption in this case would be a wild guess as also other factors like education, rural/urban area etc. play into it. If such probabilities were integrated, the results would become unnecessarily unreliable. Instead, it seems more reasonable to acknowledge this limitation in the discussion and by dividing the results into poverty groupings, this model should be able to reveal tendencies in the development of the household structure and therefore the implications for social assistance when taking account of HIV/AIDS.
The assumptions with regard to the household and family structure are as follows:
The number of women being HIV positive or dead is nearly twice as high as the number of infected men. This is so due to the fact that the infection risk for women is higher. Therefore it was decided to proceed as follows: First, the men are randomly selected and then it is assumed that HIV positive men living with a spouse also infect their spouse (HIV infection, not death). However, as there are more female than male HIV positive cases, in addition to the female HIV positive with a partner, an addi-tionally randomly chosen percentage of females are made HIV positive as well. Only in the age group from 50 to 70 years are there less female infections than male infections. Here the number of access people is deducted again in the age groupings. So besides those men and women living without a spouse and being HIV positive, there will be couples where only the mother is a carrier of the virus, but if the man is infected and has a spouse the woman is also infected. In the case of children below the age of 14, they are only infected from birth through the positive HIV status of their mother.
The variables calculating the number of people in the household have also to be recalculated after the AIDS model has been applied. However, it is useful for comparative reasons to keep the old numbers and recalculate new variables to be able to make a comparison in the analysis of the difference be-tween the developments of household structures with and without the effect of AIDS. The same prin-ciple is applied with regard to the income variables which have to be changed as well, but this will be explained later.83
4.5.) Calculate aggregated household figures and analyse household types This section describes the method and variables created to analyse different household types as well as the income information from either the parents or the spouse which is needed for the means-test, and the household income for the poverty measures. 83 See ‘4.5.) Calculate aggregated household figures and analyse household types’
Building a microsimulation model to evaluate poverty and social assistance in South Africa 77
The analysis of the household structure is of special interest for this research, as poverty occurs on the household level. Therefore this research builds a systematic typology of the various household compo-sitions. This typology is based on different age groups present in the household as its main category rather than kinship. While kinship is interesting from a family sociological point of view, to the pov-erty analysis the age distribution is more of interest, especially as this is how social assistance is cur-rently targeted in South Africa (e.g. old age pensions).84 The population is therefore divided into three main groupings:
• Children 0-17 years.
• Working age adults from 18 to 59 years for females and 64 years for males.
• Adults in pension age: 60 years and above (female) and 65 years and above (male).
Following this division, 7 household types are allocated.
1.)
children
+ +
2.)
children
+ working age adults
+
3.)
children
+ + adults in
pension age
4.)
children
+ working age adults
+ adults in
pension age
5.)
+ working age adults
+
6.)
+ working age adults
+ adults in
pension age
7.)
+ + adults in
pension age Table 4-5: Seven household types
For the detailed analysis the children are then again divided into groupings:
• 0-4 years
• 5-13 years
• 14-17 years
The rationale behind the division into the above mentioned age-cohorts is that children from 0-4 years are most in need of sufficient nutritional food and from 14 years onwards the AIDS model assumes sexual activity and hence risk of transmission of HIV. The further division (18-59/60 and above 60/65) follows the one chosen for the analysis for the social security benefits, as it divides the popula-tion into working age adults and pensioners.
Each individual is allocated the following information about the people he/she is living with in the household or he/she is related to:
• Presence of the parents (indicating whether both parents are present or only the father or only the mother or none of them)
The variables on the immediate family (parents and children) give information on de jure and de facto presence (present for more than 6 months).85 All the variables are also calculated with the effect of
84 For a more detailed discussion on the difference between family and household structure, see ‘5.2.1.) 85 See page 101 for the SALDRU definition of a household.
Building a microsimulation model to evaluate poverty and social assistance in South Africa 78
HIV/AIDS and each gives information on the HIV, AIDS sick and AIDS death status of the person in question. For example, the analysis is able to calculate the number of children living only with the mother and, when looking at the effect of HIV/AIDS, to compare how many of them are living with an HIV positive or AIDS sick mother or how many lost their mother because of AIDS.
In addition to the information on the individual and his/her family relationship, the following informa-tion on the type of the household the individual is living in has been calculated:
• Whether it is a female headed household (this is only done without taking account of the effect of AIDS; as when the household head dies, no comment is possible as to who takes over as household head)
• Whether the household head died of AIDS.
There are different income variables calculated for each individual which are then used for the means-test or the determination of the poverty gap. In the spreadsheet interface built in Excel one can choose which one of the different income sources should be included in the calculation (e.g. income from casual job when calculating the 'cut-off' point for the means-test). The variables indicate the following income:
• The individual income
• The household income
• The income of the mother
• The income of the father
• The income of the spouse
Looking at the impact of HIV/AIDS there are income sources both on an individual and on household level which are affected by a person being either AIDS sick or by her/his death: like net wage, bonus, travel subsidy etc. It was decided that if somebody is HIV positive these income sources remain the same as one can assume that an HIV positive person can still work in his/her job. However, as soon as the person becomes AIDS sick, these income sources are set to zero. In terms of the household, the income source which is most likely to be affected by an adult in the household who falls sick, is the value of agricultural income as the household loses somebody who has potentially worked in the fields. Here the income from this source is divided over the adults living in the household and if an adult falls sick his/her portion is deducted from the total.
On the other hand, some individual or household income sources, mainly rental income sources and social benefits, are not affected by the person being AIDS sick and they remain the same.86
4.6.) Model current and potential social assistance schemes The objective of this programme is to calculate the chosen social assistance programmes and to set out the data for a poverty analysis.
First the entered programmes and preferences are taken from Excel and sorted to the persons in SPSS according to quintiles. This is what the default interface in Excel looks like each entry making up for one variable sorted by quintile:
86 For detail see page 83
Building a microsimulation model to evaluate poverty and social assistance in South Africa 79
Scenario: 1Save further variables to run SPSS:
HIV / AIDS ModuleSelect HIV / AIDS module: 0 (1=selected; 0=turned off)
Select a year: 1996 (between 1996 - 2011)
Calculate selected year:
ReweightingPopulation growth
"african" 0 % (always from 1996)"coloured" 0 %
"indian" 0 %"white" 0 %
UpratingInflation
Increase all monetary values by: 0 % (always from 1996)
Poverty linePoverty datum line - single pers. HH: R 304.97 (calculated per adult equivalent vs.. totalm_in - UPE - 304.97)
Social Assistance Progr.Deduct old social security payments before Oct 93: 1 (1=selected; 0=turned off)
Min. age - male: 65 y. (e.g.65 means equal or older than 65 years)Min. age - female: 60 y.
Min. monthly benefit: R 90Max. monthly benefit: R 430
Minium per month for means-test: R 258Maxium per month for means-test: R 1,118
Include partners income: 3 (1= only own income 2 = combined income 3 = half the combined income)
For income test use: 0 p_gross_pay (NOTE: choose either gross- or netto- income)1 p_net_pay1 bonus per month1 profit share per month0 transport subsidy0 food subsidy1 house subsidy1 casual employment1 informal sector employment1 cash sent1 private pensions1 interest earnings
Percentage of eligibile people successfully reached: 100 % Bottom Quintile100 % 2. Qu.100 % 3. Qu.100 % 4. Qu.100 % Top Quintile
Now!
Now!
Figure 4-1: Excel default interface page 1
Building a microsimulation model to evaluate poverty and social assistance in South Africa 80
Min age: 0 y. (e.g.0 - always inclusive.)Max. age: 6 y. (e.g. 6 - means children up to their 7th brithday)
Max. monthly benefit: R 100Type of means-test selected: 1 (1 = income,
2 = quintiles3 = poverty datum line)
If 1.) Cut off point - rural - inf.: R 1,100Cut off point - urban: R 800
Tested income: 2 (1= only primary care-giver's income (default --> mother) 2 = combined parent income 3 = half the combined parent income)
For income test use: 1 p_gross_pay (NOTE: choose either gross- or netto- income)0 p_net_pay1 bonus per month1 profit share per month0 transport subsidy0 food subsidy1 house subsidy1 casual employment1 informal sector employment1 cash sent1 private pensions1 interest earnings
If 2.) Quintile included: 5 (e.g. 2 means including the 2nd quintile)If 3.) Consumption per adulteq.: R 410 (NOTE: not a valid entry if AIDS model is chosen)
Percentage of eligibile people successfully reached: 100 % Bottom Quintile100 % 2. Qu.100 % 3. Qu.100 % 4. Qu.100 % Top Quintile
DG / Care Dependency GrantProgramme selected: 1 (1=selected; 0=turned off)
Min. age: 0 y. (e.g. 18 means equal or older than 18 years)Min. monthly benefit: 90Max. monthly benefit: R 430
Minium per month for means-test: R 258Maxium per month for means-test: R 1,118
Include partners income: 3 (1= only own income / primary care-giver's income 2 = combined income / parent income 3 = half the combined income / parent income)
For income test use: 0 p_gross_pay (NOTE: choose either gross- or netto- income)1 p_net_pay1 bonus per month1 profit share per month0 transport subsidy0 food subsidy1 house subsidy1 casual employment1 informal sector employment1 cash sent1 private pensions1 interest earnings
Included disabilities: 0 (tuberculosis,0 asthma,0 rheumatic heart disease,0 high blood pesure,0 hepatitis b,0 k idney problems,0 strok e,0 cirrhosis of the liver,0 injury,0 violence-related injury,0 cancer,0 diabetes,0 hiv-infection,0 AIDS sick ,
Figure 4-2: Excel default interface page 2
Building a microsimulation model to evaluate poverty and social assistance in South Africa 81
Min. age: 0 y. (e.g.0 - always inclusive.)Max. age: 109 y. (109 effectively means inclued all)
Max. monthly benefit: R 100Type of means-test selected: 1 (1 = income,
2 = quintiles3 = poverty datum line)
If 1.) Cut off point: R 1,000,000Tested income: 3 (1= only own income / primary care-giver's income
2 = combined income / parent income 3 = half the combined income / parent income)
For income test use: 1 p_gross_pay (NOTE: choose either gross- or netto- income)0 p_net_pay1 bonus per month1 profit share per month0 transport subsidy0 food subsidy1 house subsidy1 casual employment1 informal sector employment1 cash sent1 private pensions1 interest earnings
If 2.) Quintile included: 5 (e.g. 2 means including the 2nd quintile)If 3.) Consumption per adulteq.: R 410 (NOTE: not a valid entry if AIDS model is chosen)
Percentage of eligibile people successfully reached: 100 % Bottom Quintile100 % 2. Qu.100 % 3. Qu.100 % 4. Qu.100 % Top Quintile
Type of means-test selected: 1 (1 = income,2 = quintiles3 = poverty datum line)
If 1.) Cut off point: R 800Tested income: 1 (1= only own income income
2 = combined income 3 = half the combined income)
For income test use: 1 p_gross_pay (NOTE: choose either gross- or netto- income)0 p_net_pay1 bonus per month1 profit share per month0 transport subsidy0 food subsidy1 house subsidy1 casual employment1 informal sector employment0 cash sent1 private pensions1 interest earnings
If 2.) Quintile included: 5 (e.g. 2 means including the 2nd quintile)If 3.) Consumption per adulteq.: R 410 (NOTE: not a valid entry if AIDS model is chosen)
Percentage of eligibile people successfully reached: 100 % Bottom Quintile100 % 2. Qu.100 % 3. Qu.100 % 4. Qu.100 % Top Quintile
Figure 4-3: Excel default interface page 3
Building a microsimulation model to evaluate poverty and social assistance in South Africa 82
Type of means-test selected: 2 (1 = income,2 = quintiles3 = poverty datum line)
If 1.) Cut off point: R 800Tested income: 1 (1= combined household income
2 = combined household income per personIf 2.) Quintile included: 5 (e.g. 2 means including the 2nd quintile)If 3.) Consumption per adulteq.: R 410 (NOTE: not a valid entry if AIDS model is chosen)
Percentage of eligibile people successfully reached: 100 % Bottom Quintile100 % 2. Qu.100 % 3. Qu.100 % 4. Qu.100 % Top Quintile
Consumption Tax Note: Can not be run in conjunction with AIDS model!Programme selected: 0 (1=selected; 0=turned off)
Tax on expenditure recorded: 6 %Deduct from benefit: 1 (1=selected; 0=turned off)
Figure 4-4: Excel default interface page 4
Building a microsimulation model to evaluate poverty and social assistance in South Africa 83
Calculating the income for the income means-test, the SPSS programme follows the choices made in the Excel interface. Note that any income from a person who died because of AIDS is considered as zero income as if the person was never part of the household. In case of a person being sick with full-blown AIDS (not HIV) the following income is set to zero:
• gross_pay; net_pay; monthly bonus; profit share; monthly subsidy of transport; monthly subsidy of food; monthly subsidy for house; last month income from casual jobs; income from informal employment;
However, the following income is still considered to be paid out if a person developed AIDS:
• cash sent per month; private pension income; income from interest
The following graphs explain how the various social assistance programmes and their means tests are worked into the programmes.
SOAP
Percentage in Quintile reached
Aids_dead
max benefit
below min. for means-test
Percentage in Quintile reached
Aids_dead
(max grant per annum - ((chosen income * 6) - 30% of max grant per annum)) / 12 )
above min. but below max of means-test
Age
Male Female
Programme selected
Figure 4-5: Programming the SOAP
Building a microsimulation model to evaluate poverty and social assistance in South Africa 84
CSG
Percentage in Quintile reached
Aids_dead
benefit
below min. for means-test
Income Means-test
Percentage in Quintile reached
Aids_dead
benefit
within chosen quintiles
Quintiles as means-test
Percentage in Quintile reached
Aids_dead
benefit
below chosen poverty-line
poverty datum line as means-test
Age
Programme selected
Figure 4-6: Programming the CSG
DG
Percentage in Quintile reached
Aids_dead
max benefit
below min. for means-test
Percentage in Quintile reached
Aids_dead
(max grant per annum - ((chosen income * 6) - 30% of max grant per annum)) / 12 )
above min. but below max of means-test
Age
Type of disability
Programme selected
Figure 4-7: Programming the DG87
87 The term ‘Disability Grant’ in this thesis includes both programmes: The Care-Dependency Grant and the Disability
Grant. There is a legal difference between the two, as the Care-Dependency Grant refers to the payment for disabled children, and the Disability Grant for those in adult age. However, the amount and the means-test are the same. Therefore from a modelling perspective they can be treated as one grant for all ages (from now on simply referred to as ‘Disability Grant’).
Building a microsimulation model to evaluate poverty and social assistance in South Africa 85
BIG
Percentage in Quintile reached
Aids_dead
benefit
below min. for means-test
Income Means-test
Percentage in Quintile reached
Aids_dead
benefit
within chosen quintiles
Quintiles as means-test
Percentage in Quintile reached
Aids_dead
benefit
below chosen poverty-line
poverty datum line as means-test
Age
Programme selected
Figure 4-8: Programming the BIG
Unemployment Benefit
Percentage in Quintile reached
Aids_dead
benefit
below min. for means-test
Income Means-test
Percentage in Quintile reached
Aids_dead
benefit
within chosen quintiles
Quintiles as means-test
Percentage in Quintile reached
Aids_dead
benefit
below chosen poverty-line
poverty datum line as means-test
Unemployment definition(AIDS sick: employed to unemployed)
Age
Programme selected
Figure 4-9: Programming the Unemployment Benefit
Building a microsimulation model to evaluate poverty and social assistance in South Africa 86
HH Grant
Percentage in Quintile reached
Aids_dead
benefit
below min. for means-test
Income Means-test
Percentage in Quintile reached
Aids_dead
benefit
within chosen quintiles
Quintiles as means-test
Percentage in Quintile reached
Aids_dead
benefit
below chosen poverty-line
poverty datum line as means-test
Programme selected
Figure 4-10: Programming the HG Grant
4.7.) Analysing the results The final worksheet in SPSS is saved under dbase format. Through macros written in Excel, the pro-gramme loads this table from dbase format into Excel and various scenarios are saved as Excel tables. This ensures quicker access later.
Figure 4-11 on the next page shows the final interface where the various scenarios can be chosen. The choice triggers a macro which creates the final data sheet.
In the final step the following programmes created in Excel are linked to this final data sheet:
• Basic poverty analysis
• Household structure and poverty
• Social assistance and poverty
• Social assistance and the economy
• HIV/AIDS
• Social assistance and HIV/AIDS
With the help of pivot tables these programmes bring the results into cross-table format. Various cross-tables are again linked to one summary table and further tables used for graphs.
Building a microsimulation model to evaluate poverty and social assistance in South Africa 87
Figure 4-11: Interface to choose the scenarios calculated
Poverty, household structure and the current social assistance programmes 88
Chapter 5: Poverty, household structure and the current social assistance programmes This chapter starts with a poverty analysis to show the current problems of massive structural poverty in South Africa. Of importance here is the illustration of the various facets of poverty. While this sec-tion is based on a broad range of indicators, in the later chapters of this thesis poverty has to be repre-sented by monetary measurements. This is where one can directly simulate the effect of a policy change in the social assistance programmes which are based on cash grants. For this reason this first part gives a graphic picture of what these monetary figures stand for, and it serves as well to determine the degree of confidence in this measure of poverty.
The chapter further examines the structure of South African households with a special focus on the link between the structure and poverty indicators. This is of special interest with regard to the effect of targeted social assistance programmes e.g. in how far the SOAPs will also reach children in poverty. To conclude the poverty analysis the possible effects of HIV/AIDS on poverty and household structure will be looked at. The poverty analysis is based on the SALDRU data as it was collected and updated to 1996 standard as described in the Chapter 3.
Thirdly the chapter illuminates the potential impact of the current social assistance programmes on poverty. Here the microsimulation model is run with the assumption that the current policies would work with a 100% capacity. On this basis, the changes of the existing policies on monetary poverty indices are looked at.
5.1.) Poverty in South Africa
5.1.1.) A comparison of consumption and income measures and a deprivation in-dex As outlined earlier88, the discussion on the methodology of poverty analysis and the choice of the best social indicators for poverty is a focus of intense academic debate.89 The points of view are manifold. Just to touch on the important issues for this research:
• Often consumption figures are regarded as more reliable than income figures for the analysis of poverty in household surveys.
• It is debated whether a relative or absolute poverty line should be used,
• and whether this should be determined by a single monetary indicator or by a depriva-tion index built out of a variety of indicators.
In literature, consumption is often preferred over income for poverty analyses. It is argued that income in household survey overestimates the degree of poverty as it misses out on some informal sources of income. Another reason is that income varies over time while consumption tends to be smoothed.
88 See ‘4.3.3.) Deprivation index’ and ‘3.1.1.) SALDRU’ 89 See for example, Ravallion, 1992; Nohlen, 1993; Sautter & Serries, 1993; Carvalho & White, 1994; Klasen, 1996;
Drèze & Sen, 1991; Estes, 1984
Poverty, household structure and the current social assistance programmes 89
Consumption is hence assumed to be a better indicator for current as well as long-term well-being.90 However, with regard to the research problem of this thesis, the analysis of the impact of social assis-tance programmes in the form of cash transfers, a methodological problem arises. The transfers change the income data of the households. The microsimulation model in its analysis of the changing poverty situation then necessarily has to work with these changes in the income data. One can neither analyse the changes which occur through the changes in consumption, as it is not clear how the money of transfers is individually spent nor can one simulate the change of various indicators like access to wa-ter, housing etc. used in a deprivation index. Allowing for some alterations the same can be said with regard to changes through HIV/AIDS to the household structure. The impact which occurs because members of the household are dying or being too sick for work can be modelled on income, but not on consumption figures nor on a deprivation index.
By nature a relative poverty measure like the one based on consumption quintiles does not allow for a clear distinction of those below an acceptable living standard and those above, as it does not group people according to their needs. The World Bank justifies a relative poverty line based on quintiles by saying:
It turns out that these cut-offs indicate an extent of poverty in the same range as that produced by the minimum food need lines. (World Bank, 1995:8)
Especially when it comes to the HIV/AIDS model with its changing levels of poverty, this measure does not provide a satisfactory answer.
Focussing on social assistance programmes, one would wish for a good and expressive poverty analy-sis with a clear separation of those in need from those not in need of support. The analysis should then not only be based on one indicator, like income/consumption but should be able to describe the differ-ent facets of poverty by looking at a variety of indicators which capture the living conditions of South Africans. This calls for the application of a deprivation index like that developed by Klasen (1996) or Haarmann (1999a). However, there are also problems involved: The research should be easily compa-rable with other studies in the field. While the superiority of deprivation indices in mapping out the facets of poverty is acknowledged by other researchers, the methodology is more difficult and requires quite detailed data which is not always readily available. In addition there can be considerable dis-agreement over which indicators to use and how to arrive at an acceptable minimum standard for the individual indicators. The comparisons and comments on the research are then often in danger of be-ing more concerned with the method of the poverty analysis than with the research results itself. This should be avoided especially if one wishes for the use of the research in the current policy discussion in South Africa.
Being aware of the limitations of each poverty measure this research has come to the following com-promise: Key studies on poverty in South Africa seem to agree in their choice of consumption quin-tiles. Both the ‘Key indicators of poverty’ (World Bank, 1995) as well as the ‘Poverty and Inequality Report’ (May, 1998) based their analysis on consumption quintiles and define the poor as the poorest 40% of the population. For comparative reasons, the poverty analysis in this thesis is based on con-sumption quintiles (from now on simply referred to as quintiles). To still be able to draw a broader picture of poverty and because a poverty analysis based on several indicators is regarded as being su-perior, the indicators of the deprivation index as developed by Haarmann (1999a) have been integrated into the poverty analysis.91 Furthermore, because the analysis of the impact of social assistance pro-grammes has to be based on income, the following section compares the SALDRU income data to the SALDRU consumption data in identifying the poor. The deprivation index as the most complex and independent measure of poverty is used as a scale for the degree of accuracy in this analysis.
90 See Carvalho & White, 1994:22 & Ravallion, 1992:13, see also page 65 91 See ‘5.1.2.) Summary of the poverty situation in South Africa according to quintiles’
Poverty, household structure and the current social assistance programmes 90
5.1.1.1.) Comparing expenditure and income with regard to accuracy in identifying the poor
Figure 5-1: Differences in capturing the poor: The ranking groups versus consumption quintiles
The bars in Figure 5-1 divide the South African population according to the five quintiles. People in the first and second quintiles are regarded as below the poverty line making up 40% of the poorest households in South Africa. Adding up the first two bars, one can see that well over 50% of the popu-lation live in these 40% of the poorest households.92 The different segments within the bars present the different ranking groups based on the deprivation index.93 The striped segments are those which are, according to the index, above the poverty line. The graph visualizes some differences of inclusion and exclusion. People who are regarded by the one method as below the poverty line, are regarded by the other one as above the poverty line and vice versa. Overall, however, the error can be considered as a relatively minor one. If one does not consider those in the fifth and sixth ranking groups (those just below and just above the poverty line) as an error (since here in the individual case the difference in score of being above or below is very small)94, the accuracy rate in identifying the poor and the non-poor amounts to 95%.95
Figure 5-2 provides information about calculating quintiles according to income and comparing those to the ranking groups of the deprivation index:
92 See ‘5.1.2.) Summary of the poverty situation in South Africa according to quintiles’ 93 For the details on the deprivation index see ‘4.3.3.) Deprivation index’ 94 See Figure 5-3 95 See Table 9-1 page 191
Poverty, household structure and the current social assistance programmes 91
0%
2%
4%
6%
8%
10%
12%
14%
16%
18%
20%
22%
24%
26%
28%
1 Income Qu. 2 Income Qu. 3 Income Qu. 4 Income Qu. 5 Income Qu. No income recorded
Figure 5-2: Differences in capturing the poor: Ranking groups versus income quintiles
The problem with income data is that there are always some people who do not declare any income. In the case of the SALDRU data they add up to close to 5%. The analysis shows that when taking ac-count of other social indicators, the people are relatively evenly distributed across the different ranking groups. One can hence not assume that people without a declared income belong to the poorest group. To avoid a distortion of the results these people should be excluded from the calculations where pov-erty is determined through income. Based on the same calculation as for the expenditure quintiles, the accuracy rate of the income quintiles in identifying the poor and the non-poor is 90%.96 If one ex-cludes those who do not indicate an income at all the accuracy rate rises to 91%.
The next graph demonstrates the distribution of people over the 10 ranking groups.
Figure 5-3: Number of people in the ranking groups
96 See Table 9-2 page 191
Poverty, household structure and the current social assistance programmes 92
While, by working with relative measures, quintiles or income quintiles distribute the households mathematically evenly over the groups, the absolute poverty measurement is able to show a qualitative and quantitative differentiation between the groups. This analysis does not interfere with the results discussed above, but the two peaks in the third and in the fifth ranking group are of interest here. They indicate a larger group of people who are very, very poor and then again a larger group just below the poverty line. From a policy point of view, it becomes clear that it might be relatively ‘easy’ to pull the people in the fifth ranking group up over the poverty line. Considering the very poor in contrast, the majority of people is not anywhere near that poverty line (that would be the fourth ranking group), but they are in the third ranking group. More long-term and concerted efforts would hence be needed. This point should be kept in mind for the later discussion on policy options.
The analysis reveals, as pointed out earlier, that it is preferable to work with a variety of indicators. Such an index of indicators is able to show deprivation and capability on different levels and with more depth which one hopes comes nearer to reality than relying on one indicator only. However, if one has to rely on income or consumption, the difference between them at least in the SALDRU data is not huge. The accuracy rate in identifying the poor and the non-poor lies between 90% and 95%. The impact study on the various social assistance programmes working with income will therefore be able to produce reliable results.
5.1.2.) Summary of the poverty situation in South Africa according to quintiles The next section summarises the poverty situation in South Africa on the basis of quintiles and by integrating the various indicators of the deprivation index.
The following 5 figures provide various bits of information on the living conditions of the South Afri-can population according to quintiles. The first two figures, by showing the first two quintiles, map out the characteristics of the population which lives below the poverty line according to this poverty measure. Each of the figures is divided into different boxes which display the following:
1. The percentage of the population living in the quintile.
2. The total number of people and a division according to 'race-groups' within the quin-tiles.
3. The division according to provinces within the quintile.
4. The division according to rural and urban areas.
5. The average amount in Rand of total consumption per person per month.
6. The average amount in Rand of food consumption per person per month.
7. The percentage share of the total food consumption which is spent on sugar and grain.
8. The percentage of people in the specific group who fall below the minimum of various indicators as used in the deprivation index.97
97 The assumed minimum is described in more detail in ‘5.1.2.6.) Analysis of various indicators‘.
Poverty, household structure and the current social assistance programmes 93
3 : n u m b e r s a r e i n t h o u sa n d s5 + 6 + 7 : n u m b e r s r e p r e se n t a v e r a g e o f t h i s g r o u pA s s u m e d m in im u m s t a n d a r d s :• T a k i n g e c o n o m ic s o f sc a l e i n to a c c o u n t
t h e t o t a l h o u se h o ld e x p e n d i t u r e w a s c o m p a r e d w i th t h e s u b s i s t e n c e l e v e l fo r t h e l o w e r - m id d le i n c o m e g r o u p i n C a p e T o w n ( U P E ,1 9 9 7 ) . T h i s i s s e e n a s t h e r e q u i r e d m i n i m u m . T h i s p o v e r t y l i n e i s s l i g h t l y ( 2 -3 % ) a b o v e th e 2 n d c o n s u m p -t io n q u i n t i l e ( r e l a t i v e p o v e r t y l i n e ) .
• S e e n a s b e lo w t h e m i n i m u m a r e :– h o u s e : s h a c k , t r a d i t i o n a l
d w e l l i n g , h o s t e l , o u tb u i ld i n g– d u r a b le s ( e . g . e l e c t r i c k e t t l e ,
f r i d g e ) : 0 -4– m a i n s o u r c e o f e n e r g y fo r
c o o k in g : w o o d , d u n g• S e e n a s b e lo w t h e m i n i m u m :
– w a te r : r i v e r / s t r e a m , d a m , s t a n d i n g w a te r , r a in w a te r , p r o t e c t e d sp r i n g , w e l l , b o r e h o le
– s a n i t a t i o n : n o t o i l e t , b u c k e t– h e a l t h fa c i l i t i e s : n o n e , fa m i l y ,
t r a d i t i o n a l h e a l e r• S e e n a s b e lo w m i n i m u m :
– e m p lo y m e n t : 0 -3 9 % o f a d u l t H H m e m b e r s
– e d u c a t io n ( a v e r a g e o f H H m e m b e r s o v e r 1 6 + ) : y e a r s n o n e to S td . 5
e x p e n d i t u r et y p e o f h o u s e
n u m b e r o f
d u r a b le s
t y p e o f e n e r g y u s e d f o r c o o k i n g
2 8 . 9 % " a f r ic a n " " c o lo u r e d " " in d ia n " " w h it e "
9 6 . 3 0 % 3 . 7 0 % 0 . 0 0 % 0 . 0 0 %
1 1 , 7 1 7 , 6 5 8
7 8 . 4 %2 1 . 6 % R 9 8 R 4 1 5 5 . 3 %
Figure 5-4: The poverty situation in the FIRST quintile
Poverty, household structure and the current social assistance programmes 94
3 : n u m b e r s a r e i n t h o u sa n d s5 + 6 + 7 : n u m b e r s r e p r e se n t a v e r a g e o f t h i s g r o u pA s s u m e d m in im u m s t a n d a r d s :• T a k i n g e c o n o m ic s o f sc a le i n to a c c o u n t
th e t o ta l h o u se h o ld e x p e n d i t u r e w a s c o m p a r e d w i t h t h e s u b s i ste n c e l e v e l fo r th e lo w e r - m i d d le in c o m e g r o u p i n C a p e T o w n ( U P E ,1 9 9 7 ) . T h i s i s s e e n a s t h e r e q u i r e d m i n i m u m . T h i s p o v e r t y l in e i s s l i g h t l y ( 2 -3 % ) a b o v e th e 2 n d c o n s u m p -t io n q u i n t i l e ( r e la t i v e p o v e r t y l i n e ) .
• S e e n a s b e lo w t h e m i n i m u m a r e :– h o u s e : s h a c k , t r a d i t io n a l
d w e l l i n g , h o s t e l , o u tb u i ld i n g– d u r a b l e s ( e . g . e le c t r i c k e t t l e ,
f r i d g e ) : 0 -4– m a i n s o u r c e o f e n e r g y fo r
c o o k in g : w o o d , d u n g• S e e n a s b e lo w t h e m i n i m u m :
– w a te r : r iv e r / st r e a m , d a m , s ta n d i n g w a te r , r a in w a te r , p r o te c te d sp r i n g , w e l l , b o r e h o le
– s a n i ta t io n : n o to i l e t , b u c k e t– h e a l t h fa c i l i t i e s: n o n e , fa m i l y ,
t r a d i t i o n a l h e a le r• S e e n a s b e lo w m i n i m u m :
– e m p lo y m e n t : 0 -3 9 % o f a d u l t H H m e m b e r s
– e d u c a t io n ( a v e r a g e o f H H m e m b e r s o v e r 1 6 + ) : y e a r s n o n e to S td . 5
e x p e n d i t u r et y p e o f h o u s e
n u m b e r o f
d u r a b le s
t y p e o f e n e r g y u s e d f o r c o o k in g
2 4 . 3 % " a f r ic a n " " c o lo u r e d " " in d ia n " " w h it e "
9 1 . 4 0 % 8 . 0 0 % 0 . 4 0 % 0 . 3 0 %
9 , 8 4 1 , 8 1 8
6 3 . 2 %3 6 . 8 % R 2 0 0 R 7 8 4 2 . 5 %
Figure 5-5: The poverty situation in the SECOND quintile
Poverty, household structure and the current social assistance programmes 95
3 : n u m b e r s a r e i n t h o u sa n d s5 + 6 + 7 : n u m b e r s r e p r e se n t a v e r a g e o f t h i s g r o u pA s s u m e d m in im u m s t a n d a r d s :• T a k i n g e c o n o m ic s o f sc a le i n to a c c o u n t
th e t o ta l h o u se h o ld e x p e n d i t u r e w a s c o m p a r e d w i t h t h e s u b s i ste n c e l e v e l fo r th e lo w e r - m i d d le in c o m e g r o u p i n C a p e T o w n ( U P E ,1 9 9 7 ) . T h i s i s s e e n a s t h e r e q u i r e d m i n i m u m . T h i s p o v e r t y l in e i s s l i g h t l y ( 2 -3 % ) a b o v e th e 2 n d c o n s u m p -t io n q u i n t i l e ( r e la t i v e p o v e r t y l i n e ) .
• S e e n a s b e lo w t h e m i n i m u m a r e :– h o u s e : s h a c k , t r a d i t io n a l
d w e l l i n g , h o s t e l , o u tb u i ld i n g– d u r a b l e s ( e . g . e le c t r i c k e t t l e ,
f r i d g e ) : 0 -4– m a i n s o u r c e o f e n e r g y fo r
c o o k in g : w o o d , d u n g• S e e n a s b e lo w t h e m i n i m u m :
– w a te r : r iv e r / st r e a m , d a m , s ta n d i n g w a te r , r a in w a te r , p r o te c te d sp r i n g , w e l l , b o r e h o le
– s a n i ta t io n : n o to i l e t , b u c k e t– h e a l t h fa c i l i t i e s: n o n e , fa m i l y ,
t r a d i t i o n a l h e a le r• S e e n a s b e lo w m i n i m u m :
– e m p lo y m e n t : 0 -3 9 % o f a d u l t H H m e m b e r s
– e d u c a t io n ( a v e r a g e o f H H m e m b e r s o v e r 1 6 + ) : y e a r s n o n e to S td . 5
e x p e n d i t u r et y p e o f h o u s e
n u m b e r o f
d u r a b le s
t y p e o f e n e r g y u s e d f o r c o o k in g
1 9 . 9 % " a f r ic a n " " c o lo u r e d " " in d ia n " " w h it e "
8 2 . 3 0 % 1 4 . 8 0 % 2 . 3 0 % 0 . 6 0 %
8 , 0 6 0 , 6 6 7
4 1 . 9 %5 8 . 1 % R 3 5 3 R 1 1 9 3 2 . 1 %
Figure 5-6: The poverty situation in the THIRD quintile
Poverty, household structure and the current social assistance programmes 96
3 : n u m b e r s a r e i n t h o u sa n d s5 + 6 + 7 : n u m b e r s r e p r e se n t a v e r a g e o f t h i s g r o u pA s s u m e d m in im u m s t a n d a r d s :• T a k i n g e c o n o m ic s o f sc a le i n to a c c o u n t
th e t o ta l h o u se h o ld e x p e n d i t u r e w a s c o m p a r e d w i t h t h e s u b s i ste n c e l e v e l fo r th e lo w e r - m i d d le in c o m e g r o u p i n C a p e T o w n ( U P E ,1 9 9 7 ) . T h i s i s s e e n a s t h e r e q u i r e d m i n i m u m . T h i s p o v e r t y l in e i s s l i g h t l y ( 2 -3 % ) a b o v e th e 2 n d c o n s u m p -t io n q u i n t i l e ( r e la t i v e p o v e r t y l i n e ) .
• S e e n a s b e lo w t h e m i n i m u m a r e :– h o u s e : s h a c k , t r a d i t io n a l
d w e l l i n g , h o s t e l , o u tb u i ld i n g– d u r a b l e s ( e . g . e le c t r i c k e t t l e ,
f r i d g e ) : 0 -4– m a i n s o u r c e o f e n e r g y fo r
c o o k in g : w o o d , d u n g• S e e n a s b e lo w t h e m i n i m u m :
– w a te r : r iv e r / st r e a m , d a m , s ta n d i n g w a te r , r a in w a te r , p r o te c te d sp r i n g , w e l l , b o r e h o le
– s a n i ta t io n : n o to i l e t , b u c k e t– h e a l t h fa c i l i t i e s: n o n e , fa m i l y ,
t r a d i t i o n a l h e a le r• S e e n a s b e lo w m i n i m u m :
– e m p lo y m e n t : 0 -3 9 % o f a d u l t H H m e m b e r s
– e d u c a t io n ( a v e r a g e o f H H m e m b e r s o v e r 1 6 + ) : y e a r s n o n e to S td . 5
e x p e n d i t u r et y p e o f h o u s e
n u m b e r o f
d u r a b le s
t y p e o f e n e r g y u s e d f o r c o o k in g
1 4 . 6 % " a f r ic a n " " c o lo u r e d " " in d ia n " " w h it e "
6 2 . 1 0 % 1 6 . 5 0 % 9 . 0 0 % 1 2 . 5 0 %
5 , 9 3 8 , 8 8 4
2 2 . 1 %7 7 . 9 % R 6 9 1 R 1 6 7 2 4 . 1 %
Figure 5-7: The poverty situation in the FOURTH quintile
Poverty, household structure and the current social assistance programmes 97
3 : n u m b e r s a r e i n t h o u sa n d s5 + 6 + 7 : n u m b e r s r e p r e se n t a v e r a g e o f t h i s g r o u pA s s u m e d m in im u m s t a n d a r d s :• T a k i n g e c o n o m ic s o f sc a le i n to a c c o u n t
th e t o ta l h o u se h o ld e x p e n d i t u r e w a s c o m p a r e d w i t h t h e s u b s i ste n c e l e v e l fo r th e lo w e r - m i d d le in c o m e g r o u p i n C a p e T o w n ( U P E ,1 9 9 7 ) . T h i s i s s e e n a s t h e r e q u i r e d m i n i m u m . T h i s p o v e r t y l in e i s s l i g h t l y ( 2 -3 % ) a b o v e th e 2 n d c o n s u m p -t io n q u i n t i l e ( r e la t i v e p o v e r t y l i n e ) .
• S e e n a s b e lo w t h e m i n i m u m a r e :– h o u s e : s h a c k , t r a d i t io n a l
d w e l l i n g , h o s t e l , o u tb u i ld i n g– d u r a b l e s ( e . g . e le c t r i c k e t t l e ,
f r i d g e ) : 0 -4– m a i n s o u r c e o f e n e r g y fo r
c o o k in g : w o o d , d u n g• S e e n a s b e lo w t h e m i n i m u m :
– w a te r : r iv e r / st r e a m , d a m , s ta n d i n g w a te r , r a in w a te r , p r o te c te d sp r i n g , w e l l , b o r e h o le
– s a n i ta t io n : n o to i l e t , b u c k e t– h e a l t h fa c i l i t i e s: n o n e , fa m i l y ,
t r a d i t i o n a l h e a le r• S e e n a s b e lo w m i n i m u m :
– e m p lo y m e n t : 0 -3 9 % o f a d u l t H H m e m b e r s
– e d u c a t io n ( a v e r a g e o f H H m e m b e r s o v e r 1 6 + ) : y e a r s n o n e to S td . 5
e x p e n d i t u r et y p e o f h o u s e
n u m b e r o f
d u r a b le s
t y p e o f e n e r g y u s e d f o r c o o k in g
1 2 . 4 % " a f r ic a n " " c o lo u r e d " " in d ia n " " w h it e "
1 5 . 2 0 % 5 . 9 0 % 6 . 0 0 % 7 2 . 9 0 %
5 , 0 2 4 , 5 4 6
1 2 . 4 %8 7 . 6 % R 2 , 0 4 9 R 2 6 3 1 4 . 5 %
Figure 5-8: The poverty situation in the FIFTH quintile
Poverty, household structure and the current social assistance programmes 98
5.1.2.1.) The percentage of the population living in the different quintiles It becomes clear that the population is disproportionately distributed across the quintiles with well over 50% of South Africans living below the poverty line and even nearly 1/3 living in the poorest quintile. Another 20% live just above the poverty line. In comparison only 12% live in the richest quintile and only 27% make up the top two quintiles.
Qu. 1 Qu. 2 Qu. 3 Qu. 4 Qu. 5
Percentage of population 28.9% 24.3%
Poverty line
19.9% 14.6% 12.4%
Table 5-1: The percentage of the population living in the different quintiles
5.1.2.2.) The division according to ‘race-groups’ within the quintiles The analysis reveals the strong link between poverty and ‘race’ in South Africa.
Qu. 1 Qu. 2 Qu. 3 Qu. 4 Qu. 5
‘African’ 96.3% 91.4% 82.3% 62.1% 15.2%
‘Coloured’ 3.7% 8% 14.8% 16.5% 5.9%
‘Indian’ 0% 0.4% 2.3% 9% 6%
‘White’ 0% 0.3%
Poverty line
0.6% 12.5% 72.9% Table 5-2: The division according to ‘race-groups’ within the quintiles
In both the first and second quintiles over 90% are ‘africans’ and in the third quintile still 82% are ‘africans’ while they make up only 15% of those living in the top quintile. Virtually, no ‘indians’ or ‘whites’ are living below or just above the poverty line, but together they represent nearly 80% of those living in the richest quintile. ‘Coloureds’ constitute around 15% in both the third and fourth quintile in comparison to 8% and 4% in those quintiles below the poverty line.
5.1.2.3.) The division according to provinces within the quintiles The poor are not evenly spread across the provinces. The Eastern Cape, the Northern Province and KwaZulu Natal house most of the people of the poorest quintile, followed by the Free State and North West. People of the second quintile are most likely to live in KwaZulu Natal followed by the Eastern Cape, Gauteng and Northern Province. When it comes to the third quintile, Gauteng and again KwaZulu Natal take in the bulk of people, followed by the Western Cape and then the rest of the prov-inces. The more well off the people are, the more likely they are to live in Gauteng and the Western Cape.
5.1.2.4.) The division according to rural and urban areas within the quintile
Similar to this link between poverty, ‘race-group’ and provinces, there is a strong relation between poverty and rural/urban areas. Nearly 80% of the poorest live in a rural area and nearly 2/3 of the ‘sec-ond’ poorest. The picture changes slightly if one looks at those just above the poverty line: 42% live in rural areas while 58% dwell in urban areas.
Qu. 1 Qu. 2 Qu. 3 Qu. 4 Qu. 5
Rural 78.4% 63.2% 41.9% 22.1% 12.4%
Urban 21.6% 36.8%
Poverty line
58.1% 77.9% 87.6% Table 5-3: The division according to rural and urban areas within the quintile
Poverty, household structure and the current social assistance programmes 99
The more dramatic change takes place in the fourth and fifth quintile with 78% and 88% living in ur-ban areas respectively. This division goes clearly along with the division according to provinces.
5.1.2.5.) Analysis of consumption and spending patterns The table below illustrates the huge differences in consumption and spending patterns across the dif-ferent quintiles.
Qu. 1 Qu. 2 Qu. 3 Qu. 4 Qu. 5
Total consump-tion per person
per month R98 R200 R353 R691 R2,049
Food consump-tion per person
per month R41 R78 R119 R167 R263
Percentage share spent on sugar &
grain 55.3% 42.5%
Poverty line
32.1% 24.1% 14.5%
Table 5-4: Analysis of average consumption and spending patterns
People in the bottom quintile on average do not even spend R100 per person per month. Of that amount nearly half goes to food consumption of which again over 50% is used to buy sugar and grain, a clear indication of an insufficient diet, likely to result in vitamin deficiencies and malnutrition espe-cially for children. Mathematically, the picture already looks different in the second quintile as double the amount per person is used for both total consumption and food consumption. However, consider-ing that still 42% of the food consumption is spent on sugar and grain, the deficiency in the diet be-comes quite apparent and the level of spending is still below any reasonable subsistence level.98
Those living just above the poverty line on average have a monthly consumption of R353, of which R119 is consumed for food and ‘only’ one third of that amount is spent on sugar and grain.
The trend that proportionally less is spent on sugar and grain continues. In the fourth quintile, the fig-ure drops to 24% and to 14% in the fifth quintile. This correlation between higher food consumption and a positive change towards a healthier diet should be taken into account when considering interven-tion aimed at poverty alleviation. An improvement on this level is of the utmost importance, especially for the long-term benefit of child development.
The dramatic change in terms of overall consumption can be observed between the third and the fourth as well as the fifth quintile. In the fourth quintile, consumption levels jump to nearly R700 per person and to over R2000 in the fifth quintile. However, as expected, the increase does not correspond to an increase in food spending, an indication that the money is used on non-food items.99
5.1.2.6.) Analysis of various indicators The analysis gives the percentage of people in the different quintiles who are living below a defined minimum level. The defined minimum level used here is the same as the one applied for the depriva-tion index.100
Qu. 1 Qu. 2 Qu. 3 Qu. 4 Qu. 5
Expenditure 100% 96.9% 32.9% 0% 0%
Type of house 34.6% 30%
Poverty line 26.1% 20% 4.4.%
98 See Potgieter, 1997 99 See Sautter & Serries, 1993:57 100 For the exact details see Table 4-2 page 73 and for a short explanation see Figure 5-4 to Figure 5-8.
Poverty, household structure and the current social assistance programmes 100
Number of dur-ables 90.9% 72.7% 50.1% 25.8% 6.7%
Type of energy used for cooking 64.2% 39.6% 20.3% 5.5% 1%
Accessed health facilities 23% 18% 13.3% 12.6% 13.2%
Employment of members 73.5% 61.1% 42.7% 23.6% 9.2%
Education 68.8% 51.9%
38.3% 22.4% 10.5% Table 5-5: Analysis of various indicators
As expected, the breakdown reveals that the majority of the people in the first quintile score below the defined minimum in most categories thus indicating severe poverty and deprivation. The exemptions are type of house, sanitation facilities and accessed health facilities where ‘only’ between 1/4 to 1/3 score below the minimum. The interesting findings occur, if one looks at those people living in the second and third quintile, and who hence are either just below or just above the poverty line as defined by expenditure. There is of course a huge difference in the expenditure indicator, where the figure drops from 97% in the second quintile to 33% in the third quintile. The percentage points do continue to fall between the second and the third quintile, indicating that people in general are better off. How-ever, for some of the indicators the figures remain relatively high. In the third quintile, still 1/3 of the people live below the subsistence level, 50% score below the minimum when it comes to the number of durables, and 1/5 when one looks at water access, and around 40% considering the employment and the education situation of the household members. This points to the fact that although people in the third quintile are regarded as living above the poverty line, they do face a situation where they are continuously deprived of the minimum standard of living. Any poverty alleviation programme has to take account of this fact.
The more tangible improvement of the overall situation takes place only in the fourth quintile, which is quite in line with the findings on consumption and spending patterns. In the fourth quintile none of the people are below the minimum when it comes to expenditure, and only between 5-7% are below the minimum standard for energy, water, and sanitation facilities, while around 20%-25% score below when it comes to housing and employment. This seems still to be high; however it has to be kept in mind that the comparable figure doubles for the third quintile and nearly triples for the second quintile. In the fifth quintile all figures drop further with the exception of ‘accessed health facilities’. Here the limitations of this indicator become evident.
5.2.) Household structure and poverty
5.2.1.) The definition of a household The household is the crucial mediating institution between personal income and expenditure. (…) In-comes accrue to individuals, yet these incomes are aggregated within households and decisions about la-bour supply, consumption, and savings are taken on a household basis. The analysis of income distribu-tion and poverty also involves the study of households. (Simkins, 1986:16+17)
Before looking at the different household types and the relationship between household structure and poverty, the underlying concept of the household and the contrast with a concept of the family should be clarified.
There is a long running and complex debate concerning the extent of overlap between household and family. Sometimes the co-residential household and family groups coincide, often they do not. (Blumberg, 1991:27)
Poverty, household structure and the current social assistance programmes 101
The family is usually based on a biological relationship while the household definition is more com-plex and complicated and can differ substantially. For example, the definitions vary in terms of the length an individual is required to live under the same roof if he/she is to be regarded as a member of the household (e.g. 6 months in one year). Others require the existence of a common resource pool.101 Some definitions are also based on the concept of biological relationship.102
The focus of the research must guide the concepts applied. Focussing on the link between social assis-tance transfers and the impact on poverty alleviation, the distribution of resources is imperative. The quotation from Simkins points to the fact that one has to assume pooling of resources on the household level. One can further assume that the pooling takes place whether the household is solely based on biological relationships or not. The composition of the household and not so much an individual fam-ily form within the household is hence of importance.
The definition of a ‘household’ used by SALDRU is based on the concept of a food and a common resources pool and is therefore suited for the research.
The first definition of the household comprised all individuals who:
(i) live under this ‘roof’ or within the same compound/homestead/stand at least 15 days out of the past year and
(ii) when they are together they share food from a common source [i.e. they cook and eat together] and
(iii) contribute to or share in, a common resource pool’ [i.e. they contribute to the household through wages and salaries or other cash and in-kind income they may be benefiting from this income but not contributing to it, e.g. children, and other non-economically active people in the household] Visitors were excluded from this definition.
The second definition of the household included only those members who had lived ‘under this roof for more than 15 days of the last 30 days’. This definition was derived to eliminate double-counting of indi-viduals. (SALDRU, 1995:iv)
To categorise different household structures, the division into different age groups (children, working age adults and adults in pension age) as found useful when looking at social assistance and as ex-plained in 4.5.) is applied here as well. The age group division adds up to seven different household compositions which will be analysed:103
1. Children only
2. Children and working age adults
3. Children and adults in pension age (skip generation household)
4. Children, working age adults and adults in pension age (three generation household)
5. Only working age adults
6. Working age adults and adults in pension age
7. Only adults in pension age
Looking at the household rather than the family form is also in line with the findings of the Lund Committee (1996:25), which stated that in the face of changing family forms and multiple living ar-rangements in South Africa, the focus of social assistance should rather be on the individual (in the case of the CSG, the child) than on a particular family form. Nevertheless, it was felt that one should have information on the immediate family and therefore an analysis of the parental care arrangements has been included. This is also needed for the running of the AIDS model where it is then possible to look at the number of orphans and the alternative care arrangements.
When examining the distribution of resources on the household level, one has to be aware that the intra-household distribution is often neglected. While until recently, research often assumed a ‘unitary model’ in which the household …(acts) as a single decisionmaker… new evidence points to various
101 See Haddad, Hoddinott, Alderman, 1997. 102 See Simkins, 1986 103 See also ‘4.5.) Calculate aggregated household figures and analyse household types’
Poverty, household structure and the current social assistance programmes 102
forms of ‘collective’ or ‘bargaining’ models (Haddad, Hoddinott, Alderman, 1997). It is therefore important to mention that pooling of resources does not mean equal access to or even equal decision making power over the resources. While in this research the quantitative analysis will confine itself to the household level, research from other sources looking into intrahousehold allocation will be consid-ered as well.104
5.2.2.) An analysis of the household structure The following table displays the relationship between household structure and poverty. The first sec-tion ‘household structure’ gives information on:
• The number/percentage of people in each household divided by age group whereby the children are further divided into smaller age groups.
• The average number of people living together in the household, divided into age groups.105
• The number/percentage of children in parental care - de jure - divided into father + mother present, only mother present, only father present and none present.
• The number/percentage of children in parental care - de facto - divided into father + mother present, only mother present, only father present and none present.
104 See for example, Case & Deaton, 1998, Haddad, Hoddinot, Alderman, 1997, Simkins, 1997; Blumberg, 1991; Ard-
ington & Lund, 1995; Ziehl, 1988 105 This is weighted by the number of people and not the number of households. The average number of people living in
a household is calculated as average weighted by the number of people represented through the household in the total population. This is opposed to the average household size being calculated by dividing the total number of people by the number of households. For example: If there are 2 households, one with 9 people and the other one is a single person household, the average number of people in a household (as displayed in the table) is 8.2 (9 times 9 plus 1 times 1 divided by 10), in contrast to the other methodology where the figure would be 5 (10 people divided by 2 households). This methodology is applied throughout the table, as this allows to paint a more realistic picture of the social reality the average South African is faced with. The average household size weighted by households instead would distort this picture in favour of people living in smaller households.
Poverty, household structure and the current social assistance programmes 103
% 60/65- 0.0% 0.0% 8.1% 59.9% 0.0% 15.9% 16.1% 100.0% Average No. of people in the HH: 3.5 6.5 4.4 8.9 2.2 3.4 1.7 6.4
Av. 0-17 3.5 3.5 3.1 4.4 0.0 0.0 0.0 3.2 Av.0-4 0.5 1.0 0.5 1.3 0.0 0.0 0.0 0.9 Av.5-13 1.5 1.8 1.8 2.3 0.0 0.0 0.0 1.7 Av.14-17 1.5 0.7 0.8 0.8 0.0 0.0 0.0 0.6 Av. 18-59/64 0.0 3.0 0.0 3.3 2.2 2.1 0.0 2.9 Av. 60/65- 0.0 0.0 1.3 1.2 0.0 1.2 1.7 0.3 No. of children in parental care - de jure:
father + mother 21,944 8,598,425 29,501 1,150,957 9,800,828 only mother 12,249 3,618,034 74,452 1,789,413 5,494,148 only father 0 317,559 5,745 185,917 509,221 none 18,803 1,112,306 252,409 870,676 2,254,194 Total 52,997 13,646,324 362,107 3,996,963 18,058,391 % of children in parental care - de jure:
father + mother 41.4% 63.0% 8.1% 28.8% 54.3% only mother 23.1% 26.5% 20.6% 44.8% 30.4% only father 0.0% 2.3% 1.6% 4.7% 2.8% none 35.5% 8.2% 69.7% 21.8% 12.5% Total 100.0% 100.0% 100.0% 100.0% 100.0% No. of children in parental care - de facto:
father + mother 0 6,671,020 4,440 804,864 7,480,324 only mother 2,727 4,996,488 19,464 1,829,579 6,848,258 only father 0 311,790 5,732 161,250 478,771 none 50,270 1,667,026 332,472 1,201,270 3,251,037 Total 52,997 13,646,324 362,107 3,996,963 18,058,391 % of children in parental care - de facto:
father + mother 0.0% 48.9% 1.2% 20.1% 41.4% only mother 5.1% 36.6% 5.4% 45.8% 37.9% only father 0.0% 2.3% 1.6% 4.0% 2.7% none 94.9% 12.2% 91.8% 30.1% 18.0% Total 100.0% 100.0% 100.0% 100.0% 100.0% Average ratio of adult (age >= 18) per child: 0.0 1.2 0.6 1.5 1.2 Table 5-6: Household structure
The analysis reveals that the ‘children with working age adult’ type is by far the predominant (64.1%) household structure in South Africa. This is followed by the three generation household (21%) and the ‘only working age adult’ type (10.3%). Only 1.3% live in a skipped generation household. While here the adult - child ratio is the lowest of the household types with 0.6 adults per child, only 2% of the children live in these households. Over ¾ of the children live only with working age adults and an-other 22% of the children live together with working age adults and adults of pension age. In both cases, the adult ratio per child is more favourable with 1.2 adults and 1.5 adults per child respectively. The ‘only children’ households make up 0.1% or 53,000 people. These are not only orphans but also households of teenage parents. However, in detail analysis of this household type has to be treated with extreme caution because of the small number in the sample but it is important to observe the changes when the AIDS model is run.
Taking the perspective of adults of pension age, the majority (59.9%) live in three generation house-holds followed by those living on their own (16.1%) or with adults of working age (15.9%). Only 8.1% live only with children. Working age adults in turn are most likely to live with children (61%), on their own (20.6%) or in three generation households (15.8%).
Poverty, household structure and the current social assistance programmes 104
On average there are 6.4 people in a household. This number jumps to 8.9 people in the three genera-tion households and 3.5 live together in the ‘only children’ household. In the skip generation house-holds on average 1.3 adults of pension age lives with 3.1 children.
Looking at the parental care analysis, several points are of importance: First of all, one arrives at the difference between ‘de jure’ and ‘de facto’ presence of parents by applying the first and the second household definition of SALDRU respectively.106 The first definition on which the ‘de jure’ presence is based requires people to be present for at least 15 days out of the last year. Presence ‘de facto’ in-volves the living under the same roof for at least 6 months of the past year.
The ‘de jure’ presence shows that 54.3% of children live with both their parents while nearly 1/3 live only with their mothers. In contrast, single father parental care makes up only 2.8%, but a considerable 12.5% live without a father or mother. This latter figure goes up to 18% when one examines the ‘de facto’ presence. Here the presences of both father and mother drops to 41.4% while the only mother care increases in turn to 37.9%.
Furthermore, children are far more likely to live with both parents if they are part of a ‘children - working age adult’ household than of a three generation household. This finding combined with the fact that most of the single mother arrangements are in a three generation household, points to the fact that singles with children are likely to live with their parents. The three generation households also have a considerable 30.1% children without any parents at all which would be a skip generation household if one considers family forms based on biological relationship instead of household types.
20.6% of the children living only with adults in pension age have a ‘de jure’ presence of the mother, but ‘de facto’ over 90% of the children in these households have none of the parents present. This indicates mothers who are e.g. engaged in seasonal work and therefore are away from the household.
5.2.3.) An analysis of household structure and poverty This second section of the table on ‘poverty’ gives information on:107
• The number/percentage of people in each household divided by age group whereby the children are further divided into smaller age groups.
• The average number of people living together in the household, divided into age groups.
• The number/percentage of children in parental care - de jure - divided into father + mother present, only mother present, only father present and none present.
• The number/percentage of people according to quintiles and household type.
• The percentage of people of each household type by quintiles.
• The percentage of people of each quintile by household type.
• The percentage of households below the subsistence line.108
• The percentage of households living in rural/urban areas.
• The percentage of female headed households.
• The ‘racial’ stratification of the household types.
106 See page 101 for the definition. 107 The analysis is done on the basis of the old social security transfers as recorded in the SALDRU data. 108 See ‘4.3.3.) Deprivation index’
Poverty, household structure and the current social assistance programmes 105
By far the majority of people in the two predominant household types (‘children and working age adults’ and three generation households) live in the first three quintiles. The same applies to skip gen-eration households and ‘only children’ households of which in both cases around 90% are in the first three quintiles. In comparison, 71.5% of the adults of pension age who are living on their own and 43.3% of those living with working age adults live in the fourth and fifth quintile. Similarly 63.1% of the working age adults with their own household live in the fourth and fifth quintile. These calcula-tions clearly indicate the connection between poverty, number of people in the household and house-holds with children. Larger households with children are far more likely to live in poverty than smaller ones without children. The finding is confirmed when looking at the percentage of the people in the different household types that live in the bottom two quintiles.109 Nearly 90% of the people in 'only children' households and around 70% of those in both, skip generation households and three genera-tion households, live in the first two quintiles. Still 52.1% of ‘working age adults with children’ live in the bottom two quintiles, representing the national average, in turn 'only' 38.3% of ‘working age adults with pensioners' and 19.4% of those ‘only working age adults’ households live in poverty. The figure drops to 15.3% for people in households containing only adults of pension age. The situation would deteriorate if there were no social assistance. If one looks at the households which are below the sub-sistence level without taking any social assistance transfers into account, then around 90% of the peo-ple in both, 'only children' and skip generation households and over 80% in the three generation households would be below the subsistence line. Furthermore, more than half of the 'children with working age adults' and the 'working age adults with pensioners' would be below the line. On average 58% of the people across the different household compositions would live below the subsistence line. Only the 'only pensioner' households with 40% of the people and the 'only working age adults' house-holds with 23.1% of them below the line, score better than the average.
Furthermore, the link between ruralism and poverty can also be observed. Nearly 2/3 of the three gen-eration households and over 80% of the skip generation households live in rural areas. Well over 90% of the ‘only children’ households are in rural areas, but as said before, results concerning these house-holds have to be treated with caution. Again, the ‘children with working age adult’ households corre-spond to the national average of around 50%. Interestingly, nearly 30% of the households with ‘only adults of pension age’ live in rural areas.
109 The subsistence level is taken from the deprivation index, see ‘4.3.3.) Deprivation index’.
Poverty, household structure and the current social assistance programmes 107
Looking at female headed households, the following findings can be observed: 58.3% of skip genera-tion households are female headed and nearly half (46.6%) of the three generation households. An interestingly large percentage (37.6%) of working age adult households with pensioners are female headed, while only 20.2% of the ‘children with working age adults’ households are female headed, again representing approximately the national figure of 26.4%.
The division of the different household types into different ‘race’ groups reveals that of the three gen-eration households and the skip generation households over 90% are ‘african’. ¾ of the ‘children with working age adults’ households are also ‘african’, while both ‘coloured’ and ‘whites’ make up 10% of this household type. The ‘only working age adult’ household and the ‘working age adult with pension-ers’ household both split between ‘african’ and ‘whites’ at around 2/3 to 1/3 respectively. The picture changes with the ‘only adults in pension age’ where 1/3 is ‘african’ and 2/3 is ‘white’.
5.2.4.) HIV/AIDS and its effect on the household structure The following tables examine the impact of HIV/AIDS on the different household compositions by analysing the number of people affected in the different household types. The tables display on the one hand the situation of 1996 without HIV/AIDS and on the other hand the situation in 2011 after the AIDS model has been run as described earlier.110
The section on the household structure gives information on the following:
• Number/percentage of people living in a household that is affected by HIV/AIDS. That means at least one member of the household is either HIV positive, AIDS sick or died because of AIDS.
• Average ratio of healthy adult per child and sick and disabled adult.
• Number/percentage of people in the household who are HIV positive, AIDS sick.111
only child.
child. + work. age
adults
child. + adults in pen. age
child. + work. age adults + adults in pen. age
only work. age adults
work. age adults + adults in pen. age
only adults in pen. age Total
HIV/AIDS No. of people living in HH affected by HIV/AIDS: 0 0 0 0 0 0 0 0 % of HH affected by HIV/AIDS: 0.0% 0.0% 0.0% 0.0% 0.0% 0.0% 0.0% 0.0% Average ratio of healthy adult per child + sick and disabled : 0.0 1.1 0.6 1.4 2.2 2.4 1.0 1.2 No. of people in the HH - HIV infected: 0 0 0 0 0 0 0 0
110 See ‘4.4.) The inclusion of HIV infections and AIDS in the model’ 111 Due to the fact that the household composition changes if people die, the number/percentage of people who died of
AIDS in the different household types are not indicated as they did not necessarily live in that particular household type before. Therefore only the total number of people who died because of AIDS in the different age groups is given.
Poverty, household structure and the current social assistance programmes 108
No. 60/65- 0 0 0 0 0 0 0 0 % of people in the HH - HIV infected: 0.0% 0.0% 0.0% 0.0% 0.0% 0.0% 0.0% 0.0%
Poverty, household structure and the current social assistance programmes 109
only child.
child. + work. age
adults
child. + adults in pen. age
child. + work. age adults + adults in pen. age
only work. age adults
work. age adults + adults in pen. age
only adults in pen. age Total
HIV/AIDS No. of people living in HH affected by HIV/AIDS: 966,706 15,733,956 288,969 6,609,115 2,024,960 543,392 50,767 26,217,864 % of HH affected by HIV/AIDS: 93.7% 54.8% 30.9% 65.5% 44.8% 52.7% 11.5% 56.1% Average ratio of healthy adult per child + sick and disabled : 0.0 1.0 0.6 1.3 1.5 2.1 0.8 1.0 No. of people in the HH - HIV infected: 56,893 3,390,815 18,592 1,004,141 1,214,978 168,717 14,704 5,868,839
The change due to the impact of HIV/AIDS between 1996 which as the base assumes no HIV/AIDS infections or deaths and the situation 15 years later is dramatic. Over half (56.1%) of the population will live in households that will be affected at least by one HIV infection or AIDS sick or AIDS death case in the household. The effect is most severe in the ‘only children’ households as here up to 93.7% of the people living in this household type will be influenced by the epidemic. This is explicable be-cause of the number of AIDS orphans who by definition come from households affected by HIV/AIDS. 2/3 of the people in the three generation households are affected, followed by the 54.8% of the people in ‘children and working age adults’ households, those in ‘working age adults with pen-sioners’ households (52.7%) and in the ‘only pensioner’ households (44.8%). The least affected households are those with ‘only children and pensioners’ and those where pensioners live on their own. However, in the former type still 30.9% of the people are affected compared to 11.5% of those in the latter.
The average ratio of healthy adults per child and disabled112 falls by 17% to an average of 1. This hints to a situation where households affected by HIV/AIDS have a double burden: Firstly, they lose a person who otherwise was potentially bringing income to the household, helping in agricultural activi-ties, child care, or other household activities. Secondly, especially while having developed full blown AIDS, another person will have to take substantial time off to care for the sick. This is again time and energy otherwise spent productively for the household. In 2011, on average 2.1% of the population will have developed full blown AIDS. The following household types are proportionally severely af-fected: ‘children + working age adults’ with 2%, ‘only working age adults’ with 4.6% (!) and ‘working age adults and adults in pension age’ with 2.4%. Given the finding that about half of the people live in households affected by HIV/AIDS it becomes clear that while some households will not be affected at all, the ratios of healthy to sick people in other households will be aggravated. Especially poorer households will be vulnerable to the effect whereby households, which otherwise were able to support themselves, fall into absolute destitution if not assisted otherwise.
The breakdown into the different age groups points to the fact that working age adults are most af-fected in terms of number. Nearly 25% of the working age adults are infected with HIV and 16.8% have died because of AIDS. 12.4% or over 800,000 children between the age of 0-4 have by the year 2011 died of AIDS, while they show an infection rate of 4.6%. The total number of HIV infections lies at about 5.8 million and the total number of AIDS dead at 5.5 million.113
112 This includes here the Aids sick cases. Note this is different form the default scenarios of the social assistance pro-
grammes later. There the assumption is that persons with HIV/AIDS do not qualify for a Disability Grant. See page 126
113 The total HIV infection rate for the population will be about 2-3% lower in the year 2011 than the one predicted by the ASSA model. This is so for the following reason: The infection rates are projected onto the SALDRU data by age and gender. The total population figure then is a sum of the members of the population. The difference is to be ex-pected due to the differences in population figures in the working age groups. While the SALDRU data follows the Census in this regard (see page 50), the ASSA model in contrast uses Dorrington’s projections which argue that the Census undercounted especially adult males (see page 51). Therefore the ASSA model has relatively more people in the sexually active group and hence a higher total infection rate than reflected in the SALDRU data. Taking account of that difference, the number of HIV infections and AIDS deaths are confirmed by other research as well: See Lovelife, 2000:7 and Department of Finance, 2000:29
Poverty, household structure and the current social assistance programmes 111
5.3.) The potential coverage of the present system As described in detail in Chapter 1, the welfare system which the present government inherited from the National Party regime was not intended to provide either equal or comprehensive coverage to all South Africans.114 While the new government has started to reform the old system, the coverage is far from comprehensive and many gaps exist. The first section analyses who is reached by the old system, while the second section analyses who potentially would be reached if the revised programmes worked with a 100% efficiency. On that basis the gaps can be identified in detail. The programmes that are looked at under the potential current system are the SOAPs, the DGs115 and the CSG as they are the important programmes in terms of national comprehensive coverage. Although the other existing pro-grammes outlined in Chapter 1 are important from a developmental perspective as well, they do not make a difference in terms of coverage on a national and long-term level. Therefore they are not in-corporated here.
5.3.1.) Household structure, poverty and social assistance programmes
5.3.1.1.) The old system
This analysis scrutinizes the people living in the first two quintiles116 and wants to determine how far social assistance programmes will reach in these quintiles. In the next section only the old social assis-tance transfers by the end of 1993 (when the SALDRU data was collected) are considered, while in the following section the potential coverage of the current system is tested. The table contains the follow-ing:
• Number of people living in the bottom two quintiles.
• Percentage of people in the bottom two quintiles in the different household types.
• Number/percentage of people living in the household who do not receive social assis-tance.
• Average number of people living in the household.117
• Average number of people employed.
• Average number of people receiving social assistance.
• Average percentage of the poverty gap that is closed by social assistance transfers.
• Average per capita social assistance transfers and a breakdown of the per capita trans-fers by the different social assistance programmes.
• The total annual transfers to quintiles.
• The total annual transfers to rural and urban areas.
• The total annual transfers by race.
114 See ‘1.1.1.) History of Social Security in South Africa’ 115 This refers to the Care-Dependency Grant as well as the Disability Grant, for details see footnote 87 page 84. 116 If not otherwise indicated, all information is given for people in the bottom two quintiles 117 As in section ‘5.2.2.) An analysis of the household structure’ this is the average number of people living together and
not the average household size, see footnote 105 page 102.
Poverty, household structure and the current social assistance programmes 112
only child.
child. + work. age
adults
child. + adults in pen. age
child. + work. age adults + adults in pen. age
only work. age adults
work. age adults + adults in pen. age
only adults in pen. age Total
SOCIAL ASSISTANCE - POVERTY Total No. of people living in the bottom two quintiles: 32,280 13,548,616 402,237 6,366,098 808,943 345,796 55,553 21,559,522 % of people living in the bottom two quintiles: 0.1% 62.8% 1.9% 29.5% 3.8% 1.6% 0.3% 100.0% Total No. of people living in HH receiving no social assistance (bottom two quintiles): 32,280 11,322,898 18,623 950,344 717,162 31,531 6,721 13,079,559 % of people living in HH receiving no social assistance (bottom two quintiles): 100.0% 83.6% 4.6% 14.9% 88.7% 9.1% 12.1% 60.7% Average No. of people living in the HH (bottom two quintiles): 4.2 7.4 4.7 9.3 2.7 3.7 1.4 7.6 Average No. of people employed in the HH (bottom two quintiles): 0.0 1.0 0.0 0.8 1.0 0.6 0.0 0.9 Average No. of people receiving social assistance (bottom two quintiles): 0.0 0.2 1.2 1.1 0.1 1.1 1.3 0.5 Average % closed of the poverty gap by social assistance (bottom two quintiles): 0.0% 8.8% 64.7% 41.5% 10.2% 66.6% 84.2% 21.6% Average per capita social assistance transfer (bottom two quintiles): R 3 R 14 R 122 R 59 R 27 R 140 R 348 R 33 Average per capita social assistance transfer through old SoSe payments (bottom two quintiles): R 0 R 12 R 122 R 58 R 24 R 140 R 348 R 31 Average per capita social assistance transfer through SOAP (bottom two quintiles): R 0 R 0 R 0 R 0 R 0 R 0 R 0 R 0 Average per capita social assistance transfer through CSG (bottom two quintiles): R 0 R 0 R 0 R 0 R 0 R 0 R 0 R 0 Average per capita social assistance transfer through DG (bottom two quintiles): R 0 R 0 R 0 R 0 R 0 R 0 R 0 R 0 Average per capita social assistance transfer through BIG (bottom two quintiles): R 0 R 0 R 0 R 0 R 0 R 0 R 0 R 0 Average per capita social assistance transfer through UB (bottom two quintiles): R 0 R 0 R 0 R 0 R 0 R 0 R 0 R 0 SOCIAL ASSISTANCE - ECONOMY Total number of people reached by social assistance programmes: old system 0 0 0 0 0 0 0 0 SOAP 0 0 0 0 0 0 0 0 CSG 0 0 0 0 0 0 0 0 DG 0 0 0 0 0 0 0 0
Poverty, household structure and the current social assistance programmes 113
BIG 0 0 0 0 0 0 0 0 UB 0 0 0 0 0 0 0 0 HH 0 0 0 0 0 0 0 0 Total 0 0 0 0 0 0 0 0 Total annual transfers by social assistance programmes (in millions): old system R 0 R 0 R 0 R 0 R 0 R 0 R 0 R 0 SOAP R 0 R 0 R 0 R 0 R 0 R 0 R 0 R 0 CSG R 0 R 0 R 0 R 0 R 0 R 0 R 0 R 0 DG R 0 R 0 R 0 R 0 R 0 R 0 R 0 R 0 BIG R 0 R 0 R 0 R 0 R 0 R 0 R 0 R 0 UB R 0 R 0 R 0 R 0 R 0 R 0 R 0 R 0 HH R 0 R 0 R 0 R 0 R 0 R 0 R 0 R 0 Total R 0 R 0 R 0 R 0 R 0 R 0 R 0 R 0 Total annual transfer to quintiles (in millions): 1. Qu. 0.0 1,042.9 300.6 2,667.2 88.4 288.9 65.7 4,462.1 2. Qu. 0.0 896.5 285.1 1,791.6 160.2 295.1 169.0 3,623.0 3. Qu. 0.0 569.8 183.1 1,190.0 183.3 245.7 204.0 2,640.0 4. Qu. 0.0 398.0 49.8 382.5 144.5 256.8 140.5 1,371.3 5 . Qu. 0.0 166.9 4.6 77.2 172.9 123.8 42.0 594.1 Total annual transfer rural / urban. (in millions): rural 0.0 1,426.9 649.2 3,878.9 227.0 567.9 344.8 7,122.3 urban 0.0 1,697.0 172.5 2,237.5 530.7 636.1 283.2 5,577.5 Total annual transfer by race (in millions): "african" 0.0 2,109.5 770.2 5,453.9 430.9 809.4 492.0 10,234.2 "coloured" 0.0 649.8 50.6 550.2 116.9 144.9 33.4 1,557.9 "indian" 0.0 181.9 5.0 87.8 41.8 101.7 0.0 406.7 "white" 0.0 196.7 0.0 35.3 169.3 152.3 88.8 634.2 Table 5-10: Social assistance and poverty – the old system
Corresponding to the division of the total population, the majority (62.8%) of those below the poverty line, are living in a ‘children with working age adults’ household. If one compares the three generation household, the poor are more likely to live in such a household. (29.5% compared to 21%). The oppo-site is true for ‘only working age adults’ households. While in the bottom two quintiles only 3.8% of working age adults are living on their own, the households make up over 10% of the total population. The increase of the average number of people living in the households under the poverty line in com-parison to the total average118 indicates that poorer households tend to be bigger. This is true for all households besides those where pensioners live on their own.
The analysis of the old social assistance transfers shows a clear bias towards those households with adults of pension age. The most dramatic impact of social assistance occurred in households where pensioners live on their own. Here only 12.1% of the people live in households that received no social assistance, for those receiving it, the poverty gap was closed by over 80% and they had a per capita transfer of R348. One can further compare the impact on pensioner households with either children or working age adults. In both cases, the poverty gap was closed by about 2/3, however, the per capita transfer was only R122 and R140 respectively. This constitutes already quite a substantial drop in transfers per person and shows how far the pensions are stretched in these households. While still the income from pensions is crucial in alleviating more severe poverty and helps these households to get closer to the subsistence line, the limitations of the SOAPs become apparent. The three generation households make these circumstances even clearer: Only 14.9% of the people lived in households where no social assistance was received. But as shown earlier119 people living in this household type have to share the household income on average with about 7 other people. This has a dramatic effect on the inability of the pensions to close the poverty gap for these households effectively. The poverty gap was only closed by 41.5% and the per capita transfer dropped to R58. The households without
118 See section ‘5.2.2.) An analysis of the household structure’ 119 See ‘5.2.3.) An analysis of household structure and poverty’
Poverty, household structure and the current social assistance programmes 114
pensioners were left without any support. Between 80% and 100% of working age adults and children living in those households received no social assistance transfers at all. For the rest, the poverty gap could only be closed by about 10% and the per capita transfers lay between R12 and R24.
The imbalance also finds its expression in the annual transfers to the different groups. While the ‘chil-dren with working age adults’ households make up 2/3 of the population, they only receive 1/4 of the total transfers. On the other hand, the pensioners living on their own or with working age adults re-ceived approximately 16% of the transfers while only 3% of the population live under these circum-stances. Thanks to the pensioners in the three generation households, the situation there looks much better, as half of the transfers go to just over 21% of the population.
5.3.1.2.) The current system Parallel to the above section on household structure, poverty and social assistance of the old system, the following table explores these relationships on the stipulation that all intended beneficiaries of the current programmes are reached.
only child.
child. + work. age
adults
child. + adults in pen. age
child. + work. age adults + adults in pen. age
only work. age adults
work. age adults + adults in pen. age
only adults in pen. age Total
SOCIAL ASSISTANCE - POVERTY Total No. of people living in the bottom two quintiles: 32,280 13,548,616 402,237 6,366,098 808,943 345,796 55,553 21,559,522 % of people living in the bottom two quintiles: 0.1% 62.8% 1.9% 29.5% 3.8% 1.6% 0.3% 100.0% Total No. of people living in HH receiving no social assistance (bottom two quintiles): 10,396 3,687,282 1,774 11,999 768,476 0 0 4,479,927 % of people living in HH receiving no social assistance (bottom two quintiles): 32.2% 27.2% 0.4% 0.2% 95.0% 0.0% 0.0% 20.8% Average No. of people living in the HH (bottom two quintiles): 4.2 7.4 4.7 9.3 2.7 3.7 1.4 7.6 Average No. of people employed in the HH (bottom two quintiles): 0.0 1.0 0.0 0.8 1.0 0.6 0.0 0.9 Average No. of people receiving social assistance (bottom two quintiles): 1.1 1.5 2.3 3.0 0.1 1.3 1.4 1.9 Average % closed of the poverty gap by social assistance (bottom two quintiles): 26.0% 23.0% 81.3% 60.5% 4.1% 77.0% 100.0% 36.8% Average per capita social assistance transfer (bottom two quintiles): R 24 R 23 R 154 R 85 R 11 R 161 R 428 R 46 Average per capita social assistance transfer through old SoSe payments (bottom two quintiles): R 0 R 0 R 0 R 0 R 0 R 0 R 0 R 0 Average per capita social assistance transfer through SOAP (bottom two quintiles): R 0 R 0 R 135 R 63 R 0 R 157 R 428 R 25 Average per capita social assistance transfer through CSG (bottom two quintiles):
Poverty, household structure and the current social assistance programmes 115
R 23 R 20 R 18 R 18 R 0 R 0 R 0 R 18 Average per capita social assistance transfer through DG (bottom two quintiles): R 0 R 2 R 1 R 4 R 8 R 3 R 0 R 3 Average per capita social assistance transfer through BIG (bottom two quintiles): R 0 R 0 R 0 R 0 R 0 R 0 R 0 R 0 Average per capita social assistance transfer through UB (bottom two quintiles): R 0 R 0 R 0 R 0 R 0 R 0 R 0 R 0 SOCIAL ASSISTANCE - ECONOMY Total number of people reached by social assistance programmes: old system 0 0 0 0 0 0 0 0 SOAP 0 0 176,368 1,334,491 0 295,052 239,593 2,045,503 CSG 11,036 3,652,533 94,157 1,411,011 0 0 0 5,168,737 DG 0 109,083 737 76,248 30,131 3,813 0 220,011 BIG 0 0 0 0 0 0 0 0 UB 0 0 0 0 0 0 0 0 HH 0 0 0 0 0 0 0 0 Total 11,036 3,761,615 271,262 2,821,750 30,131 298,865 239,593 7,434,252 Total annual transfers by social assistance programmes (in millions): old system R 0 R 0 R 0 R 0 R 0 R 0 R 0 R 0 SOAP R 0 R 0 R 893 R 6,690 R 0 R 1,440 R 1,072 R 10,096 CSG R 13 R 4,383 R 113 R 1,693 R 0 R 0 R 0 R 6,202 DG R 0 R 532 R 4 R 392 R 145 R 20 R 0 R 1,092 BIG R 0 R 0 R 0 R 0 R 0 R 0 R 0 R 0 UB R 0 R 0 R 0 R 0 R 0 R 0 R 0 R 0 HH R 0 R 0 R 0 R 0 R 0 R 0 R 0 R 0 Total R 13 R 4,915 R 1,010 R 8,775 R 145 R 1,460 R 1,072 R 17,390 Total annual transfer to quintiles (in millions): 1. Qu. 2.2 2,071.4 402.0 3,896.3 36.1 326.4 95.3 6,845.9 2. Qu. 6.6 1,511.3 341.7 2,622.8 46.1 341.5 190.0 5,099.9 3. Qu. 3.3 916.1 205.4 1,630.0 30.7 283.8 231.7 3,392.2 4. Qu. 1.2 364.3 52.4 512.2 23.0 274.0 238.2 1,474.7 5 . Qu. 0.0 113.9 4.8 150.3 17.0 233.6 323.7 837.6 Total annual transfer rural / urban. (in millions): rural 13.5 3,363.8 802.4 5,909.3 79.3 667.8 430.6 11,319.3 urban 0.0 1,555.5 202.5 2,863.3 72.5 787.8 655.4 6,166.4 Total annual transfer by race (in millions): "african" 13.4 4,556.2 950.1 8,063.3 111.7 944.7 573.4 15,496.2 "coloured" 0.0 339.3 51.1 548.9 29.6 157.7 35.0 1,173.1 "indian" 0.0 34.1 4.6 83.4 0.0 100.1 4.6 216.1 "white" 0.0 105.6 2.5 113.4 17.0 256.6 464.7 934.5 Table 5-11: Social assistance and poverty – Potential of the current system
Comparing the situation under the old system120 with the potential of the current system, several points are striking. First of all, due to the assumption that all potential beneficiaries are reached the coverage increases across the different household compositions, except for those households where working age adults live on their own. The slight drop in coverage for these households is due to the fact that under the old system, people received some money due to smaller poverty relief programmes etc. which as mentioned earlier are not modelled in the current system.
Overall, the percentage of people living in households in which nobody receives social assistance de-creases from over 60% to 20.8%. The most dramatic decrease occurs in the households with children.
120 See Table 5-10 and Table 5-11
Poverty, household structure and the current social assistance programmes 116
The ‘only children’ households are down from 100% to 32.2% and the ‘children with working age adults’ from over 50% to 27.2%. The introduction of the CSG is responsible for this.121 These figures at first paint a positive picture. However, one has to look at the quality of the support by comparing the poverty gap statistics and the per capita transfers. One then realizes that the support given to the households is minimal and the increase in terms of a reduction of the poverty gap and hence real im-provement in living conditions is rather slim. The per capita transfer to ‘only children’ households is up from R0 to R23, which reduces the poverty gap by only 26% for these households. For those chil-dren living in households together with working age adults, the per capita transfer only increases from R12 to R22. The three generation households can achieve a 60.5% closing of the poverty gap and in monetary terms they receive R85 per person in comparison to R58 under the old system. One can con-clude that the situation for children living with their parents improves, but still if they were only to live with their grandparents they would be better off. This situation creates an incentive for parents to send their children to live with the grandparents rather than with them. The numbers for the entire bottom two quintiles confirm the trend that while more households could potentially be reached, the quality of the support is very poor: Overall, the poverty gap is only closed by 36.8% as compared to 21.6% un-der the old system and on average people instead of receiving R31 could now receive R46.
The figures do, however, indicate that the SOAPs are well targeted. In theory, virtually all households with pensioners in the bottom two quintiles receive social assistance and the poverty gap is closed by between 60.5% in the three generation household up to a 100% in households where only adults in pension age live.
It is important to note that for those children living together with pensioners in a household, the pov-erty situation improves substantially. However, only 1.9% of the children below the poverty line live in ‘children with pensioner’ households and 29.5% in three generation households. By far the majority of children in poverty live only together with working age adults and thereby are not reached by the SOAPs. It becomes clear that while often pension money benefits poor children, pensions are not good at targeting them.
The analysis of the annual transfer reveals that the current programmes are not able to change the im-balances pointed out above. The 64% of the population who live in ‘children with working age adults’ households receive under 30% of the total transfers and only 20% goes to the bottom two quintiles. The three generation households, while making up 21% of the population, receive about 50% of the transfers. The other households with pensioners, in which the remaining 4.4% of the population live, get 20% of the transfers. However, the annual transfers continue to favour poorer areas as over 60% of the annual budget is allocated to rural areas where, as the poverty analysis has shown, the poor live. The ‘racial’ breakdown substantiates the general trend that the transfers are relatively well targeted towards the poorer section of the population, as over 80% of the transfers go to ‘africans’ which again are more likely to be below the poverty line than the other groups.
The next figures look more graphically at the potential coverage which the current system provides over the life cycle: childhood, adulthood and retirement.
Note the graph indicates how many (as a percentage) in each age group according to quintiles are eli-gible for social assistance. On top of the graph, the percentage of the potential total budget share (so-cial assistance) which goes to the different age groups is indicated.
121 This is due to the assumption in the model that all entitled recipients would also receive the grant. However, after 3
years of introduction only a small fraction is reached in reality.
Poverty, household structure and the current social assistance programmes 117
a g e 0 - 1 7 a g e 6 0 f . / 6 5 m . -a g e 1 8 - 5 9 f . / 6 4 m .
P o t e n t i a l c o v e r a g e a c c o r d i n g t o q u i n t i l e s
P o t e n t ia l b u d g e t s h a r e P o t e n t ia l b u d g e t s h a r e P o t e n t ia l b u d g e t s h a r e
3 6 . 7 % 5 . 2 % 5 8 . 1 %
P e r c e n t a g e o f p o p u la t io n P e r c e n t a g e o f p o p u la t io n P e r c e n t a g e o f p o p u la t io n
4 4 . 5 % 4 9 . 9 % 5 . 6 %
Figure 5-9: Potential coverage through existing programmes according to age and quintiles
Poverty, household structure and the current social assistance programmes 118
Once again it becomes clear that the present system is strongly biased towards social security provi-sion for the elderly. Here the coverage is relatively good while for the other age groupings little or no support is available.
Among the children it is striking that if the new child grant is fully operational as intended, not even 40% of all children in the poorest, and just about 1/3 in the second quintile, will have access to it. Fur-thermore, one has to keep in mind that support is provided only for children up to their 7th birthday, and that for those between 7 and 17 years of age no other provisions come into place. If one was to draw the same graph only for the age group 7 years to 17 years, it would look similar to the one of the adults in working age with the disability grant being the only social assistance programme applicable to this age group. On top of that it is a fact that in reality the CSG has up to June 1999 only reached a fraction (between 200,000 and 300,000) of the intended 3 million beneficiaries and the calculations furthermore indicate that in fact over 5 million children would qualify for the grant.122 If these 5 mil-lion children are supported, the programme takes up 36.7% of the budget for social assistance. The figures hence assume a far more positive scenario.
For the working age adults, it becomes clear that nearly no social assistance is provided. Together with the children over 7 years this is where the main gap in terms of coverage lies. Especially the group of the long term unemployed is vulnerable, as they do not receive any social assistance. The potential budget share of this group accounts for only 5.2%.
Looking at the elderly, it can be shown that the SOAPs are very effective. Nearly 100% of the elderly in the first three quintiles qualify for the grant and in fact only a minority is excluded by the means-test. The FFC (2000:54), in its recent publication on the division of revenue, states that the means-test for the SOAPs appears not to be applied correctly and that people do receive the maximum amount while only qualifying for a reduced amount. On this basis the FFC recommends a more rigorous appli-cation of the means-test. The FFC indicates to use the Census data for their research. However, on the basis of the Census data, it is not possible to link the income of the spouse to e.g. a recipient of a SOAP. This is essential for the correct application of the means-test as set out in the regulations. If one uses the SALDRU data for the same test, then, contrary to the FFC’s claim, one can show that 85% - 90% of the recipients of SOAPs qualify for the maximum amount of the grant. This altogether rather questions the costly administration of a means-test than calling for a stricter application. It is therefore an important consideration whether a means-test is really cost-efficient in the case of the old-age pen-sions or whether self-targeting would not set free more resources currently spent on administration.
While the calculations above (except for the budget share projections) have solely looked at the poten-tial coverage (width), Figure 5-10 attempts to clarify the depth of the coverage, namely how much the present system could potentially transfer per person per month to the different households. It should be noted that the intervals reflected e.g. R0 - R25 per month per person at the bottom end are smaller than the ones at the top e.g. R250 - R470. At first sight this may seem to distort the picture, as one is in-clined to believe that e.g. people represented in the second or third bar 'do already get something', but in fact the per capita transfer is minimal. This method was, however, chosen in order to allow for a greater differentiation between the people on the bottom side.
122 See Figure 5-11
Poverty, household structure and the current social assistance programmes 119
15%
24%26%23%
12%
0%
28%23%21%
18%
11%
1%
45%
19%13%13%
9%
1%
69%
12%6%6% 6%
1%
88%
3%3%2%3% 1%
0%
10%
20%
30%
40%
50%
60%
70%
80%
90%
100%
R25
0 -R0
R25
-50
R50
-100
R10
0 -25
0
R0 -
25
1 . Q u in tile 2. Q u in tile 3. Q u in tile 4. Q u in tile 5. Q u in tile
R25
0 -R0
R25
-50
R50
-100
R10
0 -25
0
R0 -
25
R25
0 -R0
R25
-50
R50
-100
R10
0 -25
0
R0 -
25
R25
0 -R0
R25
-50
R50
-100
R10
0 -25
0
R0 -
25
R25
0 -R0
R25
-50
R50
-100
R10
0 -25
0
R0 -
25
Figure 5-10: Potential per capita social security transfers to households
Nearly 40% of the people in the first and 50% in the second quintile live in households where the po-tential per capita transfer is below R25 per person per month, and over 1/3 of the people in each of these quintiles receive less than R50. Only 12.2% in the first and 11.5% in the second quintile have a transfer exceeding R100 per month per person. 45% of the people just above the poverty line have no access to support, while another 45% receive between R0 to R100 per month. This analysis suggests that while on the one hand poor households are being reached, the support given is minimal.
The next graph supports this analysis by pointing out what these transfers translate into in terms of closing of the poverty gap. The figure is again divided into quintiles. Each quintile comprises informa-tion in six bars. The first bar gives the percentage of the potential budget share of the social assistance budget for the respective quintile. The next four bars indicate the percentage of people whose poverty gap is reduced by 0%, 1%-49%, 50%-99%, and 100% or more. The sixth bar indicates the percentage of people in the respective quintile who do not fall below the poverty line.
Poverty, household structure and the current social assistance programmes 120
3 9 %
2 9 %
1 9 %
8 %5 %
1 3 %1 6 %
1 2 %
7 % 7 %
5 7 %
3 4 %
1 8 %
7 %2 %
2 0 %1 6 %
7 %
2 % 1 %4 %
1 0 % 9 %
3 % 2 %6 %
2 4 %
5 3 %
8 1 %
8 8 %
0 %
1 0 %
2 0 %
3 0 %
4 0 %
5 0 %
6 0 %
7 0 %
8 0 %
9 0 %
1 0 0 %
Pot
entia
l bud
get s
hare
Per
cent
ages
of
peo
ple
who
se
pove
rty
gap
is p
oten
tiall
y re
duce
d by
:
50%
to 9
9%
100%
-
0% to
49%
0%
B ottom quintile
not b
elow
sub
s. le
vel
Pot
entia
l bud
get s
hare
Per
cent
ages
of
peo
ple
who
se
pove
rty
gap
is p
oten
tiall
y re
duce
d by
:
50%
to 9
9%
100%
-
0% to
49%
0%
2 . quintile
not b
elow
sub
s. le
vel
Pot
entia
l bud
get s
hare
Per
cent
ages
of
peo
ple
who
se
pove
rty
gap
is p
oten
tiall
y re
duce
d by
:
50%
to 9
9%
100%
-
0% to
49%
0%3 . quintile
not b
elow
sub
s. le
vel
Pot
entia
l bud
get s
hare
Per
cent
ages
of
peo
ple
who
se
pove
rty
gap
is p
oten
tiall
y re
duce
d by
:
50%
to 9
9%
100%
-
0% to
49%
0%
4 . quintile
not b
elow
sub
s. le
vel
Pot
entia
l bud
get s
hare
Per
cent
ages
of
peo
ple
who
se
pove
rty
gap
is p
oten
tiall
y re
duce
d by
:
50%
to 9
9%
100%
-
0% to
49%
0%
T op quintile
not b
elow
sub
s. le
vel
Figure 5-11: Potential reduction of poverty gap in percentage according to quintiles, budget share spent in quintiles and percentage of people who do not live under poverty line
Poverty, household structure and the current social assistance programmes 121
Figure 5-11 shows that for nearly 70% of the people in the bottom quintile and for the majority in the second quintile social assistance at best only reduces their poverty gap by 49% or less. It is striking that only in 4.5% of the cases in the bottom quintile, social assistance reaches an extent to fully close the poverty gap. Even in the second and third quintile, it is only able to close the gap for 10.1% and 9.2% of the people respectively. It can therefore be concluded that present levels of social assistance are far from being sufficient to guarantee a minimum living.
To also get a national picture of the poverty and income situation, the next graph displays the income distribution in South Africa. The y-axis indicates the number of people earning a certain amount per capita per month. The income is indicated on the x-axis which is always increased by 10% of the last amount.123 At R305 per person per month, the subsistence level has been drawn to demonstrate that the people on the left of the line are below the subsistence level and those on the right above the sub-sistence level. As explained earlier124 for the poverty calculations based on income data, the house-holds where the SALDRU data has no total monthly income recorded are excluded.
0
500,000
1,000,000
1,500,000
2,000,000
2,500,000
per a
dult
eq.
R 1
2
R 1
7
R 2
5
R 3
6
R 5
3
R 7
8
R 1
14
R 1
67
R 2
44
R 3
57
R 5
23
R 7
65
R 1
,121
R 1
,641
R 2
,402
R 3
,517
R 5
,149
R 7
,538
R 1
1,03
7
R 1
7,77
5
R 2
6,02
5
R 5
0,71
5
Figure 5-12: Total monthly income distribution per adult equivalent - potential of the current social assis-tance system (dotted line = without any social assistance programme)
Figure 5-12 gives the distribution if the current system worked to its full potential. The dotted line in Figure 5-12 shows the distribution of monthly adult equivalent incomes without any social transfers. It becomes evident that social assistance has a dramatic effect on poverty, moving people with nearly no other income sources closer to the subsistence level. While especially the very poor are pushed closer to the subsistence level, mainly through the relatively effective SOAPs, the potential of the current system is still very limited in pushing people over the subsistence level. Many people still lack ade-quate resources to fulfil their basic needs.
123 This means that the income does not increase linearly. If it was linear this would show as a line from the left top to
the right bottom and as scattered dots in the right end of the graph. Therefore the income on the x-axis is displayed in 10% steps. While it might be said that the graph is biased towards changes for the poor, it is argued here that this method is actually a good way of displaying reality. A change of income for a family living on R100 per adult equivalent per month up to R110 or a reduction to R90 might have a considerable effect. For a family living on R10,000 per adult equivalent per month the monetary change to R10,010 or 9990 is negligible small. However, pro-portionally a 10% increase or decrease to R11,000 or R9,000 might be more comparable. Further, the monetary val-ues are still accessible from the graph, which with other statistical methods of displaying this graph would be lost.
124 See page 91
Poverty, household structure and the current social assistance programmes 122
The graph further shows that the effect of social assistance is mainly felt by the poor. From just above the poverty line the figure hardly changes, showing that proportionally social assistance does not play an important role in these households.125
5.3.2.) HIV/AIDS, poverty and social assistance programmes This part gives a comparison of the potential of the current system taking account of the influence of HIV/AIDS on the population. The AIDS model has been run for the year 2011. Here the difference between the poverty situation and current system in 1996 and the poverty situation with the impact of HIV/AIDS in 2011 can be pointed out.
The section on social assistance focuses on the people below the subsistence level. As explained ear-lier the effect of HIV/AIDS can only be modelled on the income data and the poverty data has there-fore to work with the subsistence level instead of working with a poverty line determined by quin-tiles.126 The table is structured in the same way as the one on poverty and social assistance. What is of importance here is the question of how far the situation of people below the subsistence level changes with the impact of HIV/AIDS.
The section on social assistance displays the following information:127
• Number of people living below the subsistence level.
• Percentage of people living below the subsistence level versus total population in that household type.
• Percentage of people below the subsistence level in the different household types.
• Number/percentage of people living in the household who receive no social assistance transfers.
• Average number of people living in the household.
• Average number of people employed in the household.
• Average number of people receiving social assistance.
• Average percentage of the poverty gap closed by social assistance transfers.
• Average per capita total social assistance transfer as well as a division into the differ-ent programmes.
125 See also 123 page 121 126 See ‘5.1.1.) A comparison of consumption and income measures and a deprivation index’ 127 If not otherwise indicated, all the information is given for people below the subsistence level.
Poverty, household structure and the current social assistance programmes 123
only child.
child. + work. age
adults
child. + adults in pen. age
child. + work. age adults + adults in pen. age
only work. age adults
work. age adults + adults in pen. age
only adults in pen. age Total
SOCIAL ASSISTANCE - HIV/AIDS Total No. of people living below subsistence level: 46,427 14,710,123 499,775 7,023,861 1,040,253 488,391 162,865 23,971,696 % of people living below subsistence level vs. total: 87.6% 56.6% 91.6% 82.2% 24.9% 54.1% 44.9% 59.1% % of people living in the HH types (below subsistence level ): 0.2% 61.4% 2.1% 29.3% 4.3% 2.0% 0.7% 100.0% Total No. of people living in HH receiving no social assistance (below subsistence level): 15,157 3,770,149 0 11,999 997,042 0 0 4,794,347 % of people living in HH receiving no social assistance (below subsistence level): 32.6% 25.6% 0.0% 0.2% 95.8% 0.0% 0.0% 20.0% Average No. of people living in the HH (below subsistence level): 3.7 7.0 4.5 9.2 2.4 3.4 1.5 7.3 Average No. of people employed in the HH (below subsistence level): 0.0 0.8 0.0 0.7 0.8 0.6 0.0 0.8 Average No. of people receiving social assistance (below subsistence level): 1.0 1.5 2.2 3.1 0.0 1.2 1.5 1.9 Average % closed of the poverty gap by social assistance (below subsistence level): 29.7% 23.7% 83.5% 61.8% 2.7% 78.7% 100.0% 36.8% Average per capita social assistance transfer (below subsistence level): R 24 R 23 R 161 R 88 R 7 R 170 R 430 R 50 Average per capita social assistance transfer through old SoSe payments (below subsistence level): R 0 R 0 R 0 R 0 R 0 R 0 R 0 R 0 Average per capita social assistance transfer through SOAP (below subsistence level): R 0 R 0 R 144 R 65 R 0 R 167 R 430 R 29 Average per capita social assistance transfer through CSG (below subsistence level): R 24 R 20 R 17 R 18 R 0 R 0 R 0 R 18 Average per capita social assistance transfer through DG (below subsistence level): R 0 R 2 R 1 R 4 R 7 R 2 R 0 R 3 Average per capita social assistance transfer through BIG (below subsistence level): R 0 R 0 R 0 R 0 R 0 R 0 R 0 R 0 Average per capita social assistance transfer through UB (below subsistence level): R 0 R 0 R 0 R 0 R 0 R 0 R 0 R 0 Table 5-12: Potential current system 1996 without HIV/AIDS
Poverty, household structure and the current social assistance programmes 124
only child.
child. + work. age
adults
child. + adults in pen. age
child. + work. age adults + adults in pen. age
only work. age adults
work. age adults + adults in pen. age
only adults in pen. age Total
SOCIAL ASSISTANCE - HIV/AIDS Total No. of people living below subsistence level: 898,187 18,392,742 860,256 8,588,014 1,425,478 634,142 211,976 31,010,795 % of people living below subsistence level vs. total: 87.1% 64.0% 92.1% 85.1% 31.5% 61.5% 48.0% 66.3% % of people living in the HH types (below subsistence level ): 2.9% 59.3% 2.8% 27.7% 4.6% 2.0% 0.7% 100.0% Total No. of people living in HH receiving no social assistance (below subsistence level): 308,321 5,206,781 0 16,112 1,375,030 0 0 6,906,243 % of people living in HH receiving no social assistance (below subsistence level): 34.3% 28.3% 0.0% 0.2% 96.5% 0.0% 0.0% 22.3% Average No. of people living in the HH (below subsistence level): 3.4 6.6 4.7 8.7 2.3 3.2 1.5 6.7 Average No. of people employed in the HH (below subsistence level): 0.0 0.7 0.0 0.6 0.6 0.4 0.0 0.6 Average No. of people receiving social assistance (below subsistence level): 1.1 1.4 2.4 2.9 0.0 1.2 1.5 1.8 Average % closed of the poverty gap by social assistance (below subsistence level): 23.5% 21.7% 82.4% 61.4% 2.3% 77.9% 100.0% 35.2% Average per capita social assistance transfer (below subsistence level): R 33 R 22 R 157 R 90 R 6 R 178 R 430 R 50 Average per capita social assistance transfer through old SoSe payments (below subsistence level): R 0 R 0 R 0 R 0 R 0 R 0 R 0 R 0 Average per capita social assistance transfer through SOAP (below subsistence level): R 0 R 0 R 136 R 68 R 0 R 175 R 430 R 29 Average per capita social assistance transfer through CSG (below subsistence level): R 31 R 20 R 19 R 18 R 0 R 0 R 0 R 18 Average per capita social assistance transfer through DG (below subsistence level): R 2 R 2 R 1 R 4 R 6 R 2 R 0 R 3 Average per capita social assistance transfer through BIG (below subsistence level): R 0 R 0 R 0 R 0 R 0 R 0 R 0 R 0 Average per capita social assistance transfer through UB (below subsistence level): R 0 R 0 R 0 R 0 R 0 R 0 R 0 R 0
Poverty, household structure and the current social assistance programmes 125
SOCIAL ASSISTANCE - ECONOMY Total number of people reached by social assistance programmes: old system 0 0 0 0 0 0 0 0 SOAP 0 0 292,727 1,648,897 0 373,595 305,809 2,621,028 CSG 319,638 4,342,785 180,558 1,650,561 0 0 0 6,493,542 DG 3,590 116,071 2,446 86,003 35,591 4,908 0 248,608 BIG 0 0 0 0 0 0 0 0 UB 0 0 0 0 0 0 0 0 HH 0 0 0 0 0 0 0 0 Total 323,228 4,458,856 475,731 3,385,461 35,591 378,504 305,809 9,363,179 Total annual transfers by social assistance programmes (in millions): old system R 0 R 0 R 0 R 0 R 0 R 0 R 0 R 0 SOAP R 0 R 0 R 1,473 R 8,279 R 0 R 1,850 R 1,399 R 13,001 CSG R 384 R 5,211 R 217 R 1,981 R 0 R 0 R 0 R 7,792 DG R 19 R 576 R 13 R 441 R 175 R 25 R 0 R 1,248 BIG R 0 R 0 R 0 R 0 R 0 R 0 R 0 R 0 UB R 0 R 0 R 0 R 0 R 0 R 0 R 0 R 0 HH R 0 R 0 R 0 R 0 R 0 R 0 R 0 R 0 Total R 402 R 5,787 R 1,702 R 10,701 R 175 R 1,875 R 1,399 R 22,041 Total annual transfer to quintiles (in millions): 1. Qu. 110.6 2,391.5 637.8 4,848.0 47.5 458.8 139.6 8,649.2 2. Qu. 90.8 1,783.3 537.9 3,263.7 48.1 514.6 255.2 6,532.0 3. Qu. 89.2 1,062.9 313.0 1,950.4 44.7 362.9 316.6 4,242.5 4. Qu. 58.9 447.7 168.5 542.0 29.4 304.4 296.4 1,894.9 5 . Qu. 54.4 129.4 33.3 128.6 19.1 230.0 392.0 988.8 Total annual transfer rural / urban. (in millions): rural 241.6 3,959.8 1,238.9 7,338.2 92.6 944.8 604.6 14,469.2 urban 162.2 1,752.4 450.5 3,362.9 91.6 907.5 782.6 7,534.2 Total annual transfer by race (in millions): "african" 325.0 5,375.7 1,577.9 9,961.5 134.9 1,334.6 813.0 19,850.1 "coloured" 28.3 357.9 73.1 598.3 38.4 184.0 53.8 1,352.0 "indian" 2.5 36.7 10.5 85.3 0.0 104.6 22.7 248.6 "white" 50.4 128.9 27.6 89.7 17.8 251.3 520.3 1,054.8
Table 5-13: Potential current system 2011 with HIV/AIDS
The table reveals an increase of people who live below the subsistence level from 59% of the popula-tion to 66%. Two trends can be identified: First, there is a dramatic increase in the number of children living on their own and under the subsistence level from about 46,000 to nearly 900,000. These chil-dren live in households, where all adults died. While only 0.2% of the people below the subsistence level lived in this household type without the effect of HIV/AIDS, taking account of the epidemic, this number increases, so that nearly 3% of the total population are faced with this situation. It is question-able whether other households will be able to integrate these children if no financial support will be provided from the state to assist with at least the basic subsistence needs of these children. This is ag-gravated by the second trend unfolding: Across the different household types, the number of people living below the subsistence level increases, but those households with working age adults are most affected. Here the expected decrease in earnings and income occurs. Except for those households with pensioners, around 7% more people live in households below the subsistence level. Without the effect of HIV/AIDS these households were able to live above the subsistence level. Note further that the percentage of people who live below the subsistence level and do not receive social assistance rises from 20% to 22.3%. The average number of people in the household drops from 7.3 to 6.7 persons, this is coupled with a drop in the number of people employed in the household: from 0.8 people to 0.6 people, meaning 25% less people employed amongst those below the subsistence level. It is question-able whether other people of the household are then more likely to find employment. As mentioned earlier128 other people in the household will be needed to take care of the sick if no institutional care
128 See page 110
Poverty, household structure and the current social assistance programmes 126
can be afforded. They even might have to give up employment to do so. Some households will also be faced with a severe decrease in agricultural earnings as less people will be able to farm. Furthermore, the households will be burdened with additional medical expenses through medicine, transportation costs and consultation fees. These second round effects are not reflected in the model and hence the situation might in fact be worse than indicated through the figures above.
What is most critical when taking account of HIV/AIDS is the coverage of children and working age adults. They are the most affected by the diseases. The current system is only able to provide R33 for the ‘only children’ household below the subsistence level, R6 for the ‘only working age adults’ house-holds and R22 for the ‘children with working age adults’ households. For both, children and working age adults, the situation is only better if pensioners belong to the household. In all of those households there is some coverage, so that virtually no household below the subsistence level is potentially with-out at least some support. The quality of the support remains negligible small, though. ‘Children with pensioners’ households have R154 at their disposal, in the three generation households the transfer amounts to R90 and in the ‘working age adults with pensioners’ to R178. Given the fact that these households already live under the subsistence level and by far the majority of them is in one way or the other affected by HIV/AIDS through medical costs and caring time, the difference this money can make even in these households is questionable.
The seriousness of this situation becomes even more apparent if one looks at the change in the overall income distribution and the poverty situation:
0
500,000
1,000,000
1,500,000
2,000,000
2,500,000
per a
dult
eq.
R 1
2
R 1
7
R 2
5
R 3
6
R 5
3
R 7
8
R 1
14
R 1
67
R 2
44
R 3
57
R 5
23
R 7
65
R 1
,121
R 1
,641
R 2
,402
R 3
,517
R 5
,149
R 7
,538
R 1
1,03
7
R 1
7,77
5
R 2
6,02
5
R 5
0,71
5
Figure 5-13: Total monthly income distribution per adult equivalent - potential of the current social assis-tance system and the impact of HIV/AIDS in 2011 (dotted line = potential of the current social assistance system without HIV/AIDS)
In comparison to Figure 5-12 (see page 121), which displays the current situation without the effect of HIV/AIDS, a severe increase of the number of people without any income can be observed. Further-more, even of the people with an income more have fallen below the poverty line. It is obvious that the current system is ill equipped to deal with the social consequences of the epidemic.
The previous section was based on the assumption that the current system does not provide for persons with HIV/AIDS. Given the current legislation a scenario could be, however, that people with HIV/AIDS are eligible for a Disability Grant. They might claim the grant first because they are dis-criminated against on the labour market and cannot find a job because of their disease and later be-cause they need fulltime care. The following table investigates the scenario if persons with HIV/AIDS were to receive a Disability Grant. It is important to note that this would have dramatic administrative
Poverty, household structure and the current social assistance programmes 127
effects as relatively often new people would come onto the system and people who died had to be taken off again.
only child.
child. + work. age
adults
child. + adults in pen. age
child. + work. age adults + adults in pen. age
only work. age adults
work. age adults + adults in pen. age
only adults in pen. age Total
SOCIAL ASSISTANCE - HIV/AIDS Total No. of people living below subsistence level: 898,187 18,392,742 860,256 8,588,014 1,425,478 634,142 211,976 31,010,795 % of people living below subsistence level vs. total: 87.1% 64.0% 92.1% 85.1% 31.5% 61.5% 48.0% 66.3% % of people living in the HH types (below subsistence level): 2.9% 59.3% 2.8% 27.7% 4.6% 2.0% 0.7% 100.0% Total No. of people living in HH receiving no social assistance (below subsistence level): 0 0 0 0 0 0 0 0 % of people living in HH receiving no social assistance (below subsistence level): 0.0% 0.0% 0.0% 0.0% 0.0% 0.0% 0.0% 0.0% Average No. of people living in the HH (below subsistence level): 3.4 6.6 4.7 8.7 2.3 3.2 1.5 6.7 Average No. of people employed in the HH (below subsistence level): 0.0 0.7 0.0 0.6 0.6 0.4 0.0 0.6 Average No. of people receiving social assistance (below subsistence level): 1.1 2.0 2.4 3.7 0.6 1.8 1.5 2.4 Average % closed of the poverty gap by social assistance (below subsistence level): 31.4% 47.1% 84.3% 76.8% 41.3% 87.9% 100.0% 56.8% Average per capita social assistance transfer (below subsistence level): R 54 R 67 R 164 R 128 R 135 R 249 R 430 R 96 Average per capita social assistance transfer through old SoSe payments (below subsistence level): R 0 R 0 R 0 R 0 R 0 R 0 R 0 R 0 Average per capita social assistance transfer through SOAP (below subsistence level): R 0 R 0 R 136 R 68 R 0 R 175 R 430 R 29 Average per capita social assistance transfer through CSG (below subsistence level): R 28 R 19 R 19 R 17 R 0 R 0 R 0 R 18 Average per capita social assistance transfer through DG (below subsistence level): R 24 R 47 R 9 R 43 R 132 R 74 R 0 R 48 Average per capita social assistance transfer through BIG (below subsistence level): R 0 R 0 R 0 R 0 R 0 R 0 R 0 R 0 Average per capita social assistance transfer through UB (below subsistence level): R 0 R 0 R 0 R 0 R 0 R 0 R 0 R 0
Poverty, household structure and the current social assistance programmes 128
SOCIAL ASSISTANCE - ECONOMY Total number of people reached by social assistance programmes: old system 0 0 0 0 0 0 0 0 SOAP 0 0 292,727 1,648,897 0 373,595 305,809 2,621,028 CSG 281,658 4,205,469 180,558 1,606,333 0 0 0 6,274,017 DG 60,482 2,917,641 17,297 990,948 924,546 152,058 0 5,062,973 BIG 0 0 0 0 0 0 0 0 UB 0 0 0 0 0 0 0 0 HH 0 0 0 0 0 0 0 0 Total 342,140 7,123,110 490,581 4,246,178 924,546 525,653 305,809 13,958,018 Total annual transfers by social assistance programmes (in millions): old system R 0 R 0 R 0 R 0 R 0 R 0 R 0 R 0 SOAP R 0 R 0 R 1,473 R 8,279 R 0 R 1,850 R 1,399 R 13,001 CSG R 338 R 5,047 R 217 R 1,928 R 0 R 0 R 0 R 7,529 DG R 312 R 13,388 R 89 R 4,816 R 3,906 R 729 R 0 R 23,239 BIG R 0 R 0 R 0 R 0 R 0 R 0 R 0 R 0 UB R 0 R 0 R 0 R 0 R 0 R 0 R 0 R 0 HH R 0 R 0 R 0 R 0 R 0 R 0 R 0 R 0 Total R 650 R 18,435 R 1,779 R 15,022 R 3,906 R 2,578 R 1,399 R 43,769 Total annual transfer to quintiles (in millions): 1. Qu. 140.2 6,355.6 675.3 6,682.4 501.6 642.9 139.6 15,136.9 2. Qu. 136.6 5,254.4 557.4 4,833.7 717.7 732.6 255.2 12,503.3 3. Qu. 160.7 3,715.1 332.0 2,711.4 975.3 531.4 316.6 8,806.8 4. Qu. 106.5 2,001.3 168.5 661.9 1,013.4 383.0 296.4 4,640.8 5 . Qu. 106.9 954.9 33.3 167.6 657.2 266.9 392.0 2,579.0 Total annual transfer rural / urban. (in millions): rural 359.2 10,611.7 1,307.9 10,242.0 1,393.9 1,330.6 604.6 25,872.9 urban 292.9 7,542.8 456.9 4,784.1 2,402.6 1,196.5 782.6 17,472.4 Total annual transfer by race (in millions): "african" 505.9 15,683.7 1,654.9 14,008.3 3,043.2 1,919.4 813.0 37,797.6 "coloured" 66.6 1,470.2 73.1 839.3 239.0 223.5 53.8 2,984.8 "indian" 2.5 308.0 10.5 110.9 77.4 117.3 22.7 633.6 "white" 77.1 934.5 27.6 104.8 535.8 306.3 520.3 2,479.2 Table 5-14: Potential current system 2011 with HIV/AIDS – assuming that people with HIV/AIDS receive a Disability Grant
Under this scenario, the average transfers per capita for people below the subsistence line increases to R96 in comparison to R50 under the current system. The most dramatic effect occurs for the ‘only working age adults’ household as the average per capita transfer increases from R7 to R135. The working age adults have been together with the children identified as those most affected by the dis-ease. However, the support increases not as dramatic if they live together with other people. For ‘chil-dren with working age adults’ households, the per capita transfer would only rise to R67 up from R23. The three generation households achieve an increase from R88 per capita under the current system to R128 with the Disability Grant. While such a support would help improve the situation, two concerns have to be raised here: First, people are supported while they are alive, however, the households are later left without any support when the breadwinner and/or the recipient of the grant has died. Second, the cost for such a system will rise by 150% to over R40 billion whereas it would only target those affected by the HIV/AIDS epidemic without moving towards a more comprehensive coverage of the whole population. Such a system might even have the perverse incentive for people to become HIV positive in order to claim the grant. When testing the different options for the extension of the current system in Chapter 7, the ability of them to deal with the HIV/AIDS epidemic will also be compared to this scenario.
Poverty, household structure and the current social assistance programmes 129
0
500,000
1,000,000
1,500,000
2,000,000
2,500,000
per a
dult
eq.
R 1
2
R 1
7
R 2
5
R 3
6
R 5
3
R 7
8
R 1
14
R 1
67
R 2
44
R 3
57
R 5
23
R 7
65
R 1
,121
R 1
,641
R 2
,402
R 3
,517
R 5
,149
R 7
,538
R 1
1,03
7
R 1
7,77
5
R 2
6,02
5
R 5
0,71
5
Figure 5-14: Total monthly income distribution per adult equivalent - potential of the current social assis-tance system and the impact of HIV/AIDS in 2011 - assuming that people with HIV/AIDS receive a disability grant (dotted line = potential of the current social assistance system without HIV/AIDS)
5.3.3.) Concluding remarks The potential of the current system when compared with the old system lies in a substantial increase in the coverage of households with children. This is due to the introduction of the CSG. However, sev-eral problems arise. First of all, the theoretical application of the means test identifies over 5 million eligible children, whereas the official target of the government is 3 million children over a five year period, and in practice only 300,000 children have been reached in the last three years. Furthermore, the amount received by the households is very low. 40% of those living in the first and 50% living in the second quintile receive less than R25 per person per month. The programmes are only able to close the poverty gap for the average South African below the poverty line by 36.8%. The success of the current system depends by and large on the SOAPs which are well targeted towards the poor house-holds with pensioners. Here the poverty gap can be closed by between 77% and 100%. This links up with the fact that the transfers to the different age groups are highly unequal, with the pensioners get-ting the bulk of it, while children and in particular working age adults are left behind. Watching the impact of HIV/AIDS, this trend is dangerous, as these groups are the most vulnerable and most af-fected by the epidemic. The analysis has demonstrated the severe effect on the poverty situation and shown that the current social assistance programmes are not even able to cushion this effect. A sce-nario based on the assumption that people affected by HIV/AIDS receive a Disability Grant has pointed to the fact this is not a satisfactory solution. While it would offer much needed support, it does not help the affected households in the longer term. Furthermore, it is expensive when considering that it does not move towards a more comprehensive coverage of the whole population.
Options for social assistance programmes in South Africa 130
Chapter 6: Options for social assistance programmes in South Africa The previous chapter concluded that while current social assistance programmes provide some social security for certain sectors of the South African population, the provisions are far from comprehensive and are not able to guarantee or promote a minimum standard of living for the majority of the people living below the poverty line. Furthermore, the analysis has shown that the system is not equipped to deal with the impact of the HIV/AIDS epidemic.
This chapter delineates the different options for the extension of the system that have been brought forward by various role players in the public debate and deliberates on their underlying ideas with regard to the concrete situation in South Africa. The following chapter will then apply the microsimu-lation model and will examine the various options in depth in terms of their poverty alleviation capaci-ties and also discuss the extension in a broader international context as described in Chapter 2.
6.1.) The different options arising from the public debate The discussion on the extension of the current social security system in South Africa dates back to the White Paper process (COSATU, 1996 & 1997).129 COSATU (1996:5ff) in its submission on the So-cial Welfare White Paper in November 1996 pointed to the gaps in the current system and proposed a general social assistance scheme for those not covered at the moment. It called on government for an investigation into the matter by an inter-ministerial task team. Furthermore, COSATU committed gov-ernment to the ‘provision of a comprehensive social security system’ by ensuring that this commit-ment was included in the White Paper.
COSATU took the matter further by commissioning research into a ‘comprehensive social security system for South Africa’ in 1997 and 1998 (Haarmann & Haarmann, 1998). On the basis of the re-search, COSATU proposed a Basic Income Grant at the presidential job summit in October 1998 (COSATU 1998).130 As part of the strategy to support the unemployed and the poor, COSATU put forward the introduction of a system that pays R100 per month to all South Africans. In order to bene-fit the poor and the unemployed as well as regaining some of the costs involved, the proposal entails the imposition of a ‘solidarity tax’. Firstly, those earning over R3000 per month pay back the amount received and those earning over R5000 per month pay back double the amount received, which then comes to a ‘solidarity tax’ of R1200 per year (COSATU, 1998:30-32). Although a NEDLAC task team on Social Security was set up, no report has so far been made public.
In the first years of democratic rule, the Department of Welfare, as described in Chapter 1131, was mainly concerned with the amalgamation of the different social assistance systems and with the re-structuring of the existing grants to eradicate the racial elements. Although government committed itself to the provision of a comprehensive social security system in the White Paper on Welfare, there was very little move or thought given towards the extension of the system. The first indication of gov-ernment’s consideration of the question, was the announcement in August 1999 that a report of an inter-departmental task team investigation into an integrated comprehensive social security system had
129 See also Fraser-Moleketi, 1996 130 The idea of some sort of a Basic Income Grant for South Africa was probably first put forward by an article of Jer-
emy Baskin in the Mail & Guardian in January 1997 (Baskin, 1997). However, the matter was not further discussed in public.
131 See ‘1.2.) The existing programmes ’
Options for social assistance programmes in South Africa 131
been finalised (Greybe, 1999a). Although the report has yet to be published, several newspaper articles on the basis of interviews with officials of the Department. provided some insights.132
Regarding the extension of the social assistance system the following information can be gathered from the articles: The Department acknowledges gaps in the current system as well as huge poverty and inequality problems because of structural unemployment, which in the short term cannot be solved by government’s job creation efforts (Greybe, 1999a). The task team therefore proposes the introduc-tion of some kind of Basic Income Grant. According to the articles, several options are under consideration:
• A grant of about R100 a month should be targeted at the jobless and should be com-bined with some form of job creation and training (Greybe, 1999a & Friedman, 1999).
• A household grant (Financial Mail, 20.8.1999).
The Department estimated the costs at about R6 - R7bn a year, however, it reiterated that this figure still needed further investigation and financial modelling (Greybe, 1999c & Robertson, 2000). Fur-thermore, the proposal is based on the assumption that this grant will not replace any of the existing grants but will be used to fill the gaps in the current system.
During the budget process of the 2000/2001 Budget, the issue also came up. The Democratic Party’s Budget proposals include the introduction of what they call a ‘basic subsistence grant’ of R100 per month for those South Africans earning less than R7000 per year. The possible beneficiaries should be required to register with the SA Revenue Service and hence eligibility could be determined through the tax system. The grant would be limited to R400 per family. The Party assumes 3.5 million benefi-ciaries, which would bring the costs to about R4.2 billion a year. The costs could be covered by a one percentage point increase in VAT. Although the Party admits that the benefit is low, the idea behind it is to provide some survival assistance until the economy grows by 6% (Hazelhurst, 2000).
NGOs in their responses to the Budget criticised government by saying that it failed to increase the levels of social security grants and that the R9bn cut in income tax could have been better used for the financing of a Basic Income Grant (Greybe, 2000). SANCO, SANGOCO, churches, youth and com-munity bodies formed an alliance with COSATU and made proposals for job creation as well as called on government to implement a Basic Income Grant (Gumede, 2000a).
Further discussions in the press on that matter brought up options like only targeting the ‘unemploy-able portion of the unemployed’ (Grawitzky, 2000b) or ‘paying a household grant to the poor’ (Grawitzky, 2000a). It was stressed that such a strategy for the extension of social assistance was needed because economic growth is not assumed to solve the problem of poverty and inequality. It was pointed out that even the World Bank and the IMF have, in the light of the Asian crisis, stressed the importance of a safety net especially during times of economic adjustment (Gumede, 2000b & Haffajee, 2000).
Critical comments raised concerns that more research was needed into the financial, economic and practical implications of such a grant. The grant should be integrated into a systematic poverty strategy until GEAR delivers, but should not stand on its own. One could then decide whether, for example, the money was more effective in special employment programmes (Ntenga, 1999). Furthermore, the cur-rent delivery problems in Welfare would require a total overhaul of the administrative system within the Department if such a grant was to be introduced (Grawitzky, 2000a). It was also pointed out that it is unclear where the funds are supposed to come from. The MTEF did not earmark new funds for such a grant, which leaves reprioritization of existing welfare budgets or transfers from other Departments as options (Ntenga, 1999).
The process gained further momentum by the announcement of Cabinet in March 2000 to appoint a Committee of Inquiry into the issue of a comprehensive social security system. The Committee is based at the Department of Welfare but functions as an inter-ministerial Committee including Welfare, Labour, Health, Finance and Transport. The terms of reference of the Committee are to make recom-
132 See Greybe, 1999a & 1999b & 1999c; Friedman, 1999; Le Roux, 1999, Robertson, 2000; Financial Mail, 2000;
Streek, 2000
Options for social assistance programmes in South Africa 132
mendations for the future of the social security system by on the one hand reviewing the different as-pects (like the pension system, family benefits, social insurance, unemployment insurance and health insurance) of social security in South Africa and on the other hand by taking account of immediate needs, of the current level of South Africa’s development and of affordability (Skweyiya, 2000). Part of the Committee’s work is to investigate the introduction of a Basic Income Grant by spelling out the positive and negative implications (Grawitzky, 2000a). At the first meeting, the Committee decided to conduct public hearings and to have broad consultations on national and international level (Ministry of Welfare, 2000).
A related debate on the extension of the system took place during the discussion on the Lund report and the introduction of the CSG in 1996 and 1997. Several NGOs, for example the New Women’s Movement, the Gender Advocacy Programme, and the Portfolio Committee on Welfare called for the age restriction of six years to be extended to 9, 14 or 18 years.133
6.2.) The options and their underlying concepts in the South African context As one can gather from the public debate, several options are under discussion but often the exact concepts are not clearly spelt out. Moreover, while the various ideas differ, they are not necessarily mutually exclusive but show definite overlaps, and so different ideas can be combined. The following section tries to put the different suggestions together and tries to explain their underlying concept and rationale with regard to the situation in South Africa.134 The next chapter will then test these in detail with the help of the microsimulation model and from an international perspective. The options can be summarised as follows:
1. A Basic Income Grant paid out to all citizens with the intention of clawing back some of the money through the tax system.
2. A grant for the unemployed (Unemployment benefit).
3. A household grant.
4. The extension of the CSG to older children.
6.2.1.) A Basic Income Grant This first option represents a grant which is paid out to every South African. In practise the grant would be calculated per person and paid out preferably to the primary care-giver in the household. E.g. A Basic Income Grant of R100 would mean that a single person living alone receives R100 per month. A household with 6 people (the average for the South African people)135 receives hence R600 a month which would be paid to the person primarily responsible for childcare. There seems to be a consensus that there should be no overlap between different grants. This applies to all the other options as well. The grant is meant for people currently not receiving social assistance already. A Basic Income Grant is linked to the idea of social citizenship and the grant would come as a social entitlement for all South Africans. Such an entitlement would go a long way towards realising the right to social security as entrenched in the South African constitution [27(1)(c);(2)] as well as working towards the vision of a comprehensive social security system as laid out in the White Paper for Social Welfare. The Basic Income Grant has no means-test and therefore does not create disincentives to work. Thereby, the Ba-sic Income Grant avoids poverty traps which hamper economic development. This stands in contrast to any kind of ‘dole system’ which is targeted by means of conventional methods especially at e.g. the unemployed or the very poor. Such ‘dole systems’ are often associated with all kinds of negative con-
133 See Portfolio Committee on Welfare and Population Development, 1997:9-10 134 See the sources mentioned in the last section as well as Baskin, 1997; Haarmann & Haarmann, 1998:57-59; Samson,
Babson, MacQuene, 2000: 22-27. The outline also draws on the discussion at the conference ‘Towards a sustainable and comprehensive social security system’ in Cape Town in March 2000.
135 See ‘5.2.2.) An analysis of the household structure’
Options for social assistance programmes in South Africa 133
sequences and connotations especially with the disincentive to work and the stigma attached to it that “people just live on welfare” while “others pay for it”. A universal basic income grant avoids these negative consequences.
Nevertheless, being a universal grant without a means-test, targeting of the poor and unemployed is still possible. In order to avoid the negative consequences of the conventional methods, the idea of using the tax system to recover some of the costs from those not in need developed. Further taxation in conjunction with a Basic Income Grant would achieve a higher level of redistribution. Different pro-posals were brought forward. COSATU’s proposal envisages that the amount of the grant will be re-trieved from all low to middle income earners and that a ‘solidarity tax’ will be imposed on higher income earners. Another suggestion is to increase VAT by a percentage point or to raise various dif-ferent taxes, especially those affecting the wealthier groups in South Africa (COSATU, 1998:32; Ha-zelhurst, 2000; Samson, Babson, MacQuene et al., 2000:10-11). The ‘solidarity tax’ option and the VAT proposal will be looked at in more detail in the next chapter.136
The advantages of a universal grant and the use of the tax system in comparison to a means tested grant lie in the fact that there is no danger of corruption, as the payment comes as an entitlement and is not dependent on officials who are entitled to decide who receives it. Furthermore, it potentially in-cludes everybody in the financial system and in the tax system, which could have the additional effect of broadening the tax base. However, on the negative side there is concern that currently the tax sys-tem is not well established enough to reclaim the costs from the ‘non-poor’. On the negative side it seems also problematic that there are no financial institutions in rural areas and that, given the low amount, the costs for paying out the grant will be relatively high, if no financial institutions can be brought into co-operation.
One of the advantages, which have been associated with the Basis Income Grant or a small cash trans-fer to the majority of the population is that it helps to alleviate extreme poverty and reduces inequality. It is further hoped to help make people economically active, which then also enables them to take part in community development in a meaningful way. It could contribute to the improvement of the health status and thereby increase productivity and improve the ability of children to learn and perform better at school.
Paying the grant to everybody, has particular advantages: A Basic Income Grant favours larger house-holds, which tend to be poorer, as they pool income and it thus will lead to a more equal intra house-hold distribution of income, which contributes to the empowerment of women and younger people in the family (Haarmann & Haarmann, 1998:57-58).
6.2.2.) Unemployment Benefit The second option assumes that people receive support during time of unemployment. This option follows the conventional understanding of social security by covering a life cycle contingency. A means test based on a definition of unemployment and looking into other sources of income would have to be applied.
The arguments brought forward in favour of this benefit are that only people who are faced with un-employment receive support and the support is hence better targeted. It would also be possible to pay a higher benefit due to the smaller number of recipients compared with the Basic Income Grant.
The main disadvantages are that the administration is more expensive and difficult as a separate means test has to be applied. The difficulty in the South African context is that one has to define ‘unemploy-ment’ e.g. what about the self-employed who earn below the minimum wage? How does one define ‘job-seeker’ in a legal but still practical way? Furthermore, the system would exclude certain sectors of society like the 'working poor' and children (COSATU, 1998-32).
136 See ‘7.2.2.2.) Taxing a Basic Income Grant’
Options for social assistance programmes in South Africa 134
6.2.3.) A household grant The third option means paying a grant per households instead of per person. This option would keep the costs for the system lower than a Basic Income Grant and the administration would only have to pay one person in the household.137
On the other hand, the negative implications which were mentioned are that a household grant dis-criminates against larger households, as they have to share the same amount amongst more people. This is in particular detrimental to poorer rural households as they tend to be larger. Furthermore, this could turn out as an incentive to break up households in order to receive more money for the family. There is also no encouragement for a just intra household distribution of income which could serve as a way to empower women and younger people. Another problem that arises is the definition of a household, especially in the South Africa context where household structures are fluid.
6.2.4.) The extension of the Child Support Grant The fourth option extends the current CSG to children over the age of 6 and by doing so targets fami-lies with older children as well. The rationale behind it is that especially in a developing context, sup-port for children is of the utmost importance for the future development of society - also from an eco-nomic point of view. Furthermore, the lower costs, which are expected due to a smaller target group in comparison to the other options, seem more viable from a fiscal point of view.
The next chapter will deal with these arguments by evaluating the options in terms of their impact on poverty alleviation and development in detail with the help of the microsimulation model and the in-ternational perspective.
137 The proposals for a Basic Income Grant currently under discussion (e.g. COSATU’s suggestion) also envisage a
single pay out per household preferably to the primary care-giver. However the difference would be that it was calcu-lated on a per capita basis instead of a flat household grant.
The potential impact of social assistance on poverty alleviation and economic development 135
Chapter 7: The potential impact of social assistance on poverty alleviation and economic development The first part of the chapter examines the different options one by one applying the same tools as in Chapter 5. The second part analyses and compares the different options grouped according to a choice of important social and economic factors. Further the second part includes an analysis of using the tax system as a method of clawing back some of the money for the Basic Income Grant.
7.1.) Analysing the different options Each of the analyses of the options exactly parallels the structure in Chapter 5. Firstly, the links be-tween the specific programme, the household structure, and poverty will be looked at. Secondly, the coverage according to age-groups and the potential budget share of the different groups are displayed. Thirdly, the actual per capita transfer is analysed. The fourth section provides information on the clos-ing of the poverty gap and lastly the graph showing the overall income distribution and the poverty line is presented.
7.1.1.) A Basic Income Grant COSATU’s proposal of a Basic Income Grant of R100 serves as a basis for the following calculations. The amount of R100 is not considered to be the minimum required for survival but the results are to give an overview from which one can work. To enhance this picture for further comparability in terms of costs with the other options, a monthly grant of R50 per person is calculated as well and the results are attached in the Appendix.138 The model is run under the assumption that everybody regardless of income, who does not receive another grant, qualifies for the grant. The different tax options will later be tested separately.139
Table 7-1 displays the link between the different household compositions and the potential of the Ba-sic Income Grant to reach the different compositions in the two bottom quintiles and to change their poverty situation.
only child.
child. + work. age
adults
child. + adults in pen. age
child. + work. age adults + adults in pen. age
only work. age adults
work. age adults + adults in pen. age
only adults in pen. age Total
SOCIAL ASSISTANCE - POVERTY Total No. of people living in the bottom two quintiles: 32,280 13,548,616 402,237 6,366,098 808,943 345,796 55,553 21,559,522
138 See ‘9.1.) Basic Income Grant R50’ 139 See ‘7.2.2.2.) Taxing a Basic Income Grant’. Here no additional tax is applied.
The potential impact of social assistance on poverty alleviation and economic development 136
% of people living in the bottom two quintiles: 0.1% 62.8% 1.9% 29.5% 3.8% 1.6% 0.3% 100.0% Total No. of people living in HH receiving no social assistance (bottom two quintiles): 0 0 0 0 0 0 0 0 % of people living in HH receiving no social assistance (bottom two quintiles): 0.0% 0.0% 0.0% 0.0% 0.0% 0.0% 0.0% 0.0% Average No. of people living in the HH (bottom two quintiles): 4.2 7.4 4.7 9.3 2.7 3.7 1.4 7.6 Average No. of people employed in the HH (bottom two quintiles): 0.0 1.0 0.0 0.8 1.0 0.6 0.0 0.9 Average No. of people receiving social assistance (bottom two quintiles): 4.2 7.4 4.7 9.3 2.7 3.7 1.4 7.6 Average % closed of the poverty gap by social assistance (bottom two quintiles): 80.7% 77.0% 97.5% 90.3% 64.1% 92.8% 100.0% 81.7% Average per capita social assistance transfer (bottom two quintiles): R 100 R 102 R 204 R 151 R 106 R 223 R 428 R 121 Average per capita social assistance transfer through old SoSe payments (bottom two quintiles): R 0 R 0 R 0 R 0 R 0 R 0 R 0 R 0 Average per capita social assistance transfer through SOAP (bottom two quintiles): R 0 R 0 R 135 R 63 R 0 R 157 R 428 R 25 Average per capita social assistance transfer through CSG (bottom two quintiles): R 23 R 20 R 18 R 18 R 0 R 0 R 0 R 18 Average per capita social assistance transfer through DG (bottom two quintiles): R 0 R 2 R 1 R 4 R 8 R 3 R 0 R 3 Average per capita social assistance transfer through BIG (bottom two quintiles): R 77 R 80 R 50 R 66 R 98 R 62 R 0 R 75 Average per capita social assistance transfer through UB (bottom two quintiles): R 0 R 0 R 0 R 0 R 0 R 0 R 0 R 0 SOCIAL ASSISTANCE - ECONOMY Total number of people reached by social assistance programmes: old system 0 0 0 0 0 0 0 0 SOAP 0 0 176,368 1,324,689 0 288,025 225,268 2,014,350 CSG 11,036 3,652,533 94,157 1,411,011 0 0 0 5,168,737 DG 0 107,443 737 76,248 29,037 3,813 0 217,278 BIG 41,962 22,246,647 274,616 5,730,403 4,141,976 610,337 137,323 33,183,265 UB 0 0 0 0 0 0 0 0 HH 0 0 0 0 0 0 0 0 Total 52,997 26,006,623 545,879 8,542,352 4,171,014 902,175 362,592 40,583,630 Total annual transfers by social assistance programmes (in millions): old system R 0 R 0 R 0 R 0 R 0 R 0 R 0 R 0 SOAP R 0 R 0 R 893 R 6,680 R 0 R 1,432 R 1,057 R 10,062 CSG R 13 R 4,383 R 113 R 1,693 R 0 R 0 R 0 R 6,202 DG R 0 R 530 R 4 R 392 R 144 R 20 R 0 R 1,089 BIG R 50 R 26,696 R 330 R 6,876 R 4,970 R 732 R 165 R 39,820 UB R 0 R 0 R 0 R 0 R 0 R 0 R 0 R 0 HH R 0 R 0 R 0 R 0 R 0 R 0 R 0 R 0 Total R 64 R 31,609 R 1,340 R 15,641 R 5,114 R 2,184 R 1,222 R 57,174
The potential impact of social assistance on poverty alleviation and economic development 137
Total annual transfer to quintiles (in millions): 1. Qu. 8.8 8,807.9 533.2 6,819.1 401.1 465.4 95.3 17,139.7 2. Qu. 29.9 7,718.2 452.1 4,731.7 632.4 459.4 190.0 14,241.0 3. Qu. 17.8 6,654.2 266.0 2,863.2 901.1 410.3 233.0 11,409.7 4. Qu. 7.0 4,796.3 75.2 937.9 1,431.1 428.3 254.4 7,932.5 5 . Qu. 0.0 3,624.4 9.7 300.7 1,754.5 419.3 455.2 6,558.3 Total annual transfer rural / urban. (in millions): rural 59.6 15,757.5 1,073.8 10,252.2 1,521.7 939.3 436.3 30,070.6 urban 4.0 15,849.1 261.4 5,389.6 3,597.7 1,240.9 796.2 27,154.6 Total annual transfer by race (in millions): "african" 63.6 23,962.3 1,264.4 14,223.2 3,298.8 1,340.2 576.0 44,903.7 "coloured" 0.0 3,351.1 60.6 1,024.6 349.7 225.4 36.2 5,057.4 "indian" 0.0 950.1 5.6 162.5 152.0 137.6 4.6 1,403.7 "white" 0.0 3,343.9 6.7 240.5 1,323.8 479.6 609.6 5,985.4 Table 7-1: Social assistance poverty and the economy - basic income grant (R100) + the potential current system
Due to the fact that everybody qualifies for the grant, there is nobody not receiving any social assis-tance at all. All households and all people are reached. The depth of the grant is expressed by the high percentage of the closing of the poverty gap. Besides the ‘only working age adults’ households, the poverty gap can be closed by between 77% to well over 90%.140 In the ‘only working age adults’ households a closing of close to 65% is achieved. On average the closing is over 80% as compared to 36.8% under the current system. The per capita transfer into the household lies at R100 at least, for three generation households at R151 and at over R200 per capita in the other households where pen-sioners live. The average transfer amounts to R121 per capita which is nearly three times the potential of the current system.141
The total annual transfer according to quintiles confirms that the bulk of the money would go where it is most needed and is most effective: 54.8% of the transfer goes into the bottom two quintiles and an-other 19.9% into the third quintile, hence to people just above the poverty line. The transfers are evenly split between rural (52.5%) and urban areas (47.5%) with nearly 80% reaching ‘africans’, 9% going to ‘coloureds’ 2.5% to ‘indians’ and 10.4% to ‘whites’ corresponding to the ‘racial’ stratifica-tion of the bottom two quintiles.142
The total costs for all the programmes amount to R57 billion. The Basic Income Grant alone needs R39.8 billion and benefits 33 million people. However, if one assumes self-targeting by advertising the grant as a development grant meant for the poor it is very likely that by far the majority of the rich would not take up such a grant. If one calculates that only 50% in the 4th quintile and nobody in the 5th quintile take up the grant, the total costs for the Basic Income Grant amount to R30.8 billion and 25.7 million people benefit from it. Thereby, the total costs for social assistance come to R48.2 billion. The positive features of the grant in terms of poverty alleviation stay exactly the same. The pensions come to just over R10 billion which go to 2 million people, while the CSG costs about R6 billion, benefiting over 5 million children.
The division into age groups and quintiles as well as the potential budget share indicate a dramatic change in comparison to the potential of the current system:
140 The poverty gap in the ‘only adults in pension age’ households is, due to the SOAPs, already closed by 100%. See
Table 5-12 page 123 141 See Table 5-12 page 123 142 See Table 5-12 page 123
The potential impact of social assistance on poverty alleviation and economic development 138
a g e 0 -1 7 a g e 6 0 f . / 6 5 m . -a g e 1 8 -5 9 f . / 6 4 m .
P o t e n t i a l c o v e r a g e a c c o r d in g t o q u in t i l e s
P o t e n t ia l b u d g e t s h a r e P o t e n t ia l b u d g e t s h a r e P o t e n t ia l b u d g e t s h a r e
3 8 . 1 % 4 3 . 8 % 1 8 . 1 %
P e r c e n t a g e o f p o p u la t io n P e r c e n t a g e o f p o p u la t io n P e r c e n t a g e o f p o p u la t io n
4 4 . 5 % 4 9 . 9 % 5 . 6 %
Figure 7-1: Potential coverage by age group and quintile - basic income grant (R100) + the potential current system
The potential impact of social assistance on poverty alleviation and economic development 139
The coverage according to age groups is complete as already pointed out in the household section, and while under the current system the main part of the budget share goes to the pensioners, which only make up 5.6% of the population, the introduction of a Basic Income Grant ensures an improvement in the support of working age adults and children. The former receive 43.8% of the share, followed by the children with 38.4% and the pensioners with 18.1%. One has to keep in mind that the well-targeted support for pensioners remains at the same level but that with a Basic Income Grant more people benefit and a more equal distribution of resources takes place. Pensioners still receive three times more in terms of the budget than the percentage they represent in terms of the total population.
The analysis of the amount that is received per person per quintile reveals the desired tendency that the poorer part of the population receives more than the richer part, although no targeting has been applied so far.
Figure 7-2: Potential social assistance transfers per capita - basic income grant (R100) + the potential current system
Even as across the quintiles the majority gets between R50 and R100, in the bottom two quintiles, around 1/3 of the people receive between R100 and R250 and in the third quintile still 22.4%. This figure drops further to 11.4% in the fourth and to under 5% in the richest quintile. If targeting takes place through the tax system, this will enhance the system by recovering money which the rich poten-tially are paid through the grant.143
The next graph shows that a Basic Income Grant of R100 already has a huge potential for closing the poverty gap for people in the different quintiles.
143 See ‘7.2.2.2.) Taxing a Basic Income Grant’ page 168
The potential impact of social assistance on poverty alleviation and economic development 140
3 0 %2 5 %
2 0 %
1 4 %1 2 %
0 % 0 % 0 % 0 % 0 %
7 %5 % 4 % 3 %
6 %
6 1 %
3 4 %
1 9 %
7 %3 %
2 6 %
3 8 %
2 5 %
8 %
3 %6 %
2 4 %
5 3 %
8 1 %
8 8 %
0 %
1 0 %
2 0 %
3 0 %
4 0 %
5 0 %
6 0 %
7 0 %
8 0 %
9 0 %
1 0 0 %
Pot
enti
al b
udge
t sha
re
Per
cent
ages
of
peo
ple
who
se
pove
rty
gap
is p
oten
tial
ly
redu
ced
by:
50%
to 9
9%
100%
-
0% to
49%
0%
B o tto m quin tile
not b
elow
sub
s. le
vel
Pot
enti
al b
udge
t sha
re
Per
cent
ages
of
peo
ple
who
se
pove
rty
gap
is p
oten
tial
ly
redu
ced
by:
50%
to 9
9%
100%
-
0% to
49%
0%
2 . quin tile
not b
elow
sub
s. le
vel
Pot
enti
al b
udge
t sha
re
Per
cent
ages
of
peo
ple
who
se
pove
rty
gap
is p
oten
tial
ly
redu
ced
by:
50%
to 9
9%
100%
-
0% to
49%
0%
3 . quin tile
not b
elow
sub
s. le
vel
Pot
enti
al b
udge
t sha
re
Per
cent
ages
of
peo
ple
who
se
pove
rty
gap
is p
oten
tial
ly
redu
ced
by:
50%
to 9
9%
100%
-
0% to
49%
0%
4 . quin tile
not b
elow
sub
s. le
vel
Pot
enti
al b
udge
t sha
re
Per
cent
ages
of
peo
ple
who
se
pove
rty
gap
is p
oten
tial
ly
redu
ced
by:
50%
to 9
9%
100%
-
0% to
49%
0%
T op quin tile
not b
elow
sub
s. le
vel
Figure 7-3: Potential reduction of poverty gap - basic income grant (R100+ the potential current system
The potential impact of social assistance on poverty alleviation and economic development 141
For over 60% of the people in the bottom quintile, the poverty gap is closed by between 50% and 99% and for a quarter of the people the gap can be closed completely. In the second quintile, for nearly 40% the poverty gap can be fully closed and for 1/3 by 50% - 99% while 24% do not live under the subsistence level already. In the third quintile, less than half the people live under the subsistence level. For the others, the situation improves with the grant, as for nearly 25% the poverty gap is com-pletely closed and another 18.6% can realise a closing of over 50%. In comparison to the potential of the current system144 this is an immense improvement on the situation as here in the first quintile only for 4.5%, in the second only for 10% and in the third only for 9.5% the poverty gap can be fully closed. For the majority the closing lies below 50%. The Basic Income Grant would therefore go a long way towards helping to get people above the subsistence level.
The graph displaying the income distribution on a national level, substantiates these findings:
0
500,000
1,000,000
1,500,000
2,000,000
2,500,000
per a
dult
eq.
R 1
2
R 1
7
R 2
5
R 3
6
R 5
3
R 7
8
R 1
14
R 1
67
R 2
44
R 3
57
R 5
23
R 7
65
R 1
,121
R 1
,641
R 2
,402
R 3
,517
R 5
,149
R 7
,538
R 1
1,03
7
R 1
7,77
5
R 2
6,02
5
R 5
0,71
5
Figure 7-4: Total monthly income distribution per adult equivalent - basic income grant (R100) + the potential current system (dotted line = only potential of the current social assistance system)
There is nobody not having any income at all. Therefore, the Basic Income Grant effectively addresses the absolute poverty, parts of the population are faced with under the current system. Moreover, a visibly larger part of the poor population moves nearer to or over the poverty line. The Basic Income Grant is effective in getting a minimum support to everybody and by doing so moving people at least close to a level of decent subsistence. All in all, the graph is much narrower indicating a more equal distribution of income than under the current system (see dotted line). The Basic Income Grant is therefore also effective in reducing inequality.
7.1.2.) An Unemployment Benefit The calculations for the Unemployment Benefit are based on the broad definition of unemployment as developed by Klasen and Woolard and as explained in detail earlier.145 A means test of R800 is ap-plied for the personal income of the unemployed person in question, the income of the spouse or the household are not considered.
Running the model with these assumptions, the picture looks as follows:
144 See Figure 5-11 page 120 145 See ‘4.3.1.) Defining employment and unemployment rates’. The unemployment definition includes people from the
age of 16 onwards. One should be aware that this is different from the grouping into ‘working age adults’ used in this research as here the cut-off age is 18 years.
The potential impact of social assistance on poverty alleviation and economic development 142
only child.
child. + work. age
adults
child. + adults in pen. age
child. + work. age adults + adults in pen. age
only work. age adults
work. age adults + adults in pen. age
only adults in pen. age Total
SOCIAL ASSISTANCE - POVERTY Total No. of people living in the bottom two quintiles: 32,280 13,548,616 402,237 6,366,098 808,943 345,796 55,553 21,559,522 % of people living in the bottom two quintiles: 0.1% 62.8% 1.9% 29.5% 3.8% 1.6% 0.3% 100.0% Total No. of people living in HH receiving no social assistance (bottom two quintiles): 10,396 1,796,255 1,774 11,999 380,547 0 0 2,200,970 % of people living in HH receiving no social assistance (bottom two quintiles): 32.2% 13.3% 0.4% 0.2% 47.0% 0.0% 0.0% 10.2% Average No. of people living in the HH (bottom two quintiles): 4.2 7.4 4.7 9.3 2.7 3.7 1.4 7.6 Average No. of people employed in the HH (bottom two quintiles): 0.0 1.0 0.0 0.8 1.0 0.6 0.0 0.9 Average No. of people receiving social assistance (bottom two quintiles): 1.1 2.4 2.3 4.2 0.9 2.3 1.4 2.9 Average % closed of the poverty gap by social assistance (bottom two quintiles): 26.0% 41.2% 81.5% 73.8% 38.4% 91.2% 100.0% 53.4% Average per capita social assistance transfer (bottom two quintiles): R 24 R 46 R 155 R 111 R 64 R 216 R 428 R 71 Average per capita social assistance transfer through old SoSe payments (bottom two quintiles): R 0 R 0 R 0 R 0 R 0 R 0 R 0 R 0 Average per capita social assistance transfer through SOAP (bottom two quintiles): R 0 R 0 R 135 R 63 R 0 R 157 R 428 R 25 Average per capita social assistance transfer through CSG (bottom two quintiles): R 23 R 20 R 18 R 18 R 0 R 0 R 0 R 18 Average per capita social assistance transfer through DG (bottom two quintiles): R 0 R 2 R 1 R 4 R 8 R 3 R 0 R 3 Average per capita social assistance transfer through BIG (bottom two quintiles): R 0 R 0 R 0 R 0 R 0 R 0 R 0 R 0 Average per capita social assistance transfer through UB (bottom two quintiles): R 0 R 24 R 1 R 26 R 55 R 55 R 0 R 25 SOCIAL ASSISTANCE - ECONOMY Total number of people reached by social assistance programmes: old system 0 0 0 0 0 0 0 0 SOAP 0 0 176,368 1,334,491 0 295,052 239,593 2,045,503 CSG 11,036 3,652,533 94,157 1,411,011 0 0 0 5,168,737 DG 0 109,083 737 76,248 30,131 3,813 0 220,011
The potential impact of social assistance on poverty alleviation and economic development 143
BIG 0 0 0 0 0 0 0 0 UB 0 2,467,081 1,721 1,012,461 535,159 149,448 0 4,165,870 HH 0 0 0 0 0 0 0 0 Total 11,036 6,228,697 272,984 3,834,211 565,289 448,313 239,593 11,600,122 Total annual transfers by social assistance programmes (in millions): old system R 0 R 0 R 0 R 0 R 0 R 0 R 0 R 0 SOAP R 0 R 0 R 893 R 6,690 R 0 R 1,440 R 1,072 R 10,096 CSG R 13 R 4,383 R 113 R 1,693 R 0 R 0 R 0 R 6,202 DG R 0 R 532 R 4 R 392 R 145 R 20 R 0 R 1,092 BIG R 0 R 0 R 0 R 0 R 0 R 0 R 0 R 0 UB R 0 R 5,921 R 4 R 2,430 R 1,284 R 359 R 0 R 9,998 HH R 0 R 0 R 0 R 0 R 0 R 0 R 0 R 0 Total R 13 R 10,836 R 1,014 R 11,205 R 1,429 R 1,818 R 1,072 R 27,388 Total annual transfer to quintiles (in millions): 1. Qu. 2.2 4,202.6 406.3 5,043.1 254.7 452.0 95.3 10,462.1 2. Qu. 6.6 3,146.2 341.7 3,431.6 351.6 440.2 190.0 7,937.2 3. Qu. 3.3 2,252.5 205.4 1,996.8 323.0 359.9 231.7 5,455.6 4. Qu. 1.2 956.9 52.4 575.0 332.3 313.5 238.2 2,470.7 5 . Qu. 0.0 219.0 4.8 157.2 143.3 247.1 323.7 1,089.6 Total annual transfer rural / urban. (in millions): rural 13.5 6,401.9 804.6 7,431.4 447.4 868.9 430.6 16,446.1 urban 0.0 4,396.7 204.8 3,754.8 979.2 943.5 655.4 10,957.5 Total annual transfer by race (in millions): "african" 13.4 9,671.7 954.5 10,337.2 1,198.8 1,242.3 573.4 24,232.0 "coloured" 0.0 880.8 51.1 660.6 103.7 189.4 35.0 1,933.2 "indian" 0.0 115.6 4.6 87.8 19.3 107.8 4.6 328.1 "white" 0.0 210.8 2.5 117.9 111.8 276.1 464.7 1,158.5 Figure 7-5: Social assistance poverty and the economy – Unemployment Benefit (R200 for those earning less than R800 per month) + the potential current system
More than 2 million people in the bottom two quintiles live in households that are not reached by any social assistance transfers. The majority of those live in ‘children and working age adults’ households. In addition, the coverage of the various types of households is unequal. Nearly 50% of people in ‘only working age adults’ households and 1/3 of the children in ‘only children’ households are not covered. On average 10.2% of the people in the bottom two quintiles live in households that receive no social assistance. The comparable figure of the potential of the current system is 20.8%.146 In further com-parison to the current system, the average number of people in a household who receive social assis-tance increases, except for the ‘only children’ households where the number remains the same. How-ever, the increase is not significant. In the ‘children with working age adults’ households, the average number of people who receive social assistance rises from 1.5 person to 2.4 with an average of 7.4 people living in a household. In the three generation households with an average size of 9.3 people, the increase due to the Unemployment Benefit is bigger, it rises from 0.8 under the current system to 4.2. But for both of these household types, the poverty gap can only be closed by about 40% and the bene-fit per capita is between R45 and R63. Only if a pensioner lives in the household, a per capita transfer of over R100 can be realised. On average, the transfer across the different types of households amounts to only R71, while under the current system it is R46.
In total, the costs amount to R27.3 billion and 11.6 million people benefit from the programmes whereas 4.1 million people receive the Unemployment Benefit who make up 99% of the unem-ployed.147 The costs of the Unemployment Benefit come to about R10 billion. The targeting according to quintiles is favourable towards the poor, as nearly 70% goes to the first two quintiles and another
146 See Table 5-11; page 115 147 See ‘4.3.1.) Defining employment and unemployment rates’. The total number of unemployed is 4,216682 out of an
economically active population of 13,855,073.
The potential impact of social assistance on poverty alleviation and economic development 144
20% to the third quintile. However, looking at the next graph, the shortcomings of this benefit become apparent:
The potential impact of social assistance on poverty alleviation and economic development 145
a g e 0 -1 7 a g e 6 0 f . / 6 5 m . -a g e 1 8 -5 9 f . / 6 4 m .
P o t e n t i a l c o v e r a g e a c c o r d in g to q u i n t i l e s
P o t e n t ia l b u d g e t s h a r e P o t e n t ia l b u d g e t s h a r e P o t e n t ia l b u d g e t s h a r e
2 4 . 7 % 3 8 . 5 % 3 6 . 9 %
P e r c e n t a g e o f p o p u la t io n P e r c e n t a g e o f p o p u la t io n P e r c e n t a g e o f p o p u la t io n
4 4 . 5 % 4 9 . 9 % 5 . 6 %
Figure 7-6: Potential coverage by age group and quintile – Unemployment Benefit (R200 for those earning less than R800 per month) + the potential current system
The potential impact of social assistance on poverty alleviation and economic development 146
As expected there is hardly any improvement in the coverage for the children in comparison to the current system. As shown earlier, the depth of the support is also not sufficient enough to benefit chil-dren significantly through a higher household income. While the situation improves for the ‘working age adults’, the coverage in the first quintile comes still to only just over 30%, decreases in the second to 27.3%, and in the third only 21.9% are reached. This indicates that in the South African context it cannot be assumed that the unemployed are congruent with the poor. Targeting by means of an unem-ployment definition in the South African context is not an adequate measure to reach the poor.
The analysis of the closing of the poverty gap and the per capita transfer into the households reveal that the Unemployment Benefit is shared among many people:
Figure 7-7: Potential per capita social assistance transfers – Unemployment Benefit (R200 for those earning less than R800 per month) + the potential current system
Over 40% of the people in the first quintile receive less than R50 per month and another third of the people get less than R100. In the second quintile, those having less than R50 per person make up nearly 50%, while another 30% get between R50 and R100. These relatively low amounts are matched by the figures for the closing of the poverty gap:
The potential impact of social assistance on poverty alleviation and economic development 147
3 8 %
2 9 %
2 0 %
9 %4 %5 %
8 % 7 %5 %
7 %
4 5 %
2 5 %
1 3 %
6 %3 %
3 3 %
2 6 %
1 4 %
3 %1 %
1 1 %
1 7 %1 3 %
4 %2 %
6 %
2 4 %
5 3 %
8 1 %
8 8 %
0 %
1 0 %
2 0 %
3 0 %
4 0 %
5 0 %
6 0 %
7 0 %
8 0 %
9 0 %
1 0 0 %
Pot
enti
al b
udge
t sha
re
Perc
enta
ges
of p
eopl
e w
hose
po
vert
y ga
p is
pot
enti
ally
re
duce
d by
:
50%
to 9
9%
100%
-
0% to
49%
0%
B o tto m quintile
not b
elow
sub
s. le
vel
Pote
ntia
l bud
get s
hare
Perc
enta
ges
of p
eopl
e w
hose
po
vert
y ga
p is
pot
enti
ally
re
duce
d by
:
50%
to 9
9%
100%
-
0% to
49%
0%
2 . qu in tile
not b
elow
sub
s. le
vel
Pote
ntia
l bud
get s
hare
Perc
enta
ges
of p
eopl
e w
hose
po
vert
y ga
p is
pot
enti
ally
re
duce
d by
:
50%
to 9
9%
100%
-
0% to
49%
0%
3 . qu in tile
not b
elow
sub
s. le
vel
Pote
ntia
l bud
get s
hare
Perc
enta
ges
of p
eopl
e w
hose
po
vert
y ga
p is
pot
enti
ally
re
duce
d by
:
50%
to 9
9%
100%
-
0% to
49%
0%
4 . qu in tile
not b
elow
sub
s. le
vel
Pot
enti
al b
udge
t sha
re
Perc
enta
ges
of p
eopl
e w
hose
po
vert
y ga
p is
pot
enti
ally
re
duce
d by
:
50%
to 9
9%
100%
-
0% to
49%
0%
T op quin tile
not b
elow
sub
s. le
vel
Figure 7-8: Potential reduction of poverty gap – Unemployment Benefit (R200 for those earning less than R800 per month) + the potential current system
The potential impact of social assistance on poverty alleviation and economic development 148
For the majority of the people in the first quintile, the poverty gap can only be closed by up to 50% and for only 10.8% it can fully be closed. In the second quintile, although 17.2% are pushed com-pletely over the poverty line, for another 1/3 the closing lies below 50%.
The overall income distribution looks as follows:
0
500,000
1,000,000
1,500,000
2,000,000
2,500,000
per a
dult
eq.
R 1
2
R 1
7
R 2
5
R 3
6
R 5
3
R 7
8
R 1
14
R 1
67
R 2
44
R 3
57
R 5
23
R 7
65
R 1
,121
R 1
,641
R 2
,402
R 3
,517
R 5
,149
R 7
,538
R 1
1,03
7
R 1
7,77
5
R 2
6,02
5
R 5
0,71
5
Figure 7-9: Total monthly income distribution per adult equivalent – Unemployment Benefit (R200 for those earning less than R800 per monthly) + the potential current system (dotted line = only potential of the current social assistance system)
What is of interest here is the fact that there is still a considerable number of people without any in-come and the peak of the graph left of the poverty line indicates that the majority of the people are below the poverty line. Moreover, the graph remains similarly wide if compared with the potential of the current system (see dotted line) which shows that the Unemployment Benefit is not geared towards reducing inequality. It can be concluded that while individuals might benefit from an Unemployment Benefit, it is not an effective measure to combat poverty with scarce resources.
7.1.3.) A household grant The option of a household grant leaves room for various possibilities:
• Amount: A household grant, as opposed to an individual grant paid out on a household basis, has a flat rate benefit regardless of the household size.
• Means tests: Like with the Basic Income Grant one could have no means test at all or alternatively one could introduce a means test based on the household income.
• Other grants: In order not to duplicate existing transfers, one could exclude house-holds already receiving a grant or one could include these grants as part of the house-hold income. Following the idea of a universal grant one would not take account of them at all.
Out of these various choices which due to limitations of space cannot all be tested, the following op-tion has been chosen for the sake of simplicity and comparability: All households regardless of their income or already existing grants qualify for a fixed amount, regardless of the number of people living in the households. The amount is set at R200 per household per month which makes it easy to com-pare with the Unemployment Benefit. On the basis of this analysis, other options like limiting the number of households or in/decreasing the amount can be easily derived from this scenario.
The potential impact of social assistance on poverty alleviation and economic development 149
Due to the fact that all households receive the grant, the results of the first part of Table 7-2 are self-evident. What is of interest is the closing of the poverty gap and the transfer per capita:
only child.
child. + work. age
adults
child. + adults in pen. age
child. + work. age adults + adults in pen. age
only work. age adults
work. age adults + adults in pen. age
only adults in pen. age Total
SOCIAL ASSISTANCE - POVERTY Total No. of people living in the bottom two quintiles: 32,280 13,548,616 402,237 6,366,098 808,943 345,796 55,553 21,559,522 % of people living in the bottom two quintiles: 0.1% 62.8% 1.9% 29.5% 3.8% 1.6% 0.3% 100.0% Total No. of people living in HH receiving no social assistance (bottom two quintiles): 0 0 0 0 0 0 0 0 % of people living in HH receiving no social assistance (bottom two quintiles): 0.0% 0.0% 0.0% 0.0% 0.0% 0.0% 0.0% 0.0% Average No. of people living in the HH (bottom two quintiles): 4.2 7.4 4.7 9.3 2.7 3.7 1.4 7.6 Average No. of people employed in the HH (bottom two quintiles): 0.0 1.0 0.0 0.8 1.0 0.6 0.0 0.9 Average No. of people receiving social assistance (bottom two quintiles): 4.2 7.4 4.7 9.3 2.7 3.7 1.4 7.6 Average % closed of the poverty gap by social assistance (bottom two quintiles): 66.0% 49.6% 92.6% 73.3% 58.5% 90.9% 100.0% 59.2% Average per capita social assistance transfer (bottom two quintiles): R 87 R 54 R 205 R 110 R 105 R 225 R 584 R 80 Average per capita social assistance transfer through old SoSe payments (bottom two quintiles): R 0 R 0 R 0 R 0 R 0 R 0 R 0 R 0 Average per capita social assistance transfer through SOAP (bottom two quintiles): R 0 R 0 R 135 R 63 R 0 R 157 R 428 R 25 Average per capita social assistance transfer through CSG (bottom two quintiles): R 23 R 20 R 18 R 18 R 0 R 0 R 0 R 18 Average per capita social assistance transfer through DG (bottom two quintiles): R 0 R 2 R 1 R 4 R 8 R 3 R 0 R 3 Average per capita social assistance transfer through BIG (bottom two quintiles): R 0 R 0 R 0 R 0 R 0 R 0 R 0 R 0 Average per capita social assistance transfer through UB (bottom two quintiles): R 0 R 0 R 0 R 0 R 0 R 0 R 0 R 0 SOCIAL ASSISTANCE - ECONOMY Total number of people reached by social assistance programmes: old system 0 0 0 0 0 0 0 0 SOAP 0 0 176,368 1,334,491 0 295,052 239,593 2,045,503
The potential impact of social assistance on poverty alleviation and economic development 150
CSG 11,036 3,652,533 94,157 1,411,011 0 0 0 5,168,737 DG 0 109,083 737 76,248 30,131 3,813 0 220,011 BIG 0 0 0 0 0 0 0 0 UB 0 0 0 0 0 0 0 0 HH 52,997 26,006,623 545,879 8,542,352 4,171,014 902,175 362,592 40,583,630 Total annual transfers by social assistance programmes (in millions): old system R 0 R 0 R 0 R 0 R 0 R 0 R 0 R 0 SOAP R 0 R 0 R 893 R 6,690 R 0 R 1,440 R 1,072 R 10,096 CSG R 13 R 4,383 R 113 R 1,693 R 0 R 0 R 0 R 6,202 DG R 0 R 532 R 4 R 392 R 145 R 20 R 0 R 1,092 BIG R 0 R 0 R 0 R 0 R 0 R 0 R 0 R 0 UB R 0 R 0 R 0 R 0 R 0 R 0 R 0 R 0 HH R 48 R 11,561 R 354 R 2,741 R 5,858 R 735 R 587 R 21,884 Total R 61 R 16,476 R 1,364 R 11,516 R 6,002 R 2,195 R 1,659 R 39,274 Total annual transfer to quintiles (in millions): 1. Qu. 8.8 4,704.9 520.3 5,024.9 357.9 454.2 128.5 11,207.2 2. Qu. 24.4 4,103.5 468.8 3,443.3 671.8 478.7 260.8 9,476.4 3. Qu. 19.0 3,420.1 280.3 2,154.0 1,071.2 409.0 318.4 7,727.4 4. Qu. 8.2 2,393.6 77.5 715.5 1,886.7 415.1 350.4 5,798.6 5 . Qu. 0.0 1,904.7 10.7 223.2 2,048.5 435.2 599.6 5,195.0 Total annual transfer rural / urban. (in millions): rural 56.2 8,639.8 1,079.2 7,690.5 2,014.7 947.1 591.4 21,003.4 urban 4.0 7,819.7 277.8 3,826.3 3,953.5 1,240.9 1,074.2 18,154.9 Total annual transfer by race (in millions): "african" 60.2 12,745.4 1,278.5 10,507.5 4,211.5 1,347.1 795.8 30,940.0 "coloured" 0.0 1,617.6 67.5 753.3 331.2 223.8 46.8 3,059.6 "indian" 0.0 428.3 6.7 118.6 113.4 136.3 6.7 794.2 "white" 0.0 1,740.5 6.7 177.4 1,365.1 484.8 805.2 4,535.1 Table 7-2: Social assistance poverty and the economy – Household Grant (R200) + the potential current sys-tem
As expected, there is no person living in a household receiving no transfer. On average the poverty gap can be closed by 59.2%. The lowest being 50% for ‘children with working age adults’ households, followed by ‘only working age adults’ households with 58.5% and ‘only children’ households with 66%. Due to the fact that pensioners receiving SOAPs are part of all the other household types, the closing here is above 70%.
The average transfer per capita amounts to R80 which is nearly double the amount of the current sys-tem.148 The ‘only children’ households can realise a higher increase, up from R23 per capita to R87 per capita. This is due to the smaller sizes of the households in comparison to ‘children with working age adults’ which with the household grant have an increase from R22 under the current system to R54. For the three generation households with the highest average number of people living in this household type, the increase amounts to R25 (from R85 to R110). So they are relatively disadvantaged by the household grant. The ‘only working age adults’ households on average have R105 at their dis-posal, while pensioners living with either children or working age adults get over R200. Pensioners living on their own receive R584 on average.
The total costs amount to R39 billion while the household grant costs R21 billion. Over 50% of the funding goes to the bottom two quintiles and nearly 20% to the third quintile. The fourth and fifth quintile each receive around 14%. The split between rural and urban is relatively even as 52.6% is transferred into rural areas.
The coverage graph shows once again that everybody is reached: 148 See Table 5-11; page 115
The potential impact of social assistance on poverty alleviation and economic development 151
a g e 0 -1 7 a g e 6 0 f . / 6 5 m . -a g e 1 8 -5 9 f . /6 4 m .
P o te n t ia l c o v e r a g e a c c o rd in g to q u in t i le s
P o t e n t ia l b u d g e t s h a r e P o t e n t ia l b u d g e t s h a r e P o t e n t ia l b u d g e t s h a r e
3 5 . 0 % 3 5 . 4 % 2 9 . 6 %
P e r c e n t a g e o f p o p u la t io n P e r c e n t a g e o f p o p u la t io n P e r c e n t a g e o f p o p u la t io n
4 4 . 5 % 4 9 . 9 % 5 . 6 %
Figure 7-10: Potential coverage by age group and quintile – Household Grant (R200) + the potential current system
The potential impact of social assistance on poverty alleviation and economic development 152
The budget share is divided relatively evenly among the three age-groups. Here one has to keep in mind, though that the pensioners make up 5.6% of the population while the working age group and the children comprise 49.9% and 44.5% respectively.
The analysis of the per capita transfer per quintile points to some problem in targeting:
0%4%
33%40%
22%
1% 0%6%
35%38%
19%
2% 0%6%
41%35%
17%
1% 0%4%
47%
29%
17%
1% 0%0%
47%
38%
12%
2%0%
10%
20%
30%
40%
50%
60%
70%
80%
90%
100%R
250 -R
0
R25
-50
R50
-100
R10
0 -25
0
R0 -
25
1 . Q u in tile 2. Q u in tile 3. Q u in tile 4. Q u in tile 5. Q u in tile
R25
0 -R0
R25
-50
R50
-100
R10
0 -25
0
R0 -
25
R25
0 -R0
R25
-50
R50
-100
R10
0 -25
0
R0 -
25
R25
0 -R0
R25
-50
R50
-100
R10
0 -25
0
R0 -
25
R25
0 -R0
R25
-50
R50
-100
R10
0 -25
0
R0 -
25
Figure 7-11: Potential per capita social assistance transfers – Household Grant (R200) + the potential current system
Although in the first quintiles the percentage of people receiving above R50 per capita is higher than in the top quintiles, the percentage of people receiving below R50 remains fairly equal across all the quintiles. Although there are gaps in the current system, at least the amount per capita transferred to the bottom quintiles is much higher in it (see Figure 5-10 page 119), than the amount transferred to the top quintiles.
Due to the fact that more people live in the bottom quintile and usually in larger households, the above described situation also has an effect on the reduction of the poverty gap:
The potential impact of social assistance on poverty alleviation and economic development 153
2 8 %2 4 %
1 9 %1 5 % 1 3 %
0 % 0 % 0 % 0 % 0 %
4 8 %
2 7 %
1 6 %
8 % 7 %
3 4 %
2 7 %
1 4 %
5 %2 %
1 1 %
2 2 %1 7 %
6 %3 %
6 %
2 4 %
5 3 %
8 1 %
8 8 %
0 %1 0 %
2 0 %3 0 %4 0 %5 0 %
6 0 %7 0 %8 0 %
9 0 %1 0 0 %
Pot
enti
al b
udge
t sha
re
Per
cent
ages
of
peo
ple
who
se
pove
rty
gap
is p
oten
tial
ly
redu
ced
by:
50%
to 9
9%
100%
-
0% to
49%
0%
Bo tto m quintile
not b
elow
sub
s. le
vel
Pot
enti
al b
udge
t sha
re
Per
cent
ages
of
peo
ple
who
se
pove
rty
gap
is p
oten
tial
ly
redu
ced
by:
50%
to 9
9%
100%
-
0% to
49%
0%
2 . quintile
not b
elow
sub
s. le
vel
Pot
enti
al b
udge
t sha
re
Per
cent
ages
of
peo
ple
who
se
pove
rty
gap
is p
oten
tial
ly
redu
ced
by:
50%
to 9
9%
100%
-
0% to
49%
0%
3 . quintile
not b
elow
sub
s. le
vel
Pot
enti
al b
udge
t sha
re
Per
cent
ages
of
peo
ple
who
se
pove
rty
gap
is p
oten
tial
ly
redu
ced
by:
50%
to 9
9%
100%
-
0% to
49%
0%
4 . quintile
not b
elow
sub
s. le
vel
Pot
enti
al b
udge
t sha
re
Per
cent
ages
of
peo
ple
who
se
pove
rty
gap
is p
oten
tial
ly
redu
ced
by:
50%
to 9
9%
100%
-
0% to
49%
0%
T op quintile
not b
elow
sub
s. le
vel
Figure 7-12: Potential reduction of poverty gap – Household Grant (R200) + the potential current system
The potential impact of social assistance on poverty alleviation and economic development 154
In the first quintile for only 11% of the people the gap can be fully closed, while for the majority a closing under 50% is achieved. In the second quintile, 22% are pushed over the poverty line. The re-maining people are evenly split between those above and below 50%. In the third quintile, for another 17% a full closing is given.
The national income distribution puts the results into perspective:
0
500,000
1,000,000
1,500,000
2,000,000
2,500,000
per a
dult
eq.
R 1
2
R 1
7
R 2
5
R 3
6
R 5
3
R 7
8
R 1
14
R 1
67
R 2
44
R 3
57
R 5
23
R 7
65
R 1
,121
R 1
,641
R 2
,402
R 3
,517
R 5
,149
R 7
,538
R 1
1,03
7
R 1
7,77
5
R 2
6,02
5
R 5
0,71
5
Figure 7-13: Total monthly income distribution per adult equivalent – Household Grant (R200) + the poten-tial current system (dotted line = only potential of the current social assistance system)
There is nobody without any income if a household grant is introduced, which is a real improvement in comparison to the potential of the current system. The first income recorded per adult equivalent starts at about R30. However, there are still many people far below the poverty line and the shape of the graph is not much narrower than compared to the one displaying the current system (see dotted line), hence inequality remains at a relatively high level. The household grant is not able to eradicate severe poverty.
7.1.4.) An extension of the CSG This section analyses the consequences of extending the CSG, which is currently limited to children up to their 7th birthday, to children up to the age of 17 years (inclusive). The means test is kept the same, so that children whose care-giver and where applicable the spouse have a (combined) income of less than R800 in urban areas and R1100 in rural areas or who live in an informal dwelling are eligi-ble. The situation for people in the bottom two quintiles looks as follows:
only child.
child. + work. age
adults
child. + adults in pen. age
child. + work. age adults + adults in pen. age
only work. age adults
work. age adults + adults in pen. age
only adults in pen. age Total
SOCIAL ASSISTANCE - POVERTY Total No. of people living in the bottom two quintiles: 32,280 13,548,616 402,237 6,366,098 808,943 345,796 55,553 21,559,522 % of people living in the bottom two quintiles:
The potential impact of social assistance on poverty alleviation and economic development 155
0.1% 62.8% 1.9% 29.5% 3.8% 1.6% 0.3% 100.0% Total No. of people living in HH receiving no social assistance (bottom two quintiles): 0 748,081 0 11,999 768,476 0 0 1,528,556 % of people living in HH receiving no social assistance (bottom two quintiles): 0.0% 5.5% 0.0% 0.2% 95.0% 0.0% 0.0% 7.1% Average No. of people living in the HH (bottom two quintiles): 4.2 7.4 4.7 9.3 2.7 3.7 1.4 7.6 Average No. of people employed in the HH (bottom two quintiles): 0.0 1.0 0.0 0.8 1.0 0.6 0.0 0.9 Average No. of people receiving social assistance (bottom two quintiles): 4.2 3.8 4.6 5.6 0.1 1.3 1.4 4.2 Average % closed of the poverty gap by social assistance (bottom two quintiles): 80.7% 50.9% 96.4% 75.8% 4.1% 77.0% 100.0% 59.0% Average per capita social assistance transfer (bottom two quintiles): R 100 R 54 R 202 R 112 R 11 R 161 R 428 R 75 Average per capita social assistance transfer through old SoSe payments (bottom two quintiles): R 0 R 0 R 0 R 0 R 0 R 0 R 0 R 0 Average per capita social assistance transfer through SOAP (bottom two quintiles): R 0 R 0 R 135 R 63 R 0 R 157 R 428 R 25 Average per capita social assistance transfer through CSG (bottom two quintiles): R 100 R 51 R 66 R 45 R 0 R 0 R 0 R 47 Average per capita social assistance transfer through DG (bottom two quintiles): R 0 R 2 R 1 R 4 R 8 R 3 R 0 R 3 Average per capita social assistance transfer through BIG (bottom two quintiles): R 0 R 0 R 0 R 0 R 0 R 0 R 0 R 0 Average per capita social assistance transfer through UB (bottom two quintiles): R 0 R 0 R 0 R 0 R 0 R 0 R 0 R 0 SOCIAL ASSISTANCE - ECONOMY Total number of people reached by social assistance programmes: old system 0 0 0 0 0 0 0 0 SOAP 0 0 176,368 1,334,491 0 295,052 239,593 2,045,503 CSG 52,997 10,079,714 354,227 3,561,301 0 0 0 14,048,239 DG 0 109,083 737 76,248 30,131 3,813 0 220,011 BIG 0 0 0 0 0 0 0 0 UB 0 0 0 0 0 0 0 0 HH 0 0 0 0 0 0 0 0 Total 52,997 10,188,797 531,332 4,972,040 30,131 298,865 239,593 16,313,754 Total annual transfers by social assistance programmes (in millions): old system R 0 R 0 R 0 R 0 R 0 R 0 R 0 R 0 SOAP R 0 R 0 R 893 R 6,690 R 0 R 1,440 R 1,072 R 10,096 CSG R 64 R 12,096 R 425 R 4,274 R 0 R 0 R 0 R 16,858 DG R 0 R 532 R 4 R 392 R 145 R 20 R 0 R 1,092 BIG R 0 R 0 R 0 R 0 R 0 R 0 R 0 R 0 UB R 0 R 0 R 0 R 0 R 0 R 0 R 0 R 0 HH R 0 R 0 R 0 R 0 R 0 R 0 R 0 R 0 Total R 64 R 12,628 R 1,322 R 11,355 R 145 R 1,460 R 1,072 R 28,046
The potential impact of social assistance on poverty alleviation and economic development 156
Total annual transfer to quintiles (in millions): 1. Qu. 8.8 4,982.9 525.6 5,218.8 36.1 326.4 95.3 11,219.2 2. Qu. 29.9 3,806.1 449.8 3,402.3 46.1 341.5 190.0 8,315.5 3. Qu. 17.8 2,550.7 263.8 2,033.7 30.7 283.8 231.7 5,515.4 4. Qu. 7.0 1,057.0 71.8 596.3 23.0 274.0 238.2 2,290.4 5 . Qu. 0.0 425.5 7.8 171.9 17.0 233.6 323.7 1,177.6 Total annual transfer rural / urban. (in millions): rural 59.6 8,515.9 1,068.4 7,834.4 79.3 667.8 430.6 18,730.4 urban 4.0 4,120.3 248.3 3,513.0 72.5 787.8 655.4 9,453.5 Total annual transfer by race (in millions): "african" 63.6 11,512.8 1,250.3 10,536.3 111.7 944.7 573.4 25,370.3 "coloured" 0.0 879.5 59.3 664.7 29.6 157.7 35.0 1,834.8 "indian" 0.0 147.5 5.6 93.3 0.0 100.1 4.6 342.7 "white" 0.0 389.5 4.6 129.4 17.0 256.6 464.7 1,240.1 Table 7-3: Social assistance poverty and the economy – extension of CSG (0-18 years) + the potential current system
The coverage of all types of households except for ‘only working age adults’ households is effective. However, in the households where only working age adults live, 95% of the people are not reached by any social assistance at all. Together with the people living in other household compositions but who do not receive social assistances themselves, they make up 1.5 million people in the bottom two quin-tiles who do not receive any social assistance. Likewise, the poverty gap is closed by over 75% for all households except where working age adults live on their own or only with children. It has to be kept in mind that 68.9% of the children below the poverty line live in the household type ‘children and working age adults’.149 In the latter the poverty gap is closed by 50% compared with 23% under the current system.150 In the ‘only working age adults’ household the figure remains at only 4.1% and the per capita transfer amounts to as little as R8. On average the poverty gap is closed by 59% and the average transfer is R75. Households with children and working age adults have an expected lower than average per capita transfer per month of R53. All the other household types can realise a transfer of over R100 per capita per month.
The total costs of this system amount to R28 billion of which R16.8 billion goes to the CSG benefiting over 14 million children. 70% of the funding gets to the bottom two quintiles and 18.9% to the third quintile. Looking at the rural / urban division, one can note that 2/3 of the money reach rural areas and over 90% goes to ‘africans’, which indicates that it is well targeted.
The graph indicating the coverage according to age groups and quintiles further clarifies the situation described above:
149 See ‘5.2.3.) An analysis of household structure and poverty’ 150 See Table 5-11; page 115
The potential impact of social assistance on poverty alleviation and economic development 157
a g e 0 -1 7 a g e 6 0 f . / 6 5 m . -a g e 1 8 -5 9 f . /6 4 m .
P o te n t ia l c o v e r a g e a c c o rd in g to q u in t i le s
P o t e n t ia l b u d g e t s h a r e P o t e n t ia l b u d g e t s h a r e P o t e n t ia l b u d g e t s h a r e
6 0 . 8 % 3 . 2 % 3 6 . 0 %
P e r c e n t a g e o f p o p u la t io n P e r c e n t a g e o f p o p u la t io n P e r c e n t a g e o f p o p u la t io n
4 4 . 5 % 4 9 . 9 % 5 . 6 %
Figure 7-14: Potential coverage by age group and quintile – extension of CSG (0-18 years) + the potential current system
The potential impact of social assistance on poverty alleviation and economic development 158
Children and pensioners, especially those in the poorer quintiles, are well targeted because of the CSG and the SOAPs whereas the CSG requires the bulk of the budget. The situation looks bleak for work-ing age adults. Only 3.2% of the funding goes into this group and under 2% of the people in the differ-ent quintiles are reached. The extension of the CSG would therefore in comparison to the current sys-tem realise an improvement in the situation of the children, however, the identified gap of the working age group is not addressed adequately.
Looking at the transfer per person per month according to quintiles, the fact that the social assistance transfer is shared among the people and that with that background R100 is a very limited amount be-comes apparent:
3%4%
21%
45%
26%
1%
11%6%
23%
39%
19%
1%
25%
9%
23%28%
14%
1%
54%
9%15%14%
7%1%
77%
3%10%
4%4% 1%0%
10%
20%
30%
40%
50%
60%
70%
80%
90%
100%
R25
0 -R0
R25
-50
R50
-100
R10
0 -25
0
R0 -
25
1 . Q u in tile 2. Q u in tile 3. Q u in tile 4. Q u in tile 5. Q u in tile
R25
0 -R0
R25
-50
R50
-100
R10
0 -25
0
R0 -
25
R25
0 -R0
R25
-50
R50
-100
R10
0 -25
0
R0 -
25
R25
0 -R0
R25
-50
R50
-100
R10
0 -25
0
R0 -
25
R25
0 -R0
R25
-50
R50
-100
R10
0 -25
0
R0 -
25
Figure 7-15: Potential per capita social assistance transfers – extension of CSG (0-18 years) + the potential current system
In the first quintile, over 70% of the people have less than R100 at their disposal. In the second quin-tile, over 10% have nothing at all and another 68.4% have less than R100. In both quintiles around 20% receive between R100 and R250. In the third quintile, where people live just above the poverty line, a quarter of the people get no transfer at all and nearly 60% just up to R100.
The closing of the poverty gap situation looks as follows:
The potential impact of social assistance on poverty alleviation and economic development 159
4 0 %
2 9 %
1 9 %
8 %4 %2 %
5 % 3 % 3 % 4 %
4 0 %
2 2 %
1 5 %
7 %5 %
4 0 %
2 8 %
1 3 %
4 %1 %
1 2 %
2 1 %1 6 %
5 %2 %
6 %
2 4 %
5 3 %
8 1 %
8 8 %
0 %1 0 %
2 0 %3 0 %4 0 %5 0 %
6 0 %7 0 %8 0 %
9 0 %1 0 0 %
Pot
enti
al b
udge
t sha
re
Per
cent
ages
of
peo
ple
who
se
pove
rty
gap
is p
oten
tial
ly
redu
ced
by:
50%
to 9
9%
100%
-
0% to
49%
0%
Bo tto m quintile
not b
elow
sub
s. le
vel
Pot
enti
al b
udge
t sha
re
Per
cent
ages
of
peo
ple
who
se
pove
rty
gap
is p
oten
tial
ly
redu
ced
by:
50%
to 9
9%
100%
-
0% to
49%
0%
2 . quin tile
not b
elow
sub
s. le
vel
Pot
enti
al b
udge
t sha
re
Per
cent
ages
of
peo
ple
who
se
pove
rty
gap
is p
oten
tial
ly
redu
ced
by:
50%
to 9
9%
100%
-
0% to
49%
0%
3 . quin tile
not b
elow
sub
s. le
vel
Pot
enti
al b
udge
t sha
re
Per
cent
ages
of
peo
ple
who
se
pove
rty
gap
is p
oten
tial
ly
redu
ced
by:
50%
to 9
9%
100%
-
0% to
49%
0%
4 . quin tile
not b
elow
sub
s. le
vel
Pot
enti
al b
udge
t sha
re
Per
cent
ages
of
peo
ple
who
se
pove
rty
gap
is p
oten
tial
ly
redu
ced
by:
50%
to 9
9%
100%
-
0% to
49%
0%
T op quintile
not b
elow
sub
s. le
vel
Figure 7-16: Potential reduction of poverty gap – extension of CSG (0-18 years) + the potential current system
The potential impact of social assistance on poverty alleviation and economic development 160
For only 11.6% of the people in the first quintile, the gap can be fully closed. The remaining people split evenly into those where the gap can be closed by over 50% and just up to 50% respectively. In the second quintile, the percentage of closing the gap increases to just over 20%, while for 27.6% a closing of over 50% and for 22.5% of under 50% is achieved.
The national income distribution with an extension of the CSG once again reveals the identified gap in coverage of working age adults:
0
500,000
1,000,000
1,500,000
2,000,000
2,500,000
per a
dult
eq.
R 1
2
R 1
7
R 2
5
R 3
6
R 5
3
R 7
8
R 1
14
R 1
67
R 2
44
R 3
57
R 5
23
R 7
65
R 1
,121
R 1
,641
R 2
,402
R 3
,517
R 5
,149
R 7
,538
R 1
1,03
7
R 1
7,77
5
R 2
6,02
5
R 5
0,71
5
Figure 7-17: Total monthly income distribution per adult equivalent – extension of the CSG (0-18 years) + the potential current system (dotted line = only potential of the current social assistance system)
While in comparison to the potential of the current system (see dotted line), there are less people with no income recorded, still a considerable number have less than R50. Overall the shape of the graph does not change dramatically, a just slightly narrower shape indicates some reduction in inequality. However, the majority remains below the poverty line.
7.2.) An evaluation of the important social and economic factors While the last section provided a separate in depth analysis of the individual options, this next section will now evaluate and directly compare the different options in terms of important social and eco-nomic factors. On the one hand this is done by putting together the results of the last section under the different factors, on the other hand new points of view also including previous findings of the thesis are added. Although there are always overlaps between the different factors, for this analysis they are divided as follows: First of all, based on a summary of the results of the last section, a direct compari-son of the potential of the different options to target the poor and to alleviate poverty will be made. Secondly, in a more general discussion, the opportunities of social assistance for economic growth will be looked at. Combined with that is a comparison of the costs and at the same time the potential of the different options to redistribute resources to different sectors in society. Here also the possibility of taxing the Basic Income Grant or increasing VAT will be explored. Thirdly, the administrative impli-cations of the different options are outlined and evaluated. In a fourth part, the international perspec-tive as developed in Chapter 2 is consulted and lastly, the options are evaluated against their potential to help to alleviate the HIV/AIDS epidemic.
The potential impact of social assistance on poverty alleviation and economic development 161
7.2.1.) Targeting and alleviating poverty151 A direct comparison between the different options makes it evident that all of them achieve a signifi-cant improvement compared to the current system. However, from a developmental point of view there are important differences which can be illustrated by looking at their success in combating pov-erty. Table 7-4 summarises and compares central features of the programmes:
Programme
Average % of poverty gap closed (bottom two quin-
tiles):
Average per cap-ita social assis-tance transfers
(bottom two quin-tiles):
Total number of people reached by social assistance
programme:
Total annual transfers by social
assistance pro-gramme:
current sys-tem
36.8% R46 7,434,252 R17.4 billion
BIG 81.7% R121 33,183,265 R39.8 billion 25,677,421152* R30.8 billion* BIG (R50) 63.7% R83 33,149,376 R19.9 billion 25,655,862* R15,4 billion* UB 53.4% R71 4,165,870 R10 billion HG 59.2% R80 all households R21.9 billion CSG to 18 y. 59.0% R75 8,879,502 R10.7 billion Table 7-4: Comparing the potential social assistance programmes according to depth and width of their sup-port and costs153
The Basic Income Grant nearly triples the average per capita amount going into the 40% of the poorest households from R46 to R120. The other three options put between R71 (UB), R75 (CSG up to 18 years) and R80 (HG) per person into the households. A Basic Income Grant of R50 per person in-creases the amount to R83 per capita.154 The average percentage of closing the poverty gap in the first two quintiles increases likewise: The Unemployment Benefit closes the poverty gap by 53%, both the Household Grant and the extension of the CSG by just about 60%, and the Basic Income Grant by over 80%. As with the average per capita amount, even a Basic Income Grant of R50 is more favour-able than the other options because of its closing of the poverty gap by 63.4%.155 The current system is only able to close the poverty gap by 36.8%.
If one compares the figures with the potential costs, the following findings become evident:156 The Unemployment Benefit and the extended Child Support Grant, being the two targeted programmes, at about R10 billion, amount to approximately the same costs. However, even leaving the negative eco-nomic incentives of an Unemployment Benefit aside, the extended CSG is much better in reaching the poor. While nearly spending the same amount the extended CSG can close the poverty gap by 59% and the Unemployment Benefit by only 53.4%. The extended CSG puts R75 per capita into the pock-ets of the poor and the Unemployment Benefit only R71. This confirms the earlier finding that the unemployed and the poor are not congruent in the South African context. Comparing only the two options, support for children seems to be preferable in terms of its poverty alleviation capacity.
Interestingly, while the Household Grant would cost more than double the amount of extending the CSG, it only manages to reduce the poverty gap to the same extent. The Household Grant also appears 151 If not indicated otherwise, this section looks at the poorest two quintiles. 152 Numbers marked with an asterisk are the comparable figures for the Basic Income Grant if one assumes self-
targeting: The calculations are based on the assumption that only 50% in the fourth and nobody in the fifth quintile takes up the grant.
153 The last column gives the costs of the individual programme excluding the expenditure for the current system. 154 See also ’9.1.) Basic Income Grant R50’ 155 See also ’9.1.) Basic Income Grant R50’ 156 It is important to remember that the figures calculated for the potential costs are as such not an adequate approxima-
tion of the budget amounts needed for the programmes as they are based on the assumption that the programmes work with a 100% capacity. Therefore the real costs will be significantly lower especially during the first years. In order to come from the calculated potential costs to a realistic calculation of the budget needed, one would have to in-clude potential administrative capacities, potential take-up rates and one would have to allow for a phasing-in period during the first years. For a detailed discussion of these issues see Haarmann, 1999b and Haarmann & Haarmann, 1998.
The potential impact of social assistance on poverty alleviation and economic development 162
unfavourable in comparison to the Basic Income Grant. Even a Basic Income Grant of R50 which is R2 billion cheaper (assuming self-targeting over R6 billion), can close the poverty gap by 63.7%. This is significantly more than the Household Grant. This tendency is further confirmed by the per capita transfer into the bottom two quintiles. The Basic Income Grant puts R83 into the pockets of the poor and the Household Grant only R80, despite being more expensive. It becomes clear that the Household Grant, by discriminating against larger households, which were shown to be located in poor rural ar-eas,157 is in its tendency biased in favour of middle and upper class households and thereby not good in targeting the poor.
Comparing the Basic Income Grant (R100) and the extended CSG, the former by closing the poverty gap on average by 81.7% goes much further than the extended CSG. Even the R50 option closes the poverty gap significantly more (63.7% compared to 53%). However, the potential costs seem to be higher in the case of the Basic Income Grant. Even the costs under the assumption of self-targeting are R4.7 billion higher. Besides the different incentive structures and thereby their potential developmen-tal impact, the hidden costs of a relatively expensive means-test for the CSG should be kept in mind. The following table sheds light on where the Basic Income Grant is also more effective in reaching the poor. The table illuminates the impact of the programmes for the different household types. Thereby one can identify which household types are favoured or missed out by the various programmes.
only child.
child. + work. age
adults
child. + adults in pen. age
child. + work. age adults + adults in pen. age
only work. age adults
work. age adults + adults in pen. age
only adults in pen. age Total
COMPARING THE POTENTIAL SOCIAL ASSISTANCE PROGRAMMES Average % closed of the poverty gap by social assistance (bottom two quintiles): current system 26.0% 23.0% 81.3% 60.5% 4.1% 77.0% 100.0% 36.8% BIG 80.7% 77.0% 97.5% 90.3% 64.1% 92.8% 100.0% 81.7% BIG (R50) 54.2% 55.5% 91.1% 78.1% 41.8% 86.0% 100.0% 63.7% UB 26.0% 41.2% 81.5% 73.8% 38.4% 91.2% 100.0% 53.4% HH 66.0% 49.2% 92.6% 73.3% 58.5% 90.9% 100.0% 59.2% CSG to 18 y. 80.7% 50.9% 96.4% 75.8% 4.1% 77.0% 100.0% 59.0% Table 7-5: Comparing the potential social assistance programmes by the average percentage of the poverty gap closed (bottom two quintiles)
Here the limitations of the extension of the CSG become apparent. Poor adults in working age are only reached if living together with children. Therefore adults living on their own (over 800,000 in the bot-tom two quintiles) are completely left in destitution with an average closing of the poverty gap of only 4.1%. This means no improvement to the current system for these households. The Basic Income Grant in contrast reaches 64.1% (BIG R(50) 41.8%). Even in households where ‘working age adults’ and ‘children live together’, a social reality for 13.5 million South Africans below the poverty line, a R50 Basic Income Grant is more favourable to the poor than a R100 targeted CSG for all children.
The next table displays the percentage of people in the different quintiles for whom the poverty gap can be fully closed.
157 Compare ‘5.1.2.4.) The division according to rural and urban areas within the quintile’ and ‘5.2.3.) An analysis of
household structure and poverty’
The potential impact of social assistance on poverty alleviation and economic development 163
Percentage of people whose poverty gap is fully closed Programme 1. Quintile 2. Quintile 3. Quintile current system 4% 10% 9% BIG 26% 38% 25% BIG (R50) 12% 23% 17% UB 11% 17% 13% HG 11% 22% 17% CSG to 18 y. 12% 21% 16% Table 7-6: Comparing the potential social assistance programmes by the percentage of people whose poverty gap is fully closed
The Basic Income Grant is able to close the poverty gap completely for 38% of the people in the sec-ond quintile and for just over 25% in both the first and the third quintile. In comparison, the other three options achieve only half of the potential of the Basic Income Grant: In the second quintile for around 17% to 22%, whereby the Unemployment Benefit with 17% is significant weaker than the other options. In the first quintile for between 11% and 12% of the people the gap can be fully closed and in the third quintile 13% to 17%. For comparison, a Basic Income Grant of R50 can close the pov-erty gap completely for 23% in the second, 12% in the first, and 17% in the third quintile.158
Table 7-7 points again to the gaps of the targeted programmes.
only child.
child. + work. age
adults
child. + adults in pen. age
child. + work. age adults + adults in pen. age
only work. age adults
work. age adults + adults in pen. age
only adults in pen. age Total
COMPARING THE POTENTIAL SOCIAL ASSISTANCE PROGRAMMES % of people living in HH receiving no social assistance (bottom two quintiles): current system 32.2% 27.2% 0.4% 0.2% 95.0% 0.0% 0.0% 20.8% BIG 0.0% 0.0% 0.0% 0.0% 0.0% 0.0% 0.0% 0.0% BIG (R50) 0.0% 0.0% 0.0% 0.0% 0.0% 0.0% 0.0% 0.0% UB 32.2% 13.3% 0.4% 0.2% 47.0% 0.0% 0.0% 10.2% HH 0.0% 0.0% 0.0% 0.0% 0.0% 0.0% 0.0% 0.0% CSG to 18 y. 0.0% 5.5% 0.0% 0.2% 95.0% 0.0% 0.0% 7.1% Table 7-7: Comparing the potential social assistance programmes by the percentage of people living in HH receiving no social assistance (bottom two quintiles)
Assuming that the current system would work with a 100% efficiency, about 1/3 of the poor in the household types ‘only children’ and ‘children with working age adults’ have no legal access to social assistance. This is one of the major gaps. Current coverage of households is mainly provided through the SOAPs. Therefore the second gap becomes apparent: households where ‘only working age adults’ live are completely (95%) left without assistance. The targeted programmes would attend to the gaps from different angles: The Unemployment Benefit by targeting the adults and the extended CSG by targeting the children. The result is that the Unemployment Benefit would improve the situation in the ‘only working age adults’ households and the ‘children and working age adults’ households. However, the coverage even here is far from being comprehensive. 47% of the ‘only working age adults’ and 13.3% of the ‘children and working age adults’ households are left without support. The gap for the only children households is left untouched, creating especially a problem, when taking the effects of HIV/AIDS into account.159 The extended Child Support Programme is more effective for the ‘children with working age adults’ with only 5.5% of the people here having no access to social assistance but the gap of the ‘only working age adults’ is not addressed at all.
158 See also ‘9.1.) Basic Income Grant R50’ 159 See also Table 9-5 page 200
The potential impact of social assistance on poverty alleviation and economic development 164
This situation is further reflected in the per capita transfer into the different quintiles. Both, the Basic Income Grant and the Household Grant ensure that everybody receives at least some income. How-ever, due to the fact that the Household Grant has to be shared among more people, around 5% in the first three quintiles receive less than R25 and only around 20% receive more than R100. The Basic Income Grant guarantees that everybody receives at least R50 to R100 and nearly 40% in the first and 30% in the second quintile have more than a R100 transfer. A Basic Income Grant option of R50 leaves nobody who has less than R25 and nearly the majority in the first three quintiles receive be-tween R50-100. Under the Unemployment Benefit and the extension of the CSG, the situation looks very different as there are a considerable number of people not having any transfers: 6% in the first, 15% in the second and 29% in the third quintile, leaving between 40% and 60% in these quintiles with a per capita transfer of under R50. The extension of the CSG is, in this regard, better targeted: While in all three quintiles there are also people with no transfers, more than under the Unemployment Bene-fit receive at least between R50 to R100.160
These findings point to the following additional problem - besides the complicated administration161 - of the targeted programmes: They do not offer a comprehensive solution to the problem of poverty alleviation and hence do not provide the security which is crucial for the poor to become economic active.162 By doing so they always ‘favour’ certain living arrangements or social conditions. Depend-ing on the quality of benefit this creates strong incentives for people to move to these forms of living (e.g. to move into a certain household or to leave children with grandparents) or, worse still, to seek to be qualifying for an unemployment benefit. This is where a major advantage of the universal pro-grammes lies. Leakage to the non poor can then either be avoided by self-targeting or by recovering some of the costs through taxation.163
only child.
child. + work. age
adults
child. + adults in pen. age
child. + work. age adults + adults in pen. age
only work. age adults
work. age adults + adults in pen. age
only adults in pen. age Total
COMPARING THE POTENTIAL SOCIAL ASSISTANCE PROGRAMMES Average % of people having access to social assistance in the HH (bottom two quintiles): current system 26.2% 20.3% 48.9% 32.3% 3.7% 35.1% 100.0% 25.0% BIG 100.0% 100.0% 100.0% 100.0% 100.0% 100.0% 100.0% 100.0% BIG (R50) 100.0% 100.0% 100.0% 100.0% 100.0% 100.0% 100.0% 100.0% UB 26.2% 32.4% 48.9% 45.2% 33.3% 62.2% 100.0% 38.2% HH 100.0% 100.0% 100.0% 100.0% 100.0% 100.0% 100.0% 100.0% CSG to 18 y. 100.0% 51.4% 97.9% 60.2% 3.7% 35.1% 100.0% 55.3% Table 7-8: Comparing the potential social assistance programmes by the average percentage of people having access to social assistance in the HH (bottom two quintiles)
Table 7-8 adds another feature in favour of a universal grant especially the Basic Income Grant. Cur-rently on average only a quarter of the household members in the bottom two quintiles have legal ac-cess to the resources provided for by social assistance. This increases to 38.2% in case of the Unem-ployment Benefit and 55.3% with the extended Child Support Programme. However, the Basic In-come Grant and in the model also the Household Grant (it is unclear who in the household would have the legal access to the grant)164 give all household members the same legal access to the grant.165
160 See also ’9.1.) Basic Income Grant R50’ 161 See ‘7.2.3.) Administration’ 162 See ‘7.2.2.) Economic development, redistribution and costs’ 163 For taxation see ‘7.2.2.2.) Taxing a Basic Income Grant’ 164 The proposals in the current debate do not give an answer to this problem. The model assumes an equal division of
the grant among the members of the household for the poverty calculations, which leaves the question of legal access still unresolved. This explains the 100% figure.
The potential impact of social assistance on poverty alleviation and economic development 165
For the intra household distribution and especially the gender relations this has potentially far reaching consequences. Women in abusive relationships are often confronted with the situation that they either endure the suffering or are threatened to lose their livelihoods. Having a legal claim for a basic in-come, would certainly strengthen their position. The same is true for grown up children who have to stay with their parents to benefit from pensions. However, the Basic Income Grant, while giving a financial basis for empowerment, still encourages larger households as the grant is accumulated and the costs of living decline with the economies of scale.
7.2.2.) Economic development, redistribution and costs (…) the poor are most likely to be in need of safety nets. In the absence of publicly supported safety nets the poor are likely to turn their production and consumption behavior toward risk avoidance instead of toward income maximization. In other words, the poor often cannot afford to be entrepreneurial - and may remain unproductive and poor. In order to counteract this, cash and in-kind transfers, and poverty targeted programs (…) should be examined in a broad developmental context, while ensuring that the poor also have access to the gains from economic growth (Subbarao, Bonnerjee, Braitwhaite, et al. 1997; 3-4).
Persistent poverty and inequality do not only hamper productive behaviour and economic growth but there is a growing consensus that the reduction of poverty is a prerequisite for successful economic growth. The provision of income security for the poor as part of a poverty alleviation strategy has par-ticular advantages in this regard. The fact that the poor can count on a stable - even low - income source provides new opportunities and benefits that not only reduce poverty but enhance productivity and economic growth in a particularly successful way.
A stable income source frees some of the resources which are normally needed for ensuring the sheer survival of the household and which are necessarily based on a day to day planning and strategy. These resources can now be used for longer term planning and strategies and this enables people to become economically active and participate productively in the informal or formal sector. Income security therefore goes a long way to facilitating people’s breaking out of the vicious circle of poverty and their participation in the labour market. By doing so, the overall productivity in society can be increased.
The distribution of resources into the different household compositions is important from this point of view.166 The current system benefits mainly households where pensioners live. The Basic Income Grant and the Household Grant reach all households, though the level of coverage differs (see section above). The extension of the CSG in combination with the SOAPs realises a distribution of resources into all household types except where working age adults live on their own. From the point of view of increasing the opportunities of working age adults to take part in the economy, this speaks against these options. The Unemployment Benefit constitutes a mixture: More working age adults are reached than under the current system, but in comparison with the other options, the overall distribution into the different household types in the first two quintiles is not very effective. Nearly 50% of the ‘only working age adults’ households and over 30% of the ‘only children’ households are not reached. Fur-thermore, nearly 1.8 million people live in ‘children with working age adults’ households receiving nothing, these households are deprived of benefiting from a stable income source. Important, however, is the poverty trap created by the Unemployment Benefit: People have to choose between low paid employment and an Unemployment Benefit as they lose the benefit – and the security – once they are employed.
Social security increases productivity also from a health point of view by improving the nutritional well-being of the people and in particular of the children. For the latter it is of utmost importance that they are supported in their early years to ensure a healthy growing up and development. This is a pre-requisite for their performance in school and later in the labour market. From this children’s point of view, the extension of the CSG is the most favourable option, as it distributes the bulk of the resources into households with children. On the other hand, one has to be aware that the average per capita trans-
165 In case of the Basic Income Grant the primary care-giver of the children in the household is the preferred recipient
entrusted with the money. 166 See also ‘7.2.1.) Targeting and alleviating poverty’
The potential impact of social assistance on poverty alleviation and economic development 166
fer into ‘children with working age adults’ households is lower than even with a Basic Income Grant of R50167 and that the best success to improve the health status of the entire population including the children can be achieved by a universal grant.
An even more direct and measurable impact of cash transfers into households on the economy is the increase and stabilisation of demand, consumption and savings.
The provision of income increases the demand on the market and therefore fosters the local economy. By providing individuals and households with a regular - even a low - income source, the demand for commodities on the local market is stabilised. By the same token, social security increases and stabi-lises consumption spending. Again, it is the local economy which benefits and in the South African context these two factors would go a long way to kick-start the economy in the often underdeveloped rural areas. All of the above tested options transfer a considerable amount of money into the rural economies and by doing so provide a starting point for this process.
Percentage of transfers by race
Programme
Percentage of transfers to rural areas ‘african’ ‘coloured’ ‘indian’ ‘white’
current sys-tem
64.7% 87% 6.6% 1.2% 5.2%
BIG 52.5% 78.3% 8.8% 2.4% 10.4% 59.6%168* 86.9%* 8.5%* 1.7%* 2.9%* BIG (R50) 55.4% 80.4% 8.3% 2.2% 9.2% 61%* 86.9%* 8%* 1.5%* 3.6%* UB 60.0% 87.6% 7% 1.2% 4.2% HG 53.6% 78.7% 7.8% 2% 11.5% CSG to 18 y. 66.5% 88.1% 6.2% 1.2% 4.3% Table 7-9: Comparing the potential social assistance programmes according to their rural focus and transfers by race
In terms of concrete amounts, both Basic Income Grant options and the Household Grant (in connec-tion with the current programmes) distribute the highest amounts into the rural areas: The R100 per person option R29 billion, the R50 per person R20 billion and the Household Grant also R20 billion. From the point of view of targeting, the extension of the CSG follows the favouring of rural areas of the SOAPs by putting 2/3 of the entire budget into rural areas and 1/3 into urban areas.
Looking at longer term, social assistance can motivate people to save, although the amount will be limited, community saving schemes, which cater for lower amounts can be encouraged and help peo-ple to provide back-ups for crises.
A further important aspect for economic development and growth is the reduction of inequality. Social assistance based on redistributive policies achieves a redistribution of wealth and by doing so reduces inequality; this exactly has been argued to be a prerequisite for investment and hence economic growth in a developing country:
Income inequality increases socio-political instability which in turn decreases investment. After an exten-sive battery of robustness tests, we can conclude that these results in our sample of 70 countries are quite solid. (Alesina & Perotti, 1993:18)169
Given the high level of inequality in South Africa, the Gini coefficient lies between 0.58 and 0.69 (Nattrass & Seekings, 2000:1), the reduction of inequality and hence paving the way for social stabil-ity is of utmost importance. Evidence from other countries as discussed in Chapter 2 has pointed to the use and the success of social security as a tool for social stability and a move towards more egalitarian societies.170 The problem of high crime rates in South Africa and as a result the hampering of invest-ment could also be addressed in this way as here again a connection to inequality is seen:
167 See also ’9.1.) Basic Income Grant R50’ 168 Numbers marked with an asterisk are the comparable figures for the Basic Income Grant, if one assumes self-
targeting: only 50% in the fourth and nobody in the fifth quintile take up the grant. 169 See also Barro, 1999 170 See ‘2.3.1.) Lessons from the capitalist countries’
The potential impact of social assistance on poverty alleviation and economic development 167
Higher inequality fuels crime against private property; thus redistributive policies protect property by reducing crime. (Alesina & Perotti, 1993:18)
The different options score differently in terms of their potential to reduce inequality.
The comparison can be visualized by looking at the shape of the graphs displaying the ‘Total monthly per adult equivalent income distribution’. The narrower the shape, the higher the reduction in inequal-ity. Here one can see that the two Basic Income Grant options do best, their shape is clearly narrower than the ones for the other options, and they alleviate extreme poverty as they leave nobody without any income. Furthermore, more people are moved nearer towards the poverty line. Looking at the other three options, their potential is more limited. Both the Unemployment Grant and the extension of the CSG cannot ensure at least some income for all people. The Household Grant can do so, but the fact that the Grant has to be shared among more people reduces the average amount and also the po-tential of reducing inequality, as especially poorer households tend to be larger and this is exactly the area where successful intervention is needed.
7.2.2.1.) Evaluating the reliability of the calculations given the data choices made Chapter 3 elaborated on the data situation and concluded that the SALDRU-prov. weight, which the chapter developed, was the best weight to update the data. Consequently all calculations where done using this weight. However, in order to be able to quantify the effect of this choice, a second weight, namely SALDRU-age, was created. The following table now shows the percentage in- / decrease in potential beneficiaries and total annual transfers, if the calculations were done with the SALDRU-age weight.
Potential current system BIG UB HH
extension CSG
Total number of people reached by social assistance programmes: SOAP -8.2% -7.9% -8.2% -8.2% -8.2% CSG 10.9% 10.9% 10.9% 10.9% 7.8% DG -11.2% -11.5% -11.2% -11.2% -11.2% BIG 0.0% -2.0% 0.0% 0.0% 0.0% UB 0.0% 0.0% -8.3% 0.0% 0.0% HH 0.0% 0.0% 0.0% 0.0% 0.0% Total 5.0% -0.7% 0.2% 5.6% Total annual transfers by social assistance programmes (in millions): SOAP -7.7% -7.7% -7.7% -7.7% -7.7% CSG 10.9% 10.9% 10.9% 10.9% 7.8% DG -11.7% -11.8% -11.7% -11.7% -11.7% BIG 0.0% -2.0% 0.0% 0.0% 0.0% UB 0.0% 0.0% -8.3% 0.0% 0.0% HH 0.0% 0.0% 0.0% -2.2% 0.0% Total -1.3% -1.8% -3.9% -1.8% 1.5% Table 7-10: Percentage in- / decrease in the number of beneficiaries and the total annual transfers, if the programme is run with SALDRU-age weight instead of SALDRU-prov. weight
Table 7-10 shows that the calculations can claim a very high confidence level, even if it should turn out that the choice regarding the weight was wrong. Except for the extension of the CSG, the costs are rather an overestimate, meaning that they are fiscally conservative. The difference, as discussed in Chapter 3, mainly lies in the SALDRU-prov. weight assuming slightly less children and slightly more adults. Nevertheless, the effects are not substantial for the choice of a specific social assistance system over another.
The potential impact of social assistance on poverty alleviation and economic development 168
Potential current system BIG UB HH
extension CSG
Total number of people reached by social assistance programmes: SOAP 2,045,503 2,014,350 2,045,503 2,045,503 2,045,503 CSG 5,168,737 5,168,737 5,168,737 5,168,737 14,048,239 DG 220,011 217,278 220,011 220,011 220,011 BIG 0 32,909,664 0 0 0 UB 0 0 4,165,870 0 0 HH 0 0 0 40,583,630 0 Total 7,434,252 40,310,029 11,600,122 16,313,754 Total annual transfers by social assistance programmes (in millions): SOAP R 10,096 R 10,062 R 10,096 R 10,096 R 10,096 CSG R 6,202 R 6,202 R 6,202 R 6,202 R 16,858 DG R 1,092 R 1,089 R 1,092 R 1,092 R 1,092 BIG R 0 R 39,492 R 0 R 0 R 0 UB R 0 R 0 R 9,998 R 0 R 0 HH R 0 R 0 R 0 R 21,884 R 0 Total R 17,390 R 56,845 R 27,388 R 39,274 R 28,046 Table 7-11: Number of beneficiaries and total annual transfers, if the programme is run with SALDRU-prov. Weight (Default)
Potential current system BIG UB HH
extension CSG
Total number of people reached by social assistance programmes: SOAP 2,212,674 2,173,215 2,212,674 2,212,674 2,212,674 CSG 4,606,667 4,606,667 4,606,667 4,606,667 12,946,981 DG 244,667 242,208 244,667 244,667 244,667 BIG 0 33,275,462 0 0 0 UB 0 0 4,511,824 0 0 HH 0 0 0 40,583,581 0 Total 7,064,008 40,297,552 11,575,832 47,647,589 15,404,322
Total annual transfers by social assistance programmes (in millions): SOAP R 10,876 R 10,833 R 10,876 R 10,876 R 10,876 CSG R 5,528 R 5,528 R 5,528 R 5,528 R 15,536 DG R 1,220 R 1,217 R 1,220 R 1,220 R 1,220 BIG R 0 R 39,931 R 0 R 0 R 0 UB R 0 R 0 R 10,828 R 0 R 0 HH R 0 R 0 R 0 R 22,362 R 0 Total R 17,624 R 57,509 R 28,452 R 39,986 R 27,632 Table 7-12: Number of beneficiaries and total annual transfers, if the programme is run with SALDRU-age weight
7.2.2.2.) Taxing a Basic Income Grant
COSATU’s proposal of a Basic Income Grant at the job summit entails the proposal to introduce a Solidarity Tax to cover the financial costs. The underlying idea is to broaden the redistributive charac-ter of the policy and to acknowledge that poverty is a legacy of apartheid which has to be tackled with the full force of all members of society.
Besides a solidarity tax, which in principle amounts to an income tax, combined with the introduction of the Basic Income Grant, the public discussion brought up the option to increase VAT to help to finance the Basic Income Grant.
The potential impact of social assistance on poverty alleviation and economic development 169
This microsimulation model cannot conclusively model either the income tax or the VAT as the data does not allow to model the complete tax base.171 Therefore the model will not be able to give an ex-act answer on how to finance the Basic Income Grant. Nevertheless two options will be run on the model to give an idea of the impact of an income tax or a consumption tax on the ability of the Basic Income Grant to address poverty effectively.
In order to allow for a comparison, the options are chosen to recover the same total amount (in the following example R15 billion per year). On the SALDRU data this gives the following two options.
• The first option models an income tax of 17.5% for everybody earning above R30,000 a year.
• The second option models a tax on consumption of 6.5% on the total monthly con-sumption of the households.
The next table provides the information if the first option is chosen and an income tax of 17.5% is introduced:
171 The total annual consumption in the SALDRU amounts to between 1/2 or 1/3 of the total tax base. Therefore the
model is not able to give an exact answer on how to finance the Basic Income Grant and which tax rate is required. However, what is attempted here is to show the impact of the different options in terms of the distribution effects fo-cused on the poverty situation.
The potential impact of social assistance on poverty alleviation and economic development 170
Total 63.6 21,981.5 1,320.3 15,191.8 429.8 1,555.8 953.1 42,054.5 Net benefit BIG (in millions): 1. Qu. 6.6 6,593.3 131.2 2,870.0 339.7 137.9 0.0 10,072.6 2. Qu. 23.3 5,959.5 110.3 2,076.7 569.7 117.7 0.0 8,845.6 3. Qu. 14.5 5,472.5 58.6 1,198.6 847.2 97.0 1.3 7,664.1 4. Qu. 5.8 3,074.7 22.8 314.5 1,215.6 102.6 16.1 4,739.0 5 . Qu. 0.0 -4,833.0 -6.6 -67.5 -2,739.9 -407.6 -183.0 -8,211.7 Total 50.2 16,884.6 314.9 6,391.5 273.2 87.2 -151.8 24,112.3 Table 7-13: Income tax to reclaim R15 billion given the SALDRU data
0
500,000
1,000,000
1,500,000
2,000,000
2,500,000
per a
dult
eq.
R 1
2
R 1
7
R 2
5
R 3
6
R 5
3
R 7
8
R 1
14
R 1
67
R 2
44
R 3
57
R 5
23
R 7
65
R 1
,121
R 1
,641
R 2
,402
R 3
,517
R 5
,149
R 7
,538
R 1
1,03
7
R 1
7,77
5
R 2
6,02
5
R 5
0,71
5
Figure 7-18: Total monthly income distribution per adult equivalent - income tax to reclaim R15 billion given the SALDRU data (dotted line = Basic Income Grant without taxation)
Table 7-13 and Figure 7-18 show that the effect of the Basic Income Grant to alleviate severe poverty is not even reversed by this relatively high tax. The first quintile would receive R6.8 billion less than if no tax was introduced. This means still an additional net transfer of R10 billion a year through the Basic Income Grant into the first quintile. For the second quintile a net transfer of R8.8 billion is real-ised against a transfer of R14.2 (-5.4) without a tax. Figure 7-18 clearly shows the situation for those below the poverty line: The very poor are not affected by the tax, however, fewer people can be pushed over the poverty line but remain slightly below it. The third and fourth quintile still receive R7.7 billion and R4.7 billion meaning R3.7 billion and R3.2 billion respectively less. The top quintile would in its net-effect pay more for the Basic Income Grant than it benefits: R8.2 billion against re-ceiving R6.5 billion without a tax. This shows that the Basic Income Grant combined with a tax can effectively reclaim money from those who are not intended as beneficiaries and that it can do so with-out a means-test which is costly and administratively difficult.
Potentially, the following objections might be raised:
• The marginal tax rate would increase and it might be argued that this will discourage economic activity and new investment.
• Following this line of argument a higher tax rate might also lead to an increase in tax evasion and avoidance which negatively impacts on the total state income.
• Given the small tax base in South Africa those paying income tax will bare the brunt of the system.
While it is clear that any new state expenditure financed through taxation will encounter this critique, a Basic Income Grant has a strong case in its favour. There is a convincing moral argument that those
The potential impact of social assistance on poverty alleviation and economic development 171
wealthy in South Africa should show solidarity with those who were formerly marginalized. But this aside, they and their businesses would directly through the greater social cohesions and stability cre-ated by a Basic Income Grant benefit from the grant. Investment and economic activity in South Af-rica is not so much limited by high tax rates as by the instability created through poverty and crime. Given current inequality levels, the fight against crime can only be won through greater redistribution. The notion that this should be done by directly paying cash transfers to the people which does not require an expensive structure where the money does not reach the beneficiaries, seems in fact the reason why the Basic Income Grant has been positively mentioned in the business press.
Further, the argument of tax avoidance could be tackled by linking the payout of the Basic Income Grant to the inclusion of more people into the financial sector. Thereby income structures would be-come more transparent in the long run which again would make the tracking of tax avoidance easier.
Finally, while currently the tax base is relatively small, this is a reason to draw more people into the economic sphere. However, people having to fight for daily survival cannot take market risks. A Basic Income Grant was shown to pull the majority of South Africans out of this severe poverty and thereby is a tool to enhance growth which in the long run increases the tax base.
While the idea of a solidarity tax is quite obvious in its redistributive effect towards the poor, financ-ing through VAT is even more controversial as on its own it is a regressive tax on the poor. The fol-lowing graph explains the basic idea of, why it can be argued that an increase in VAT still has a posi-tive and progressive effect if introduced together with a Basic Income Grant of R100.
-R 400
-R 300
-R 200
-R 100
R 0
R 100
R 200
R 300
R 400
R 500
R 600
R 1
0
R 1
5
R 2
1
R 3
1
R 4
6
R 6
7
R 9
8
R 1
44
R 2
11
R 3
09
R 4
53
R 6
63
R 9
70
R 1
,420
R 2
,080
R 3
,045
R 4
,458
R 6
,527
R 9
,556
R 1
3,99
1
R 2
0,48
4
R 2
9,99
1
R 4
3,90
9
R 6
4,28
8
TaxBIGNet
Figure 7-19: Net effect of a Basic Income Grant and a consumption based tax
The graph shows that a four person household consuming just over R3,000 a month would still gain R200 per month from the Basic Income Grant. A four person household consuming up to R6,500 a month would still have a net benefit from the Basic Income Grant. A household consuming close to R14,000 a month would pay an additional R400.
Two concerns should be raised, however:
• The first concern is that in its relative tendency a consumption tax favours the richer households. The rich only consume a percentage of their income while the poor tend to consume close to 100%. However, one will have to weigh the options.
• The main problem if the Basic Income Grant was linked to an increase in VAT lies in the following: If VAT was increased faster than the take-up of the Basic Income Grant, this would result in a worsening of the net situation of the poor, as their daily costs of living would rise while they would receive no extra support. This is especially
The potential impact of social assistance on poverty alleviation and economic development 172
of concern as the increase in VAT directly hits the poor, whereas the introduction of a Basic Income Grant might, depending on the administration, take years before it reaches everybody.
If the second concern is addressed and the increase in VAT goes hand in hand with the delivery of the Basic Income Grant, the information about a consumption tax on the system looks as follows:
The potential impact of social assistance on poverty alleviation and economic development 173
0
500,000
1,000,000
1,500,000
2,000,000
2,500,000
per a
dult
eq.
R 1
2
R 1
7
R 2
5
R 3
6
R 5
3
R 7
8
R 1
14
R 1
67
R 2
44
R 3
57
R 5
23
R 7
65
R 1
,121
R 1
,641
R 2
,402
R 3
,517
R 5
,149
R 7
,538
R 1
1,03
7
R 1
7,77
5
R 2
6,02
5
R 5
0,71
5
Figure 7-20: Total monthly income distribution per adult equivalent - consumption tax to reclaim R15 billion given the SALDRU data (dotted line = Basic Income Grant without taxation)
The main difference to a solidarity tax lies in the first quintile which would receive R1.5 billion less a year than in the case of a solidarity tax. However, the top quintile would also have to pay R5.5 billion less towards the Basic Income Grant. This is due to a broader tax base as everybody pays consumption tax. What speaks in favour of the consumption tax is the fact that it cannot be avoided by those who do not declare their income and those with income out of illegal activities. While it should be of some concern that the households with only people in pension age would have a net decrease of income of -R2 million in the first quintile and -R8.5 million in the second, the redistributive character of the Basic Income Grant would still be kept. This is clearly shown in Figure 7-20: The very poor would also not be substantially affected by this tax as shown earlier. But similar to the income tax above, not so many people would be pushed over the poverty line but only closer to it.
A third option would be to combine the two options:
Figure 7-21: Total monthly income distribution per adult equivalent - income tax to reclaim R15 billion + a consumption tax to reclaim R15 billion given the SALDRU data (dotted line = Basic Income Grant without taxation)
Table 7-15 and Figure 7-21 show a combination of the two taxes and would reclaim even on the SALDRU data R30 billion per year. The main conclusion is that the poor would still benefit and the elasticity of the income distribution curve above the poverty line reflects that the effect on the richer people would not be dramatic.
It can be concluded with Alesina and Perotti (1993:19)
The potential impact of social assistance on poverty alleviation and economic development 175
From a normative point of view, our results have some implications for the effects of redistributive poli-cies. Fiscal redistribution, by increasing the tax burden on capitalists and investors, reduces the propen-sity to invest. However, the same policies may reduce social tension and, as a result, create a socio-political climate more conducive to productive activities and capital accumulation. Thus, by this channel fiscal redistribution might actually spur economic growth. Therefore the net effect of redistributive poli-cies on growth has to weigh the costs of distortionary taxation against the benefits of reduced social ten-sion.
7.2.3.) Administration It is evident that the introduction of any new system or social assistance grant will require an effective administration. The programme chosen can be good and well targeted in theory but as soon as the administration is not able to deliver, the success will fail to materialize. The recent example of the problems around the CSG serve as an example where intentions were good but in practice only a very small fraction of the intended beneficiaries have been reached.172 Any new programme should learn a lesson from this. Also international evidence and here especially the example of Brazil shows that the design of social assistance programmes has to go hand in hand with building up capacities on an ad-ministrative and infrastructure level.173
The most important points when looking at the administration of a grant, taking account of the CSG and the SOAPs system as an example, is to avoid complicated means tests and to keep the possibilities for corruption as low as possible. In the case of the CSG, the former has proven to severely hamper the take up rate of the grant. Looking at the corruption side, the welfare administration tried to cut down on corruption in the last years by reregistering the beneficiaries in order to inspect their eligibility and by introducing computer systems.174 However, one not only has to look at the side of the beneficiaries but also at the officials administering the grants.
The different options have different requirements in terms of their administration. A universal Basic Income Grant requires no means test at all and there are hardly any possibilities for corruption either, from the side of the beneficiaries or from the side of the officials as everybody qualifies and it is not in their power to determine eligibility. Although the Household Grant is also a universal grant, the situa-tion looks different here. An administration would need to define a household, which is difficult in the South African context, and would need to determine who belongs to the household. In this case, there is an incentive for families to break up the household in order to claim more grants complicating the process further. While it is already difficult define a household for the purpose of a survey a legal definition might even prove to be unworkable. In contrast to the Basic Income Grant, the Household Grant would anyhow require more personnel, time, and finances. The Unemployment Benefit and the extension of the CSG are both based on a means test. The extension of the CSG falls back on the cur-rent means test, which although it has been simplified, has still not proven that more people can gain access to the system. The Unemployment Benefit represents a special situation as one would have to find a definition for ‘being unemployed’. Not only is the formulation of the definition difficult in a context with large informal sector activities, the testing in practice will be even more so. As done here, one would probably have to combine the determination of the status of being unemployed with the testing of the income. One would have to clarify how to test e.g. seasonal workers. In all cases where a means test is applied, resources have to be found to administer the test and it is questionable whether it is not more desirable to spend this money for direct poverty alleviation instead of paying officials. Further one would avoid the negative incentives always attached to a means-test.175 Moreover, wher-ever testing is applied, corruption is possible as well. In this light, one has to be aware that while the Basic Income Grant looks like the most expensive option, the hidden costs - also in terms of economic development - of the other options which are very difficult to quantify might prove this picture wrong.
Looking at the current welfare administration and the problems in delivering the existing grants, a new programme of the scale as discussed here, would completely overburden the system which is already
172 See ‘5.3.3.) Concluding remarks’ 173 See ‘2.3.3.) Lessons from developing countries’ 174 There are numerous cases where the re-registration deprived poor old people and disabled people of their necessary
sources of income. 175 See page 164
The potential impact of social assistance on poverty alleviation and economic development 176
stretched to full capacity. As pointed out before, the success of any programme depends ultimately on an effective delivery. To ensure delivery of a new programme, new ways or approaches to administer and deliver it have to be found.
7.2.4.) The options in an international context When consulting the international comparison to evaluate the different options, the starting point of the different systems in the various countries as well as a needs assessment is of importance here. The analysis in Chapter 2 has pointed to the fact that most of the countries have developed their systems under different circumstances than South Africa is facing at the moment. The industrialised countries as well as the East Asian countries have had high growth rates with low unemployment figures. The industrialised countries started to implement social security under these circumstances. The East Asian countries have often failed to build up social security which has been criticised after the crisis, as lack of back-up systems is said to have worsened the crisis unnecessarily. With increasing democratisation and the ability of pressure groups to voice their concerns, they are now starting to build social security systems. The lesson which has to be learnt is that it does not make sense to wait until the economy achieves a ‘satisfactory’ growth rate. Instead one has to realise that social security does not only en-hance growth but enables economies to cope better with short and long term crises.
The question which arises in the South African context is what kind of system is best suited: Given the reality of severe poverty and high unemployment rates, South Africa does not need a traditional con-tingency approach towards social security as the starting point and therefore the needs differ from the other countries looked at:
In the final analysis, the common forms of social security in industrialised countries, especially social in-surance based as it is on the principle of contributions, insurance and the more less modified principle of equivalence are not designed as instruments of poverty alleviation, as they would have to be in many de-veloping countries today. In fact, quite the contrary is true. Most formal social security systems, with their financing structure based on regressive taxation, help redistribute income away from the poor to the middle classes. (Schmidt, 1992:21-22)
This analysis confirms that South Africa is in a very special situation that requires new approaches as there is at least at the moment more need for promotional social security geared at poverty alleviation instead of trying to copy other countries’ efforts to establish social insurance based systems. Neverthe-less by establishing a new system one can learn from a system point of view and here the legacy that some of the LAC countries are battling with is useful. They often took over the fragmented and un-equal social security systems established by colonial structures which hamper delivery and redistribu-tive measures. South Africa has in parts managed to extend and to integrate the former fragmented system but is now on the threshold of establishing an integrated and comprehensive system. The op-tion chosen should therefore go a long way to work towards an integration and equal coverage of as many groups in society as possible. Equally important is a system that can be administered and does not entail obstacles for the intended beneficiaries to receive their benefits.
The different options have therefore to be tested against their ability to alleviate poverty176 and in how far they can increase the coverage of different groups in the South African context. Furthermore, their ability to deliver to the ground is important.
The Basic Income Grant scores highly in all the requirements identified above. It integrates virtually everybody into the system. It is well targeted towards poverty alleviation and from an administrative point of view relatively uncomplicated. The Household Grant, while in theory covering everybody, does not necessarily integrate the people into the system as only one person in the household would be needed to register to receive the grant and it also requires more administrative capacity. The same applies to the extension of the CSG and the Unemployment Benefit. Both require the kind of admini-stration which as the example of the CSG has proven hampers delivery. The Unemployment Benefit integrates only a fraction of the unemployed while the extension of the CSG leaves out this group completely.
176 See section ‘7.2.1.) Targeting and alleviating poverty’
The potential impact of social assistance on poverty alleviation and economic development 177
7.2.5.) HIV/AIDS The analysis earlier177 showed that the groups most affected by the HIV/AIDS epidemic are the ‘chil-dren’ as well as the ‘working age adults’. The different options have to be evaluated against their abil-ity to take care of these groups. As shown earlier178 HIV/AIDS is likely to lead to a situation, where many households who otherwise would live close to but above the poverty line, are pushed under the basic subsistence level. They will be faced with destitution, if not assisted by the state. Based on the model used for this thesis in excess of seven million more people in South Africa might live below the subsistence level in 2011 than in 1996 if no drastic measures are taken. The appendix provides de-tailed tables with the information of the coverage of the different household compositions by the dif-ferent options taking account of the effect of HIV/AIDS. The following table summarises the main points of the potential of the social assistance options to cope with this situation:
BIG 1996 without 81.7% R124 33,183,265 R39.8 billion
2011 79.4% R124 37,444,523 R44.9 billion
BIG (R50) 1996 without 64.1% R87 33,149,376 R19.9 billion
2011 61.6% R87 37,411,809 R22.4 billion
UB 1996 without 52.9% R76 4,165,870 R10 billion
2011 50.7% R77 5,073,059 R12.2 billion
HG 1996 without 60.6% R87 all households R21.9 billion
2011 60.1% R91 all households R27 billion CSG to 18 y.
1996 without 58.5% R80 8,879,502 R10.7 billion
2011 57.7% R83 11,929,636 R14.3 billion Table 7-16: Comparing the potential social assistance programmes according to depth and width of their support and costs – with the effects of HIV/AIDS 2011180
It becomes apparent that despite an expected rise of costs of over 25% from 1996 to 2011 (R17.4 bil-lion to R22 billion) the current system will on average be less equipped to close the poverty gap for those below the subsistence level than now (36.8% to 35.2%). If people with HIV/AIDS receive a Disability Grant the average percentage of poverty gap closed, rises to 56.8% but the costs would more than double to a total of R43.8 billion (an increase of 151%!). Interestingly, a Basic Income Grant of R50 in conjunction with the current system would be cheaper and significantly better equipped to deal with the crisis by closing the poverty gap by 61.6% (the finances for both Basic In-come Options only increase by 13%). The earlier finding is confirmed: Although the Disability Grant puts more money into households while the people are still alive, the household falls into severe pov-erty, after a breadwinner has died and the support lapses.
The Household Grant provides on average more money per capita than without the effect of HIV/AIDS as the average number of people living in the household is lower. However, targeting is
177 See ‘5.2.4.) HIV/AIDS and its effect on the household structure’ ‘5.3.2.) HIV/AIDS, poverty and social assistance
programmes’ 178 See especially page 110 and 126 179 With the assumption that persons with HIV/AIDS receive a Disability Grant. 180 The last column gives the costs of the individual programme excluding the expenditure for the current system.
The potential impact of social assistance on poverty alleviation and economic development 178
problematic. While pensioners living on their own receive nearly R600, the average transfer is just over R90 with working age adults with children receiving under R60 per capita. This shows that the Household Grant potentially costs 21% more than the Basic Income Grant (R50) but is still signifi-cantly weaker in fighting poverty. The total costs of the Household Grant rise by 23% in comparison 1996.
The Unemployment Benefit despite an expected 22% increase and the extended CSG with an increase of 34% in expenditure are not well equipped for the HIV/AIDS epidemic either. The trends earlier established come to bear. The extended CSG is relatively good in reaching ‘children’ and the Unem-ployment Benefit in reaching some ‘adults in working age’. However, this also describes their weak-ness as neither is comprehensive:
The extended CSG especially misses out on the greater number of ‘only working age adults’ house-holds and does not deliver the quality of support for ‘children with working age adults’ one would hope for. The extension of the CSG is able to provide nearly R100 to the ‘only children’ households, however, the concentration on children leaves behind the ‘only working age adults’ household with only R12 per capita, and the ‘children with working age adults’ household, due to the sharing of the transfer amongst the household members, with under R60.
The Unemployment Benefit while even being far from comprehensive in reaching the adult population in poverty leaves especially families where a breadwinner has died without support e.g. children living in households where the adults have died (see Table 7-17). The Unemployment Benefit is only able to provide children living on their own with R37 and working age adults with children with R47. Work-ing age adults living on their own receive R80 while all the other households receive more than R100. As such the Unemployment Benefit nor the extended CSG are equipped to address the severe effects of the epidemic on poverty in South Africa. However, the impending HIV/AIDS epidemic in South Africa makes it imperative to now choose a system that is able to provide at least some support for those most affected in society.
A Basic Income Grant of R100 would be best equipped to deal with the crisis. The poverty gap is closed at around 80% as the grant reaches all age groups across the board. Therefore in all household types a minimum of at least R100 per capita is available. The quality and the nature of the continuous support as well as its independence from the living arrangements makes the support relatively crises independent. One can conclude that the Basic Income Grant ensures a reliable and important source of income for people to get out of the poverty cycle even throughout the anticipate crises of HIV/AIDS. With regards to households who without HIV/AIDS were economically viable, but through losses of income are in danger of falling into destitution, it creates a safety net to stay economically functional.
In return a Basic Income Grant might prove effective in fighting HIV/AIDS in the longer term. If the cycle of poverty can be broken, people get hope and energy to constructively build society and in the end to prevent the further spread of the disease.
[S]ocial intervention the mainstay of primary prevention efforts remain the most potent weapon in our fight against this scourge. (Health Minister Manto Tshabalala-Msimang in response to the fight against AIDS; Business Day 20.7.2000)
only child.
child. + work. age
adults
child. + adults in pen. age
child. + work. age adults + adults in pen. age
only work. age adults
work. age adults + adults in pen. age
only adults in pen. age Total
COMPARISON Average % closed of the poverty gap by social assistance (below subsistence level): current system 1996 without 26.7% 23.7% 83.7% 61.8% 2.7% 78.7% 100.0% 36.8% 2011 23.5% 21.7% 82.4% 61.4% 2.3% 77.9% 100.0% 35.2% 2011* 31.4% 47.1% 84.3% 76.8% 41.3% 87.9% 100.0% 56.8% BIG
The potential impact of social assistance on poverty alleviation and economic development 179
1996 without 84.7% 77.7% 97.8% 90.5% 62.1% 92.8% 100.0% 81.7% 2011 67.0% 74.8% 97.3% 90.5% 59.1% 92.3% 100.0% 79.4% BIG (R50) 1996 without 60.7% 56.7% 92.4% 78.7% 39.9% 86.5% 100.0% 64.1% 2011 46.5% 53.7% 91.5% 78.4% 37.5% 85.6% 100.0% 61.6% UB 1996 without 29.7% 41.2% 83.7% 74.6% 32.7% 89.5% 100.0% 52.9% 2011 24.6% 39.1% 83.4% 73.5% 36.5% 89.2% 100.0% 50.7% HH 1996 without 74.4% 51.5% 94.0% 74.2% 60.4% 91.4% 100.0% 60.6% 2011 66.2% 49.9% 93.4% 74.4% 61.3% 91.2% 100.0% 60.1% CSG to 18 y. 1996 without 84.7% 51.5% 97.0% 76.4% 2.7% 78.7% 100.0% 58.5% 2011 63.1% 49.8% 96.4% 76.8% 2.3% 77.9% 100.0% 57.7% Table 7-17: Comparing the potential social assistance programmes by the average percentage of the poverty gap closed – with the effects of HIV/AIDS 2011 (below the subsistence level)
Conclusion 180
Chapter 8: Conclusion
8.1.) Methodology The thesis analyses the link between social assistance and poverty alleviation in the South African context. The analysis is based on the following methodology: The poverty profile of the South African population was done using a combination of consumption quintiles, income subsistence levels and a deprivation index. The analysis of the household structure arrived at seven household types by divid-ing the South African population into three main age groups (Children, working age adults and pen-sioners). Following this division, the seven household types are allocated, all being combinations of the age groups. By help of a microsimulation model the thesis tested the current social assistance pro-grammes and different options for an extension. It evaluated the impact of the different programmes, being based on the assumption that they work with a 100% efficiency. By doing so, the analysis is able to reveal the potential of the programmes. The model evaluated the current system as well as the dif-ferent options in terms of their potential impact on poverty alleviation and on other social and eco-nomic factors, taking account of international experience. As a result, the different options can then easily be compared in terms of their suitability for the South African context.
The model is based on the SALDRU data as the microsimulation model requires the information col-lected by a household survey. It was shown that for this special research interest SALDRU provides the best suited and most reliable data set of the South African population. For comparative reasons, the data base has been updated to 1996 standard with the help of the 1996 Census and the CPI figures. To evaluate the impact of HIV/AIDS, the results of the HIV/AIDS model created by ASSA have been worked into the calculations.
8.2.) The necessity for a decisive intervention The extent and severity of the various facets of poverty in South Africa have become apparent: 53% of the South African population live in the first two quintiles and hence below the poverty line. The analysis revealed the strong link between different factors of poverty: Over 90% of those below the poverty line are ‘africans’ and by far the majority live in rural areas. In contrast, only 27% of the population make up the two top quintiles and over 80% of the richest quintile are ‘indian’ or ‘whites’ living in urban areas.
Likewise one can observe a link between poverty and the type of household the people are living in. First of all, larger households with children are far more likely to live in poverty than smaller house-holds without children. Nearly 90% of the people in 'only children' households and around 70% of those in both, skip generation households and three generation households, live in the first two quin-tiles. Still 52.1% of ‘working age adults with children’ live in the bottom two quintiles, representing the national average. In turn 'only' 38.3% of the people living in ‘working age adults with pensioners' households and 19.4% of those in ‘only working age adults’ households live in poverty. The figure drops to 15.3 % for people in households where only adults in pension age live. The situation would deteriorate if there was no social assistance. If one looks at the households which are, not taking any social assistance transfers into account, below the subsistence level, then around 90% of the people in both, 'only children' and skip generation households and over 80% in the three generation households are below the subsistence line. Furthermore, more than half of the people in 'children with working age adults' households and in 'working age adults with pensioners' households are also below the line. On average 58% of the people across the different household compositions live below the subsistence line if one leaves out social assistence altogether. Only the 'only pensioner' households with 40% of the
Conclusion 181
people and the 'only working age adults' households with 23.1% of them below the line, score better than the average. Here also the gender dimension of poverty becomes visible. For over half of the people in skip generation households and for 46.6% in the three generation households a female is heading the household, but the average South African is only likely by 26.4% to live in a household headed by a woman. Similarly obvious is the link between household types, poverty and race, as over 90% of the poorest are ‘african’.
Evaluating different indicators, the various facets of poverty are exemplified: In the poorest quintile, the average consumption per person per month lies below R100. On average just R41 per person per month is spent on food over half of which is used for buying sugar and grain, indicating an insufficient diet which leads to malnutrition and vitamin deficiencies, especially for children. In the second quin-tile, although on average double the amount (R200 for consumption and R78 for food) is available, the standard of living and the quality of the diet are below a reasonable subsistence level. Even people living in the third quintile have on average only a consumption figure of just above the subsistence level and still spend nearly 1/3 of their food consumption on sugar and grain. Only in the fourth and fifth quintiles a real improvement of these indicators can be seen, with consumption figures of nearly R700 and over R2,000 respectively.
This trend continues when evaluating other factors like energy used for cooking, housing, water ac-cess, access to health facilities, employment or education. The majority of the people in the first two quintiles score below the defined minimum in the indicators of the deprivation index used in this the-sis. This is a clear sign of severe poverty and deprivation on a daily basis, not only in terms of con-sumption and diet, but of overall living conditions. Things look better considering type of house, sani-tation facilities and accessed health facilities, where ‘only’ 1/4 to 1/3 score below the minimum. Even in the third quintile the percentage of people who live below the minimum remains relatively high, when looking at this first set of indicators. 50% score below the minimum when it comes to the num-ber of durables, 1/5 when one looks at water access, and around 40% considering the employment and education situation of the household members. It can be concluded that although in the third quintile people are regarded as living above the poverty line, they do face a situation where they are continu-ously deprived of the minimum standard of living.
The poverty situation will be aggravated by the influence of HIV/AIDS. The modelling of the impact of the epidemic showed that by the year 2011 over half of the population will live in households that will be affected by at least one HIV infection, AIDS sick case or AIDS death. The total number of HIV infections will then lie at about 5.8 million and the total number of AIDS dead at 5.5 million. A breakdown into the different age groups points to the fact that working age adults are most affected in terms of total numbers. 25% of this group will be infected with HIV and 16.8% will have died because of AIDS.
Looking at the different types of household that are hit by HIV/AIDS, ‘only children’ households will be most affected. That means in terms of concrete numbers a dramatic increase in the number of chil-dren living on their own and under the subsistence level from about 46, 000 to nearly 900, 000. This is explicable because of the number of AIDS orphans. If this is seen together with the trends unfolding for the other households, it seems questionable whether other families can actually afford to integrate these children if no state support for their subsistence should be provided. 2/3 of the people in the three generation households will be affected and 54.8% in the ‘children with working age adults’ households. The poverty analysis already identified the people living in these household types as the most likely to live in poverty. The average ratio of healthy adults per child and disabled181 falls by 17% to an average of 1. This hints to a situation where households affected by HIV/AIDS have a dou-ble burden: Firstly, they lose a person who otherwise was at least potentially contributing to the in-come of the household, helping in agricultural activities, child care, or other household activities. Sec-ondly, especially if a household member has developed full-blown AIDS, another person will have to take a substantial amount of time off to care for the sick. This is again time and energy which would
181 This includes here the Aids sick cases. Note this is different from the default scenarios of the social assistance pro-
grammes later. There the assumption is that persons with HIV/AIDS do not qualify for a Disability Grant. See page 126
Conclusion 182
otherwise be spent productively for the household. By the year 2011, on average 2.1% of the popula-tion will have developed full-blown AIDS.
The thesis evaluated in how far the existing social assistance programmes can potentially alleviate this situation of severe poverty.182 The results are two-sided: Parts of the system are well intended and targeted towards the poor and help to alleviate extreme poverty. However, the thesis revealed that the system does not only have severe gaps in terms of coverage, but the support given is far from a situa-tions where it can tackle the extent of poverty in such a way as to guarantee a minimum standard of living for the majority of the people in South Africa.
The current system by and large relies on the success of the SOAPs and partly on that of the CSG.183 Overall, about 80% of the people in the two bottom quintiles live in households that receive social assistances. The most positive impact occurs in households where pensioners live on their own as here the poverty gap can be closed by 100%. If one compares the impact of the system on pensioner house-holds with those where pensioners live together with children or working age adults, the following facts become evident: While in both cases the poverty gap can still be closed by about 80%, the per capita transfer drops to just about R160 down from R428 in ‘only pensioner’ households. This shows how far the pensions have to be stretched here. The situation is aggravated in the three generation households where the per capita transfer in the bottom two quintiles is down to R85 as on average over 9 people share the social assistance transfers. Due to this fact, the poverty gap in these households can only be closed by 60%.
It has been shown that for those children living together with pensioners in a household, the poverty situation improves substantially. However, only 1.9% of the children below the poverty line live in ‘children with pensioner’ households and 29.5% in three generation households. By far the majority of children in poverty live together only with working age adults and are therefore not reached by the SOAPs. It becomes clear that while pension money often benefits poor children, pensions are no good at targeting them.
The situation is similar when evaluating the impact of the CSG. While 2/3 of the people in ‘only chil-dren’ and ‘children with working age adults’ households are reached, the amount is so low and dis-tributed to a relatively small number that the effect on the overall poverty situation is limited. The poverty gap for the people concerned can only be closed by about 25% and the per capita transfer lies below R25. Children in the bottom two quintiles are better off living with their grandparents than with their own parents. This situation creates an incentive for parents to send their children to live with the grandparents, often in rural areas, rather than with them.
From the above discussion it becomes clear that the system is strongly biased towards social security provision for the elderly. Children from 0 - 7 years have the limited support of the CSG but there is no provision for children from 7 - 17 years or for working age adults apart from the Disability Grant.184 This finds its expression in the potential share of the social assistance budget for the different age groups. The pensioners, while constituting 5.6% of the population, receive 58.1% of the budget, the children, while making up 44.5% of the population, receive 36.8% if the CSG is fully operational and 5 million children as defined by the current means test are reached.185 The remaining 50% of the population in working age potentially get only 5.2% of the budget leaving this group with virtually no support.
This imbalance of the support for the different age groups, and the fact that the transfers have to be shared amongst many people is reflected in the average closing of the poverty gap and the average per capita transfer. On average the transfers are only able to close the poverty gap by 36.8% in the first two quintiles. For around half of the people in these two quintiles the per capita transfer is below R25
182 The analysis is therefore based on the assumption that all programmes work with a 100% efficiency. 183 One has to keep in mind that the picture painted for the CSG is far too positive as it assumes about 5 million benefici-
aries while at the moment only about 300 000 are reached. 184 Disability grant in this thesis refers to the combination of the ‘Care-Dependency Grant’ and the ‘Disability Grant’. 185 By June 1999, two years after the introduction of the Child Support Grant, only about 300,000 children of the de-
clared 3 million target have been reached.
Conclusion 183
per month and over 1/3 of the people in these quintiles receive less than R50 per person per month. Only around 12% have a transfer exceeding R100.
This nature of the system also makes it ill equipped for dealing with the impact of the HIV/AIDS epi-demic in years to come. First of all, the support given to the households is so limited that those af-fected by the epidemic will not be able to cushion the additional burden their households will have to carry. Furthermore, the group which is most affected by HIV/AIDS, namely working age adults, are left with virtually no support which results in a severe increase of the number of people without any income. The expected consequence of this is a worsening of the overall poverty situation for South Africa, if no drastic measures are taken.
In conclusion one can say that the strength of the current system lies in its ability to put most needed but still very much limited cash resources into the poorest households in South Africa. By doing so severe poverty and deprivation are alleviated. However, given the severity of the poverty situation in South Africa and the limitation of the support, the system is far from being able to break the poverty cycle and from pushing people above the subsistence level. Many people lack the adequate resources to meet their basic needs. In addition, the system mainly relies on the support for the elderly, leaving children and working age adults with little support and dependent on the SOAPs as well. This gap in coverage is severe and will be aggravated by the impact of the HIV/AIDS epidemic as exactly the latter groups are most affected and in need of assistance. Furthermore, the analysis is based on the assumption that the system works with a 100% efficiency and therefore a very positive picture has been painted. However in reality, the system has severe administrative problems to reach the intended beneficiaries, not only of the CSG, but in certain areas also those of the SOAPs.
This analysis highlights the need for a change. The commitment of the democratic government in its White Paper for Social Welfare to a comprehensive social security system creates a good starting point for this change, as the underlying approach of the White Paper is based on the idea of using ‘social welfare’ in a wider developmental context. The main feature of this ‘developmental approach’ is that social development and economic development are interdependent and mutually reinforcing - that the one cannot occur without the other. In this concept, social security does not only have the traditional protective task to insure and guard people against life-cycle contingencies, as it normally does in de-veloped countries. But in addition, social security has to be used in a promotional way that alleviates poverty and enhances the normal living conditions of the people to enable them to meaningfully take part in the economic sphere. Social security is hence seen as an essential investment furthering suc-cessful and sustainable economic growth. Furthermore, taking account of the South African context, social security is regarded as a mechanism for active redistribution and by doing so plays a stabilising role in the context of great inequality. To realise this goal, direct state actions and an interventionist role of the state are called for.
This approach is informed by international thinking on social development. For this international per-spective, it is useful to evaluate especially other countries’ social security systems with a special focus on their potential to alleviate poverty. The results of these comparative studies are two-sided. On the one hand there are important lessons to be learnt. On the other hand one has to realise that South Af-rica is in a very special situation which requires completely new programmes for which the develop-mental approach provides a useful framework.
The comparative sections showed that while the systems vary considerably, in most cases social secu-rity systems in other parts of the world were created in a situation of economic transformation with a high prosperity and high levels of employment. Social security mainly had the role of cushioning the effects of income losses in certain contingencies which were often created through the transformation process. This is true for capitalist countries as well as for the East Asian examples and also for parts of the LAC systems. These circumstances resulted in systems which were mostly social insurance based and where the protective rather than the promotional tasks were of importance. The systems are de-signed for and rely on an active labour force. South Africa and other developing countries are in a different situation. The majority of people are impoverished already. The economy suffers from struc-turally high unemployment rates with a huge informal sector and competes on a global market for a niche where to create jobs. Social security in the South African situation asks for a contribution to-wards integrating the long-term poor into the economic sphere. This directly contrasts the situation in Europe and America where the focus was on the construction of security measures against the loss of
Conclusion 184
earnings. The situation poses a particular challenge for the design of innovative systems which move away from the focus on traditional social insurance schemes. The systems will have to be able to meet these needs of the population and must be financially sustainable.
While the starting-point and the circumstances differ substantially, there are nevertheless some useful lessons which can be learnt from the various systems around the world. The experience, in particular of capitalist countries, makes it evident that social security is an important tool for social stability and for the creation of more egalitarian societies. However, the same countries teach us that social security has to be integrated into the economic sphere. Social security should be designed in a way as to proac-tively seek to empower people to become economically active. The creation of disincentives to seek employment has to be avoided. Finally, social security should be stable also in times of social crises and recession.
The East Asian countries are characterised by a strong involvement of centralised states in the eco-nomic development, like a land reform and the building of infrastructure. The government actions resulted in a ‘relatively egalitarian pattern of income distribution compared with other industrialising regions’, thus fulfilling an important aspect of the developmental approach. Furthermore, they fostered economic growth with the help of massive foreign investment leading to a situation of nearly full em-ployment where the job of at least the breadwinner was guaranteed, and so often took away the imme-diate need for social security measures. However, in the countries looked at, the state in the social security schemes by and large took over the role of a regulator rather than that of a central provider. The schemes created are often fragmented and have a limited capacity of risk-sharing and pooling of income. While these arrangements seemed sufficient during times of economic growth, the recent economic crisis revealed severely negative effects on poverty levels if social security measures are entirely based on employment. The need for ex-ante social security measures, not only to protect the people during economic crises but also to reduce their negative consequences, has since been ac-knowledged.
The LAC and other developing countries face circumstances similar to those of South Africa and pre-sent interesting case studies. Their colonial history has left them with incomplete and fragmented sys-tems which exclude the unemployed and the large informal sector. Chile and Brazil took two funda-mentally different routes to reform their systems, both with mixed results. The advantages and disad-vantages of these reforms are of interest here. Chile opted for a neo-liberal reform by privatising the social insurance sector for the higher income earners and by doing so it established a two-class system. In general people have to cover themselves through an individual account system whereas the state only steps in to provide very limited support for the un - or underinsured. The assessment of the re-form is mixed: The private system accumulates large amounts of capital for investment and the focus on basic health care in the public system had positive effects. However, the absence of pooling of in-come and risk sharing make redistributive measures impossible and the financing of the public provi-sions precarious. While the coverage for those in stable formal employment is very good, poverty and inequality are expected to grow as public provisions show severe limitations.
Brazil in contrast chose a universalistic and redistributive basis for the reform. It managed to cover a large rural sector through taxing urban employers and agricultural products. Furthermore, every citizen is entitled to a ‘sufficient’ pension and health care. However, severe problems in the infrastructure and the administration, a lack of financial resources, the legacy of patronage and existing high inequalities severely hamper the success of the system.
Given these examples, South Africa has to be aware that the going beyond traditional social insurance schemes poses a particular challenge. The system must have a sufficient infrastructure and an effective administration to fulfil its general aims of providing basic services and focusing on the reduction of poverty and inequality. At the same time, the costs and the benefits of such a system have to be kept in mind. On the one hand the macro-economic environment has to be conducive, balancing the costs between the state and the economy. On the other hand it is clear that a well functioning social security system is indispensable for successful economic growth and development. This is in particular true in a situation of high poverty levels and high inequality. Furthermore, the system has to be designed in a way to make people economically active and to create incentives for becoming productive.
Conclusion 185
8.3.) Towards a comprehensive strategy There is currently a historic chance for South Africa, given the strong political will of its leadership to put the fight against poverty first, to prioritise expenditure on poverty alleviation and to direct invest-ment towards the poor. Any strategy has to be evaluated against the background of its developmental potential to cut the cycle of poverty to empower people to become economically active. Therefore it has to be simple and fair, as well as stable in times of crises, both in terms of its financial affordability as well as of the quality of its support.
The different options which have been tested emerged out of the public debate during the last years. Proposals came from various role players across the political spectrum indicating that the public feels an urgent need for action. As politically conflicting role players as COSATU and the DP have made inputs into the debate. The financial amounts involved in the options were either mentioned in the debate or chosen by the author for easy comparison. The amounts are not considered to be the mini-mum required for subsistence, but the results are designed to give an overview from which one can work. The options are as follows:
• A Basic Income Grant of R100 (R50) paid to all citizens except those already receiv-ing social assistance. In practice the grant would be calculated per person and paid out preferably to the primary care-giver in the household.
• An Unemployment Benefit of R200 paid according to a means-test. The means-test is based on a broad definition of unemployment and a personal income of below R800 a month of the person in question.186
• A Household Grant of R200 per household regardless of the number of people in the household, the income of the household, or already existing grants.
• An extension of the CSG to children from 7 to 17 years. The means test is kept the same as for the existing CSG: Children whose care-giver, and where applicable the spouse, have a (combined) income of R800 in urban areas and R1100 in rural areas or who live in an informal dwelling are eligible.
First of all, it has become clear that all of the options achieve a significant improvement compared with the potential of the current system. However, the different options approach the problems and the gaps of the current system from different angles and hence with varying success.
All of the programmes put significantly more money into poor households than the current system. A Basic Income Grant of R100 nearly triples the average per capita amount going into the households, from R46 under the current system to R120. The other options come near to doubling the amount. The Unemployment Benefit puts R71 per person into the households, the extended CSG R75, and the Household Grant R80. A Basic Income Grant of R50 increases the amount to R83. These amounts have a profound effect on the closing the poverty gap for the population in these households. Both Basic Income Grant options are the most effective options, with an average closing of the poverty gap of 80% and 63.4% respectively. Both, the Household Grant and the extension of the CSG close the poverty gap on average by just about 60% and the Unemployment Benefit by 53%. The current system is only able to close the poverty gap on average by 36.8%.
If one compares the potential costs with these poverty indicators, the following findings are of interest: The two targeted programmes, the Unemployment Benefit and the extension of the CSG, cost about R10 billion each.187 However, the latter programme puts more money into the pockets of the poor and is able to close the poverty gap significantly better than the Unemployment Benefit. This shows that
186 For the exact definition of ‘unemployment’ see ‘4.3.1.) Defining employment and unemployment rates’ 187 It is important to remember that the figures calculated for the potential costs are as such not an adequate approxima-
tion of the budget amounts needed for the programmes, as they are based on the assumption that the programmes work with a 100% capacity. Therefore the real costs will be significantly lower, especially during the first years. In order to come from the calculated potential costs to a realistic calculation of the budget needed, one would have to in-clude potential administrative capacities, potential take-up rates and one would have to allow for a phasing-in period during the first years.
Conclusion 186
support for children is preferable in terms of poverty alleviation to support for the unemployed. This analysis revealed that in the South African context the unemployed are not congruent with the poor and any new programme should take account of this fact. Hence, targeting by means of an unemploy-ment definition in the South African context is not an adequate measure to reach the poor.
The extension of the CSG is also favourable in comparison to the Household Grant. Although the Household Grant, with nearly R22 billion, would need over double the amount of an extended CSG, both reduce the poverty gap by about 60%. This deficiency of a Household Grant to target the poor is also evident if compared with a Basic Income Grant of R50. While the Basic Income Grant even is considerably cheaper, the per capita transfer as well as the reduction of the poverty gap is higher. It hence becomes clear that the Household Grant by discriminating against larger households, which were shown to be in poor rural areas, is in its tendency biased in favour of middle and upper class households and therefore not good at targeting the poor.
Both Basic Income Grant options are more expensive than the extension of the CSG or the Unem-ployment Benefit. The R100 option would cost nearly R40 billion, however, if self-targeting is as-sumed, this amount goes down to R30 billion. The R50 option would cost nearly R20 billion and R15 billion if self-targeting is assumed. However, they are much more favourable than any of the other options when looking at their poverty alleviation capacities, developmental potential, incentive struc-ture as well as the administration required. They do not only perform better in terms of the closing of the poverty gap and the per capita transfer, but they are also able to target better and in a fairer way. By doing so, a Basic Income Grant takes account of the various living arrangements in South Africa without favouring one or the other, avoiding incentives for people to change their living arrangements. This is of particular importance for the impact of the HIV/AIDS epidemic as here people should be able to make their arrangements according to their needs and not according to the payment of social assistance.
The trouble with the targeted programmes is that each of them approaches the gaps in the current sys-tem from only one angle: The Unemployment Benefit by targeting the adult population, the extension of the CSG by targeting the children. By doing so, they improve the situation of the target group, how-ever, they ignore the needs of other groups. The Unemployment Benefit improves the situation of the ‘only working age adults’ and the ‘children with working age adults’ households. However, even here the coverage is far from comprehensive with 47% of people in the first household type and 13.3% of the latter left without support. The Basic Income Grant options do not only reach all people in these households but achieve a far higher reduction of poverty across the households types.
The situation is similar when looking at the extension of the CSG. While this option reaches the households where children live, poor working age adults are completely left without any support (800,000 in the first two quintiles). Even in the households with children, a social reality for 13.5 mil-lion South Africans below the poverty line, both Basic Income Grant options score much better in terms of poverty reduction than a R100 targeted CSG.
This situation is further reflected in the per capita transfer into the different quintiles. The Basic In-come Grant guarantees that everybody receives at least R100 and nearly 40% in the first and 30% in the second quintile have more than a R100 transfer. This constitutes a dramatic improvement of the situation, as the poverty analysis revealed that people in the first quintile on average consume less than R100 per person per month. A Basic Income Grant of R50 leaves none with less than R50 and nearly half of the people in the first three quintiles receive between R50 and R100. Under the Unemployment Benefit and the extension of the CSG, the situation looks different. First of all, there is a considerable number of people not having any transfers: 6% in the first, 15% in the second and 29% in the third quintile receive no transfers at all with the Unemployment Benefit, leaving between 40% and 60% in these quintiles with a per capita transfer of under R50. The extension of the CSG is in this regard slightly better targeted: While in all three quintiles there are also people with no transfers, more than under the Unemployment Benefit receive at least between R50 to R100. Looking at the Household Grant, the fact that the money has to be shared amongst more people, only around 20% in the first three quintiles receive more than R100.
The overall greater potential of the Basic Income Grant and the disadvantages of the other options also become apparent when taking account of the HIV/AIDS epidemic. The gaps in coverage and the tar-
Conclusion 187
geting of certain household types by the other options have acute consequences for the support of peo-ple affected by HIV/AIDS. The model estimated an increase of about 7 million people living below the subsistence level if one takes account of the impact of the epidemic in 2011 as compared to the 1996 figures. Children and working age adults are most affected by it. Nearly 25% of the working age adults are infected with HIV by 2011 and 16.8% have died because of AIDS. 12.4% or over 800,000 children between the age of 0-4 have died of AIDS while they show an infection rate of 4.6%. It was shown that the households with working age adults have to deal with a situation of decreasing incomes and earnings due to people becoming sick and unable to work. At the same time the households will face increasing medical expenses, like consultation fees, medication and transport to health facilities. Looking at the children, there is a dramatic increase in the number of children living on their own and under the subsistence level from about 46,000 to nearly 900,000.
What is hence most critical when taking account of HIV/AIDS is the quality of support given to chil-dren and working age adults. Neither the current system, nor the Unemployment Benefit, nor the ex-tension of the CSG or the Household Grant are equipped to do that in an even near to satisfactory way.
The current system is only able to provide R33 for the ‘only children’ households below the subsis-tence level, R6 for the ‘only working age adults’ households and R22 for the ‘children with working age adults’ households. If people with HIV/AIDS received a Disability Grant, the cost of the current system would explode with an increase of over 150% to R43.8 billion.188 However, a Basic Income Grant of R50 would be cheaper than that and much better equipped to deal with the epidemic, as the average closing of the poverty gap would be higher. Furthermore, while the Disability Grant puts more money into the households as long as the affected person is still alive, the households falls into severe poverty after the breadwinner and the recipient of the social assistance grant has died and the support lapses. Further, poverty would not directly be targeted and thereby perverse incentives in favour of the epidemic are even possible. The support of a Basic Income Grant, however, would remain for the rest of the household providing a safety net they can count and build on. The Disability Grant option would after all be very difficult to administer. Not only that people will probably be afraid to register as HIV positive and as a consequence to be deprived of their support. But unfortunately the system would have to deal with high fluctuation, making it complicated and cost-intensive to administer.
The Household Grant has once again a targeting problem regarding the poorest and bigger households: While pensioners living on their own receive nearly R600, the average transfer across the different household types is just over R90, and working age adults with children receive less than R60 per per-son. Looking at the Unemployment Benefit and the extension of the CSG, the shortcomings of each of them become apparent: The extended CSG is relatively good at reaching ’children’ and the Unem-ployment Benefit at reaching some ‘adults in working age’. However, they not only leave out the groups which are not targeted but even the quality of support for the target group is not as good as under a Basic Income Grant. The extended CSG provides nearly R100 to the ‘only children’ house-hold, however, the concentration on the children leaves the ‘only working age adults’ household with only R12 per person and the ‘children with working age adults’ with under R60. The Unemployment Benefit is only able to provide adults on their own with R80. The figures drops further to R47 per per-son for those adults living with children, and to R37 for ‘only children’ households. As such neither the Unemployment Benefit nor the extended CSG is equipped to address the severe effects of the HIV/AIDS epidemic.
A Basic Income Grant of R100 would be best equipped to deal with the crisis. The closing of the pov-erty gap capacity remains stable at around 80%, and the grant targets the age groups across the board. In all household compositions are therefore at least R100 per person available. The quality and the nature of the continuous support as well as its independence from the living arrangements makes the support relatively crisis-proof. The grant creates a safety net for the household to remain economically functional, a goal of the highest importance for social security payments. So, the grant does not only prove helpful during times of crisis, but helps people to break out of the poverty cycle before the crisis - a prerequisite for the fight against HIV/AIDS. A Basic Income Grant therefore also constitutes an important part of the strategy for fighting the spread of HIV/AIDS.
188 Besides the financial aspect: given current administrative requirements for the grant this could lead to a break down
of the social assistance system.
Conclusion 188
The administrative consequences of a programme based on a means test are severe. However, they are avoided by a Basic Income Grant. Even a Household Grant needs some testing of the living arrange-ments as a ‘household’ has to be identified. The current administration has not even been able to ad-minister the means test for the CSG in an effective way, leaving millions of poor children without their legitimate support. This experience makes it clear that, given the current infrastructure and administra-tive capacity in South Africa, any option requiring a means test is in danger to overload the admini-stration and thereby to jeopardise the success of the whole programme. Even for a Basic Income Grant it is of utmost importance to ensure effective delivery by improving the administration or finding in-novative approaches in order not to jeopardise the success like in the case of the Brazilian system. However, a universal grant requires far less in terms of personnel, building of infrastructure, training or time, making it by far the cheapest options. A universal grant has the further advantage of cutting out the possibilities of corruption as everybody qualifies. This is another serious consideration given the current problems in South Africa.
Going hand in hand with the means test is the question of incentives. Any means test by definition creates desired and undesired incentives. People who fall just below the cut-off point of the means test might be discouraged to change their situation in order not to lose the grant. This is not only true for the income situation, but also for the status of being ‘unemployed’ as tested under the Unemployment Benefit, or for the living arrangements tested under the Household Grant. The Household Grant cre-ates an incentive to break up a household in order to claim more grants. An Unemployment Benefit might create the perverse incentive to remain or even become unemployed in order to receive the benefit. This is an incentive which definitely has to be avoided. A Basic Income Grant shows none of these negative incentives.
The arguments in favour of a means test are to keep the costs lower and to avoid leakage to the non-poor. It was shown that there are other viable options to effectively target the poor. First of all, a Basic Income Grant option can promote self-targeting by making it clear that while everyone is eligible for the grant, it is meant as a development grant for those living in poverty. Assuming that none of the people in the fifth quintile and only half of those in the fourth would then claim the grant, the costs could be reduced by at least 1/4 without changing the positive impact of the grant on poverty reduc-tion.
Another possibility is to use the tax system to claw back some of the money. Two options were tested here: An income tax of 17.5% for everybody earning above R30,000 a year and a tax on consumption of 6.5% on the total monthly consumption of the households.189 The rationale behind these options is that on the SALDRU data both recover the same total amount of R15 billion a year which allows for an easy comparison of the two.
As expected, an income tax is more progressive than a tax on consumption. The very poor are not at all affected by the income tax. However, the analysis revealed that fewer people are pushed over the poverty line. The third and the fourth quintile receive less money and the top quintile would in its net-effect pay more for the Basic Income Grant than it benefits. This shows that the Basic Income Grant combined with an income tax can effectively reclaim money from those who are not intended as bene-ficiaries and that it can do so without a means test which is costly and administratively difficult. One should, however, be aware that one of the dangers of raising the income tax lies in the possible in-crease of tax evasion and avoidance which would have to be dealt with.
A tax on consumption is more problematic in terms of its redistributive capacities as on its own it is a regressive tax. However, in combination with a Basic Income Grant it can be argued that a tax on con-sumption is, in its tendency, progressive. This is based on the fact that the well-off consume more and hence pay more tax and by doing so finance the Basic Income Grant. The poor, in contrast, although they also pay the tax, have a net benefit because of the payment of the Basic Income Grant. This posi-tive scenario of an increase in VAT is, however, dependent on the effective delivery of the grant as otherwise the situation of the poor would worsen. It is also clear that a Basic Income Grant on its own 189 The microsimulation model cannot conclusively model neither the income tax nor the VAT as the data does not allow
to model the complete tax base. Therefore the model is not able to give an exact answer on how to finance the Basic Income Grant and which tax rate is required. However, what is attempted here is to show the impact of the different options in terms of the distribution effects focused on the poverty situation.
Conclusion 189
is more redistributive and pushes more people over the poverty line than in a combination with a VAT increase. What does speak in favour of the VAT increase in comparison to the income tax is the fact that VAT cannot be avoided.
This discussion of the costs for an extension of the current system raises the question whether South Africa can at all afford any new social programme of this scale. It is, for example, argued that an in-crease in income tax can potentially discourage economic activities and new investment. The same arguments are brought forward against reprioritising the budget or increasing the deficit in favour of social expenditure. However, one has to be aware that the persistence of poverty and high inequality, high crime rates, and an impending AIDS epidemic likewise will have serious negative consequences for economic growth and investment. There is international consensus that the reduction of poverty is a prerequisite for successful economic development. The developmental social welfare approach and the comparative sections have endorsed this view. Furthermore, they pointed to the important role social security has to play not only in reducing poverty, but in supporting economic development. It should further be considered to link any new social programme to economic growth, so that the system does not grow faster than the economy but that the system will not be eroded by inflation either.
All the options discussed here would improve the current poverty situation whereas it has been shown that the Basic Income Grant performs best. The same is true when looking at the capacities of the dif-ferent options to support economic growth and economic activities in a broader context. Factors that are of importance to make people economically active and productive are the provision of income security and an improvement of the health status. The Basic Income Grant provides the most stable income source for people of working age. By doing so, it increases their opportunities to break out of the vicious circle of poverty and to take part in the economy. None of the other options is able to reach so many of the people with an income they finally can count on. Even the Unemployment Benefit which targets the adult population exclusively leaves nearly 1.8 million people living in ‘children with working age adults’ households without support. Furthermore, it creates the perverse incentive not to join the formal labour market as then the benefit would be lost. Social security also increases produc-tivity by improving the nutritional well-being of the people. The Basic Income Grant of R100 doubles the amount available for consumption in the first quintile, going a long way to improve the overall diet. The support for children is of particular importance. While in theory that would speak in favour of the extension of the CSG, the model showed that a Basic Income Grant of R50 puts even more money into ‘children with working age adults’ households. The best result, improving the health status of the entire population including the children, can therefore be achieved by a universal grant.
An even more direct and measurable impact in the economy of cash transfers into households is the increase and stabilisation of demand, consumption and savings. Local and especially rural markets benefit greatly from these transfers as they have the potential to kick-start the economy in the under-developed rural areas. Again, the Basic Income Grant, by providing a universal, stable, and continuous income source, has the highest developmental potential as the people can count on it and better plan their economic activities. Furthermore, from an administrative point of view it is definitely the easiest and most effective way of putting cash into these areas.
Last but not least, the reduction of inequality has also been identified as a prerequisite for economic growth and investment in developing countries. Given the fact that South Africa has one of the highest levels of inequality in the world, a reduction is imperative. The analysis of the change of income dis-tribution achieved by the different options revealed that both Basic Income Grant options perform best at reducing inequality and ensuring that nobody is left without any income.
Abstract 190
Abstract The thesis investigates the potential impact of social assistance on poverty in South Africa. It analyses the current social assistance system, its potentials and its gaps, as well as options for extending social assistance to those poor who are not included in the current provisions. The impact of social assistance on various social, economic and developmental factors is evaluated.
The results are two-fold: The SOAPs and the CSG are potentially effective in reaching some of the poor and helping to alleviate extreme poverty. However, as the system relies mainly on the support for the elderly, children and working age adults are left with little or no support. It is evident that the cur-rent support, both in terms of coverage and quality, is far from being able to break the poverty cycle effectively.
On average the transfers, if the system is to work with 100% efficiency, are only able to close the pov-erty gap by 36.8% in the first two quintiles. For around half of the people in these two quintiles the per capita transfer is below R25 per month.
It was further shown that the current system is ill equipped to deal with the HIV/AIDS epidemic. The support given is so limited that the current system is not able to cushion the additional burden the af-fected households have to carry. Furthermore, the group most affected by HIV/AIDS, namely working age adults, are left with virtually no support, which results in a severe increase of the number of people without any income. The expected consequence is a worsening of the overall poverty situation, if no drastic measures are taken.
This analysis highlights the need for a change. International experience has shown that a well func-tioning social security system is indispensable for successful economic growth and development. This is in particular true in a situation of high poverty levels and high inequality. Further, the system has to be designed in a way that enables people to become economically active.
Against this background the following options were analysed as an addition to current social assis-tance programmes: A Basic Income Grant, an Unemployment Benefit, a Household Grant, and an extension of CSG.
The Basic Income Grant would effectively reduce poverty across the various household types. While a universal grant at first sight is relatively expensive, it was shown that the money paid to the rich can effectively be recovered through self-targeting and taxation without losing the efficiency of this grant in combating poverty. Even more important, a Basic Income Grant, by avoiding the negative conse-quences of poverty traps created through means-tests, is an effective and developmental tool to assist people to get economically active, by providing desperately needed cash resources, without punishing their own economic activity.
In contrast the analysis revealed that targeting by means of an unemployment definition is not an ade-quate measure to fight poverty. As well, a Household Grant tends to be biased in favour of middle and upper class households and therefore it is not good at targeting the poor.
While, next to the Basic Income Grant, the extension of the CSG scores highest in reaching poor chil-dren, poor working age adults are not reached. However, it seems imperative to address also this sec-ond gap of the current system, especially with the HIV/AIDS epidemic causing the greatest loss of income for this group.
Appendix 191
Chapter 9: Appendix Sum of RS_CSP96 RA_QUINTQUINTILE 1 2 3 4 5 6 7 8 9 10
Accuracy rate to identify poor and non-poor: 95%(5th and 6th ranking group are not considered to be an error) Table 9-1: Error of inclusion of the poor if poverty is measured by expenditure quintiles vs. deprivation index Sum of RS_CSP96 RA_QUINTIncome Quintile 1 2 3 4 5 6 7 8 9 10
Accuracy rate to identify poor and non-poor: 90%(5th and 6th ranking group are not considered to be an error) Table 9-2: Error of inclusion of the poor if poverty is measured by income quintiles vs. deprivation index
Appendix 192
9.1.) Basic Income Grant R50
only child.
child. + work. age
adults
child. + adults in pen. age
child. + work. age adults + adults in pen. age
only work. age adults
work. age adults + adults in pen. age
only adults in pen. age Total
SOCIAL ASSISTANCE - POVERTY Total No. of people living in the bottom two quintiles: 32,280 13,548,616 402,237 6,366,098 808,943 345,796 55,553 21,559,522 % of people living in the bottom two quintiles: 0.1% 62.8% 1.9% 29.5% 3.8% 1.6% 0.3% 100.0% Total No. of people living in HH receiving no social assistance (bottom two quintiles): 0 0 0 0 0 0 0 0 % of people living in HH receiving no social assistance (bottom two quintiles): 0.0% 0.0% 0.0% 0.0% 0.0% 0.0% 0.0% 0.0% Average No. of people living in the HH (bottom two quintiles): 4.2 7.4 4.7 9.3 2.7 3.7 1.4 7.6 Average No. of people employed in the HH (bottom two quintiles): 0.0 1.0 0.0 0.8 1.0 0.6 0.0 0.9 Average No. of people receiving social assistance (bottom two quintiles): 4.2 7.4 4.7 9.3 2.7 3.7 1.4 7.6 Average % closed of the poverty gap by social assistance (bottom two quintiles): 54.2% 55.5% 91.1% 78.1% 41.8% 86.0% 100.0% 63.7% Average per capita social assistance transfer (bottom two quintiles): R 61 R 62 R 179 R 118 R 57 R 192 R 428 R 83 Average per capita social assistance transfer through old SoSe payments (bottom two quintiles): R 0 R 0 R 0 R 0 R 0 R 0 R 0 R 0 Average per capita social assistance transfer through SOAP (bottom two quintiles): R 0 R 0 R 135 R 63 R 0 R 157 R 428 R 25 Average per capita social assistance transfer through CSG (bottom two quintiles): R 23 R 20 R 18 R 18 R 0 R 0 R 0 R 18 Average per capita social assistance transfer through DG (bottom two quintiles): R 0 R 2 R 1 R 4 R 8 R 3 R 0 R 3 Average per capita social assistance transfer through BIG (bottom two quintiles): R 39 R 40 R 25 R 33 R 49 R 31 R 0 R 38 Average per capita social assistance transfer through UB (bottom two quintiles): R 0 R 0 R 0 R 0 R 0 R 0 R 0 R 0 SOCIAL ASSISTANCE - ECONOMY Total number of people reached by social assistance programmes: old system 0 0 0 0 0 0 0 0 SOAP 0 0 176,368 1,334,491 0 295,052 239,593 2,045,503
Appendix 193
CSG 11,036 3,652,533 94,157 1,411,011 0 0 0 5,168,737 DG 0 109,083 737 76,248 30,131 3,813 0 220,011 BIG 41,962 22,245,008 274,616 5,720,602 4,140,883 603,310 122,999 33,149,379 UB 0 0 0 0 0 0 0 0 HH 0 0 0 0 0 0 0 0 Total 52,997 26,006,623 545,879 8,542,352 4,171,014 902,175 362,592 40,583,630 Total annual transfers by social assistance programmes (in millions): old system R 0 R 0 R 0 R 0 R 0 R 0 R 0 R 0 SOAP R 0 R 0 R 893 R 6,690 R 0 R 1,440 R 1,072 R 10,096 CSG R 13 R 4,383 R 113 R 1,693 R 0 R 0 R 0 R 6,202 DG R 0 R 532 R 4 R 392 R 145 R 20 R 0 R 1,092 BIG R 25 R 13,347 R 165 R 3,432 R 2,485 R 362 R 74 R 19,890 UB R 0 R 0 R 0 R 0 R 0 R 0 R 0 R 0 HH R 0 R 0 R 0 R 0 R 0 R 0 R 0 R 0 Total R 38 R 18,262 R 1,175 R 12,207 R 2,629 R 1,822 R 1,146 R 37,280 Total annual transfer to quintiles (in millions): 1. Qu. 5.5 5,439.6 467.6 5,357.6 218.6 395.9 95.3 11,992.8 2. Qu. 18.3 4,614.7 396.9 3,677.1 339.3 400.5 190.0 9,670.3 3. Qu. 10.6 3,785.1 235.7 2,246.3 465.9 347.0 232.4 7,400.6 4. Qu. 4.1 2,580.3 63.8 724.9 727.0 350.9 245.9 4,702.7 5 . Qu. 0.0 1,869.1 7.3 225.4 885.7 326.3 389.1 3,697.4 Total annual transfer rural / urban. (in millions): rural 36.5 9,560.7 938.1 8,080.4 800.4 803.6 433.4 20,694.5 urban 2.0 8,702.2 231.9 4,126.2 1,835.1 1,013.9 725.0 16,659.0 Total annual transfer by race (in millions): "african" 38.5 14,259.2 1,107.3 11,142.8 1,705.2 1,142.3 574.6 30,199.2 "coloured" 0.0 1,845.1 55.9 786.7 189.7 191.4 35.6 3,115.0 "indian" 0.0 492.1 5.1 123.0 76.0 118.8 4.6 809.9 "white" 0.0 1,724.8 4.6 176.9 670.4 367.9 536.5 3,459.1 Table 9-3: Social assistance poverty and the economy – Basic Income Grant (R50) + the potential current system
Appendix 194
a g e 0 -1 7 a g e 6 0 f . / 6 5 m . -a g e 1 8 -5 9 f . / 6 4 m .
P o t e n t i a l c o v e r a g e a c c o r d in g t o q u in t i l e s
P o t e n t ia l b u d g e t s h a r e P o t e n t ia l b u d g e t s h a r e P o t e n t ia l b u d g e t s h a r e
3 7 . 8 % 3 4 . 8 % 2 7 . 4 %
P e r c e n t a g e o f p o p u la t io n P e r c e n t a g e o f p o p u la t io n P e r c e n t a g e o f p o p u la t io n
4 4 . 5 % 4 9 . 9 % 5 . 6 %
Figure 9-1: Potential coverage by age group and quintile – Basic Income Grant (R50) + the potential current system
Appendix 195
0%0%
15%
57%
27%
0% 0%0%
28%
50%
21%
1% 0%0%
45%
37%
17%
1% 0%0%
69%
20%
10%
1% 0% 0%
88%
6%5%1%
0%
10%
20%
30%
40%
50%
60%
70%
80%
90%
100%
R25
0 -R0
R25
-50
R50
-100
R10
0 -25
0
R0 -
25
1 . Q u in tile 2. Q u in tile 3. Q u in tile 4. Q u in tile 5. Q u in tile
R25
0 -R0
R25
-50
R50
-100
R10
0 -25
0
R0 -
25
R25
0 -R0
R25
-50
R50
-100
R10
0 -25
0
R0 -
25
R25
0 -R0
R25
-50
R50
-100
R10
0 -25
0
R0 -
25
R25
0 -R0
R25
-50
R50
-100
R10
0 -25
0
R0 -
25
Figure 9-2: Potential per capita social assistance transfer – Basic income grant (R50) + the potential current system
Appendix 196
3 2 %
2 6 %
2 0 %
1 3 %1 0 %
0 % 0 % 0 % 0 % 0 %
4 0 %
2 2 %
1 4 %
8 % 8 %
4 2 %
3 1 %
1 6 %
5 %2 %
1 2 %
2 3 %
1 7 %
5 %2 %
6 %
2 4 %
5 3 %
8 1 %
8 8 %
0 %
1 0 %
2 0 %
3 0 %
4 0 %
5 0 %
6 0 %
7 0 %
8 0 %
9 0 %
1 0 0 %
Pot
enti
al b
udge
t sha
re
Perc
enta
ges
of p
eopl
e w
hose
po
vert
y ga
p is
pot
enti
ally
re
duce
d by
:
50%
to 9
9%
100%
-
0% to
49%
0%
B o tto m quintile
not b
elow
sub
s. le
vel
Pote
ntia
l bud
get s
hare
Perc
enta
ges
of p
eopl
e w
hose
po
vert
y ga
p is
pot
enti
ally
re
duce
d by
:
50%
to 9
9%
100%
-
0% to
49%
0%
2 . qu in tile
not b
elow
sub
s. le
vel
Pote
ntia
l bud
get s
hare
Perc
enta
ges
of p
eopl
e w
hose
po
vert
y ga
p is
pot
enti
ally
re
duce
d by
:
50%
to 9
9%
100%
-
0% to
49%
0%
3 . qu in tile
not b
elow
sub
s. le
vel
Pote
ntia
l bud
get s
hare
Perc
enta
ges
of p
eopl
e w
hose
po
vert
y ga
p is
pot
enti
ally
re
duce
d by
:
50%
to 9
9%
100%
-
0% to
49%
0%
4 . qu in tile
not b
elow
sub
s. le
vel
Pot
enti
al b
udge
t sha
re
Perc
enta
ges
of p
eopl
e w
hose
po
vert
y ga
p is
pot
enti
ally
re
duce
d by
:
50%
to 9
9%
100%
-
0% to
49%
0%
T op quin tile
not b
elow
sub
s. le
vel
Figure 9-3: Potential reduction of poverty gap – Basic Income Grant (R50) + the potential current system
Appendix 197
0
500,000
1,000,000
1,500,000
2,000,000
2,500,000
per a
dult
eq.
R 1
2
R 1
7
R 2
5
R 3
6
R 5
3
R 7
8
R 1
14
R 1
67
R 2
44
R 3
57
R 5
23
R 7
65
R 1
,121
R 1
,641
R 2
,402
R 3
,517
R 5
,149
R 7
,538
R 1
1,03
7
R 1
7,77
5
R 2
6,02
5
R 5
0,71
5
Figure 9-4: Total monthly income distribution per adult equivalent – Basic Income Grant (R50) + the poten-tial current system (dotted line = only potential of the current social assistance system)
Appendix 198
9.2.) HIV/AIDS and the various options
only child.
child. + work. age
adults
child. + adults in pen. age
child. + work. age adults + adults in pen. age
only work. age adults
work. age adults + adults in pen. age
only adults in pen. age Total
SOCIAL ASSISTANCE - HIV/AIDS Total No. of people living below subsistence level: 898,187 18,392,742 860,256 8,588,014 1,425,478 634,142 211,976 31,010,795 % of people living below subsistence level vs. total: 87.1% 64.0% 92.1% 85.1% 31.5% 61.5% 48.0% 66.3% % of people living in the HH types (below subsistence level ): 2.9% 59.3% 2.8% 27.7% 4.6% 2.0% 0.7% 100.0% Total No. of people living in HH receiving no social assistance (below subsistence level): 0 0 0 0 0 0 0 0 % of people living in HH receiving no social assistance (below subsistence level): 0.0% 0.0% 0.0% 0.0% 0.0% 0.0% 0.0% 0.0% Average No. of people living in the HH (below subsistence level): 3.4 6.6 4.7 8.7 2.3 3.2 1.5 6.7 Average No. of people employed in the HH (below subsistence level): 0.0 0.7 0.0 0.6 0.6 0.4 0.0 0.6 Average No. of people receiving social assistance (below subsistence level): 3.4 6.6 4.7 8.7 2.3 3.2 1.5 6.7 Average % closed of the poverty gap by social assistance (below subsistence level): 67.0% 74.8% 97.3% 90.5% 59.1% 92.3% 100.0% 79.4% Average per capita social assistance transfer (below subsistence level): R 101 R 102 R 205 R 155 R 105 R 236 R 430 R 124 Average per capita social assistance transfer through old SoSe payments (below subsistence level): R 0 R 0 R 0 R 0 R 0 R 0 R 0 R 0 Average per capita social assistance transfer through SOAP (below subsistence level): R 0 R 0 R 136 R 68 R 0 R 175 R 430 R 29 Average per capita social assistance transfer through CSG (below subsistence level): R 31 R 20 R 19 R 18 R 0 R 0 R 0 R 18 Average per capita social assistance transfer through DG (below subsistence level): R 2 R 2 R 1 R 4 R 6 R 2 R 0 R 3 Average per capita social assistance transfer through BIG (below subsistence level): R 68 R 79 R 48 R 65 R 99 R 58 R 0 R 74 Average per capita social assistance transfer through UB (below subsistence level): R 0 R 0 R 0 R 0 R 0 R 0 R 0 R 0 Table 9-4: BIG (R100) and HIV/AIDS in 2011
Appendix 199
0
500,000
1,000,000
1,500,000
2,000,000
2,500,000
per a
dult
eq.
R 1
2
R 1
7
R 2
5
R 3
6
R 5
3
R 7
8
R 1
14
R 1
67
R 2
44
R 3
57
R 5
23
R 7
65
R 1
,121
R 1
,641
R 2
,402
R 3
,517
R 5
,149
R 7
,538
R 1
1,03
7
R 1
7,77
5
R 2
6,02
5
R 5
0,71
5
Figure 9-5: Total monthly income distribution per adult equivalent – BIG (R100) and HIV/AIDS in 2011 (dotted line = only potential of the current social assistance system with HIV/AIDS in 2011)
only child.
child. + work. age
adults
child. + adults in pen. age
child. + work. age adults + adults in pen. age
only work. age adults
work. age adults + adults in pen. age
only adults in pen. age Total
SOCIAL ASSISTANCE - HIV/AIDS Total No. of people living below subsistence level: 898,187 18,392,742 860,256 8,588,014 1,425,478 634,142 211,976 31,010,795 % of people living below subsistence level vs. total: 87.1% 64.0% 92.1% 85.1% 31.5% 61.5% 48.0% 66.3% % of people living in the HH types (below subsistence level ): 2.9% 59.3% 2.8% 27.7% 4.6% 2.0% 0.7% 100.0% Total No. of people living in HH receiving no social assistance (below subsistence level): 0 0 0 0 0 0 0 0 % of people living in HH receiving no social assistance (below subsistence level): 0.0% 0.0% 0.0% 0.0% 0.0% 0.0% 0.0% 0.0% Average No. of people living in the HH (below subsistence level): 3.4 6.6 4.7 8.7 2.3 3.2 1.5 6.7 Average No. of people employed in the HH (below subsistence level): 0.0 0.7 0.0 0.6 0.6 0.4 0.0 0.6 Average No. of people receiving social assistance (below subsistence level): 1.1 2.2 2.4 3.9 0.8 2.0 1.5 2.6 Average % closed of the poverty gap by social assistance (below subsistence level): 24.6% 39.1% 83.4% 73.5% 36.5% 89.2% 100.0% 50.7%
Appendix 200
Average per capita social assistance transfer (below subsistence level): R 37 R 47 R 159 R 114 R 80 R 226 R 430 R 77 Average per capita social assistance transfer through old SoSe payments (below subsistence level): R 0 R 0 R 0 R 0 R 0 R 0 R 0 R 0 Average per capita social assistance transfer through SOAP (below subsistence level): R 0 R 0 R 136 R 68 R 0 R 175 R 430 R 29 Average per capita social assistance transfer through CSG (below subsistence level): R 31 R 20 R 19 R 18 R 0 R 0 R 0 R 18 Average per capita social assistance transfer through DG (below subsistence level): R 2 R 2 R 1 R 4 R 6 R 2 R 0 R 3 Average per capita social assistance transfer through BIG (below subsistence level): R 0 R 0 R 0 R 0 R 0 R 0 R 0 R 0 Average per capita social assistance transfer through UB (below subsistence level): R 2 R 24 R 3 R 25 R 71 R 48 R 0 R 26 Table 9-5: UB and HIV AIDS in 2011
0
500,000
1,000,000
1,500,000
2,000,000
2,500,000
per a
dult
eq.
R 1
2
R 1
7
R 2
5
R 3
6
R 5
3
R 7
8
R 1
14
R 1
67
R 2
44
R 3
57
R 5
23
R 7
65
R 1
,121
R 1
,641
R 2
,402
R 3
,517
R 5
,149
R 7
,538
R 1
1,03
7
R 1
7,77
5
R 2
6,02
5
R 5
0,71
5
Figure 9-6: Total monthly income distribution per adult equivalent – UB and HIV AIDS in 2011 (dotted line = only potential of the current social assistance system with HIV/AIDS in 2011)
Appendix 201
only child.
child. + work. age
adults
child. + adults in pen. age
child. + work. age adults + adults in pen. age
only work. age adults
work. age adults + adults in pen. age
only adults in pen. age Total
SOCIAL ASSISTANCE - HIV/AIDS Total No. of people living below subsistence level: 898,187 18,392,742 860,256 8,588,014 1,425,478 634,142 211,976 31,010,795 % of people living below subsistence level vs. total: 87.1% 64.0% 92.1% 85.1% 31.5% 61.5% 48.0% 66.3% % of people living in the HH types (below subsistence level ): 2.9% 59.3% 2.8% 27.7% 4.6% 2.0% 0.7% 100.0% Total No. of people living in HH receiving no social assistance (below subsistence level): 0 0 0 0 0 0 0 0 % of people living in HH receiving no social assistance (below subsistence level): 0.0% 0.0% 0.0% 0.0% 0.0% 0.0% 0.0% 0.0% Average No. of people living in the HH (below subsistence level): 3.4 6.6 4.7 8.7 2.3 3.2 1.5 6.7 Average No. of people employed in the HH (below subsistence level): 0.0 0.7 0.0 0.6 0.6 0.4 0.0 0.6 Average No. of people receiving social assistance (below subsistence level): 3.4 6.6 4.7 8.7 2.3 3.2 1.5 6.7 Average % closed of the poverty gap by social assistance (below subsistence level): 66.2% 49.9% 93.4% 74.4% 61.3% 91.2% 100.0% 60.1% Average per capita social assistance transfer (below subsistence level): R 110 R 59 R 209 R 117 R 123 R 248 R 583 R 91 Average per capita social assistance transfer through old SoSe payments (below subsistence level): R 0 R 0 R 0 R 0 R 0 R 0 R 0 R 0 Average per capita social assistance transfer through SOAP (below subsistence level): R 0 R 0 R 136 R 68 R 0 R 175 R 430 R 29 Average per capita social assistance transfer through CSG (below subsistence level): R 31 R 20 R 19 R 18 R 0 R 0 R 0 R 18 Average per capita social assistance transfer through DG (below subsistence level): R 2 R 2 R 1 R 4 R 6 R 2 R 0 R 3 Average per capita social assistance transfer through BIG (below subsistence level): R 0 R 0 R 0 R 0 R 0 R 0 R 0 R 0 Average per capita social assistance transfer through UB (below subsistence level): R 0 R 0 R 0 R 0 R 0 R 0 R 0 R 0 Table 9-6: HG and HIV AIDS in 2011
Appendix 202
0
500,000
1,000,000
1,500,000
2,000,000
2,500,000
per a
dult
eq.
R 1
2
R 1
7
R 2
5
R 3
6
R 5
3
R 7
8
R 1
14
R 1
67
R 2
44
R 3
57
R 5
23
R 7
65
R 1
,121
R 1
,641
R 2
,402
R 3
,517
R 5
,149
R 7
,538
R 1
1,03
7
R 1
7,77
5
R 2
6,02
5
R 5
0,71
5
Figure 9-7: Total monthly income distribution per adult equivalent – HG and HIV AIDS in 2011 (dotted line = only potential of the current social assistance system with HIV/AIDS in 2011)
only child.
child. + work. age
adults
child. + adults in pen. age
child. + work. age adults + adults in pen. age
only work. age adults
work. age adults + adults in pen. age
only adults in pen. age Total
SOCIAL ASSISTANCE - HIV/AIDS Total No. of people living below subsistence level: 898,187 18,392,742 860,256 8,588,014 1,425,478 634,142 211,976 31,010,795 % of people living below subsistence level vs. total: 87.1% 64.0% 92.1% 85.1% 31.5% 61.5% 48.0% 66.3% % of people living in the HH types (below subsistence level ): 2.9% 59.3% 2.8% 27.7% 4.6% 2.0% 0.7% 100.0% Total No. of people living in HH receiving no social assistance (below subsistence level): 0 0 0 0 0 0 0 0 % of people living in HH receiving no social assistance (below subsistence level): 0.0% 0.0% 0.0% 0.0% 0.0% 0.0% 0.0% 0.0% Average No. of people living in the HH (below subsistence level): 3.4 6.6 4.7 8.7 2.3 3.2 1.5 6.7 Average No. of people employed in the HH (below subsistence level): 0.0 0.7 0.0 0.6 0.6 0.4 0.0 0.6 Average No. of people receiving social assistance (below subsistence level): 3.2 3.7 4.5 5.5 0.0 1.2 1.5 4.0 Average % closed of the poverty gap by social assistance (below subsistence level): 63.1% 49.8% 96.4% 76.8% 2.3% 77.9% 100.0% 57.7%
Appendix 203
Average per capita social assistance transfer (below subsistence level): R 96 R 58 R 203 R 119 R 12 R 178 R 430 R 83 Average per capita social assistance transfer through old SoSe payments (below subsistence level): R 0 R 0 R 0 R 0 R 0 R 0 R 0 R 0 Average per capita social assistance transfer through SOAP (below subsistence level): R 0 R 0 R 136 R 68 R 0 R 175 R 430 R 29 Average per capita social assistance transfer through CSG (below subsistence level): R 94 R 55 R 66 R 47 R 0 R 0 R 0 R 50 Average per capita social assistance transfer through DG (below subsistence level): R 2 R 2 R 1 R 4 R 6 R 2 R 0 R 3 Average per capita social assistance transfer through BIG (below subsistence level): R 0 R 0 R 0 R 0 R 0 R 0 R 0 R 0 Average per capita social assistance transfer through UB (below subsistence level): R 0 R 0 R 0 R 0 R 0 R 0 R 0 R 0 Table 9-7: CSG and HIV AIDS in 2011
0
500,000
1,000,000
1,500,000
2,000,000
2,500,000
per a
dult
eq.
R 1
2
R 1
7
R 2
5
R 3
6
R 5
3
R 7
8
R 1
14
R 1
67
R 2
44
R 3
57
R 5
23
R 7
65
R 1
,121
R 1
,641
R 2
,402
R 3
,517
R 5
,149
R 7
,538
R 1
1,03
7
R 1
7,77
5
R 2
6,02
5
R 5
0,71
5
Figure 9-8: Total monthly income distribution per adult equivalent – CSG and HIV AIDS in 2011 (dotted line = only potential of the current social assistance system with HIV/AIDS in 2011)
Appendix 204
only child.
child. + work. age
adults
child. + adults in pen. age
child. + work. age adults + adults in pen. age
only work. age adults
work. age adults + adults in pen. age
only adults in pen. age Total
SOCIAL ASSISTANCE - HIV/AIDS Total No. of people living below subsistence level: 898,187 18,392,742 860,256 8,588,014 1,425,478 634,142 211,976 31,010,795 % of people living below subsistence level vs. total: 87.1% 64.0% 92.1% 85.1% 31.5% 61.5% 48.0% 66.3% % of people living in the HH types (below subsistence level ): 2.9% 59.3% 2.8% 27.7% 4.6% 2.0% 0.7% 100.0% Total No. of people living in HH receiving no social assistance (below subsistence level): 0 0 0 0 0 0 0 0 % of people living in HH receiving no social assistance (below subsistence level): 0.0% 0.0% 0.0% 0.0% 0.0% 0.0% 0.0% 0.0% Average No. of people living in the HH (below subsistence level): 3.4 6.6 4.7 8.7 2.3 3.2 1.5 6.7 Average No. of people employed in the HH (below subsistence level): 0.0 0.7 0.0 0.6 0.6 0.4 0.0 0.6 Average No. of people receiving social assistance (below subsistence level): 3.4 6.6 4.7 8.7 2.3 3.2 1.5 6.7 Average % closed of the poverty gap by social assistance (below subsistence level): 46.5% 53.7% 91.5% 78.4% 37.5% 85.6% 100.0% 61.6% Average per capita social assistance transfer (below subsistence level): R 67 R 62 R 181 R 122 R 55 R 207 R 430 R 87 Average per capita social assistance transfer through old SoSe payments (below subsistence level): R 0 R 0 R 0 R 0 R 0 R 0 R 0 R 0 Average per capita social assistance transfer through SOAP (below subsistence level): R 0 R 0 R 136 R 68 R 0 R 175 R 430 R 29 Average per capita social assistance transfer through CSG (below subsistence level): R 31 R 20 R 19 R 18 R 0 R 0 R 0 R 18 Average per capita social assistance transfer through DG (below subsistence level): R 2 R 2 R 1 R 4 R 6 R 2 R 0 R 3 Average per capita social assistance transfer through BIG (below subsistence level): R 34 R 40 R 24 R 33 R 49 R 29 R 0 R 37 Average per capita social assistance transfer through UB (below subsistence level): R 0 R 0 R 0 R 0 R 0 R 0 R 0 R 0 Table 9-8: BIG (R50) and HIV AIDS in 2011
Appendix 205
0
500,000
1,000,000
1,500,000
2,000,000
2,500,000
per a
dult
eq.
R 1
2
R 1
7
R 2
5
R 3
6
R 5
3
R 7
8
R 1
14
R 1
67
R 2
44
R 3
57
R 5
23
R 7
65
R 1
,121
R 1
,641
R 2
,402
R 3
,517
R 5
,149
R 7
,538
R 1
1,03
7
R 1
7,77
5
R 2
6,02
5
R 5
0,71
5
Figure 9-9: Total monthly income distribution per adult equivalent – BIG (R50) and HIV AIDS in 2011 (dot-ted line = only potential of the current social assistance system with HIV/AIDS in 2011)
Bibliography 206
Bibliography
Books AHMAD, Ehtisham; DRÈZE, Jean;
HILLS, John (ed.) 1991. Social security in developing countries. Oxford (Clarendon Press).
ALESINA, Alberto; PEROTTI, Roberto 1993. Income distribution, politi-cal instability, and investment. Cambridge. htttp://nberws.nber.org/papers/W4486 (National Bureau of Eco-nomic Research). (NBER Work-ing Paper Series. 4486)
ANDREASSEN, Leif; FREDRIKSEN, Dennis; LJONES, Olav 1996. The future burden of public pension benefits: A microsimulation study. In: Harding, Ann (ed.): Microsimulation and public pol-icy. Selected papers from the IARIW Special Conference on Microsimulation and Public Pol-icy Canberra, 5-9 December, 1993 Amsterdam, Lausanne, New York u. a. (Elsevier). (=Contributions to economic analysis. 232) pp. 329-360.
ARDINGTON, Elisabeth; LUND, Frances 1995. Pensions and development: How the social security system can complement programmes of reconstruction and development. Durban (Development Bank of Southern Africa). (Development Paper 61 Occasional paper.)
BAEKGAARD, Hans 1996. A microsimulation approach the demand for day care for children in Denmark. In: Harding, Ann (ed.): Microsimulation and public policy. Selected papers from the IARIW Special Con-ference on Microsimulation and Public Policy Canberra, 5-9 December, 1993 Amsterdam, Lausanne, New York u. a. (Elsevier). (=Contributions to economic analysis. 232) pp. 122-148.
BARRO, ROBERT, J. 1999. Inequality, growth, and investment. http://www.nber.org/ pa-pers/w7038 (National Bureau of Economic Research.). (NBER Working Paper Series. Working Paper 7038)
BEEBOUT HAROLD 1986. Evaluating Reagan administration social
program changes: Two applica-tions of math. In: Orcutt, Guy; Merz, Joachim; Quinke, Herman (ed.): Microanalytic simulation models to support social and fi-nancial policy. Amsterdam, New York, Oxford (North-Holland). (=Information research and re-source reports. 7) pp. 83--97.
BLUMBERG, Rae L. (ed.) 1991. Gender, family and economy. The triple overlap. Newbury Park, London, New Delhi (Sage Publications).
BLUMBERG, Rae L. 1991. Introduction: The 'triple overlap' of gender stratification, economy, and the family. In: Blumberg, Rae L. (ed.): Gender, family and econ-omy. The triple overlap. New-bury Park, London, New Delhi (Sage Publications). pp. 7-32.
BURGESS, Robin; STERN, Nicholas 1991. Social security in develop-ing countries: What, why, who, and how? In: Ahmad, Ehtisham; Drèze, Jean; Hills, John et al. (ed.): Social security in develop-ing countries. Oxford (Clarendon Press). pp. 41-80.
BURMAN, Sandra; REYNOLDS, Pamela (ed.) 1986. Growing up in a di-vided society: The context of childhood in South Africa Johan-nesburg (Ravan Press).
CARVALHO, Soniya; WHITE, Howard 1994. Indicators of monitoring poverty reduction. Washington, D.C (The World Bank). (World Bank discussion papers. 254)
CHILD HEALTH UNIT 1997. An evalua-tion of South Africa's primary school nutrition programme. Durban (Health Systems Trust).
CHOW, Nelson 1998. The making of social policy in Hong Kong: So-cial welfare developments in the 1980s and 1990s. In: Goodman, Roger; White, Gordon; Kwon, Huck-ju (ed.): The East Asian welfare model. Welfare oriental-ism and the state. London & New York (Routledge). pp. 159-174.
CITRO, Constance F.; HANUSHEK, Eric A. (ed.) 1991. Improving infor-mation for social policy deci-sions. The uses of microsimula-tion modeling. Volume 1. Review and recommendations. Washing-
ton, D.C. (National Academy Press).
COX, Deborah; PAUL, Susan 1994. Modelling social security and veterans' payments. STINMOD Technical paper No. 3 Canberra (NATSEM, University of Can-berra).
DE LATHOUWER, Lieve 1996. Mi-crosimulation in comparative so-cial policy analysis: A case study of unemployment schemes for Belgium and the Netherlands. In: Harding, Ann (ed.): Microsimu-lation and public policy. Selected papers from the IARIW Special Conference on Microsimulation and Public Policy Canberra, 5-9 December, 1993 Amsterdam, Lausanne, New York u. a. (El-sevier). (=Contributions to eco-nomic analysis. 232) pp. 69-92.
DENG, Lual A.; TJONNELAND, Elling N. (ed.) 1996. South Africa: Wealth, Poverty and Reconstruc-tion. Bergen, Cape Town (Centre for South African Studies).
DEPARTMENT OF FINANCE 2000. Budget Review 2000. Pretoria (Government Printers).
DEPARTMENT OF WELFARE (White Paper) 1997. White Paper for So-cial Welfare. Principles, guide-lines, recommendations, pro-posed policies and programmes for developmental social welfare in South Africa. Pretoria (Gov-ernment Printers).
DRÈZE, Jean; SEN, Amartya 1991. Public action for social security: Foundations and strategy. In: Ahmad, Ehtisham; Drèze, Jean; Hills, John et al. (ed.): Social se-curity in developing countries. Oxford (Clarendon Press). pp. 3-40.
EKLIND, Bengt; ERIKSSON, Ingemar; HUSSÉNIUS, Joakim 1996. Pen-sion analysis in a static model with lifetime income distribution: Initial results. In: Harding, Ann (ed.): Microsimulation and pub-lic policy. Selected papers from the IARIW Special Conference on Microsimulation and Public Pol-icy Canberra, 5-9 December, 1993 Amsterdam, Lausanne, New York u. a. (Elsevier).
Bibliography 207
(=Contributions to economic analysis. 232) pp. 213-328.
ESPING-ANDERSEN, Gosta 1990. The three worlds of welfare capital-ism. Princeton, New Jersey (Princeton University Press).
ESTES, Richard J. 1984. The social progress of nations. New York.
FALKINGHAM, Jane; HARDING, Ann 1996. Poverty alleviation vs so-cial insurance systems: A com-parison of lifetime redistribution. In: Harding, Ann (ed.): Mi-crosimulation and public policy. Selected papers from the IARIW Special Conference on Mi-crosimulation and Public Policy Canberra, 5-9 December, 1993 Amsterdam, Lausanne, New York u. a. (Elsevier). (=Contributions to economic analysis. 232) pp. 233-266.
FINANCIAL AND FISCAL COMMISSION 2000. Preliminary recommenda-tions fro 2001. A costed norm approach for the Division of Revenue. Pretoria (Financial and Fiscal Commission).
GALLER, Heinz P. 1996. Microsimula-tion of pension reform proposals: Modelling the earning couples. In: Harding, Ann (ed.): Mi-crosimulation and public policy. Selected papers from the IARIW Special Conference on Mi-crosimulation and Public Policy Canberra, 5-9 December, 1993 Amsterdam, Lausanne, New York u. a. (Elsevier). (=Contributions to economic analysis. 232) pp. 293-309.
GEORGE, Vic; PAGE, Robert (ed.) 1995. Modern thinkers on Wel-fare. London, New York, To-ronto et al. (Prentice Hall, Har-vester Wheatsheaf).
GERMAN FOUNDATION FOR INTERNA-TIONAL DEVELOPMENT (DSE) (ed.) 1994. Social security in Af-rica. Proceedings of the Interna-tional Conference held in Berlin, November 1993 Berlin (German Foundation for International De-velopment (DSE)).
GETUBIG, I.P. 1992. Social security and the poor: An introduction. In: Getubig, I.P.; Schmidt, Sönke (ed.): Rethinking social security. Reaching out to the poor. Kuala Lumpur, Frankfurt (Asian and Pacific Development Centre). pp. 1-17.
GETUBIG, I.P.; SCHMIDT, Sönke (ed.) 1992. Rethinking social security. Reaching out to the poor. Kuala Lumpur, Frankfurt (Asian and Pacific Development Centre).
GOODMAN, Roger; PENG, Ito 1998: The East Asian welfare states: Peri-patetic learning, adaptive change, and nation-building. In: GOODMAN, Roger; WHITE, Gordon; KWON, Huck-ju (ed.) 1998. The East Asian welfare model. Welfare orientalism and the state. London & New York (Routledge) pp. 192-224.
GOODMAN, Roger; WHITE, Gordon; KWON, Huck-ju (ed.) 1998. The East Asian welfare model. Wel-fare orientalism and the state. London & New York (Routledge).
GROSH, M.; MUNOZ, J. 1996. A man-ual for planning and implement-ing the Livings Standards Meas-urement Study Surveys. Washing-ton (The World Bank).
HAARMANN, Claudia 1999. South Africa's new child support grant: A developmental perspective. Cape Town (Applied Fiscal Re-search Centre). (Research Mono-graph Series. 11)
HAARMANN, Dirk 1999a. The living conditions of South Africa's chil-dren. Cape Town (Applied Fiscal Research Centre). (Research Monograph Series.9)
HAARMANN, Dirk 1999b. The use of microsimulation in social policy planning and implementation: The case of the child support grants. Cape Town (Applied Fis-cal Research Centre). (Research Monograph Series.10)
HADDAD, Lawrence; HODDINOTT, John; ALDERMAN, Harold (ed.) 1997. Intrahousehold resource allocation in developing coun-tries. Models, methods and pol-icy. Baltimore, London (The In-ternational Food Policy Research Institute).
HARDING, Ann (ed.) 1996. Microsimu-lation and public policy. Selected papers from the IARIW Special Conference on Microsimulation and Public Policy Canberra, 5-9 December, 1993 Amsterdam, Lausanne, New York u. a. (El-sevier). (Contributions to eco-nomic analysis. 232)
HUBER, Evelyne 1996: Options for social policy in Latin America: Neoliberal versus social democ-ratic models. In: Esping-Andersen, Gosta (ed.): Welfare states in transition. London, Thousand Oaks, New Delhi (Sage Publication) pp. 141-191.
INTERNATIONAL LABOUR ORGANISA-TION 1984. Introduction to Social Security. Geneva (International Labour Organisation).
LE ROUX, Pieter 1996. Poverty, social policies and the reconstruction and development programme. In: Deng, Lual A.; Tjonneland, El-ling N. (ed.): South Africa: Wealth, Poverty and Reconstruc-tion. Bergen, Cape Town (Centre for South African Studies). pp. 47-76.
LOVELIFE 2000. The impending catas-trophe: A resource book on the emerging HIV/AIDS epidemic in South Africa.. Johannesburg (LoveLife).
LUND COMMITTEE ON CHILD AND FAM-ILY SUPPORT 1996. Report of the Lund committee on child and family support. n.p.
MAY, Julian (ed.) 1998. Poverty and Inequality in South Africa. Sum-mary Report n.p.
MERZ, Joachim 1993. Microsimulation as an instrument to evaluate eco-nomic and social programmes. n.p. (FFB - Discussion Paper No.5 July 1993)
MESA-LAGO, Carmelo 1991. Social security in Latin America and the Caribbean: A comparative as-sessment. In: Ahmad, Ehtisham; Drèze, Jean; Hills, John et al. (ed.): Social security in develop-ing countries. Oxford (Clarendon Press). pp. 356-394.
MESA-LAGO, Carmelo 1991: Social security in Latin America. In: Ahmad, Ehtisham; Drèze, Jean; Hills, John et al. (ed.): Social se-curity in developing countries. Oxford (Clarendon Press) pp. 177-216.
MIDGLEY, James 1996. Challenges facing social security. In: Midg-ley, James; Tracy, Martin B. (ed.): Challenges to social secu-rity. An international explora-tion. Westport, Connecticut, London (Auborn House). pp. 1-18.
Bibliography 208
MIDGLEY, James 1995. Social devel-opment. The developmental per-spective in social welfare. Lon-don, Thousand Oaks, New Delhi (SAGE).
MIDGLEY, James 1984. Social security, inequality and the third world. Chichester, New York, Brisbane et al. (John Wiley & Sons).
MIDGLEY, James 1997. Social Welfare in global context. Thousand Oaks, London, New Delhi (Sage Publications).
MIDGLEY, James; SHERRADEN, Mi-chael (ed.) 1997. Alternatives to social security. An international inquiry. Westport, Connecticut, London (Auburn House).
MIDGLEY, James; TRACY, Martin B. (ed.) 1996. Challenges to social security. An international explo-ration. Westport, Connecticut, London (Auborn House).
NATIONAL INSTITUTE FOR ECONOMIC POLICY May 1996. Children, poverty and disparity reduction. Towards fulfilling the rights of South Africa' children. A report commissioned by the RDP office. Pretoria.
NTENGA, Lydia 1999. Budget Brief 23: Basic income grant: Some con-cerns. Cape Town http://www.idasa.org.za/bis/briefs/brief23.htm (IDASA).
ORCUTT, Guy; MERZ, Joachim; QUINKE, Herman (ed.) 1986. Mi-croanalytic simulation models to support social and financial pol-icy. Amsterdam, New York, Ox-ford (North-Holland). (Informa-tion research and resource re-ports. 7)
ORKIN, Mark F. 1998. Unemployment and employment in South Africa. http://www.statssa.gov.za/U&E/prelim_p.htm (15.03.99) and http://www.statssa. gov.za/U&E/Chapter_1.htm (15.03.99).
POTGIETER, Johan F. 1997. The house-hold subsistence level in the ma-jor urban centres of the Republic of South Africa and Namibia.
March 1997 Port Elizabeth (Uni-versity of Port Elizabeth). (Fact Paper 104)
RAVALLION, Martin 1994. Poverty comparisons Switzerland, Aus-tralia, Belgium etc. (Harwood Academic Publishers). (Funda-mentals of Pure and Applied Economics)
RAVALLION, Martin 1992. Poverty comparisons. A guide to concepts and methods. Washington, D.C. (The World Bank). (LSMS Working Paper. 88)
SALOMAKI, Aino 1996. Including consumption expenditure and welfare services in a microsimu-lation model. In: Harding, Ann (ed.): Microsimulation and pub-lic policy. Selected papers from the IARIW Special Conference on Microsimulation and Public Pol-icy Canberra, 5-9 December, 1993 Amsterdam, Lausanne, New York u. a. (Elsevier). (=Contributions to economic analysis. 232) pp. 93-110.
SAMSON, Michael; BABSON, Oliver; MAC QUENE, Kenneth 2000. The macroeconomic implications of poverty reducing income trans-fers. Presentation at the con-ferene: 'Towards a sustainable and comprehensive social secu-rity system' Cape Town (Eco-nomic Policy Research Institute).
SAUTTER, Hermann; SERRIES, Chris-toph 1993. Inhalt und Methodik von Armutsanalysen. Köln (Wel-forum Verlag). (Forschungsbe-richte des Bundesministeriums für wirtschaftliche Zusammenar-beit und Entwicklung. 110)
SCHMIDT, Sönke 1992. Social security in developing countries: Basic tenets and fields of state interven-tion. In: Getubig, I.P.; Schmidt, Sönke (ed.): Rethinking social security. Reaching out to the poor. Kuala Lumpur, Frankfurt (Asian and Pacific Development Centre). pp. 18-40.
SCHNEIDER, Marguerite; MARSHALL, Susan 1998. Social security for people with disabilities. Re-searched for the Department of Welfare. Johannesburg (Com-muntiy Agency for Social En-quiry (CASE)).
SHERRADEN, Michael 1991. Assets and the poor. A new American wel-
fare policy. Armonk, New York, London (M.E. Sharpe).
SHERRADEN, Michael 1997. Provident funds and social protection: The case of Singapore. In: Midgley, James; Sherraden, Michael (ed.): Alternatives to social security. An international inquiry. Westport, Connecticut, London (Auburn House). pp. 33-60.
SIGG, Roland 1994. The impact of structural adjustment on social security in Africa. The perspec-tive of the ILO. In: German Foundation for International De-velopment (DSE) (ed.): Social security in Africa. Proceedings of the International Conference held in Berlin, November 1993 Berlin (German Foundation for International Development (DSE)). pp. 65-76.
SILBURN, Richard 1995. Beveridge. In: George, Vic; Page, Robert (ed.): Modern thinkers on Welfare. London, New York, Toronto et al. (Prentice Hall, Harvester Wheatsheaf). pp. 84-101.
SIMKINS, Charles 1986. Household composition and structure in South Africa. In: Burman, San-dra; Reynolds, Pamela (ed.): Growing up in a divided society: The context of childhood in South Africa Johannesburg (Ravan Press). pp. 16-42.
SOOTH, Christian Paul 1992. Entste-hungs- und Entwicklungsbedin-gungen staatlicher Systeme so-zialer Sicherung in Afrika. Sene-gal, Kamerun, Mauritius und Gabun im Vergleich. Hamburg (Institut für Afrika Kunde).
SOUTHERN AFRICA LABOUR & DEVEL-OPMENT RESEARCH UNIT 1994. South Africans rich and poor: Baseline household statistics. Rondebosch (SALDRU).
STATISTICS SOUTH AFRICA 1999b. Census in brief: Introduction http:/www.statssa. gov.za/census96/html (07.04.99).
STATISTICS SOUTH AFRICA 1999a. Living in SA. n.p. (Statistics South Africa. http.//www.statssa.gov.za/Living/L_SA/ (29.07.99)).
SUBBARAO, K; BONNERJEE, Anirud-dha; BRAITHWAITE, Jeanine 1997. Safety net programs and poverty reduction. Lessons from cross-
Bibliography 209
country experience. Washington (The World Bank).
WHITE, Gordon; GOODMAN, Roger 1998. Welfare orientalism and the search for an East Asian wel-fare model. In: Goodman, Roger; White, Gordon; Kwon, Huck-ju (ed.): The East Asian welfare model. Welfare orientalism and the state. London & New York (Routledge). pp. 3-24.
WORLD BANK 1995. Key indicators of poverty in South Africa. Pretoria.
ZEDLTIZ, Hans A. von 1994. Tradi-tional and informal social secu-rity systems and their develop-mental potential. In: German Foundation for International De-velopment (DSE) (ed.): Social security in Africa. Proceedings of the International Conference held in Berlin, November 1993 Berlin (German Foundation for International Development (DSE)). pp. 233-261.
Journals, periodicals and magazines BHORAT, Haroon 1995. The South
African social safety net: past, present and future. In: Develop-ment Southern Africa, Vol. 12., No. 4, pp. 595-604.
BRAJNIK, Giorgio; LINES, Marji 1998. Qualitative modeling and simula-tion of socio-economic phenom-ena. In: Journal of Artificial So-cieties and Social Simulation, Vol. 1., No. 1, pp. 21.
CASE, Ann; DEATON, Angus 1998. Large cash transfers to the eld-erly in South Africa. In: The Eco-nomic Journal, Vol. 108., No. 450, pp. 1330-1361.
GRUAT, Jean-Victor 1990. Social security schemes in Africa. Cur-rent trends and problems. In: In-ternational Labour Review, Vol. 129., No. 4, pp. 405-421.
GUTIERREZ, Alvaro C. 1990. Finanzie-rung der Sozialen Sicherheit und Makroökonomie: Betrachtungen zum Fall Lateinamerika In: In-ternationale Revue für Soziale Sicherheit, Vol. XLII., No. 3, pp. 300-315.
LUIZ, JM 1995. Welfare policy and the transformation of social security
in South Africa. In: Development Southern Africa, Vol. 12., No. 4, pp. 579-593.
MESA-LAGO, Carmelo 1997. Social welfare reform in the context of economic-political liberalization: Latin American cases. In: World Development, Vol. 25., No. 4, pp. 497-517.
MIDGLEY, James 1996. Promoting a developmental perspective in so-cial welfare: The contribution of South African Schools of Social Work. In: Social Work, Vol. 32., No. 1, pp. 1-7.
MIDGLEY, James 1993. Social security and third world poverty: The challenge to policymakers. In: Policy Studies Review, Vol. 12., No. 1/2, pp. 133-143.
NATTRASS, Nicoli; SEEKINGS, Jeremy 1997. Citizenship and welfare in South Africa: Deracialisation and inequality in a labour-surplus economy. In: Canadian Journal of African Studies, Vol. 31., No. 3, pp. 452-462.
NELISSEN, J. No. M. 1993. Labour market, income formation and social security in the microsimu-lation model NDEYMAS. In: Eco-nomic Modelling, Vol. 10., No. 1, pp. 225-271.
ZIEHL, S.C.: Sociology of the family - obstacles and challenges towards a sociology of domestic groups. In: ASSA-Paper, 1998, pp. 1-29.
Newspaper articles BASKIN, Jeremy: Pay the citizens of
SA. In: Mail & Guardian, No. 4, 24.01.1997.
BUSINESS DAY: AIDS must not be seen in medical context only. In: Busi-ness Day, No. http:// www.bday.co.za/00/0720/bday/content/direct, 20 July 2000.
DAVIS, Gaye; SOGGOT, Mungo: 'They didn't breed like rabbits.' In: Mail & Guardian, No. 26, 4.7.1997.
FINANCIAL MAIL: Editorials: Prescrip-tion that may worsen the malady. In: Financial Mail, No. http://www.fm.co.za/00/0121/toptail/aedop.htm., 21.01.2000.
FRASER-MOLEKETI, Geraldine: White Paper achieves consensus over
the new role of welfare. Public hearings on the social welfare white paper were held recently. Welfare minister Geraldine Fra-ser-Moleketi responds to some of the submissions. In: Business Day, 02.12.1996.
FRIEDMAN, Steven: For the country's good, the unemployed must have a chance. In: Business Day, 2000
GRAWITZKY, Reneé: Cabinet to look into basic income grant. Costs of payment scheme for the unem-ployed are expected to total R6bn a year. In: Business Day, No. http://www.bday.co.za/00/0313/news/n11.htm, 13.03.2000a.
GRAWITZKY, Reneé: Govt committee will look at social security op-tions. By creating a safety net can help weld consensus on pol-icy. In: Business Day, No. http://www.bday.co.za/00/0323/news/n9.htm, 23.03.2000b.
GREYBE, David: Grant may cost R6bn a year. In: Business Day, 18.08.1999c.
GREYBE, David: Income grant for jobless proposed. In: Business Day, 10.08.1999a.
GREYBE, David: Manuel comes under heavy fire. Nongovernmental or-ganisations say budget favours the wealthy and ignores needs of the poor. In: Business Day, No. http://www.bday.co.za/00/0225/news./n20.htm, 25.02.2000.
GREYBE, David: World Bank tentative about poverty grant. In: Business Day,, 12.08.1999b.
GUMEDE, William M.: COSATU: Exploring the pragmatic path. The federation has been forced to re-examine its approach. In: Fi-nancial Mail, No. http://www.fm.co.za/00/0310/currents/accurrent.htm, 10.03.2000a.
GUMEDE, William M.: The Presidency: Deflecting the dole crunch. Mbeki and ANC centrists wary of upsetting fiscal apple cart. In: Financial Mail, No. http:/www.fm.co.za/00/0421/currents/acurrent.htm, 21.04.2000b.
HAFFAJEE, Ferial: Government deliv-ery: A net that won't mesh. Lack of skills bedevils welfare. In: Financial Mail, No. http://www.fm.co.za/00/0512/covopin /coverd.htm, 12.05.2000.
LE ROUX, Pieter: The value of a basic income grant in SA. In: Financial Mail, No. http://www.fm.co.za/99/08/20/covopin/guest.htm, 20.08.1999.
LEWIS: Time has come for comprehen-sive social security system. In: Business Day, http://www.bday.co.za/bday/content/direct/00/0513, 13.05.2000.
ROBERTSON, Heather: Welfare minister moots R7bn 'dole' system for SA. In: Sunday Times, No. n.ed., 16.01.2000.
STREEK, Barry: Safety net for the poorest of the poor. In: Mail & Guardian, 2000.
Research reports, papers and unpublished documents BERG, Servaas van der 1994. Issues in
South African social security. A background paper prepared for the World Bank. Stellenbosch. Printed for private circulation.
CENTRAL STATISTICAL SERVICE 1997. Census '96: Preliminary esti-mates of the size of the popula-tion of South Africa. http://www.css.gov.za.
CONGRESS OF SOUTH AFRICAN TRADE UNIONS 1997. COSATU oral submission to Portfolio Commit-tee on Welfare regarding pro-posed changes to the system of Child Support Benefit arising from the Report of the Lund Committee on Child and Family Support. 21 April 1997. Cape Town. Printed for private circula-tion.
CONGRESS OF SOUTH AFRICAN TRADE UNIONS 1996. COSATU Submis-sion on Social Welfare White Pa-per - 4 November 1996. Cape Town. Printed for private circula-tion.
CONGRESS OF SOUTH AFRICAN TRADE UNIONS 1998. COSATU Submis-sion: Labour Audit for the Jobs
Summit. August 1998. http://www.cosatu.org.za /docs/1998/labouraudit.htm (30.05.2000).
DEPARTMENT OF WELFARE 1999. Amendment: Regulations under the social assistance act, 1992. 25 June 1999. Pretoria.
DEPARTMENT OF WELFARE 1998. Regu-lations regarding the phasing out of maintenance grants in terms of the social assistance act 1992 (Act No. 59 of 1992) Pretoria.
DORRINGTON, Rob 1999. Addendum to ASSA 600: An Aids model of the third kind? Cape Town. Printed for private circulation.
DORRINGTON, Rob 1999. ASSA 600: An AIDS model of the third kind? Cape Town. Printed for private circulation.
DORRINGTON, Rob 1999. To count or to model that is not the question: Some possible deficiencies with the 1996 census results. Cape Town. Printed for private circula-tion.
FRASER-MOLEKETI, Geraldine 1998. Statement by the Minister for welfare and population develop-ment, Ms Geraldine Fraser-Moleketi, at the parliamentary briefing week, Cape Town, 9 February 1998 Press briefing. http//ww.sacs.org.za/ data/speech98/FRASER98.209 (21.04.98).
HAARMANN, Dirk: From state mainte-nance grants to a new child sup-port system: Building a policy for poverty alleviation with special reference to the financial, social, and developmental impacts. Uni-versity of the Western Cape, In-stitute for Social Development, Doctoral thesis 1998 Printed for private circulation.
HAARMANN, Dirk; HAARMANN, Clau-dia 1998. Towards a comprehen-sive social security system in South Africa. Cape Town. Printed for private circulation.
KLASEN, Stephan: Poverty and ine-quality in South Africa. Centre for History and Economics King's College University of Cambridge. Forthcoming article in Social Indicator Research 1996. Printed for private circula-tion.
KLASEN, Stephan; WOOLARD, Ingrid 1999. Levels, trends and consis-tency of employment and unem-ployment figures in South Africa. Munich, Port Elizabeth. Printed for private circulation.
LE ROUX, Pieter 1995. Parental care and family structure. Some inter-esting findings from the SA living standard survey. Bellville. Printed for private circulation.
LIEBENBERG, Sandy 1999. Specific rights. Social security rights. Cape Town. Printed for private circulation.
MESA-LAGO, Carmelo 1993. Safety nets and social funds to alleviate poverty: Performance Problems and Policy Options. Prepared for UNCTAD standing committee on poverty alleviation, Geneva. n.p.
MICRO ANALYSIS OF TRANSFERS TO HOUSEHOLDS 1998. What is Mi-crosimulation? http://www.mathematic-mpr.com/math-2.htm (01.05.1998).
NATTRASS, Nicoli; SEEKINGS, Jeremy 2000. The determinants of ine-quality in South Africa. Paper for the conference: 'Towards a sus-tainable and comprehensive so-cial security system' Cape Town. Printed for private circulation.
PORTFOLIO COMMITTEE ON WELFARE AND POPULATION DEVELOPMENT 1997. Report on public hearings conducted on State Maintenance Grants. Cape Town.
SKWEYIYA, Zola 2000. Statement by Dr. Zola Skweyiya, Minister for Welfare and Population and De-velopment on the appointment of a ministerial committee of in-quiry into social security. http://www.welfare.gov.za/ Min-is-try/Statements/2000/01/InqSocSec.doc.
ZWANECKI, Dunja 1999. Quo vadis? Soziale Sicherung im subsahara-nischen Afrika. Bonn. Printed for private circulation.