Social Cohesion and the State in Times of Austerity Country Case Study: Spain ALBERTO DEL POZO SEN AND JOSÉ MOISÉS MARTÍN CARRETERO December 2013 The recent evolution of the Spanish economy has been strongly affected by the austerity policies recommended by the European Commission. The core of this strategy has focused on reducing the deficit and public debt. The economic crisis has had a devastating impact on employment. In five years, the unemployment rate has risen 17.5 percentage points (from 9.6 per cent to 27.2 per cent, the highest in history). High unemployment has become the major imbalance of the Spanish economy and the main source of social problems. In the fight against this situation, the Spanish government has opted for internal devaluation, depressing real wages. The aim is to gain competitiveness, increase exports and thereby increase employment. This strategy has had tremendous adverse consequences for social expenditure. At constant prices, public spending on health care, education and unemployment has declined in the second part of the crisis (since 2010). The combination of internal devaluation and falling social expenditure has had adverse effects on social cohesion. Disposable income has decreased, poverty and income inequality have risen dramatically and the number of households in economic difficulties has increased. This is affecting the most vulnerable in particular and has created a more fragmented society. STUDY * This country case study is written by Alberto del Pozo and José Moisés Martín of Economistas Frente a la Crisis.
Transcript
Social Cohesion and the State in Times of Austerity
Country Case Study: Spain
ALBERTO DEL POZO SEN AND JOSÉ MOISÉS MARTÍN CARRETERODecember 2013
The recent evolution of the Spanish economy has been strongly affected by the austerity policies recommended by the European Commission. The core of this strategy has focused on reducing the deficit and public debt.
The economic crisis has had a devastating impact on employment. In five years, the unemployment rate has risen 17.5 percentage points (from 9.6 per cent to 27.2 per cent, the highest in history). High unemployment has become the major imbalance of the Spanish economy and the main source of social problems.
In the fight against this situation, the Spanish government has opted for internal devaluation, depressing real wages. The aim is to gain competitiveness, increase exports and thereby increase employment.
This strategy has had tremendous adverse consequences for social expenditure. At constant prices, public spending on health care, education and unemployment has declined in the second part of the crisis (since 2010).
The combination of internal devaluation and falling social expenditure has had adverse effects on social cohesion. Disposable income has decreased, poverty and income inequality have risen dramatically and the number of households in economic difficulties has increased. This is affecting the most vulnerable in particular and has created a more fragmented society.
STUDY
* This country case study is written by Alberto del Pozo and José Moisés Martín of Economistas Frente a la Crisis.
1
A. DEL POZO SEN AND J.M. MARTÍN CARRETERO | SOCIAL COHESION AND THE STATE IN TIMES OF AUSTERITY
A. DEL POZO SEN AND J.M. MARTÍN CARRETERO | SOCIAL COHESION AND THE STATE IN TIMES OF AUSTERITY
1. Introduction
The origins of the economic and financial crisis are usually
placed at the end of 2007 or early 2008, depending on
which socio-economic indicators are taken as reference.
According to the type of fiscal policy and the structural
reform agenda laid down by subsequent governments
to address the impact of and attempt to overcome the
economic downturn, we can identify various phases
during the already five-year-long crisis that is hitting the
Spanish economy.
The first phase runs from the start to the first quarter
of 2010, when a range of demand-driven policies were
applied: first, expansionary measures to try to curb the
effect of the crisis and to induce sustained activity; and
second, policy measures to strengthen social protection,
mainly by alleviating the effects of rising unemployment.
Although the Socialist government acquired moderate
expansionary momentum with its economic policy, its
fiscal stance turned procyclical and contractionary from
May 2010, when the government abruptly switched pol-
icies and adopted an agenda imposed by the European
Commission, with restrictive reforms and against the
guidelines the government had previously adhered to.
These measures meant that the Socialist government
was in practice crossing a number of red lines of its tra-
ditional ideology, affecting areas particularly sensitive for
its potential electorate, mainly civil servant wage cuts and
pension freezes, and the implementation of an economic
policy grounded in unambiguously neoliberal principles.
Therefore May 2010 can be taken as a reference for the
commencement of fiscal austerity. The culmination of
this stage, which symbolically signals this programmatic
shift on the part of the Socialist government, was the
overnight reform of the Spanish Constitution in Septem-
ber 2011. It took place without parliamentary debate
in order to include strict fiscal rules limiting the deficit
and public debt (it was developed afterwards through
Organic Law 2/2012 of 27 April on Budgetary Stability
and Financial Sustainability).
The third period starts when the conservative Popular
Party came into office, after its landslide victory in the
general elections of November 2011 and extends to the
present. From the outset, the Popular Party government
implemented a series of budget cuts in virtually all areas
and it has raised most taxes. The government has also
undertaken fundamental reforms in key institutions,
such as the labour market, the financial sector and the
public administration, beyond the objectives of eco-
nomic adjustment and with the intention of structurally
changing Spain’s socioeconomic model, with substantial
implications for democratic institutions and citizens.
The aim of this report is to analyse the consequences of
the policies developed since May 2010, and to observe
their short-term effects on the main variables of the
Spanish economy and medium-term implications for
future development.
2. General Economic Development
2.1 Economic Growth versus Austerity and Return to Recession
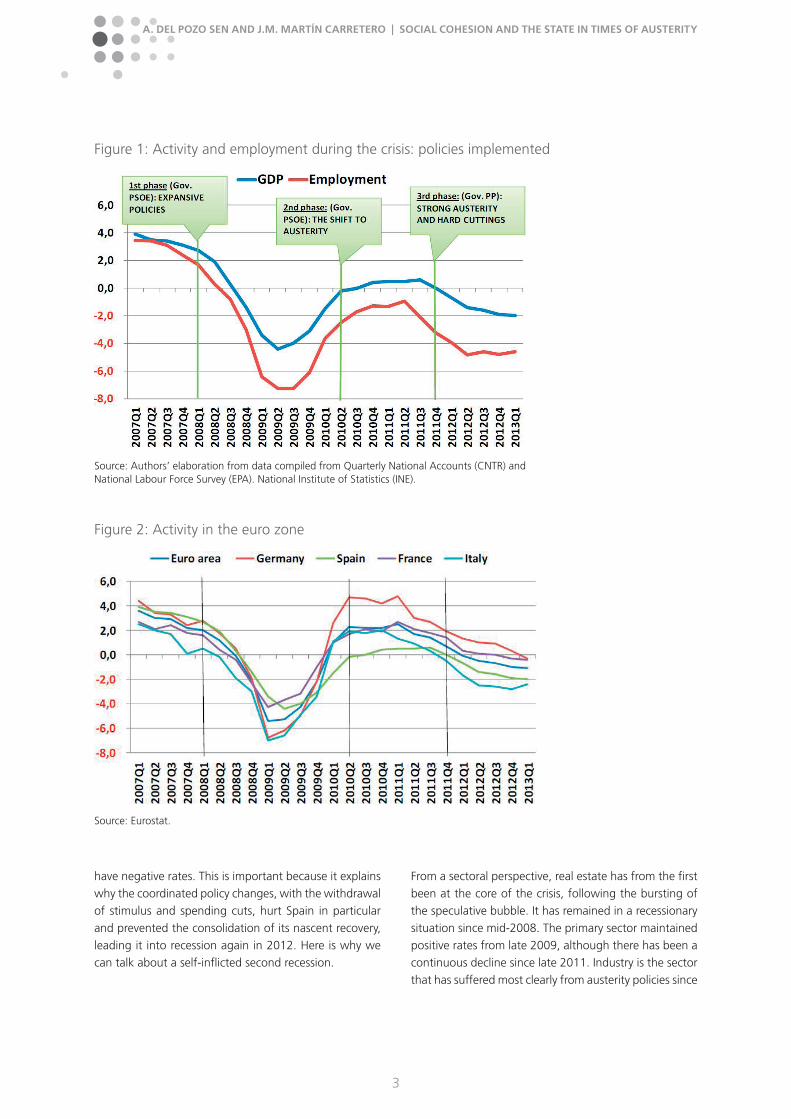
First, it is interesting to note how of economic activity and
employment have evolved during the crisis, following
the three-step approach to the crisis mentioned above.
This allows us to see the drastic turn towards austerity
undertaken by the Socialist government led by Jose Luis
Rodriguez Zapatero, and how this change took effect
when GDP and employment figures were on a path
of strong recovery after two years of steady decline. In
fact, the implementation of the new fiscal consolidation
agenda coincided with a U-turn by both variables. A year
later, when the worsening sovereign debt crisis and the
tail risks affecting confidence in the euro itself had started
to recede, Spain entered into a second recession with the
third phase of the crisis (intensification of austerity with
Mariano Rajoy’s Popular Party government).
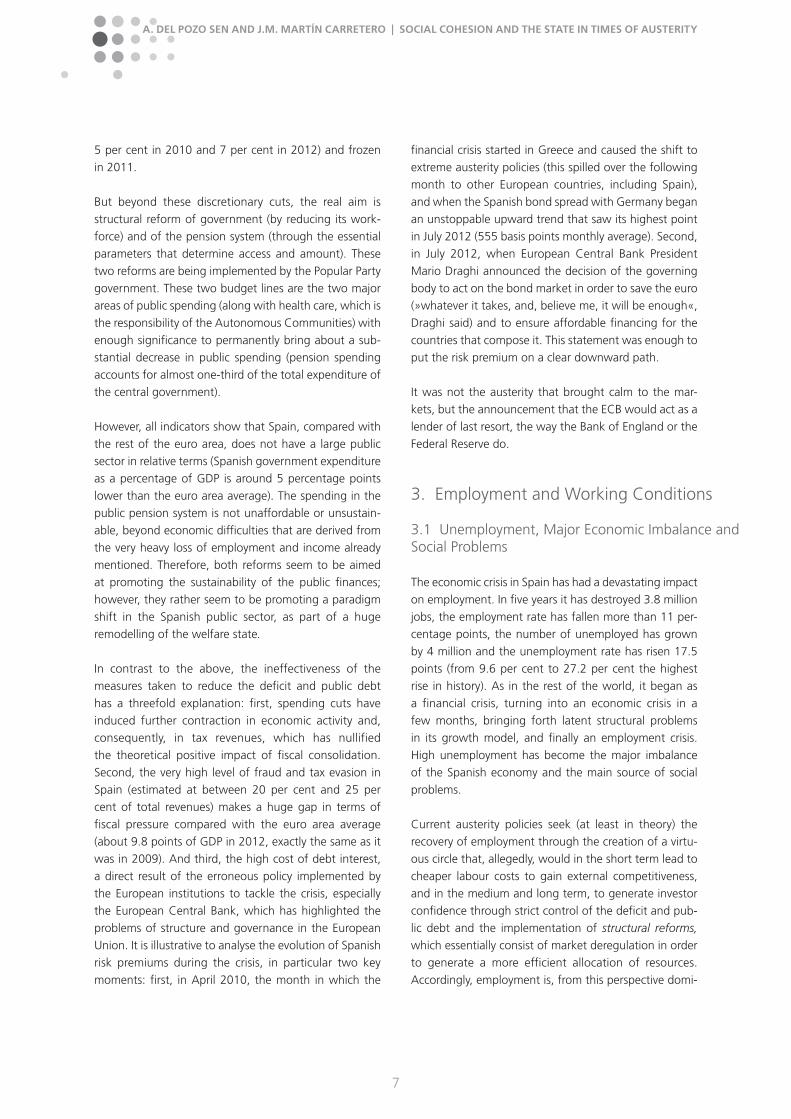
It is necessary, however, to put these developments in the
context of the euro area because the austerity agenda
was designed and promoted at the European level,
following the meeting of Ecofin (Economic Ministers) of
9 May 2010, in the wake of the Greek crisis.
The evolution of economic activity in the euro area and
in particular in its four most important countries shows,
first, the great similarity of the trend in all of them, indi-
cating a common pattern of behaviour; and second, that
although the first recession in Spain was less intense (as
in France), also the recovery in 2009 was slower, and
while other countries grew close to 2 per cent annually
(Germany by more than 4 per cent) Spain continued to
3
A. DEL POZO SEN AND J.M. MARTÍN CARRETERO | SOCIAL COHESION AND THE STATE IN TIMES OF AUSTERITY
have negative rates. This is important because it explains
why the coordinated policy changes, with the withdrawal
of stimulus and spending cuts, hurt Spain in particular
and prevented the consolidation of its nascent recovery,
leading it into recession again in 2012. Here is why we
can talk about a self-inflicted second recession.
From a sectoral perspective, real estate has from the first
been at the core of the crisis, following the bursting of
the speculative bubble. It has remained in a recessionary
situation since mid-2008. The primary sector maintained
positive rates from late 2009, although there has been a
continuous decline since late 2011. Industry is the sector
that has suffered most clearly from austerity policies since
Figure 1: Activity and employment during the crisis: policies implemented
Source: Authors’ elaboration from data compiled from Quarterly National Accounts (CNTR) and National Labour Force Survey (EPA). National Institute of Statistics (INE).
Figure 2: Activity in the euro zone
Source: Eurostat.
4
A. DEL POZO SEN AND J.M. MARTÍN CARRETERO | SOCIAL COHESION AND THE STATE IN TIMES OF AUSTERITY
the second quarter of 2010. When it seemed to have
overcome the initial impact of the crisis, posting growth
above 5 per cent, it started to experience a sizeable loss
of momentum and settled back in negative figures from
the fourth quarter of 2011. Finally, the service sector has
withstood the crisis best overall. Accounting for two-
thirds of total production, it has allowed Spain to record
a moderate overall decline in GDP, lower than many of its
European partners. Since the third quarter of 2011 it has
seen a slow decline, entering into negative rates a year
ago, and with a tendency to intensify.
The conclusion is that since the third quarter of 2011
there has been a general worsening of the four main
sectors, three of them already in recession, and the other
(agriculture) is about to enter into negative growth rates.
Figure 3: Activity by sectors (GVA)
Source: Quarterly National Accounts (INE).
Figure 4: Domestic demand (major components)
Source: Quarterly National Accounts (INE).
5
A. DEL POZO SEN AND J.M. MARTÍN CARRETERO | SOCIAL COHESION AND THE STATE IN TIMES OF AUSTERITY
On the demand side, the main macroeconomic aggre-
gates reflect, perhaps even more clearly, the impact of
the contractionary policies. Overall, the second quarter
of 2010 marked a turning point for the main demand
variables. Then, the household consumption slowed its
recovery and began on a downward path that eventu-
ally led into negative numbers in 2011. In 2012 private
consumption deteriorated even further. Intense wage
devaluation since the beginning of 2012, linked to
large cumulative job losses, has a lot to do with this
development of household spending. On the other hand,
government spending has been moderating since 2009,
but in 2011 it began to fall, intensifying the situation.
Investment does not offer a much better picture. In the
third quarter of 2010 machinery and equipment, which
are essential for industrial activity, abruptly interrupted
the upward trend they had enjoyed since mid-2009.
Investment first began to moderate its growth rate, and
from early 2012, it increasingly shrank. Construction
investment has been collapsing since the beginning of
the crisis and it has not shown any symptoms of potential
recovery.
One of the main consequences of the wage devaluation
strategy has been the severe weakness of domestic
demand, in effect imposing an export-led GDP growth
as the only way forward. The second quarter of 2010 is
again a reference for understanding the development of
exports and imports. At that time both macro variables
were taking off, only to start to decline again: imports
declined due to the effect of the new policy on consumer
income and uncertainty about future developments,
which increased the preference for saving. Exports
declined because of similar policies in the euro area, the
main destination of Spanish exports.
The positive contribution to growth of the external sector
since 2010 is due to imports, which fell further (in fact,
from mid-2011), while exports grew very moderately. The
result is an external demand adding nearly 3 percentage
points to growth and maintaining a positive contribution
for two years, but by contrast the contribution of domes-
tic demand has continued to worsen since late 2010 and
has taken almost 5 percentage points from GDP growth.
Neither the Spanish structure of production (with a small
and low value-added industry and high importance of
tourism) nor the economic situation of the euro area
(which was also entering a recession) suggests that the
foreign sector can become a component of Spanish take-
off. So far, the data show that the adjustment policies
and wage cuts are hurting consumption and investment
rather than favouring the capacity to compete at global
level, a balance that is unfavourable for growth. Without
a recovery in domestic demand, a sustained recovery of
the Spanish economy seems unlikely.
Figure 5: Contribution of domestic and external demand to growth
Source: Quarterly National Accounts (INE).
6
A. DEL POZO SEN AND J.M. MARTÍN CARRETERO | SOCIAL COHESION AND THE STATE IN TIMES OF AUSTERITY
2.2 Sustainability of Public Finances
The need to reduce the deficit and public debt are the
main objectives that have underpinned austerity policies
across Europe, and notably in Spain since May 2010. The
economic crisis meant a sharp increase in public spending
due basically to the operation of the automatic stabilizer
of unemployment benefits, and also expansionary fiscal
policies that were implemented in the first two years of
difficulties. But the crisis also caused a dramatic drop in
public revenues in Spain, because of declining tax reve-
nues resulting from falling employment and the strong
relationship between tax revenues and real estate, which
collapsed after the bursting of the speculative bubble.
This helps to explain the enormous impact of the crisis
in Spain.
In just two years Spain went from a GDP surplus of
1.9 percentage points in 2007 to a deficit of 11.2 per-
centage points in 2009, the worst development across
the European Union in that period, after the one regis-
tered in Ireland (–14 percentage points). Given the public
deficit, financing needs sharply affected the public debt,
which rose between 2007 and 2009 by 17.6 percentage
points, from 36.3 per cent to 53.9 per cent, which was a
very moderate figure in the European context.
The policy change slowed that trend in 2010, but it has
not been able to reverse the situation, despite the inten-
sive spending cuts, which have affected all policies, and
the increase of virtually all taxes.
From 2009 to 2012 government revenues increased
in relative terms by only 1.3 percentage points (from
35.1 per cent to 36.4 per cent of GDP) and spending
increased by less than 1 percentage point (46.3 per cent
to 47.0 per cent). Consequently, the total government
deficit has dropped by only 0.6 of a percentage point
(from –11.2 per cent to –10.6 per cent of GDP). Mean-
while, public debt has continued to rise very rapidly, as
a result of continuing refinancing needs in the financial
markets. In the context of serious uncertainties about the
future of the EMU, bond yields reached bail-out levels,
with the spread at an all time high. In 2012 the debt
reached 84.2 per cent of GDP, and in 2013 it continued
its upward trend.
Debt interest is growing every year, and in 2013 accounted
for 38 billion euros, equivalent to 3.43 per cent of GDP
(in terms of the national accounts). This is the second
highest central state budget expenditure in 2013 (after
pensions), much higher even than for unemployment
(27 billion) or the total civil service wage bill (33.3 billion).
Advocates of mindless austerity explain the paucity of
these achievements on the basis that spending cuts
should be even greater, and recurrently look at two
substantial areas in the central government budget: civil
servants and pensions. Cuts have already been adopted:
in the case of pensions, the freezing of its annual update
(in 2011) and the elimination of the bonus corresponding
to price rises (in 2013), despite being recognized by law.
In the case of public employees, wages were reduced (by
Figure 6: Public revenues and expenditure, 2003–2012 (% GDP)
Source: Eurostat.
7
A. DEL POZO SEN AND J.M. MARTÍN CARRETERO | SOCIAL COHESION AND THE STATE IN TIMES OF AUSTERITY
5 per cent in 2010 and 7 per cent in 2012) and frozen
in 2011.
But beyond these discretionary cuts, the real aim is
structural reform of government (by reducing its work-
force) and of the pension system (through the essential
parameters that determine access and amount). These
two reforms are being implemented by the Popular Party
government. These two budget lines are the two major
areas of public spending (along with health care, which is
the responsibility of the Autonomous Communities) with
enough significance to permanently bring about a sub-
stantial decrease in public spending (pension spending
accounts for almost one-third of the total expenditure of
the central government).
However, all indicators show that Spain, compared with
the rest of the euro area, does not have a large public
sector in relative terms (Spanish government expenditure
as a percentage of GDP is around 5 percentage points
lower than the euro area average). The spending in the
public pension system is not unaffordable or unsustain-
able, beyond economic difficulties that are derived from
the very heavy loss of employment and income already
mentioned. Therefore, both reforms seem to be aimed
at promoting the sustainability of the public finances;
however, they rather seem to be promoting a paradigm
shift in the Spanish public sector, as part of a huge
remodelling of the welfare state.
In contrast to the above, the ineffectiveness of the
measures taken to reduce the deficit and public debt
has a threefold explanation: first, spending cuts have
induced further contraction in economic activity and,
consequently, in tax revenues, which has nullified
the theoretical positive impact of fiscal consolidation.
Second, the very high level of fraud and tax evasion in
Spain (estimated at between 20 per cent and 25 per
cent of total revenues) makes a huge gap in terms of
fiscal pressure compared with the euro area average
(about 9.8 points of GDP in 2012, exactly the same as it
was in 2009). And third, the high cost of debt interest,
a direct result of the erroneous policy implemented by
the European institutions to tackle the crisis, especially
the European Central Bank, which has highlighted the
problems of structure and governance in the European
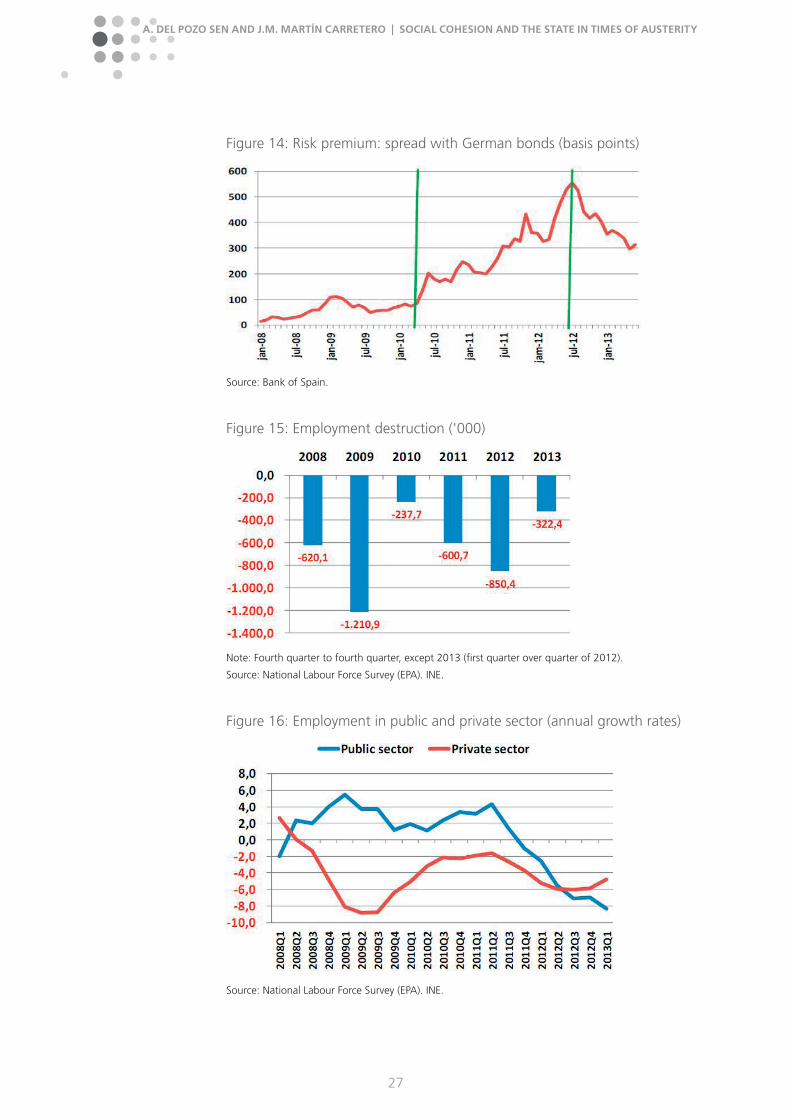
Union. It is illustrative to analyse the evolution of Spanish
risk premiums during the crisis, in particular two key
moments: first, in April 2010, the month in which the
financial crisis started in Greece and caused the shift to
extreme austerity policies (this spilled over the following
month to other European countries, including Spain),
and when the Spanish bond spread with Germany began
an unstoppable upward trend that saw its highest point
in July 2012 (555 basis points monthly average). Second,
in July 2012, when European Central Bank President
Mario Draghi announced the decision of the governing
body to act on the bond market in order to save the euro
(»whatever it takes, and, believe me, it will be enough«,
Draghi said) and to ensure affordable financing for the
countries that compose it. This statement was enough to
put the risk premium on a clear downward path.
It was not the austerity that brought calm to the mar-
kets, but the announcement that the ECB would act as a
lender of last resort, the way the Bank of England or the
Federal Reserve do.
3. Employment and Working Conditions
3.1 Unemployment, Major Economic Imbalance and Social Problems
The economic crisis in Spain has had a devastating impact
on employment. In five years it has destroyed 3.8 million
jobs, the employment rate has fallen more than 11 per-
centage points, the number of unemployed has grown
by 4 million and the unemployment rate has risen 17.5
points (from 9.6 per cent to 27.2 per cent the highest
rise in history). As in the rest of the world, it began as
a financial crisis, turning into an economic crisis in a
few months, bringing forth latent structural problems
in its growth model, and finally an employment crisis.
High unemployment has become the major imbalance
of the Spanish economy and the main source of social
problems.
Current austerity policies seek (at least in theory) the
recovery of employment through the creation of a virtu-
ous circle that, allegedly, would in the short term lead to
cheaper labour costs to gain external competitiveness,
and in the medium and long term, to generate investor
confidence through strict control of the deficit and pub-
lic debt and the implementation of structural reforms,
which essentially consist of market deregulation in order
to generate a more efficient allocation of resources.
Accordingly, employment is, from this perspective domi-
8
A. DEL POZO SEN AND J.M. MARTÍN CARRETERO | SOCIAL COHESION AND THE STATE IN TIMES OF AUSTERITY
nant for the past three years, an intermediate target for
achieving other objectives: strict control of public finance
and deregulation/liberalization of markets, while denying
any positive role for public initiatives.
But three years of strict application of this particular polit-
ical and economic strategy should be enough to have
induced some changes in employment trends, at least in
the main labour market figures. If employment was, and
is (as has been repeated by politicians) the target variable
of the entire economic strategy, and employment needs
are recognized, these policies should show a favourable
impact on employment rates, either quantitative or qual-
itative. However:
Job destruction has not slowed at all, and a relapse
was observed in 2012, which was the year with the larg-
est employment decline over the entire crisis since 2009
(850,400 employees). Overall, since the first quarter of
2010 1.77 million workers have lost their jobs, almost
10 per cent of previous total employment.
All economic sectors have experienced job destruc-
tion, but in the past three years, in absolute terms, the
service sector has shrunk more (43 out of 100 jobs lost,
followed by construction, with 35 out of 100). This is
because of what has happened since late 2011, when
the service sector (which has best withstood the impact
of the crisis from the beginning) began to lose jobs. If
the whole building crisis explains more of the decline in
employment (43 per cent), in the past year 58 per cent is
due to services (466,000 fewer workers).
Job destruction since 2010 is affecting foreign work-
ers more than previously: while the first phase of the crisis
this accounted for two out of 10 jobs lost, in the past
three years it has accounted for three out of 10 lost jobs.
From mid-2011 employment in the public sector,
which until then had maintained positive rates, began to
decline, and from the fourth quarter of that year at an
increasing pace. It now exceeds the employment losses
suffered by the private sector. This is a relevant result,
as it is a direct outcome of the cuts applied in public
policy at all levels. In the whole of 2012 and 2013, nearly
one in every four jobs lost was in the area of Public
Administration (290,300 out of 1,216,000).
The evolution of employment by type of contract
is especially interesting, to the extent that what has
happened since 2010 severely qualifies the widespread
perception that the crisis is affecting only (or mostly)
temporary employment, while permanent jobs, which
have high protection, are surviving this difficult period.
But there are two different stages. In the first two years
of the crisis it is true that almost all the employment
decline was temporary, but in the past three years both
temporary and fixed contracts have been affected in a
similar way, to the point that at this stage permanent
employment has been more affected than temporary
Figure 7: Employment volume (thousands) and unemployment rate (%)
Source: National Labour Force Survey (EPA). INE.
9
A. DEL POZO SEN AND J.M. MARTÍN CARRETERO | SOCIAL COHESION AND THE STATE IN TIMES OF AUSTERITY
jobs (53.4 per cent of the total, more than a million jobs,
compared to 875,000 temporary ones).
During the crisis the proportion of temporary workers
has fallen from more than 30 per cent to 22 per cent,
which is still very high in the European context, but the
lowest rate in Spain since the late 1980s. This is solely
due to the collapse of temporary employment (in relative
terms it is greater than the total), and not to the impact
of measures to that effect. It is, therefore, a passive
reduction of the duality that cannot be understood as a
change of present or future labour market composition.
In a context of strong employment contraction since
2010 the number of self-employed workers has grown
slightly (130,400 in total, 6.9 per cent). However, it is
clear that it is not a signal of an increase in activity; it is
explained by the transfer of workers who, unable to find
paid employment, decide to try self-employment. It is
thus an unwanted initiative overall, which is due more to
necessity than to an increase in entrepreneurial activity.
In other cases, this dynamic behaviour is also linked to
companies that outsource some of their activities; turn-
ing fixed costs into variable costs and moving the market
and production risk onto their former employees, who
are now converted into self-employed (in fact, »false
self-employed«).
By type of working day, part-time employment has
outperformed the contraction in activity, as it is the
norm in economic crises, even retaining positive rates for
most of it. It is noteworthy that since the start of 2012
part-time employment has enjoyed strong growth, while
full-time work has decreased even further. In an optimis-
tic interpretation, this process could be anticipating an
overall improvement in employment. But there are no
activity indicators to support this thesis. On the contrary,
it appears that it reflects the transfer to part-time by
previously full-time employees, and that due to economic
difficulties, companies are changing their contracts to
reduce costs and achieve more flexibility.
In Spain, part-time employment is mainly an unwanted
option, unlike in most of its European partners, and this
feature has worsened during the crisis: over 60 per cent
of workers declared that they have part-time jobs because
they cannot find full-time employment, whereas this per-
centage was 31 per cent in 2008. It is, without doubt,
an effect of high unemployment and cuts in revenues.
Overall, the crisis shows a steady increase in the num-
ber of underemployed (working fewer hours than they
want, or in jobs that require less skills relative to their
qualifications). While underemployment has not changed
much since 2010, it has continued to rise to 2.5 million
workers, 15 per cent of the total workforce).
The decline in employment has, of course, led to a very
strong increase in unemployment, as already mentioned.
The worsening unemployment figures have been fairly
widespread and a truly spectacular escalation, rising
above 6 million unemployed (6.2 million in the first quar-
ter of 2013). Unemployment rates have continued to
grow during the period of austerity in Spain to very high
levels in the European context, whatever the group of
workers studied. The overall rate has increased through-
out the crisis by 17.5 percentage points (7.1 percentage
points in the past three years), and in the first quarter of
2013 stood at 27.2 per cent, the highest in the European
Union.
While unemployment among the under 25s has doubled
during the crisis, unemployment among 45–55 year-olds
has multiplied by 3.6. If at the beginning of the crisis,
unemployment greatly affected young people, focusing
on the non-renewal of temporary contracts, since 2010
it has affected older workers with more experience, the
structural part of the workforce. Four out of ten new
unemployed in the past three years are older than 45,
seven out of ten if we take those over 35 years. Those
workers have greater difficulty in re-integration, as many
of them come from traditional sectors and construction,
whose skills do not easily transfer to other sectors. The
situation has worsened as the government has reduced
the amount allocated to active labour market policies
over the past three years, which has been cut by 4 billion
euros, more than halving the initial budget.
The number of long-term unemployed (those who
actively seeking jobs and have been unemployed for
more than one year) is growing steadily, now standing at
3.5 million, 56 per cent of the total. Of these, 2.1 million
have been looking for two years or more. Half of this
long-term unemployment has been generated in the past
three years. In fact, all of the increase in unemployment is
due to this component, which gives an idea of the labour
market paralysis and lack of prospects.
10
A. DEL POZO SEN AND J.M. MARTÍN CARRETERO | SOCIAL COHESION AND THE STATE IN TIMES OF AUSTERITY
The consequences are severe because these long-term
unemployed are at the core working age, and most
of them have family responsibilities. Those who are
exhausting their unemployment benefits are being
affected by poverty and social exclusion. The number of
households in which all active members are unemployed
has increased almost fourfold during the crisis, and has
now reached 1.9 million. In 2012 and so far in 2013
this figure has continued to rise. Since 2010 it has also
increased the proportion of those who do not receive any
income (not only unemployment benefits, but also other
types of income such as a pension), from 20 per cent to
25 per cent.
To sum up, these features show that the crisis and the
policies applied are not slowing job losses. On the con-
trary, they are raising unemployment in Spain, which is
becoming structural, with a high economic and social
impact that hampers any possible recovery. In addition,
there has been an overall increase in precarious employ-
ment, which makes workers more vulnerable (less stable,
lower pay, more underemployment and increased worker
dissatisfaction). This has serious consequences for pov-
erty and inequality.
3.2 Labour Market Deregulation: The 2012 Reform
Legal changes in the labour market should be considered
part of the austerity agenda, although they do not have
any direct impact on public finances. The labour market
reform has been one of the basic elements of all the
recommendations of the Troika and other national and
international institutions (Bank of Spain, OECD) in the
same neoliberal ideological orbit.
Since 2010 Spain has implemented three changes in the
field of labour relations. The relevance and extent of
these actions qualify as labour reforms (in 2010, 2011
and 2012), and all of them have been carried out uni-
laterally by the government, without reaching an agree-
ment with the social partners. All these reforms outline in
their explanatory statements, more or less explicitly, three
objectives: establish conditions to boost job creation or
slow job destruction; reduce labour market segmentation
between permanent and temporary workers; and raise
labour market efficiency, increasing flexibility for compa-
nies and enhancing worker security. But the truth is that
actual policy measures have been inspired (admittedly by
varying degrees) by the doctrine labour market defended
by international institutions mentioned above.
The results show that none of these reforms has met
the goals that supposedly drove them. However, they
have been taking progressive steps in the formation of a
more deregulated labour market, and have affected the
balance of power in collective bargaining within firms.
This has a substantial economic impact, because collec-
tive bargaining is the initial instance that determines the
primary distribution of income, as the distribution of the
generated added value between wages and profits. The
more unbalanced is the first distribution, the harder it
is to promote a less unequal society through the instru-
ments of fiscal policy (taxes, benefits or other transfers).
It also directly affects the levels of labour productivity and
workers’ quality of life.
The reform passed by the Parliament in 2012 was the
most intensive and substantial in the past twenty years
and represents a quantum leap in deregulation. On one
hand, it continues with the changes and reforms men-
tioned above; on the other, it introduces new substantial
changes, especially in the area of collective bargaining,
by removing a wide number of guarantees for workers.
The reform largely complies with the traditional demands
of business organizations and international institutions
(IMF, ECB, OECD). In this regard, this reform promotes
a paradigm shift of labour relations in Spain and not a
mere modification of the existing model created by the
adoption of basic labour standards, which was adopted
in 1980 (Workers’ Statute). This reform is set to change
the correlation of forces in labour relations in favour of
employers and to the detriment of workers.
The amendment was approved just a month after the
social partners signed an agreement which was valid for
2012–2014 (II Agreement for Employment and Collec-
tive Bargaining 2012–2014) in which they negotiated
changes in management mechanisms governing labour
conditions in order to increase flexibility and to moderate
wages significantly over the whole period, to be matched
by a moderation of profits for the sake of gaining compet-
itiveness in the short term. But the government’s labour
reform, affecting virtually all issues in agreements and
giving employers discretionary powers, went far beyond
the provisions of agreements between employers and
unions, and left agreements with little practical validity.
11
A. DEL POZO SEN AND J.M. MARTÍN CARRETERO | SOCIAL COHESION AND THE STATE IN TIMES OF AUSTERITY
A year after the reform, we can highlight some of the
results. It has not slowed job losses or reduced unem-
ployment; it has not increased the total proportion of
permanent contracts; the new contract for employers is
used only marginally; the number of collective redundan-
cies has increased (especially those not agreed between
the parties), as have the criteria for objective individual
dismissals (those with lower compensation, 20 days per
year worked); it has weakened the bargaining position of
the trade unions and collective bargaining has decreased
(the number of workers covered by collective bargaining
is the lowest for many years).
But the main result of the reform is wage cuts. In a
scenario of recession and high unemployment, the great
power given to employers by the Popular Party labour
reform has caused wages to plummet. It was, in short, a
key aim to establish wage devaluation, which it is being
proposed by national and international bodies as a mean
of increasing competitiveness for countries with public
finance difficulties.
3.3 Wage Devaluation as a Way Out of the Crisis
According to the theory that supports the austerity pol-
icies, to the extent that it is not possible to implement
incentives to economic recovery on the spending side
because of the imbalances in public finances, the only
way is to influence the supply side, improving enter-
prises’ production to increase their competitiveness by
increasing productivity and reducing costs. To achieve the
needed productivity gains, market reforms are required
(for example, concerning labour) that require some time
to bear fruit. Therefore, in the short term, the solution is
to reduce business costs, so-called internal devaluation,
which produces an effect similar to currency devaluation,
which is now impossible because Spain is part of the euro
Table 1: Main measures implemented by labour market reform, 2012
Hiring and employability:
Creation of a new indefinite contract benefiting employers for companies of fewer than 50 workers, with economic incentives and a probation period of one year (free dismissal, without cause and indemnification during that year).
Modification of training contracts, extending the maximum age to 30 years old and making it more flexible.
Possibility of extraordinary hours in part-time contracts.
Categorisation of temporary job agencies as placement agencies.
Annual 20 hours paid leave for training for workers with at least one year at the firm.
Dismissal:
The amount of severance pay due in case of dismissals without just cause was lowered from 45 to 33 days a year, with a maxi-mum of 24 monthly wages instead of 42.
Abolition of so-called express dismissal, in terms of which the employer disregarded the inappropriateness of the dismissal in order to make its effects immediate, against a severance payment equivalent to 45 working days’ wages for each year of employment at the firm.
Extension of dismissal for objective causes (indemnification of 20 days per year, with maximum of 12 monthly wages), especially for economic reasons.
Modification of working conditions:
Increase of enterprises’ ability to unilaterally modify working conditions, including wages.
Extension of firms’ possibility to deviate from collective agreements with regard to working conditions. Possibility of submitting discrepancies to obligatory arbitration.
Collective bargaining:
Giving priority to agreements at company level over those at sectoral level.
Elimination of automatic extension of collective agreements after expiry: collective agreements cease to apply a year after expiry if no new agreement has been reached.
Source: Authors’ elaboration.
12
A. DEL POZO SEN AND J.M. MARTÍN CARRETERO | SOCIAL COHESION AND THE STATE IN TIMES OF AUSTERITY
zone. But as the only really controllable costs are wages,
internal devaluation translates into wage devaluation,
the widespread and drastic cutting of wages.
This approach to wages considers them solely as a cost of
business, but not their function as source of income for a
large part of the population and thus one of the key driv-
ers of domestic demand and production. Thus, despite
a situation of recession and high unemployment, as in
the crisis in Spain, and in the absence of strong external
demand due to the similar situations experienced by
most EU countries, a strongly procyclical policy is being
implemented and it is only feeding the contraction of
the economy.
Wages in Spain have increased moderately for decades
and have not been a source of conflict. Overall, in the
most recent period of growth (1994–2007) wages grew
but less than productivity, so that firms’ costs fell and
thus they made significant profit gains. Meanwhile,
employment grew more than in any other EU country.
This peaceful evolution, which achieved positive results
for all parties, was helped by the social climate based
on dialogue, which culminated in numerous collective
agreements between employers and labour organiza-
tions. Specifically, from 2002, the social partners signed
agreements at national level that reflected the common
provisions that they sent to their negotiators at different
levels (firm, sectoral). In those agreements, the social
partners shared a wage model based on wage increases
higher than inflation but lower than productivity. This
dynamic of social dialogue (firms, unions) has continued
despite the crisis, and it was reflected in the Second
Agreement on Employment and Collective Bargaining
in January 2012, which reflected new wage criteria for
dealing with the crisis, including increases in 2012–2014,
which were related to changes in GDP and involved very
significant losses of purchasing power but a noticeable
reduction in costs for businesses.
But the labour reform blew this agreement out of the
water, imposing new rules that gave even more power
to employers, far beyond what was proposed in the
agreement, without negotiations with workers. It shows
a clear commitment to establishing a new model of
labour relations based on authoritarianism rather than
on dialogue and consensus. The impact on wages has
been substantial.
It should be noted that, since the beginning of the crisis,
wages have developed moderately, for two reasons. First,
because the impact of economic difficulties, with dramatic
job losses, has modified the balance of power in compa-
nies and necessarily gives priority to employment versus
wages; and second, the responsible action of the social
partners, with the signing of agreements at national level,
taking into account general macroeconomic objectives
and avoiding possible conflicts and lack of coordination
in different areas of collective bargaining. Thus, wage
increases were gradually reduced in the agreements, so
that in most years wages lost purchasing power as they
grew less than inflation (the exception was 2009, due to
the sudden and unexpected fall in consumer prices, and
2010, which saw a very small gain). Between 2010 and
2011 wages lost 1.7 percentage points of purchasing
power, and this was repeated in 2013.
Similarly, nominal labour and wage costs have been con-
tinuously moderating during the crisis, to the point that
in 2012 they recorded a negative rate. In 2011 labour
costs rose slightly, but this was not due to changes in
wages, but to severance payments, as employment cuts
affected workers with permanent contracts, which are
more costly to terminate. Once adjusted for inflation,
wage costs in real terms declined from 2010 to 2012 by
6.4 per cent. This has continued in 2013.
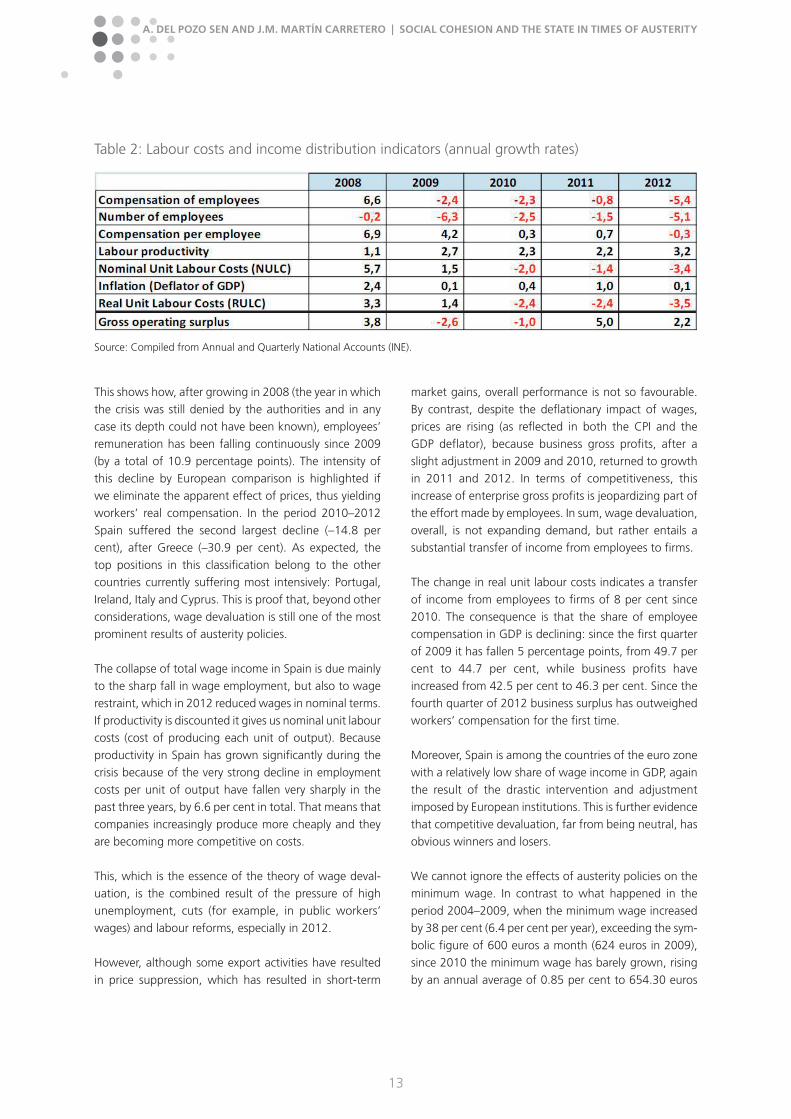
The data provided by the National Accounts are probably
the most explanatory, since they offer a broader per-
spective on the effects of all components involved in the
primary distribution of income from production. Table 2
summarizes the evolution of all its main components:
13
A. DEL POZO SEN AND J.M. MARTÍN CARRETERO | SOCIAL COHESION AND THE STATE IN TIMES OF AUSTERITY
This shows how, after growing in 2008 (the year in which
the crisis was still denied by the authorities and in any
case its depth could not have been known), employees’
remuneration has been falling continuously since 2009
(by a total of 10.9 percentage points). The intensity of
this decline by European comparison is highlighted if
we eliminate the apparent effect of prices, thus yielding
workers’ real compensation. In the period 2010–2012
Spain suffered the second largest decline (–14.8 per
cent), after Greece (–30.9 per cent). As expected, the
top positions in this classification belong to the other
countries currently suffering most intensively: Portugal,
Ireland, Italy and Cyprus. This is proof that, beyond other
considerations, wage devaluation is still one of the most
prominent results of austerity policies.
The collapse of total wage income in Spain is due mainly
to the sharp fall in wage employment, but also to wage
restraint, which in 2012 reduced wages in nominal terms.
If productivity is discounted it gives us nominal unit labour
costs (cost of producing each unit of output). Because
productivity in Spain has grown significantly during the
crisis because of the very strong decline in employment
costs per unit of output have fallen very sharply in the
past three years, by 6.6 per cent in total. That means that
companies increasingly produce more cheaply and they
are becoming more competitive on costs.
This, which is the essence of the theory of wage deval-
uation, is the combined result of the pressure of high
unemployment, cuts (for example, in public workers’
wages) and labour reforms, especially in 2012.
However, although some export activities have resulted
in price suppression, which has resulted in short-term
market gains, overall performance is not so favourable.
By contrast, despite the deflationary impact of wages,
prices are rising (as reflected in both the CPI and the
GDP deflator), because business gross profits, after a
slight adjustment in 2009 and 2010, returned to growth
in 2011 and 2012. In terms of competitiveness, this
increase of enterprise gross profits is jeopardizing part of
the effort made by employees. In sum, wage devaluation,
overall, is not expanding demand, but rather entails a
substantial transfer of income from employees to firms.
The change in real unit labour costs indicates a transfer
of income from employees to firms of 8 per cent since
2010. The consequence is that the share of employee
compensation in GDP is declining: since the first quarter
of 2009 it has fallen 5 percentage points, from 49.7 per
cent to 44.7 per cent, while business profits have
increased from 42.5 per cent to 46.3 per cent. Since the
fourth quarter of 2012 business surplus has outweighed
workers’ compensation for the first time.
Moreover, Spain is among the countries of the euro zone
with a relatively low share of wage income in GDP, again
the result of the drastic intervention and adjustment
imposed by European institutions. This is further evidence
that competitive devaluation, far from being neutral, has
obvious winners and losers.
We cannot ignore the effects of austerity policies on the
minimum wage. In contrast to what happened in the
period 2004–2009, when the minimum wage increased
by 38 per cent (6.4 per cent per year), exceeding the sym-
bolic figure of 600 euros a month (624 euros in 2009),
since 2010 the minimum wage has barely grown, rising
by an annual average of 0.85 per cent to 654.30 euros
Table 2: Labour costs and income distribution indicators (annual growth rates)
Source: Compiled from Annual and Quarterly National Accounts (INE).
14
A. DEL POZO SEN AND J.M. MARTÍN CARRETERO | SOCIAL COHESION AND THE STATE IN TIMES OF AUSTERITY
a month (in annual terms, with fourteen paydays). This
means that, given the evolution of the CPI in this period,
the minimum wage in real terms has fallen by 6.1 per-
centage points (as of June 2013). The minimum wage in
Spain is only 35 per cent of the average wage, one of the
lowest of all countries in which the EU has established a
minimum wage job reference in its regulations.
In addition to its direct impact on the quality of life of
the recipients, an additional non-negligible effect of
this is that it reduces social security contributions, at a
time when financial difficulties resulting from the decline
in employment are evident. Thus workers are likely to
receive lower pensions in the future.
4. Fiscal Consolidation and Social Spending
In contrast to other continental and northern EU mem-
bers, but similar to other southern European countries,
the welfare state in Spain is close to the so-called
»Mediterranean model«, characterised by less developed
social policies, undeveloped institutions and lower levels
of social spending.
As in the rest of the European Union, the Spanish welfare
state has been the subject of various debates regarding
its sustainability and efficiency.1 During the first years of
democracy, efforts were made to extend the education
and health care systems, while social security experienced
various reforms during the 1980s and 1990s in order to
increase its sustainability. Labour market reforms were
also supplemented by unemployment benefit reforms.
New social policy paradigms2 are aimed at developing
a more proactive, dynamic welfare state, whose main
target is to promote »active citizenship«, with intensive
investments in early stages of life through education
and preventive health care, while bringing about higher
participation on the part of beneficiaries in the traditional
pillars of protection against illness, unemployment and
old age.
1. Moreno, Reformas de las Políticas de Bienestar en España, Siglo XXI Editores. 2009.
2. Mulas-Granados, El Estado Dinamizador, Editorial Complutense- FIIAPP, 2009 and Giddens, Diamond and Liddle, Global Europe, Social Europe, Polity Press, London 2006.
In Spain, changes in social policy financing are only
partially aimed at promoting these reforms. Budgetary
constrictions due to fiscal consolidation have led to a
lower level of social spending, and budgetary cuts are
more focused on social investment (health care, educa-
tion) rather on more passive protection (pensions and
unemployment). The fiscal consolidation path does not
allow a proper debate on the future of the Spanish social
model, and, in a way, austerity is undermining the capac-
ity of Spanish social policies for further modernization.
According to Eurostat, Spanish social spending has tra-
ditionally been lower than the EU average. While the
EU average is around 25 per cent of GDP (excluding
education), social spending in Spain remained at around
20 per cent (excluding education) during the years prior
to the crisis. At the beginning of the crisis in 2008, and
until 2010, Spanish social spending rose to 25.7 per cent
of GDP (excluding education).
A proper analysis of this figure must include a detailed
study of its different components: health care, pensions,
unemployment and other social protection expenditure.
Regarding health, expenditure peaked in 2009 at 6.8 per
cent of GDP, before starting a decline to 6.3 per cent of
GDP in 2011. It is expected than measures taken by the
Popular Party government in 2012 will reduce public
health care expenditure during the coming years, and
the Stability Programme of 2013–2016 set the health
expenditure target at 5.4 per cent of GDP in 2016.
Education expenditure also peaked in 2009, at 5.1 per
cent of GDP. Spending was reduced in 2010 and 2011
to 4.7 per cent of GDP. The Spanish Stability Programme
aims to reduce it further to 4.0 per cent of GDP in 2016.
While it represented 13.1 per cent of GDP in 2007,
just before the crisis, social protection peaked in 2010
at 17 per cent of GDP, declining to 16.9 per cent of
GDP in 2011. The main factor in this increase was the
rising unemployment benefits (from 1.6 per cent of GDP
in 2007 to 3.2 per cent in 2010) and pensions (from
10.3 per cent to 12.3 per cent of GDP). According to
the Spanish Stability Programme, social protection will
decline to 16.6 per cent of GDP in 2016.3 As a whole,
social expenditure is expected to be reduced in the next
3. Spain Stability Programme 2013–2016. Updated in April 2013.
15
A. DEL POZO SEN AND J.M. MARTÍN CARRETERO | SOCIAL COHESION AND THE STATE IN TIMES OF AUSTERITY
three years as a percentage of GDP, to the levels existing
before the crisis.
These projections suggest that, in real terms, in 2016,
social expenditure in Spain (social protection, education
and health CARE) will be reduced by 6 per cent from
2011 data. Health care and education will be reduced
by 15 per cent and social protection – pensions and
unemployment benefits – will be reduced by 1 per cent.
As a result, those areas more related to social investment
(education, health care) will suffer the highest reduction,
while passive protection – unemployment, pensions – will
maintain relative stability.
We will examine the various components of social
expenditure and the different measures taken in order to
reduce them as a percentage of GDP.
4.1 Health Care Spending
After a decade of steady growth, public expenditure on
health care has suffered a decline of 10 per cent between
2009 and 2013. Most of the previous increase (from
5.2 per cent of GDP in 2002 to 6.8 per cent in 2009),
was produced due to the decentralization of the National
Health Service from central government to the regional
governments. In 2009, regional governments managed
90 per cent of total public health expenditure, with huge
differences between them. For example, the regional
government of the Basque Country allocated 1,632
euros per capita in 2011, while the regional govern-
ment of Andalusia spent 1,121 euros per capita. These
regional differences in public health care provision make
it difficult to achieve proper control of health finances.
As a whole, public health care has experienced declining
expenditure since 2009, especially since the beginning of
fiscal consolidation.
The main restructuring of the health care system is based
on Decree-Law 5043/2012, adopted in April 2012. This
decree establishes new parameters for the national
health care system, including the following:
A new classification of beneficiaries. Irregular immi-
grants older than 18 years of age receive free health
assistance only in emergencies, birth and pregnancy.
A new portfolio of services, which makes a distinction
between basic and complementary services. It is expected
that complementary services will be paid for, totally or
partially, by users.
A new system of pharmaceutical services, including
intensive use of generic drugs, the exclusion of some
products and the establishment of a co-payment system
where users have to pay a percentage of the pharmaceu-
tical products they use.
Additional measures were taken in order to increase the
working hours of health personnel, push the retirement
of older health workers, not to allow the substitution
of retired staff and freeze new public investments in
the health system. In 2012, some regional governments
initiated a new round of privatization in order to save
costs and to allow private initiatives to manage some
hospitals. Madrid allowed six centres to be managed by
private firms.
Figure 8: Social expenditure as a percentage of GDP, 2007–2011 and 2016 (projection)
Source: EUROSTAT and Spain Stability Programme 2013–2016.
16
A. DEL POZO SEN AND J.M. MARTÍN CARRETERO | SOCIAL COHESION AND THE STATE IN TIMES OF AUSTERITY
As a result, regional governments’ public expenditure
per capita on health care has declined in real terms.
According to the initial annual budget, annual budgets
for 2013 are, in real terms and on average, 17 per cent
lower than those approved in 2010.
This reduction is not uniformly distributed. Differences
vary from 29 per cent budget cuts by La Rioja regional
government to 2 per cent budget cuts by Asturias
government for the period 2007–2013. Other regional
governments with substantial budget cuts include
Extremadura (–22 per cent), Andalusia and Valencia (both
with budget cuts of –18 per cent). This diversity in the
impact of budget cuts is not clearly related to any kind
of harmonization of regional expenditure on health care.
While variation among regional governments increased
during the first part of the crisis, fiscal consolidation has
reduced it slightly.
In conclusion, regional governments, which are in charge
of health care, have reduced spending by 13 per cent
on average since the start of the crisis, but with diverse
consolidation paths. As a result, while convergence in
health spending has been increasing since 2010, previous
divergence from 2007 to 2010 is still defining regional
differences in the national health system.
It is expected that health care budgets will be subject
to further reductions in order to reach the stability pro-
gramme targets. These new reductions will arrive with
the full implementation of the public health care system
reform established in 2012, but whether this reform
will be enough remains unresolved. The reform is also
subject to a strong political debate as some regional
governments claimed that it could infringe regional
competences, and it is now under review by the Spanish
constitutional court.
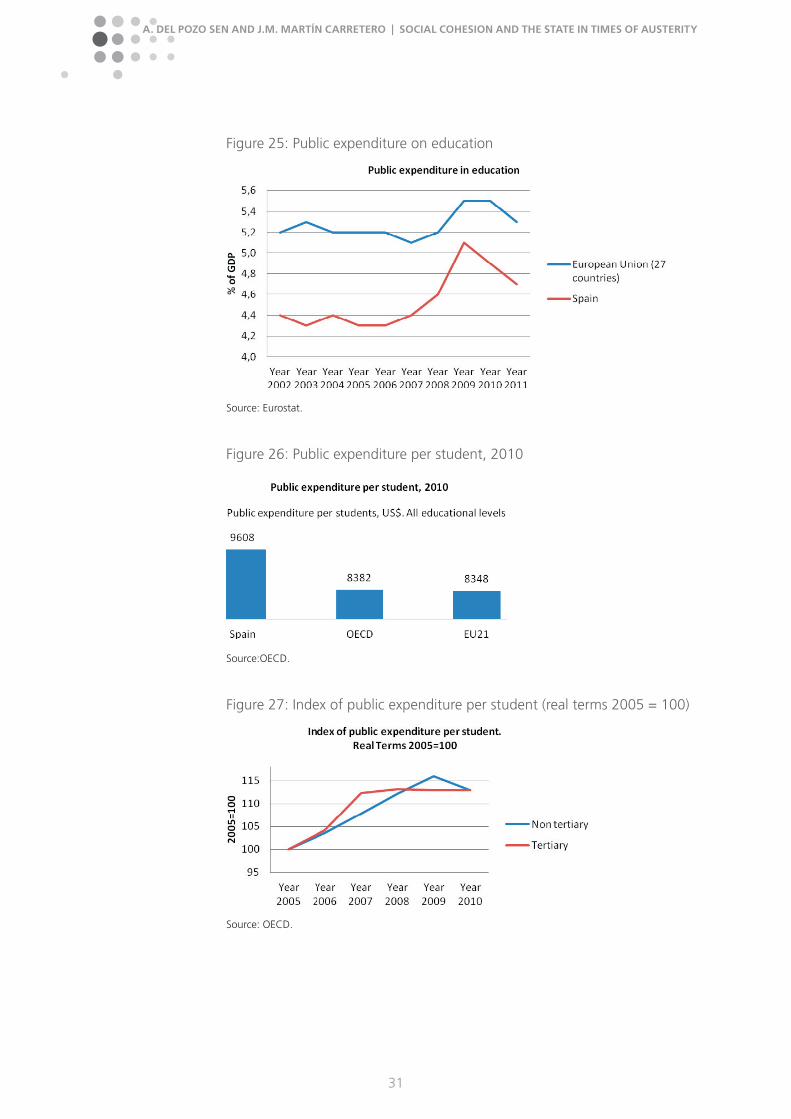
4.2 Public Spending on Education
As in health care policy, education has been provided by
regional governments since the beginning of 2003, and
this has led to a huge divergence in expenditure. During
the past decade, public expenditure in education as a
percentage of GDP has been lower than the EU27 aver-
age. It peaked in 2009 at over 5 per cent but declined in
2010 and 2011.
Lower investment as a percentage of GDP is due to
Spain’s demographic pyramid, with fewer people of the
relevant age. In terms of spending per student, Spain
allocates a higher amount than the European Union and
the OECD averages, at all educational levels.
Nevertheless, this amount per student has fallen. In
current US dollars, in 2010 Spain allocated less money
per student than in 2009, when the average amount per
student was 10,094 US dollars per student. According
to the OECD education-at-a-glance indicators, public
expenditure per student had different paths according
to educational level. Spending at primary and secondary
levels rose by 16 per cent between 2005 and 2009, to
decline in 2010, while spending at tertiary level rose by
13 per cent in only two years since 2005, to be frozen
between 2008 and 2010.
While some regional governments started to introduce
adjustment measures in 2010, most of the adjustment
in education spending was implemented by the Popular
Party government in 2012, through new legislation on
the rationalization of public education expenditure. This
act (Decree Law 14/2012) contains a number of mea-
sures to guarantee the sustainability of public education
finances. These measures are as follows:
increase the ratio of students per classroom to 20 per
cent;
establish a lower limit of teaching hours per teacher
at 25 hours per week in primary education and 20 hours
per week in secondary education;
tighten the capacity of schools to substitute teachers
with temporary staff;
rationalize the capacity of public universities to pro-
pose and to offer new university degrees;
reinforce the review and evaluation of university lec-
turers and professors;
impose a balanced budget on universities;
increase university fees;
narrow the criteria for the granting of scholarships.
17
A. DEL POZO SEN AND J.M. MARTÍN CARRETERO | SOCIAL COHESION AND THE STATE IN TIMES OF AUSTERITY
As the education system is highly decentralized, regional
governments have responded in different ways to the
budget cuts in education. For example, the regional
government of Madrid has imposed an aggressive
adjustment in public education, including the reduction
of temporary teachers, the introduction of new tuition
fees in secondary education and an increase in public uni-
versity fees. Between 2009 and 2013, public university
fees in Madrid increased by 82 per cent in real terms for
degrees with the highest level of lab work (for example,
medical studies).
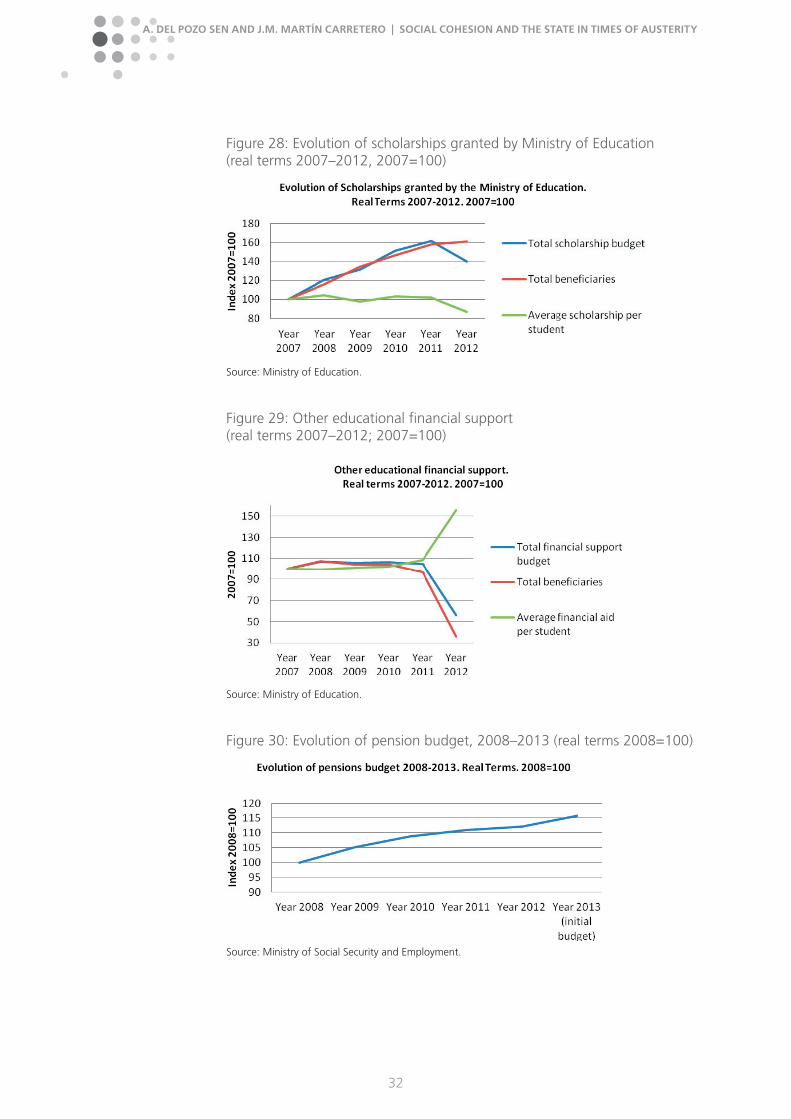
Due to the measures taken by the government in 2012,
scholarships suffered a decline in the last academic
period. After similar evolution between total budget
and beneficiaries, in 2012 the total amount allocated
to scholarships decreased. Additionally, the increase of
beneficiaries due to the crisis has resulted in a higher
reduction of the average grant per student, which was,
for the academic year 2012–2013, around 88 per cent of
2007 figures in real terms.
The development of other forms of financial aid has a
different profile. Such assistance includes a gratuity for
books, meal subsidies and other benefits not related to
education fees. While during 2007–2011 the develop-
ment of the budget and beneficiaries was similar, and
therefore the average financial aid per student remained
stable, in 2012 a dramatic drop in the budget and the
tightening of the eligibility rules led to the result that for
those students who still received financial aid the average
support granted per student has fallen by up to 50 per
cent in recent years.
The reason for this different development of scholarships
and other forms of financial support is the change in the
eligibility rules for financial support. Until the academic
year 2012–2013, several regional governments guaran-
teed a subsidy for books for all students, in the academic
year 2012–2013 a number of regional governments – for
example, La Rioja – terminated this system and substi-
tuted it by a system aimed at the poorest families. Other
regional governments tightened the eligibility criteria,
such as the regional governments of Valencia and of
Madrid. As a result, beneficiaries of such programmes
declined by 60 per cent from the previous academic year.
As a result of all these changes, public expenditure
on education has been reduced in recent years, and
especially during 2012, with a reduction of the budget
allocation per student, an increase in education fees
and a reduction in average grants and other financial
support. All these adjustments represent a reduction of
4.03 per cent in real terms from 2011 to 2012.4 Further
cuts are likely in order to achieve the targeted 15 per cent
budget cut between 2011 and 2016, according to the
abovementioned stability programme.
4.3 Pensions
Pensions are one public budget line that has not suffered
a real decline since the beginning of the crisis. In fact,
in the years before the crisis, public pensions registered
enough surpluses to generate a »reserve fund« to be
used during recessions and economic crises. The Spanish
pension system is pay-as-you-go, based on contributions
from current employers and workers, which are used to
pay current pensions. Since the beginning of the crisis,
the pension budget has increased by more than 15 per
cent in real terms.
This evolution of the total budget is due to two reasons:
the increase in the number of beneficiaries, which rose
from 8.4 million in 2008 to 9 million in 2013, and the
political commitment to an annual revalorization of
pensions. While during the first part of the crisis, reval-
orization was fairly strong, it has slowed down since
the beginning of fiscal consolidation in 2010. Between
2008 and 2010, real growth of the average pension was
6.35 per cent, while between 2010 and 2013 is has been
1.34 per cent. In 2012, the monthly average pension was
836 euros.
This average hides a number of specific developments. In
2011, only minimum pensions grew; the rest were frozen
by the government.5 In 2013, the government decided
again that only minimum pensions and those below 1000
euros a month would grow, by 2 per cent, leaving the rest
with an increase of 1 per cent for 2013. To some extent,
the evolution of average pensions since 2010 is the result
of a narrowing of the range of pensions rather than
their increase. Taking, for example, retirement pension
with one dependent and the highest allowed pension,
4. Ministry of Education, »La educación en cifras curso 2012–2013«, Madrid 2013.
5. Royal Decree 1794/2010.
18
A. DEL POZO SEN AND J.M. MARTÍN CARRETERO | SOCIAL COHESION AND THE STATE IN TIMES OF AUSTERITY
the lower pension grew by 8 per cent between 2008
and 2010 and has remained relatively stable since then;
during the same period, and after an increase of 3 per
cent between 2008 and 2009, the purchasing power of
the highest allowed pension decreased by 4.1 per cent
before tax between 2009 and 2013.
Other types of pensions include non-contributary illness
and retirement pensions, which are awarded to peo-
ple who were not able to make enough contributions
to the pension system. There were a total of 445,278
beneficiaries in 2012. In this case, the evolution of total
budget and average pension differs. The decline in the
number of beneficiaries led to a decline in the general
budget in real terms and, therefore, to an increase in real
terms of average non-contributary pensions between
2008 and 2011, falling in 2012 to 1 per cent of the
total real increase between 2008 and 2013. For 2012,
the monthly average non-contributary pension was 360
euros, less than half the general average pension. In
2013, the government took the decision not to finance
such pensions with social security funds, but with the
general budget, as part of its social policy programmes.
While pensions have been affected by fiscal consoli-
dation, social security finance and future sustainability
remain important issues for Spain. The social security
system was able to generate a surplus between 2000
and 2009, creating a reserve fund of 66 billion euros in
2011. Social security entered into deficit in 2010, with no
recovery between 2011 and 2012.
The reason behind this tendency towards deficit was the
huge increase in unemployment and the decrease in the
number of contributors, which reduced system revenues
while system expenditure continued to grow in real
terms. As a result, in 2012 the government had to draw
on the reserve fund in order to meet pension payments.
Taking a long-term view, the sustainability of the social
security system has been seen as difficult to guarantee
in its current model. As Spain maintains a pay-as-you-go
system, demographics are against it if no action is taken.
Longevity and an increase in the number of old people,
together with a lack of working young people is worsen-
ing the dependency rate. It is foreseen that in 2060 Spain
will have twice the number of beneficiaries of public
pensions – up to 16 million – increasing the proportion of
GDP spent on public pensions in the long term.6
The long-term sustainability of the social security system
is more related to Spain’s capacity to repay public debt
than to the current public deficit. The IMF,7 the OECD8
and the European Commission9 have recommended
that Spain review its social security system in order to
guarantee long-term sustainability.
In 2011, the government launched a reform of the social
security system, postponing the retirement age from 65
to 67, and increasing the contributary period from 35 to
37 years. The measure will be progressively implemented,
starting in 2013, and it will delay the retirement age one
month per year until 2027.10 In 2013, conditions for
early retirement were tightened, increasing the number
of contributing years to 35 and including the possibility
of partial retirement.11
In 2013, the government issued a report on the sustain-
ability of state pensions, whose conclusions will form
part of a new reform. The report, signed by a group of
experts, includes some conclusions about the sustainabil-
ity of pensions, such as the »sustainability factor«, which
would allow government to adjust the amount of future
pensions to specific circumstances, such as longevity and
the system’s financial strength. The report also suggests
decoupling the level of pensions from inflation.12 The
conclusions of the report are intended to be implemented
in 2014–2019.
In conclusion, while pensions have been increasing even
since the start of fiscal consolidation in 2010, this increase
is more related to the increase in the number of bene-
ficiaries rather than an increase in benefits. The average
pension grew in the first part of the crisis but remained
stable after 2010 and, while minimum pensions are still
growing, other pensions are losing purchasing power.
In order to continue along the fiscal consolidation path,
6. European Commission Ageing Report 2012.
7. IMF Country Report 13/245 Spain. Chapter IV Consultations.
8. OECD Pensions Outlook 2012.
9. European Commission Recommendations for Spain 2013, COM(2013) 359 final.
10. Law 27/2011.
11. Royal Decree Law 5/2013.
12. Report of the Experts committee on the sustainability factor for the public system of pensions. June 2013.
19
A. DEL POZO SEN AND J.M. MARTÍN CARRETERO | SOCIAL COHESION AND THE STATE IN TIMES OF AUSTERITY
new losses of purchasing power are expected. At the
same time, the social security system is being subjected
to substantial reform in order to guarantee its long-term
sustainability. This reform will undoubtedly drive pensions
downwards, in both nominal and real terms.
4.4 Unemployment Benefits
Due to the situation on the Spanish labour market, pub-
lic spending on unemployment benefits has increased
dramatically since 2007, rising from 1.6 per cent of
GDP in 2007 to 3.2 per cent of GDP in 2010. Although
unemployment has continued to increase, since 2010 the
unemployment benefits budget has not grown and has
even been reduced. At the same time, there has been a
substantial deviation between the initial budget and the
final budget, which has been systematically higher than
expected, due to the negative evolution of the labour
market. This mismatch represented around 1.5 per cent
of GDP in 2009, and while in 2010 the initial and final
budgets were almost balanced, in 2011 the final budget
was again higher than the initial one, and estimates for
2012 are also for expenditure higher than the initial
budget.
As unemployment has risen dramatically in Spain and
the number of long-term unemployed has increased,
many unemployed people have ceased to receive
unemployment benefit from the contributary scheme
(unemployment insurance) and now receive it from
the non-contributary scheme (unemployment benefit).
Finally, some have ceased to receive any form of benefit,
yet have no chance of getting a job. While in 2008 benefi-
ciaries of non-contributary schemes made up 39 per cent
of total beneficiaries, in 2012 the percentage was 53 per
cent. At the same time, the coverage rate (percentage of
registered jobless who receive any kind of benefits) fell
from 73 per cent in 2008 to 62 per cent in mid-2013,
after peaking at 78 per cent in 2010. Average benefit
has developed in a similar direction to the budget and the
coverage ratio. In real terms, it grew between 2008 and
2009 by 3.6 per cent; after that, it started to decline and
between 2009 and June 2013 average unemployment
benefit lost 7.8 per cent of its purchasing power.
The Spanish government has taken various measures to
manage unemployment insurance and benefits during
the crisis. The first bold initiative was launched in 2011: a
new plan to support those who have ceased to receive any
kind of unemployment benefit (the PREPARA plan), aimed
at getting the unemployed to obtain new qualifications
and to help them get a job. The PREPARA plan allocated
between 400 and 450 euros monthly, for a maximum of
6 months, with no possibility of renewal. Beneficiaries
must comply with strict eligibility criteria, including the
net revenues of the household, participation in active
job seeking programmes and other requirements. The
PREPARA plan will be active until unemployment is below
20 per cent.
At the same time, in 2012 the government lowered the
amount of monthly benefit from the sixth month of
unemployment by 16.7 per cent and started to imple-
ment tighter control over fraud.
4.5 Other Social Expenditure: Housing, Families, Children and Social Exclusion
In addition to these major elements of the social model
(health care, education, pensions and unemployment),
Spain has allocated around 1.5 per cent of GDP to other
social programmes: children and families, combating
social exclusion and social housing. As the programmes
are much decentralized among the different levels of
government (regional, local and central) the available
data do not allow us to carry out a detailed description.
Data collected by Eurostat show that, while such social
expenditure grew between 2008 and 2009 by 8 per cent
it declined again in 2010 (no available data since then).
4.6 Conclusions
The welfare state in Spain has gone through two phases
since the beginning of the crisis. Between 2008 and
2010, general social expenditure grew in response to the
worsening of economic and social conditions. After the
beginning of the fiscal consolidation process in 2010,
a number of changes have been made. The first is the
change in the relative composition of social expenditure,
with less weight for health care and education, and more
for pensions and unemployment.
At constant prices, public spending on health care, edu-
cation and unemployment declined in the second part of
the crisis (since 2010), while pensions remained the only
20
A. DEL POZO SEN AND J.M. MARTÍN CARRETERO | SOCIAL COHESION AND THE STATE IN TIMES OF AUSTERITY
public social programme to experience real growth. At
the same time, the growth in pensions was due to the
increase in the number of beneficiaries, while most indi-
vidual beneficiaries suffered losses of purchasing power.
Second, as there is not a broad debate on the Spanish
social model, fiscal consolidation and long-term sus-
tainability have been the drivers of reform, rather than
system modernization or improvements in its capacity to
face the social reality of the crisis. Public finance savings
due to the budget cuts have not been re-allocated to
improve the capacity of the system to protect the most
vulnerable people, nor to provide for new social invest-
ment in health and education.
Recommendations by the OECD and the European Com-
mission suggested that Spain should pay more attention
to social exclusion, and especially to child poverty, imple-
menting specific programmes. The Spanish social model,
which is based on an income guarantee system aimed
at supporting the middle class, is failing to protect those
below the poverty line, while support for the middle
classes is being reduced.
In accordance with the stability programme, social
expenditure will be reduced even further in the coming
years, by 14 per cent in the case of health care and
education, and by 1 per cent in the case of pensions,
unemployment and other social protection programmes.
According to the available data, between 2011 and 2013
only a part of this adjustment has already been made.
Major reforms should be taken if Spain wants to comply
with the fiscal stability targets, in a worsening context of
persistent unemployment and increasing poverty.
5. Effects of Austerity on Social Cohesion
Since the start of the economic crisis, social cohesion has
been substantially damaged by economic developments
and fiscal consolidation. There are at least two channels of
transmission between austerity and social cohesion. The
first is the economic channel. Fiscal austerity is affecting
the capacity of government to make public investments
and to maintain public consumption. This lack of public
economic activity is affecting domestic demand and,
therefore, worsening overall economic output.
With a shortage of domestic demand, unemployment
rises and average real wages decline, leaving families
with less disposable income, with a more unequal income
distribution and increasing the risk of poverty and social
exclusion.
The second channel of transmission is the lack of a proper
answer on the social policy side. As social expenditure
declines, families receive less social benefits, further
reducing their disposable income. At the same time,
reduced social programmes are unable to face the chal-
lenge of an increasing risk of social exclusion, resulting
in more precarity.
As a result of both processes – diminished economic
opportunities due to the lack of economic dynamism
and reduction of the capacity of the social safety net to
respond to the crisis – social cohesion has been strongly
affected.
5.1 Economic Effects of Austerity on Spanish Households
According to the National Institute of Statistics, average
household net disposable income, which is income from
wages and transfers net of taxes, has declined since the
start of the crisis, both in nominal and real terms. In
nominal terms, it fell 5 per cent between 2007 and 2011;
however, taking into account inflation, it dropped by
13.53 per cent.
This figure clearly shows the effect of internal deval-
uation: real decline of wages and social transfers has
clearly affected the net revenues of Spanish families,
increasing their difficulties in meeting daily life needs.
The percentage of households finding it difficult to make
ends meet has increased by 5 percentage points since
the start of the crisis, and according to a set of seven
basic consumption criteria, between 2007 and 2012 the
proportion of families deprived of three or more of these
criteria increased from 11.4 per cent to 15.5 per cent.
Due to rising unemployment, the number of households
in which no one has a job has risen dramatically and
therefore households that do not receive any kind of
income have also increased during the crisis. According
21
A. DEL POZO SEN AND J.M. MARTÍN CARRETERO | SOCIAL COHESION AND THE STATE IN TIMES OF AUSTERITY
to the social NGO Caritas,13 in 2011 3.2 per cent of total
households did not have any income. In 2007, this was
2.1 per cent.
5.2 Economic Inequality
This decline in the average annual income per household
is further aggravated by rising inequality. Spain has seen
one of the highest increases in inequality in the European
Union. While the average EU Gini coefficient was 30.6 in
2007 and 30.7 in 2011, in Spain the Gini coefficient rose
from 31.3 to 34.0 in the same period.
The capacity of social policies to reverse this growing
inequality during the crisis has increased. Taking the
13. Caritas. Report on Social Exclusion and Social development in Spain 2012, Exclusión y Desarrollo Social. Análisis y perspectivas 2012.
median income before pensions and social transfers
and after social transfers, the capacity of social transfers
to increase the median income has been substantial.
While in real terms median income dropped by 14 per
cent between 2007 and 2011, pensions and other social
transfers allowed real disposable income to recover
nearly 10 percentage points.
This redistributive capacity of social transfers has been
essential to guarantee – or at least to mitigate – the
effects of the crisis in inequality, but it has been highly
concentrated in the pension system and other transfers
have not been substantial enough to maintain the same
level of income for the poorest 50 per cent of the pop-
ulation. This group has lost weight in the distribution of
total disposable income since the beginning of the crisis:
while before the crisis they had around 28.5 per cent of
total disposable income, since the start of the crisis they
Figure 9: Average annual household income
Source: National Institute of Statistics. Survey of household budgets.
Figure 10: Development of inequality
Source: Eurostat Survey on Income and Living Conditions.
22
A. DEL POZO SEN AND J.M. MARTÍN CARRETERO | SOCIAL COHESION AND THE STATE IN TIMES OF AUSTERITY
have lost 2 percentage points, which were gained by the
richest half, whose share rose from 71.5 per cent in 2008
to 73.5 per cent in 2011.
As the Spanish Economic and Social Committee stated
in its report on income distribution, apart from transfers,
the most redistributive policies over the long term were
education and health care, which have suffered strong
adjustment in recent years.14
Social inequality in Spain has traditionally been increased
during periods of economic crisis, but inequality has not
been reduced during periods of economic expansion,
even during the long expansionary period between 1995
and 2007.15
5.3 Increase in Poverty and Exclusion
Lower total disposable income and a higher level of
inequality have led directly to a dramatic increase in
poverty and social exclusion. According to the EU’s defini-
tion, in Spain the proportion of people at risk of exclusion
in 2012 was 28.2 per cent, 3.7 percentage points higher
than before the crisis.
Behind this general figure, there are specific develop-
ments for different social groups. By age, the group most
affected by poverty is children (below 16 years of age),
who accounted for 29.7 per cent of the population at
risk of poverty. Girls below 16 years of age are the most
affected group, with 30.5 per cent at risk of poverty. Par-
adoxically, the social group with the lowest level of risk
of poverty are those above 65 years of age. Before the
crisis, they were the group with the highest poverty rate,
but the economic crisis and the subsequent support for
pensions have changed the pattern of Spanish poverty.
While economic activity and other social benefits have
declined, pensions have been relatively well protected.
Old people are the only social group whose average
income has grown in nominal terms.16 As a result, old
people are increasing their support for the younger gen-
eration. In 2010, 20 per cent of old people declared they
14. Economic and Social Committee, Distribución de la Renta en España: Desigualdad, cambios estructurales y ciclos, Report 03/2013.
15. Economic and Social Committee, Distribución de la Renta en España: Desigualdad, cambios estructurales y ciclos, Report 03/2013.
16. Eurostat 2012.
were helping their families economically. This percentage
increased in 2012 to 30 per cent and in 2013 to 40.3 per
cent.17
On the other hand, the situation of child poverty is
becoming dramatic. According to Eurostat,18 households
with dependent children have a poverty risk rate (24.8 per
cent) higher than those with no children (18.5 per cent)
and 44.8 per cent of households with a single parent and
dependent children are in situation of social exclusion
or poverty. There are more poor households and they
are poorer than in the past: in 2011, 12.7 per cent of
total households with dependent children received less
than 4,772 euros a year, which represents 40 per cent of
median disposable income; the figure was 8.7 per cent
in 2008.
According to UNICEF, between 2007 and 2010 house-
holds with children in which all the adults are unem-
ployed grew by 120 per cent. The educational level of
the parents is very important in determining the poverty
rate of children. The poverty rate among children with
parents with only primary or lower secondary education
rose from 43.9 per cent in 2007 to 53.4 per cent in 2011.
Worsening economic conditions and budget cuts in
social expenditure have led to this situation. Child pov-
erty means less food and of poorer quality, changes in
housing, poorer clothing, not enough space at home to
study or play, not being able to pay for daily school meals
and less or no extra educational spending.19 Furthermore,
low social expenditure on children can make it difficult
for mothers to participate in the labour market.20
Household conditions are also very important in under-
standing early school drop-out and future poverty rates.
According to some studies, 29 per cent of young people
from families in which the parents have only a primary
education are so-called NEETs (not in employment, edu-
17. As a percentage of those interviewed who declared they were giving economic support to their families in different surveys: IMSERSO, Old People Barometer 2010; Red Cross Report on Social Vulnerability 2012; Democratic Union of Pensioners and Retired People Barometer on the Solidarity of Old People, 2013.
18. Eurostat Statistics on Income and Living Conditions (EU-SILC) 2012.
19. UNICEF 2012. Report, La Infancia en España 2012–2013.
20. Navarro and Clua-Losada, El impacto de la crisis en las familias y la infancia, Ariel 2012.
23
A. DEL POZO SEN AND J.M. MARTÍN CARRETERO | SOCIAL COHESION AND THE STATE IN TIMES OF AUSTERITY
cation or training).21 Poverty rates of people between
25 and 29 years old are also strongly determined by
the educational level of the parents. The poverty rate
among young people with parents with only a primary
education was 20.3 per cent in 2011, while the poverty
rate of those with parents with a university education
was 10.7 per cent.
As a result, the future development of the younger
generation in Spain is in jeopardy. Among young people
between 16 and 29 years of age, the NEET rate has
increased from 12.2 per cent in 2007 to 18.8 per cent.
5.4 Conclusion: A More Fragmented Society
After this brief review of the social impact, we can draw
the following conclusions:
Since the start of the crisis, average and median real
disposable incomes have declined in real terms, and the
percentage of households with economic problems has
increased.
The decline in average disposable income has not
affected everyone in the same way; the effect is con-
centrated in the poorest part of society, whose share
of total income has fallen. Inequality has increased
dramatically and social transfers have not been able to
properly mitigate this effect. Redistributive effects have
been concentrated in pensions.
As a result, the total poverty rate has risen, con-
centrating its effects on single parent households, the
unemployed and, especially, children. Paradoxically, and
due to the relative resistance of the pension system and
its redistributive effects, people above 65 years of age
have relatively reduced their rate of poverty during the
crisis. Pensions, representing a guaranteed income, have
played a key role in that.
Child poverty is an extremely urgent issue. As their
parents’ lack of economic opportunities lead to a lack
of vital opportunities for children – less health care, less
access to good quality education – this can consolidate
over the long term and obstruct future social mobility.
21. Martinez Garcia, Estructura Social y desigualdad en España, Catarata 2013.
Young people are also being hit by the crisis, espe-
cially those from less educated families. NEETs and youth
poverty are concentrated in households with lower
educational levels; as in the case of children, a lack of
economic opportunities at this stage of their life will
negatively affect their future performance as workers or
even citizens.
6. Conclusion
The recent evolution of the Spanish economy has been
strongly affected by the austerity policies recommended
by the European Commission within the framework of
the Stability and Growth Pact and its recent develop-
ments. While Spain has not been formally bailed out, it
signed a Memorandum of Understanding in order to get
funds to support its financial system in 2012. It is also
under the surveillance of the Excessive Deficit Procedure
and the other multilateral monitoring system established
by EU economic governance.
The internal logic of this process has been summarized
as »internal devaluation«, a process in which the country
suffers wage devaluation in real terms, as macroeco-
nomic stability is pursued by cutting public expenditure
rather than by increasing public revenues. The aim is
to gain competitiveness and increase exports, thereby
raising production and employment.
As we have tried to show, internal devaluation is not
only not achieving its macroeconomic targets, but it is
also having a deep adverse impact on social conditions.
Domestic demand has fallen and rising exports have not
been enough to compensate. Labour market reforms
have not managed to create new employment, but
rather to reduce wage levels, changing the composition
of income distribution between wages and profits, while
unemployment continues to rise.
On the other hand, the social security role that the wel-
fare state is supposed to play is being jeopardized by the
fiscal austerity measures. While in the first part of the
crisis, social expenditure rose to meet increasing social
needs, since 2010 it has been cut and further reductions
are expected in order to comply with the Stability Pro-
gramme and the fiscal deficit targets.
24
A. DEL POZO SEN AND J.M. MARTÍN CARRETERO | SOCIAL COHESION AND THE STATE IN TIMES OF AUSTERITY
More specifically, public expenditure in health care, edu-
cation, unemployment and social protection has declined
since 2010, and the only budget line enjoying nominal
growth is pensions. But even this nominal growth in pen-
sions hides a much less positive evolution in real terms.
ment and declining wages, together with the shrinkage
of most social expenditure have led Spain into a very dif-
ficult social situation. Disposable income has decreased,
poverty and income inequality have risen dramatically
and the number of households in economic difficulties
has increased. This is affecting the most vulnerable in
particular. Child poverty has increased sharply.
While the effects of austerity on social cohesion have
been devastating, it is also jeopardizing the capacity of
the Spanish economy to achieve a higher level of growth
in the future. Spain is losing the opportunity to modern-
ize its social model and investment in human capital is
not being increased. The risk of malnutrition and poverty
among many children and the lack of investment in
health care and education are posing a substantial threat
to future economic and social performance.
As the Spanish economy needs urgent modernization,
reforms must be accompanied by bold social policies that
ensure social cohesion. If social cohesion continues to be
damaged by austerity policies and fiscal consolidation,
the social and political outcome of this process might
undermine the basis of the Spanish democratic and social
state.
If no policy change is implemented, Spain will spend
many years recovering from the crisis.
25
A. DEL POZO SEN AND J.M. MARTÍN CARRETERO | SOCIAL COHESION AND THE STATE IN TIMES OF AUSTERITY
Bibliography
Blanchard, Olivier J., and Leigh, Daniel (2013). Growth forecast errors and fiscal multipliers. National Bureau of Economic Research (NBER) Working Paper Series 18779.
Busch, Klaus, Hermann, Christoph, Hinrichs, Karl and Schulten, Thorsten (2013). Euro Crisis, Austerity Policy and the European Social Model. Friedrich-Ebert-Stiftung. Berlin.
Calero, Josefa and Maroto, Reyes (2013). Los efectos del ajuste fiscal en las economías periféricas de la zona euro (II) Actualización. Documentos de debate 03/2013. Fundación Ideas para el Progreso.
Cáritas (2012). Exclusión y Desarrollo Social. Análisis y perspectivas 2012, Caritas. Madrid.
CEOE, CEPYME, CCOO, UGT (2012). II Acuerdo para el Empleo y la Negociación Colectiva 2012, 2013 y 2014.
Confederación Sindical de Comisiones Obreras (CCOO) (ed.) (December 2012). Las políticas de recortes: evaluación de daños. Gaceta Sindical, nº 19.
Consejo Económico y Social (CES) (2013). Distribución de la Renta en España: Desigualdad, cambios estructurales y ciclos. Colección Informes 03/2013. CES.
Degryse, Christophe, Jepsen, Maria and Pochet, Philippe (2013). The Euro crisis and its impact on national and European social policies. Working Papers 05.2013. European Trade Union Institute (ETUI).
Economistas Aterrados (2012). Europa al borde del abismo. Ed. Pasos Perdidos/Ed. Barataria.
Economistas Frente a la Crisis (2012). No es economía es ideología. Ed. Deusto. Grupo Planeta.
European Commission – Directorate-General for Economic and Financial Affairs (n.d.). The Financial Sector Adjustment Programme for Spain. European Economy – Occasional Papers.
European Commission (2012). Ageing Report 2012.
European Commission Recommendations for Spain 2013. COM(2013) 359 final.
European Trade Union Institute (2012). Benchmarking Working Europe 2012.
Fundación Alternativas – Embid, Julio (ed.) (2013). Primer informe sobre la desigualdad en España. Fundación Alternativas.
Fundación Foessa (2013). Desigualdad y Derechos Sociales. Análisis y perspectivas 2013. Fundación Foessa/Cáritas.
Giddens, A., Diamond, P. and Liddle, R. (2006) Global Europe, Social Europe, Polity Press, London.
Guerra, Alfonso, and Tezanos, José Félix (eds) (2012). Los retos de Europa: democracia y bienestar social, X Encuentro Salamanca. Ed. Sistema.
International Monetary Fund Country Report 13/245 Spain. Chapter IV Consultations.
López Garrido, Diego (ed.) (2012). El estado de la Unión Europea. El fracaso de la austeridad. Friedrich Ebert Stiftung/Fundación Alternativas. Exlibris ediciones.
Martínez García, J.S. (2012). Estructura Social y desigualdad en España. Editorial Catarata. Madrid.
Ministerio de Economía y Competitividad (2013). Actualización del Programa de Estabilidad 2013–2016.
Ministerio de Educación y Cultura (2013). La educación en cifras curso 2012–2013. Madrid.
Ministerio de Hacienda y Administraciones Públicas – Secretaría de Estado de Presupuestos y Gastos (2012). Presentación del Proyecto de Presupuestos Generales del Estado 2013.
Moreno, L. (2009) Reformas de las Políticas de Bienestar en España. Siglo XXI Editores. Madrid
Mulas-Granados, C. (2009). El Estado Dinamizador. Editorial Complutense-FIIAPP. Madrid.
Navarro, V. y Clua-Losada (2012). El impacto de la crisis en la familia y la infancia. Ariel ediciones. Barcelona.
OECD (2012). OECD Pensions Outlook 2012. OECD. Paris.
Pérez Infante, José Ignacio (September 2012). La última reforma laboral después de la aprobación de la Ley 3/2012, de 6 de julio. Asociación Española de Economía del Trabajo. Tribuna Abierta.
Pisani-Ferry, Jean, Sapir, André, and Wolff, Guntram (2013). EU-IMF assistance to euro-area countries: an early assessment. Bruegel Foundation.
UGT-Comisión Ejecutiva Confederal (2013). Un año de reforma laboral: evolución de la contratación, el empleo y los despidos. Secretaría de Acción Sindical-Coordinación Área Externa.
UNICEF (2012). La infancia en España. Report 2012. UNICEF. Madrid.
26
A. DEL POZO SEN AND J.M. MARTÍN CARRETERO | SOCIAL COHESION AND THE STATE IN TIMES OF AUSTERITY
Appendix
Figure 11: Public deficit as a percentage of GDP
Source: Eurostat.
Figure 12: National debt as a percentage of GDP
Source: Eurostat.
Figure 13: Public debt interest paid annually
Source: Annual state budget. Ministry of Finance and Public Administration.
27
A. DEL POZO SEN AND J.M. MARTÍN CARRETERO | SOCIAL COHESION AND THE STATE IN TIMES OF AUSTERITY
Figure 14: Risk premium: spread with German bonds (basis points)
Source: Bank of Spain.
Figure 15: Employment destruction ('000)
Note: Fourth quarter to fourth quarter, except 2013 (first quarter over quarter of 2012).
Source: National Labour Force Survey (EPA). INE.
Figure 16: Employment in public and private sector (annual growth rates)
Source: National Labour Force Survey (EPA). INE.
28
A. DEL POZO SEN AND J.M. MARTÍN CARRETERO | SOCIAL COHESION AND THE STATE IN TIMES OF AUSTERITY
Figure 17: Employees by type of contract (annual change in thousands)
Note: Fourth quarter to fourth quarter, except 2013 (first quarter over quarter of 2012).
Source: National Labour Force Survey (EPA). INE.
Figure 18: Households with all active members unemployed
Note: First quarters of each year.
Source: National Labour Force Survey (EPA). INE.
Table 3: Nominal and real wage development (annual growth rates)
Source: Compiled from Ministry of Employment and Social Security and Quarterly Labour Cost Survey (INE).
29
A. DEL POZO SEN AND J.M. MARTÍN CARRETERO | SOCIAL COHESION AND THE STATE IN TIMES OF AUSTERITY
Figure 19: Real compensation of employees, 2010–2012 (cumulative percentage growth rates)
Source: Compiled from Eurostat.
Figure 20: Wages (2012) as a percentage of GDP
Source: Eurostat.
Figure 21: Social expenditure as a percentage of GDP, 2001–2010
Source: Eurostat.
30
A. DEL POZO SEN AND J.M. MARTÍN CARRETERO | SOCIAL COHESION AND THE STATE IN TIMES OF AUSTERITY
Figure 22: Public expenditure on health care, initial annual budget
Source: Ministry of Health, Equity and Social Policy.
Figure 23: Regional government expenditure on health care per capita, 2007–2013 (real terms 2007 = 100)
Source: Author’s elaboration using data from Ministry of Health, Equity and Social Policy.
Figure 24: Divergence and convergence in regional health care spending per capita
Source: Author’s elaboration using data from Ministry of Health, Equity and Social Policy.
31
A. DEL POZO SEN AND J.M. MARTÍN CARRETERO | SOCIAL COHESION AND THE STATE IN TIMES OF AUSTERITY
Figure 25: Public expenditure on education
Source: Eurostat.
Figure 26: Public expenditure per student, 2010
Source:OECD.
Figure 27: Index of public expenditure per student (real terms 2005 = 100)
Source: OECD.
32
A. DEL POZO SEN AND J.M. MARTÍN CARRETERO | SOCIAL COHESION AND THE STATE IN TIMES OF AUSTERITY
Figure 28: Evolution of scholarships granted by Ministry of Education (real terms 2007–2012, 2007=100)
Source: Ministry of Education.
Figure 29: Other educational financial support (real terms 2007–2012; 2007=100)
Source: Ministry of Education.
Figure 30: Evolution of pension budget, 2008–2013 (real terms 2008=100)
Source: Ministry of Social Security and Employment.
33
A. DEL POZO SEN AND J.M. MARTÍN CARRETERO | SOCIAL COHESION AND THE STATE IN TIMES OF AUSTERITY
Figure 31: Development of average pension (real terms 2008–2013; 2008=100)
Source: Ministry of Social Security and Employment.
Figure 32: Evolution of higher and lower pension; retirement pension with one dependent (real terms 2008=100)
Source: Ministry of Social Security and Employment.
Source: Ministry of Social Security and Employment.
34
A. DEL POZO SEN AND J.M. MARTÍN CARRETERO | SOCIAL COHESION AND THE STATE IN TIMES OF AUSTERITY
Figure 34: Social security surplus/deficit as a percentage of GDP
Source: Ministry of Social Security and Employment.
Figure 35: Projections of retirement pensions, gross costs as a percentage of GDP, 2010–2050
Source: European Commission.
Figure 36: Transfers for unemployment benefits, 2008–2011 (constant euros 2011)
Source: Public Service of Employment.
35
A. DEL POZO SEN AND J.M. MARTÍN CARRETERO | SOCIAL COHESION AND THE STATE IN TIMES OF AUSTERITY
Figure 37: Average unemployment benefit per day (real terms 2008–2013; index 2008=100)
Source: Public Service of Employment.
Figure 38: Evolution of other social expenditure, 2008–2010 (real terms 2008=100)
Source: Eurostat.
Figure 39: Household deprivation, 2007–2012
Source: National Institute of Statistics. Survey of Household Budgets.
36
A. DEL POZO SEN AND J.M. MARTÍN CARRETERO | SOCIAL COHESION AND THE STATE IN TIMES OF AUSTERITY
Figure 40: Development of median income (real terms; index 2007=100)
Source: Eurostat Survey on Income and Living Conditions.
Figure 41: Share of total disposable income of poorest 50 per cent of the population, 2004–2011
Source: Eurostat Survey on Income and Living Conditions.
Figure 42: Risk of poverty and social exclusion
Source: Eurostat Survey on Income and Living Conditions.
37
A. DEL POZO SEN AND J.M. MARTÍN CARRETERO | SOCIAL COHESION AND THE STATE IN TIMES OF AUSTERITY
Figure 43: Changing patterns of poverty rates by age
Source: Eurostat Survey on Income and Living Conditions.
Figure 44: NEET rate: young people not in employment, education or training, 15–29 years of age
Source: Eurostat Survey on Income and Living Conditions.
The views expressed in this publication are not necessarilythose of the Friedrich-Ebert-Stiftung or of the organization forwhich the author works.
ISBN 978-3-86498-762-5
About the authors
Alberto del Pozo SenBorn in Madrid (Spain) in 1968.Degree in economics from the Complutense University of Madrid.Since 1993 has worked as an economist in the Confederated Technical Office of the General Workers’ Union (UGT) of Spain. In addition to continuous economic analysis, he has participated as a consultant in many of the major social dialogue processes in Spain. He has been also an advisor to the Minister of Labour and Social Security (2007–2011) and professor of economics at the University Carlos III of Madrid (1997–2007). His main fields of analysis are the labour market and fiscal and tax policy.He is a founding member of the association Economistas frente a la Crisis (Economists against the Crisis) and co-author of the book No es economía, es ideología (It isn’t economics, it’s ideol-ogy). He has also written numerous articles for collective books, both in print and the digital press.
José Moisés Martín CarreteroBorn in Madrid (Spain) in 1973Economist. Postgraduate Specialist in International Economic Relations at CEPADE/UPM and the High Programme in Finance at IE Business School. Executive Program in Public Administration at Harvard Kennedy School of Government.He has been Executive Director of the NGO ACSUR-Las Segovias and Head of Department for Multilateral Cooperation at the Spanish Ministry of Foreign Affairs. Member of different advisory and technical committees at the World Bank, the IADB, the United Nations and the European Commission, He has served as external consultant to the Council of Europe (2002–2003), and the European Union Eurosocial Programme (2007–2008). He has been Senior Economic Adviser to the Embassy of South Korea in Spain. Currently he is CEO of Red2Red Consultores, a consulting firm on economic and social policies in the EU.Member of the World Economy Society and the Spanish A sso-ciation of International Economics and Finance. Board member of the association »Economistas Frente a la Crisis« (Economists against the Crisis).Main field of practice and research is global economic and public policies.
Imprint
Friedrich-Ebert-Stiftung | Western Europe / North America Hiroshimastraße 28 | 10785 Berlin | Germany
Responsible: Anne Seyfferth, Head, Western Europe / North America