Social Impact Assessment and Building Your SRO Rick Larso Adjunct Associate Professo Columbia Business Schoo Director, Sustainable Venture The Conservation Fun [email protected]Grateful acknowledgement: Cathy Clar GSVC Prep Day Columbia Business School
Transcript
Social Impact Assessment and Building Your SROI
Rick LarsonAdjunct Associate Professor
Columbia Business SchoolDirector, Sustainable Ventures
Taken from: Double Bottom Line Methods Catalog, available at: www.riseproject.org
B Corporations
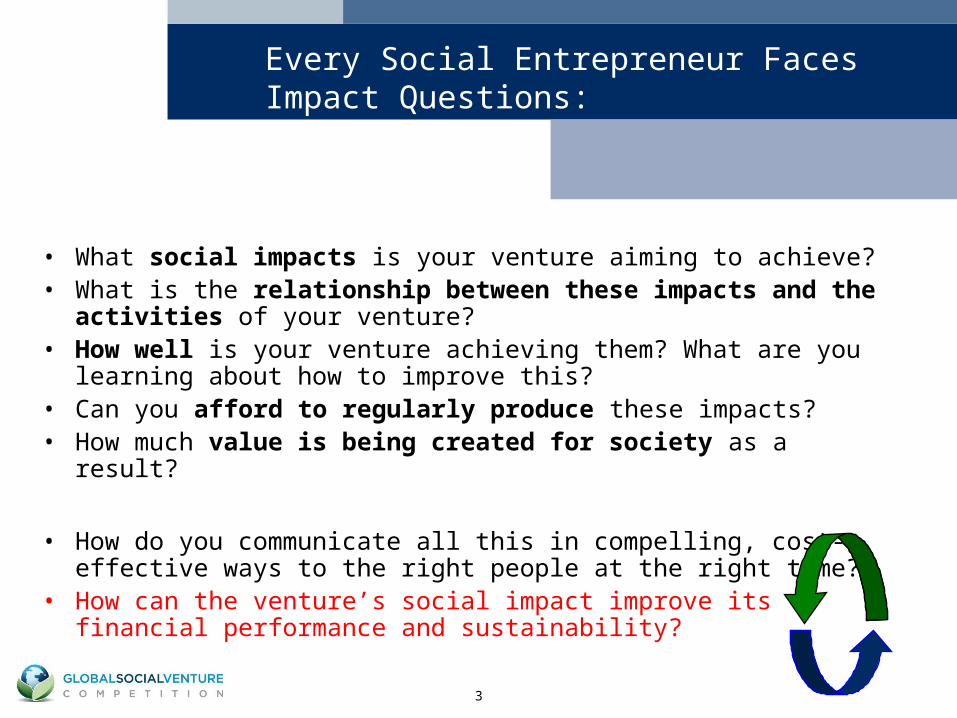
What Methods Do People Use for Social Impact Assessment?
5
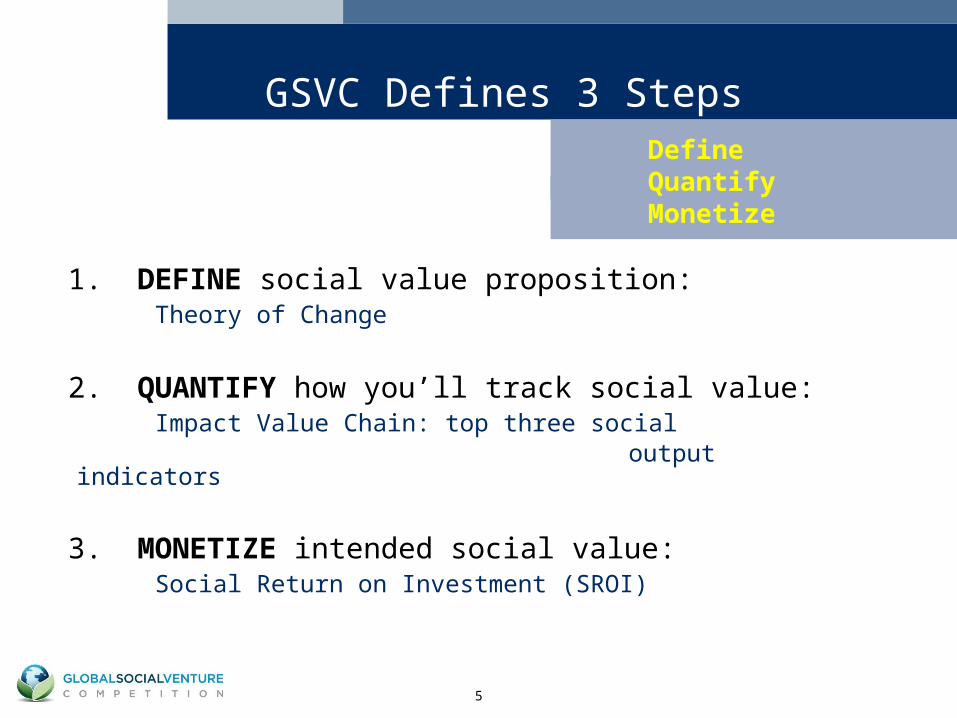
GSVC Defines 3 Steps
1. DEFINE social value proposition: Theory of Change
2. QUANTIFY how you’ll track social value: Impact Value Chain: top three social output indicators
3. MONETIZE intended social value: Social Return on Investment (SROI)
Define Quantify Monetize
6
Examples: Focused Theory of Change
• Tarsian and Blinkley: If Afghani refugee women are sewing clothing for the high margin fashion markets in the US, their quality of life and that of their families will improve.
• Developing Power: If power is provided at low costs to rural areas in developing countries, both family income and community quality of life will improve.
• Bronx Charter School: If a charter school integrates arts education into the curriculum for lower income Bronx children, educational achievement in arts and other areas will improve.
Define Quantify MonetizeIF…THEN…
2003 GSVC winners:
7
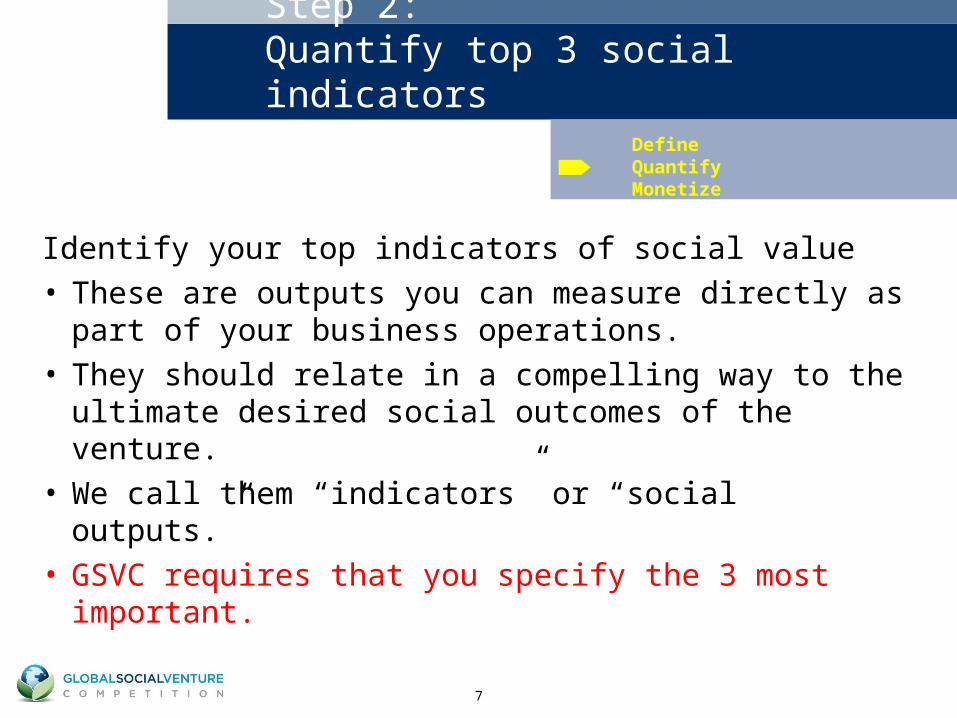
Step 2:Quantify top 3 social indicators
Identify your top indicators of social value• These are outputs you can measure directly as
part of your business operations.• They should relate in a compelling way to the
ultimate desired social outcomes of the venture. • We call them “indicators” or “social outputs.”• GSVC requires that you specify the 3 most
important.
Define Quantify Monetize
8
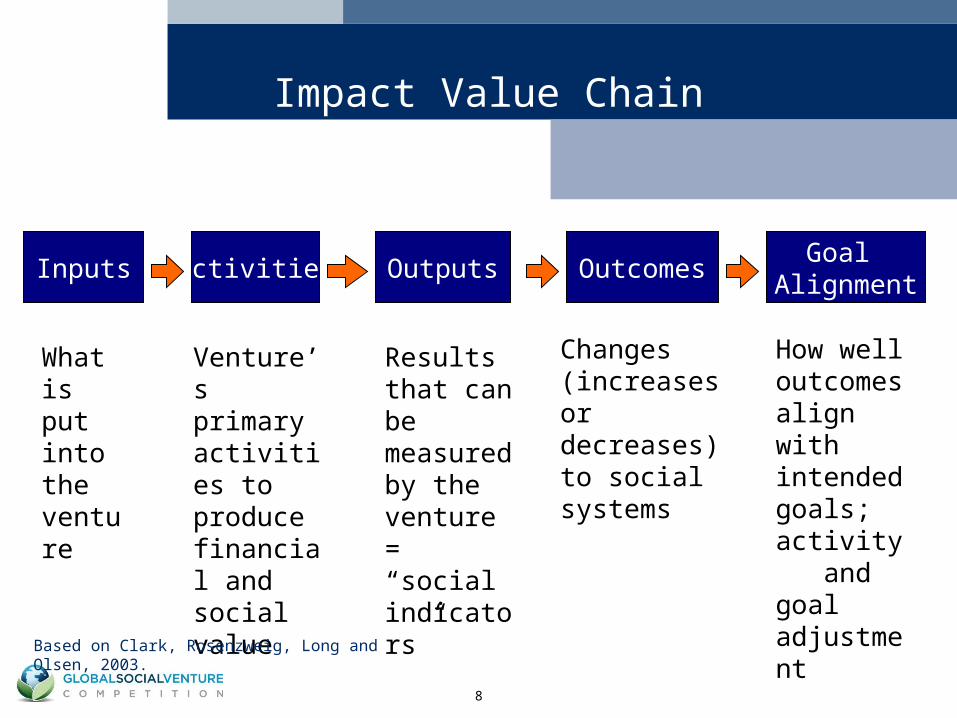
Impact Value Chain
Inputs Activities Outputs Outcomes
What is put into the venture
Venture’s primary activities to produce financial and social value
Results that can be measured by the venture = “social indicators”
Changes (increases or decreases) to social systems
Goal Alignment
How well outcomes align with intended goals; activity and goal adjustment
Based on Clark, Rosenzweig, Long and Olsen, 2003.
9
Impact = differential change
Inputs Activities Outputs Outcomes
What is put into the venture
Venture’s primary activities
Results that can be measured
Changes to social systems
Goal Alignment
Activity and goal adjustment
What would have
happened anywayEssential!!!
= IMPACT
-
Based on Clark, Rosenzweig, Long and Olsen, 2003.
10
Stonyfield Farm Example
Economic Development
Environment
Health
• Amount paid to small dairy farmers per gallon of milk
•Savings in environmental emissions from manufacturing
•Ratio of organic, pesticide-free yogurt produced to non-organic
• Increasing or stabilizing small dairy farm industry in Northeast US
•Decreasing CO2 emissions in Vermont
•Increasing percentage of total yogurt sold in US that is organic.•Lower pesticide traces in childrens’ bodies.
Outputs Outcomes
Define Quantify Monetize
Benefits
11
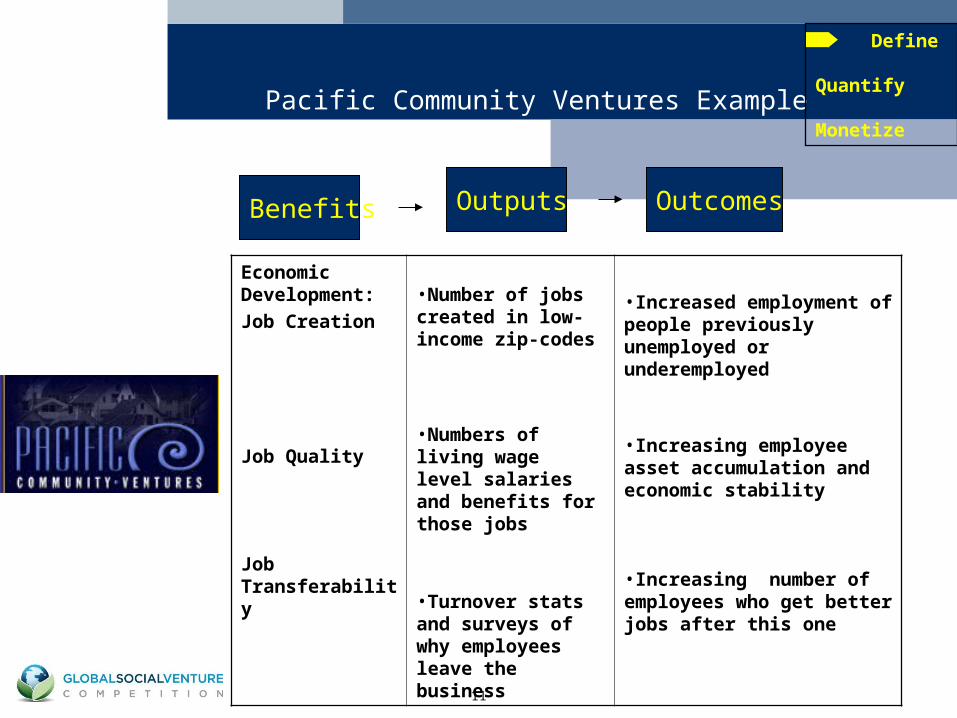
Pacific Community Ventures Example
Economic Development:
Job Creation
Job Quality
Job Transferability
•Number of jobs created in low-income zip-codes
•Numbers of living wage level salaries and benefits for those jobs
•Turnover stats and surveys of why employees leave the business
•Increased employment of people previously unemployed or underemployed
•Increasing employee asset accumulation and economic stability
•Increasing number of employees who get better jobs after this one
Outputs Outcomes
Define Quantify Monetize
Benefits
12
Steps in calculation of SROI
1. Quantify outputs/outcomes where possible2. Translate into economic equivalent where
possible using proxies 3. Develop social cash flow projection 4. Subtract outputs/outcomes that would have
happened anyway (refer to proxy data)5. Where outcome is qualitative, discuss what it is
and how you will know it’s happening6. Cite your sources and assumptions clearly
Define Quantify Monetize
13
Example: Developing Power
Define
Theory of Change (focused): • Developing Power’s value proposition is to break the
cycles of poverty in Brazil through electricity and capacity building. The primary benefits from access to electricity include improved education, human health, communication and entertainment, comfort, protection, convenience, and productivity.
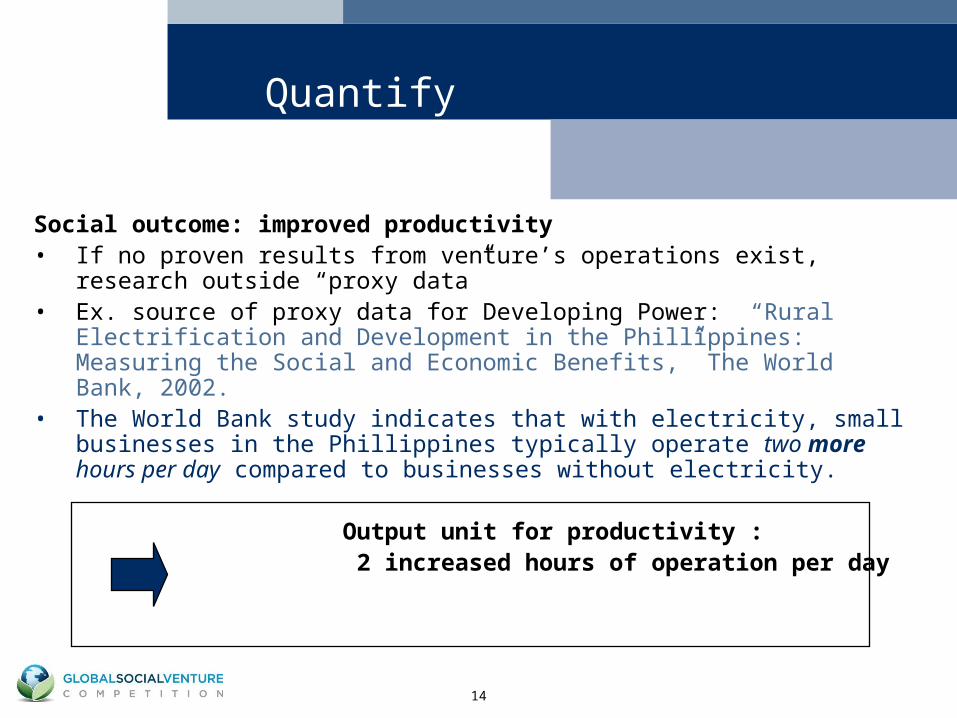
Social Outcome: improved productivity
14
Social outcome: improved productivity• If no proven results from venture’s operations exist, research outside
“proxy data” • Ex. source of proxy data for Developing Power: “Rural Electrification
and Development in the Phillippines: Measuring the Social and Economic Benefits,” The World Bank, 2002.
• The World Bank study indicates that with electricity, small businesses in the Phillippines typically operate two more hours per day compared to businesses without electricity.
Output unit for productivity : 2 increased hours of operation per day
Quantify
15
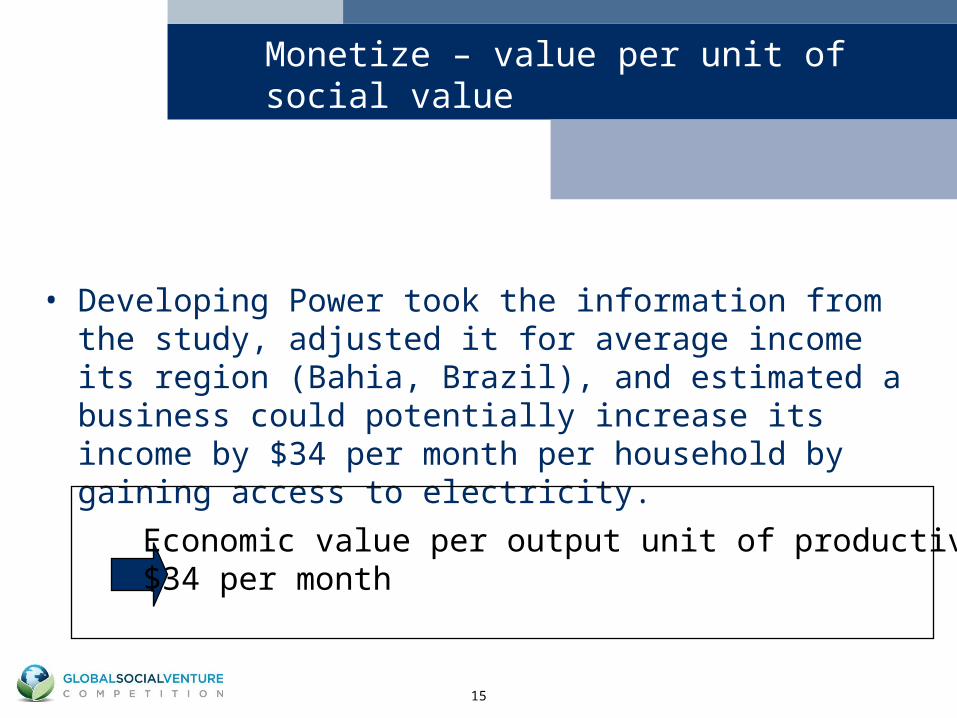
Monetize – value per unit of social value
• Developing Power took the information from the study, adjusted it for average income its region (Bahia, Brazil), and estimated a business could potentially increase its income by $34 per month per household by gaining access to electricity.
Economic value per output unit of productivity: $34 per month
16
Completing an SROI calculation
• Armed with the valuation per unit of social value, develop social cash flow projection. – Use a 10-year time horizon for your projections (recommended
this year for the sake of consistency).
• Subtract outcomes that would have happened anyway (refer again to proxy data).
• Discount to social NPV using the appropriate discount rate. (Suggestion: 10%)
• Subtract cost of providing service• Calculate return ratio: SROI or SIRR
17
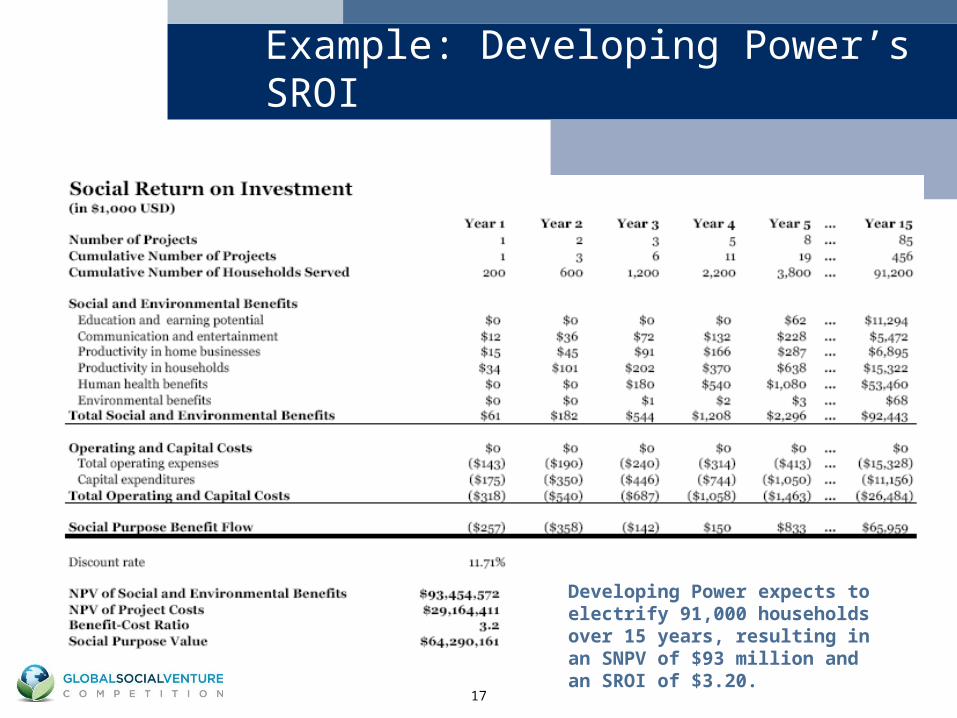
Example: Developing Power’s SROI
Developing Power expects to electrify 91,000 households over 15 years, resulting in an SNPV of $93 million and an SROI of $3.20.
18
Estimate risk and a discount rate
• Social value creation has a measure of risk with a corresponding cost of capital.
• Depending on the social focus of your plan, the cost of public or charitable funds that would otherwise have been used to achieve the same impact may be a useful reference
• Use your own judgment! State assumptions and rationale.
• 10 year time horizon recommended
19
SROI tips
• When an outcome does not show up in the social cash flow projection, discuss what it is and how you will know it’s happening.
• Do not measure benefits based solely on the market valuation of the perceived benefit.
– Ex.: A manufacturer counted revenue generated from the recovery of waste gas as the social value. Instead, it should try to quantify the environmental value gained from reduced emissions.
– Ex.: A coffee producer counted the value of their sustainable farming practices to be the extra $.50 per bag of coffee that consumers were willing to pay. They should have monetized the drivers of social outcomes such as reduced hunger, illness, and increased wages to farmers.
• Include both positive and negative impacts.
• In any quantification, include only impacts that are clearly and directly attributable to the venture and easily quantifiable.
Based on Lingane and Olsen, “Social Return on Investment: Standard Guidelines,” September, 2003.
20
Putting it All Together:Social Impact Assessment tips
The goal is to make a compelling case about actual value creation, NOT to achieve the largest number.
• Show how you will track performance and calculate impact over time.
• Where are your risks and biggest challenges, are they reflected in your social impact figures?
• What are your biggest causal assumptions? How will you test them?
• How does your growth plan impact your SROI?
• Who is your competition (the industry standard) and how do you compare?
21
Case study: Windows of Opportunity
Windows of Opportunity (WoO) • A lead-safe window replacement business that protects
children from lead poisoning while providing an employment training program to youth ages 17 to 24 who are at risk of chronic unemployment.
• For-profit subsidiary of Baltimore nonprofit, CLEARCorps
22
Windows of Opportunity
• What is Windows of Opportunity’s Theory of Change?
• What could key outcomes be?
• What key outputs, social indicators, could WoO measure?
23
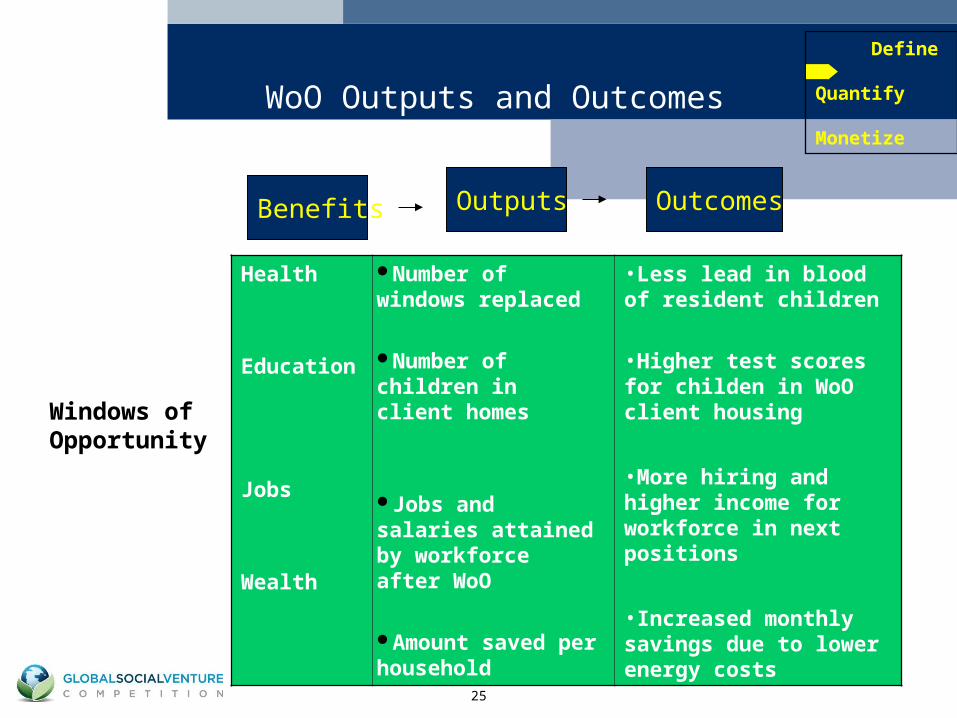
WoO Outputs and Outcomes
OutcomesBenefits Outputs
Windows of Opportunity
24
WoO
Theory of Change:
If lead windows in inner cities are replaced by well-trained high risk youth, communities will be healthier and employed youth will have greater educational and vocational opportunity.
25
WoO Outputs and Outcomes
Health
Education
Jobs
Wealth
•Less lead in blood of resident children
•Higher test scores for childen in WoO client housing
•More hiring and higher income for workforce in next positions
•Increased monthly savings due to lower energy costs
Outcomes
Define Quantify Monetize
Benefits Outputs
Windows of Opportunity
Number of windows replaced
Number of children in client homes
Jobs and salaries attained by workforce after WoO
Amount saved per household
26
NPV1 year 1 year 2 year 3 year 4 year 5
Number of new crews 2 2 1 1 1
Number of seasoned crews 0 2 4 6 7Total number of children protected 2 73 316 377 535 705Increase in future earnings per child $8,151 $8,151 $8,151 $8,151 $8,151Decrease in special education cost per child $4,000 $4,000 $4,000 $4,000 $4,000Decrease in medical cost per child $1,800 $1,800 $1,800 $1,800 $1,800Total social benefit per child $13,951 $13,951 $13,951 $13,951 $13,951Social value of lead hazard reduction efforts $22,938,685 $1,018,423 $4,408,516 $5,252,552 $7,456,810 $9,828,480
Number of homes with windows replaced 73 316 377 535 705Average annual energy cost savings $188 $188 $188 $188 $188Accrued social value of energy savings3
Number of crewmembers (CM) 12 12 6 6 6Increased future earnings per CM $7,390 $7,390 $7,390 $7,390 $7,390Total social benefit per crewmember $7,390 $7,390 $7,390 $7,390 $7,390Social value of crewmember benefits $118,669 $88,680 $88,680 $44,340 $44,340 $44,340
PV of Social Benefits $23,814,326PV of Social Costs -$262,999
Social Return on Investment $91NPV of Social Return $22,387,987
1 Net present value calculated using a discount rate of 5.5% (municipal bond rate)2 Conservative projection based on CLEARCorps experience of 1.5 children per home3 Accounts for new homes completed and additional benefits from homes completed in previous years4 Social cost is equal to total grants required for WoO to begin and sustain operations.
Which are inputs, outputs, outcomes?
27
NPV1 year 1 year 2 year 3 year 4 year 5
Number of new crews 2 2 1 1 1
Number of seasoned crews 0 2 4 6 7Total number of children protected 2 73 316 377 535 705Increase in future earnings per child $8,151 $8,151 $8,151 $8,151 $8,151Decrease in special education cost per child $4,000 $4,000 $4,000 $4,000 $4,000Decrease in medical cost per child $1,800 $1,800 $1,800 $1,800 $1,800Total social benefit per child $13,951 $13,951 $13,951 $13,951 $13,951Social value of lead hazard reduction efforts $22,938,685 $1,018,423 $4,408,516 $5,252,552 $7,456,810 $9,828,480
Number of homes with windows replaced 73 316 377 535 705Average annual energy cost savings $188 $188 $188 $188 $188Accrued social value of energy savings3
Number of crewmembers (CM) 12 12 6 6 6Increased future earnings per CM $7,390 $7,390 $7,390 $7,390 $7,390Total social benefit per crewmember $7,390 $7,390 $7,390 $7,390 $7,390Social value of crewmember benefits $118,669 $88,680 $88,680 $44,340 $44,340 $44,340
PV of Social Benefits $23,814,326PV of Social Costs -$262,999
Social Return on Investment $91NPV of Social Return $22,387,987
1 Net present value calculated using a discount rate of 5.5% (municipal bond rate)2 Conservative projection based on CLEARCorps experience of 1.5 children per home3 Accounts for new homes completed and additional benefits from homes completed in previous years4 Social cost is equal to total grants required for WoO to begin and sustain operations.
Outputs
Desired Outcomes
Inputs
Note: technically
“impact” was not shown!!
Value from Proxy Data
Outputs
WoO inputs, outputs, outcomes
28
GSVC SIA judging guidelines
1. Compelling theory of change and strong relationship between it and the top three indicators you choose that will drive to ultimate outcomes
2. Monetization of social return on investment using consistent and appropriate logic, clearly identified sources of value and assumptions, and thoughtful approach.
3. A clear and compelling assessment that can be easily absorbed by judges
29
Other advice we give toGSVC entrants
• Make sure Theory of Change is consistent with the social impact you predict through the SROI
• Support your assumptions with actual data and/or outside sources whenever possible
• Include both positive and negative outcomes
• State how venture will monitor return over time
30
Read the winning SROIs from 2009!
• On www.gsvc.org under Resource Library SIA examples.
• Everyone should read Human Service Fellowship. It’s one of the best GSVC SIA I’ve ever seen.