1 Social Indicators and Social reporting in New Zealand, and the Potential Contribution of FWWP Gerard Cotterell and Charles Crothers Gerard Cotterell Research Fellow Social Statistics Research Group Department of Sociology The University of Auckland [email protected]Charles Crothers Professor School of Social Sciences Faculty of Applied Humanities Auckland University of Technology [email protected]Disclaimer This working paper is a work-in-progress. Please do not cite without the authors permission. The views expressed in this working paper are the personal views of the authors and should not be taken to represent the views or policy of FRST, the Ministry of Social Development or the Government. Although all reasonable steps have been taken to ensure the accuracy of the information, no responsibility is accepted for the reliance by any person on any information contained in this working paper, nor for any error in or omission from the working paper. Acknowledgements FWWP 1 was funded by the Foundation for Research Science and Technology (FRST), New Zealand. Responsibility for the final product, however, rests ultimately with the authors. Abstract Along with other western countries New Zealand began a social indicators development programme during the 1970s. This early period of progress was followed by a languishing of interest in their use which lasted until the 1990s. Recently there has been a renewal in interest of the use of social indicators and social reporting and the outcome of the renewal of interest has been the development of a range of indicator and social reporting exercises. This paper briefly outlines the history of social indicators and reporting in New Zealand before detailing the recent developments in these fields and the issues they face. The contribution of FWWP to these wider frameworks is outlined. 1 The Family and Whanau Wellbeing project (FWWP) is a five-year research programme supported from the Social Science funding pool of the Foundation for Research, Science and Technology. The principal goal of this programme is to develop ways to examine and monitor the social and economic determinants of family and whanau wellbeing and how these have changed over the 1981 to 2001 period.
Transcript
1
Social Indicators and Social reporting in New Zealand, and the Potential Contribution of FWWP Gerard Cotterell and Charles Crothers Gerard Cotterell Research Fellow Social Statistics Research Group Department of Sociology The University of Auckland [email protected]
Charles Crothers Professor School of Social Sciences Faculty of Applied Humanities Auckland University of Technology [email protected]
Disclaimer
This working paper is a work-in-progress. Please do not cite without the authors�’ permission. The views expressed in this working paper are the personal views of the authors and should not be taken to represent the views or policy of FRST, the Ministry of Social Development or the Government. Although all reasonable steps have been taken to ensure the accuracy of the information, no responsibility is accepted for the reliance by any person on any information contained in this working paper, nor for any error in or omission from the working paper.
Acknowledgements
FWWP1 was funded by the Foundation for Research Science and Technology (FRST), New Zealand. Responsibility for the final product, however, rests ultimately with the authors.
Abstract
Along with other western countries New Zealand began a social indicators development programme during the 1970s. This early period of progress was followed by a languishing of interest in their use which lasted until the 1990s. Recently there has been a renewal in interest of the use of social indicators and social reporting and the outcome of the renewal of interest has been the development of a range of indicator and social reporting exercises. This paper briefly outlines the history of social indicators and reporting in New Zealand before detailing the recent developments in these fields and the issues they face. The contribution of FWWP to these wider frameworks is outlined.
1 The Family and Whanau Wellbeing project (FWWP) is a five-year research programme supported from the Social Science funding pool of the Foundation for Research, Science and Technology. The principal goal of this programme is to develop ways to examine and monitor the social and economic determinants of family and whanau wellbeing and how these have changed over the 1981 to 2001 period.
2
1 Introduction As in many other western countries, interest in social indicators and social reporting developed in New Zealand during the 1970s. This interest peaked in the early 1980s with the release of the results from the Department of Statistics (DOS) Social Indicators Survey. Following this, the use of social indicators became less prominent in research and policy until a renewal of interest occurred in the late 1990s. The outcome of this renewed interest has been the launch of a raft of social indicator and social reporting initiatives. Of primary interest of the recent projects, are the Big Cities �‘Quality of Life�’ project, the Ministry of Social Development�’s (MSD) Social Report and the Family and Whanau Wellbeing Project. This paper first looks at early developments both overseas and in New Zealand. Following this it briefly discusses reasons for the decline in use and the renewed interest before examining with the range of new initiatives, with a particular focus upon the Big Cities Quality of Life project, the MSD�’s Social Report and the Family and Whanau Wellbeing Project (FWWP) wellbeing indicators. It concludes by discussing the issues facing these current developments in social indicators and social reporting.
2 Origins and development of the social indicators movement overseas
The social indicators literature typically points to the 1960s as the starting point of what is sometimes described as the �‘social indicators movement�’. However, like many developments in the social science arena, the actual starting point is contested and some commentators argue that there is evidence of early use of social indicators in 1920 and 1930s in USA (Noll and Zapf 1994) and in the United Nations in the 1950s (Davey 2000). Whatever the actual starting date, the growth in interest in social indicators was rapid during the 1970s. The Organisation for Economic Cooperation and Development (OECD) had started work on a social indicator program in 1970 (Noll and Zapf 1994). In 1974 the Social Indicators Research journal was first published, and several European countries had begun publishing social reports (Great Britain, 1970; France, 1973; Netherlands and Spain, 1974; Denmark, 1976; and Austria, 1977), with the United States producing three social reports during the 1970s. In addition, by the end of the 1970s the social indicators movement held
�“regularly scheduled presentations at national and international professional meetings�… and there was continuing debate within a broad implicit agreement regarding many of the life quality concerns that should be represented in a social indicators system�” (Andrews 1990).
This widespread and growing interest was attributed to a range of factors. These included a realisation that the economic progress of the 1950s, �’60s and �’70s had come at a social cost which was not well understood or measured and a desire on the part of some to �‘measure�’ the �‘social�’ sector in a manner similar to the use of the System of National Accounts used to measure the size and performance of national economies.
3
3 Social indicators and social reporting in New Zealand – the early years
Paralleling the overseas events, interest in social indicators and social reporting in New Zealand developed through the 1970s (Davey 2000). The Social Development Council was established as part of the Department of Social Welfare in 1971 and �“developed a set of social objectives centred on the goals of increased opportunity, more equality and greater social wellbeing�” (Davey 2000), 52). In order to meet these goals, the Council recommended that measures should be developed in order to assess progress towards these objectives (Davey 2000). In addition, the DOS established a Social Indicators Unit in 1976 and in 1977 published �‘Social Trends in New Zealand�’ which, as noted in its introduction, was intended to be a regular publication. The information was gathered from a wide range of sources and organised into nine areas of interest which were; demographic patterns, housing and households, education, health and medical services, social welfare and social security, crime and law enforcement, leisure, labour force participation and incomes (Department of Statistics 1977). Beginning in 1980, the DOS conducted a Social Indicators Survey. This was a substantial stand-alone survey with a sample of nearly 7,000 and data collected in eight domains or areas of interest including health, education and learning, employment and quality of working life, time and leisure, command over goods and resources, physical environment, social environment and personal safety. The survey was based closely on work being carried out by the OECD and was intended to fill gaps in data (Davey 2000). The second major development in New Zealand in this early phase was the work of the New Zealand Planning Council�’s �‘Social Monitoring Group�’. This group published a feasibility study for social monitoring which included advice on indicator selection before its first report, titled �‘From Birth to Death�’ was published in 1985. This was intended to be �“a broad overview of current and emergent social trends, documenting change over time and differences between groups in society�” (New Zealand Planning Council 1985)5). As the title intimates, the report used a �‘life event approach�’ to structure information and data from a wide range of sources including the five yearly Department of Statistics�’ Census of Population and Dwellings, the above mentioned Social Indicators survey, and the DOS Household Survey, were used. The Social Monitoring Group published a second report in 1989 using a more rigorous statistical basis, with Census data from 1976, 1981 and 1986 analysed by age ranges and forming the structure of the report. Despite the abolishment of the Planning Council in 1992, a third report was published in 1993, a fourth in 1998 and the fifth in the series in 2003 (Davey 1993; Davey 1998; Davey 2003). There were other uses of social indicators in the 1970s and 1980s in New Zealand, primarily �“from geographers who were then interested in urban and also rural indicators of social wellbeing�” (Crothers 2006), along with some attempts to use them in social impact assessment exercises.
4
4 The decline and revival in interest
Towards the end of the 1980s there was a downturn in interest in social indicators and social reporting with �“a levelling off of the social indicator movement. (and that) in some countries, as well as for the OECD, statistical programs were terminated�” (Vogel 1994). The decline in interest is ascribed to a variety of reasons which included methodological and theoretical issues and a change in the political climate in most western countries. Bulmer identified three primary theoretical and methodological difficulties at the heart of deficiencies in the development of social indicators. The first, Bulmer argues is that
�“There are no general theories, in sociology, political science or social psychology, which provide the basis on which a set of social indicators could possibly begin to be constructed�” (Bulmer 1990).
While this lack of a theoretical basis did not preclude indicator development it meant that those indicators which were constructed often had no clear conceptual justification. The second issue lay in the lack of a common system of measurement, for unlike economics which used money as its system of measurement, the social indicators arena lacked such a measure due to the complexity and variety of subject areas being measured. The final area of difficulty lay in the question of values, that is the difficulty in achieving agreement of what constitutes good and bad indicators. Andrews adds a fourth issue, that of the perceived inability of the developers of social indicators to demonstrate the usefulness of their product to policy makers (Andrews 1990). Also significant in the downturn in interest was the changed political and economic environment of the late 1970s and 1980s. The onset of economic downturns in most Western countries heralded the end of the Keynesian era with its focus on an enhanced role for the state. In many countries, the election to power of right wing governments signalled the beginning of a period of economic reform. In the extensive economic restructurings which followed, concern with the measurement of the social impacts of the changes via social indicators was neglected in many countries, though one could well argue that this was when it was most needed. In New Zealand, there was some development of local-level social impact and poverty monitoring studies, but nothing systematic at the national level. However, despite the decline in interest in the indicators area, publication of the journal Social Indicators Research continued along with the production of a quarterly newsletter �“Social Indicator Research News�” (Andrews 1990). In addition, some countries such as the United Kingdom continued to publish information on social trends and in Europe, especially in the Nordic countries, there was ongoing collection of both objective and subjective social indicators.
5
5 The late 1990s – the social indicator revival in New Zealand
There was a renewal in interest in social indicators and social reporting in New Zealand in the early 2000s. During the mid to late 1990s there was increasing awareness that the social costs of the economic reforms were high and that these costs had not been well monitored, along with the publication of a number of studies which noted the increased levels of poverty occurring (SNZ 1999; Podder and Chatterjee 1998). In addition to this, the newly-elected Labour government signalled its preference for evidence based policy which indicated that enhanced monitoring of social outcomes was needed. Crothers further suggests the renewed interest was due to the
�“confluence of influence between government ideology, contemporary public administrative practice and with some support from the social science community�” (Crothers 2006).
The renewed interested triggered a number of social indicator and social reporting projects. First was a paper by Crothers titled Monitoring the Changing Social Conditions of New Zealanders, in which he advanced �“An agenda for developing a systematic, comprehensive and coherent set of annual social indicators using available statistics�” (Crothers 2000). Crothers constructs a set of 65 indicators, based around existing data available on an annual basis, which allows for regular monitoring of any change. Indicators were chosen on the basis of their potential for being disaggregated into population sub groups of policy interest. To enhance the theorisation of the model, Crothers mapped the potential relationships between the domains, noting the potential for �“reciprocating influences, joint effects and, of course, feedback loops�” (Crothers 2000). Furthermore he correlates data in the indicators time series �“against several key variables (using Pearson�’s product-moment correlation); year, political party in power, economic growth and CPI change�” (Crothers 2000). Crothers�’ study makes a significant contribution to the development of the social indicator field in New Zealand for four reasons. First, he examines the conceptual issues involved, thus setting up a strong base for his work. Second, he investigates the potential relationships between the domains of interest which underpin his framework. Third, he attempts to measure the strength of the relationship between each of the indicators and selected key variables. Finally, he uses data that allows (in most cases) changes over a time period of approximately 20 years to be examined. Crothers�’ work is comprehensive and perhaps the main limitation is its lack of indicators in some areas of concern (noted by the author), such as cultural outcomes and political conditions, and the presence of too many indicators in other areas, such as economic conditions. Furthermore, the large number of indicators overall, approximately 65, means that monitoring change would be a time-consuming process. In addition, a range of government departments and local authorities also began work on developing sets of indicators. A list on the Statistics New Zealand (SNZ) website
6
lists twenty-four central government indicator projects (some of which are economic indicators) and eight local government indicator initiatives.2 Among the developments is work by the Ministry of the Environment to develop appropriate indicators to monitor environmental trends and track progress towards stated objectives and policy goals, work by SNZ to develop housing indicators, and Ministry of Health work on a key set of health indicators. In a bid to assist with the production of meaningful, high quality indicators, SNZ has produced a set of guidelines for selecting and working with indicators.3 The remainder of this paper will be devoted to examining the more significant of these developments. These are the MSD�’s Social Report, the Big Cities Quality of life project and the Family and Whanau Welling project.
5a The Social Report
The most significant and prominent of the new developments is the publication by the Ministry of Social Development of its annual �‘Social Report�’ of which there have been five so far with the first being published in 2001. The report was originally commissioned by the Minister of Social Services and Employment, the Right Hon. Steve Maharey and published by the Ministry of Social Development. The inspiration for the report came, according to Crothers (2006) after Maharey had visited Britain in 2000 had been impressed by the systems of indicators being developed there. In the foreword to the first report, Maharey noted it was �“a first step to establishing a regular reporting programme to assess the social state of the nation�” (Ministry of Social Policy 2001). The report has three main purposes. These are:
�“to provide and monitor over time measures of wellbeing and quality of life that complement existing economic indicators and environmental indictors
to compare New Zealand with other countries on measures of wellbeing to provide greater transparency in government and to contribute to better
informed public debate to help identify key issues and areas where we need to take action, which can
in turn help with planning and decision-making�” (Ministry of Social Development 2006).
The report uses the Australian Bureau of Statistics definition of social indicators as �“measures of social wellbeing which provide a contemporary view of social conditions and monitor trends in a range of areas of social concern over time�” (Ministry of Social Policy 2001). Indicators for the report were chosen on the basis that it
�“should always be possible to interpret changes in indicators quite clearly as an improvement or deterioration in the quality of life �… (and) �… should focus on the outcomes of social processes or policies, rather than inputs�” (Ministry of Social Policy 2001).
2 For the full list see http://www.stats.govt.nz/products-and-services/user-guides/indicator-guidelines/govt-indicator-reports.htm 3 See http://www.stats.govt.nz/products-and-services/user-guides/indicator-guidelines/default.htm
7
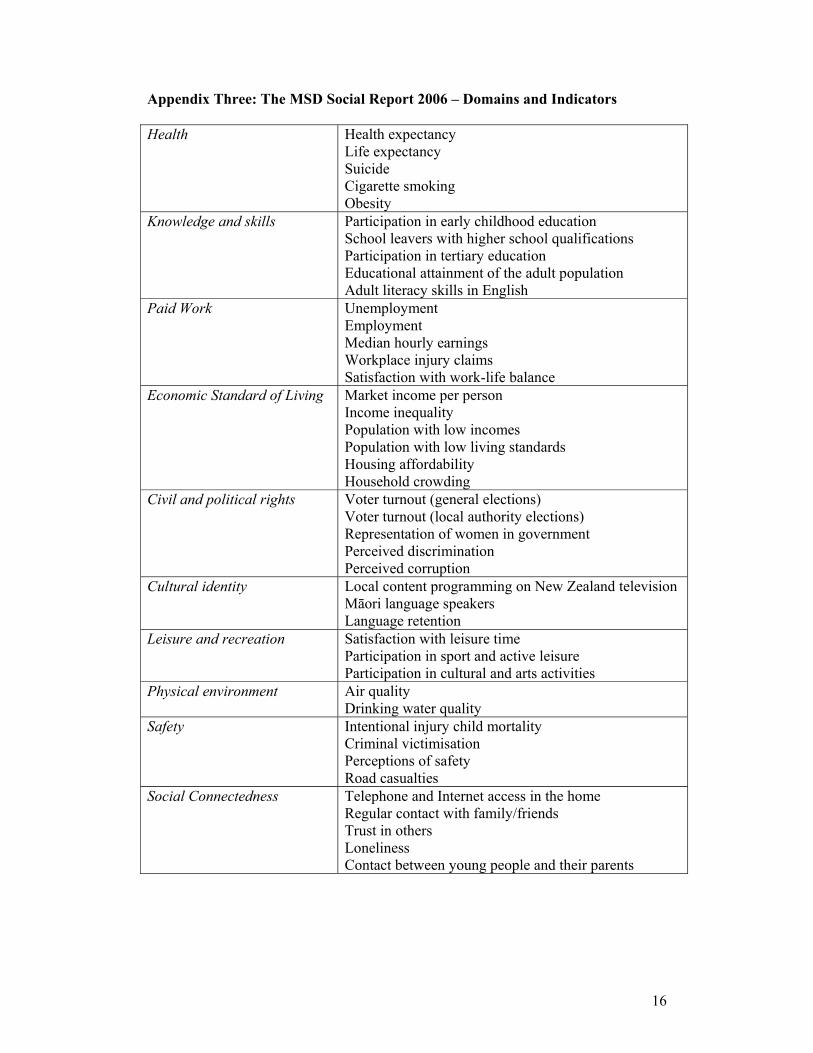
Over the lifespan of the report the indicators and data have been expanded where possible, although a key feature of successive editions of the report has been to restrain the number of indicators to about 40 to encourage focused attention. The 2001 report contained data on 36 indicators organised into nine domains or areas of interest, these being: health, knowledge and skills, safety and security, paid work, human rights, culture and identity, economic standard of living, social connectedness and the environment. By the time of the publication of the 2006 report this had expanded to 42 indicators in ten domains of interest, with the additional domain being leisure and recreation which was added in 2004. Where the data permits, a time series for each indicator from 1986 to the present is shown, broken down by age, ethnicity, gender and region. Updating of indicators occurs where more suitable measures are found. The strengths of The Social Report include its specification of a framework for the compilation of indicators, its provision of definitions of each indicator, the inclusion of a time series where data is available and the easily understandable manner in which the data is presented. Another strength is the ongoing work to update and improve indicators and the increased linkages between this work and the Big Cities project (mentioned below) which improves comparability and consistency of the chosen indicators and enhances availability of sub-national data. The availability of the work on an annual basis provides opportunities for assessment of social outcomes and enhances public debate about these. Finally the extent of change in the key indicators is easily assessed due to manner in which the data is presented in a summary diagram. The major limitation of the report is that some of the data chosen is available only on a one-off basis. This is shown in the 2006 report where only 25 of the 42 indicators have been updated with more recent information, and data for some indicators is now becoming dated. For example, the information used in the social connectedness domain for the indicator of �‘contact between young people and their parents�’ was obtained in 2001. Similarly the �‘perceptions of safety�’ indicator is based on 2001 data. For a range of other indicators data from the 2001 Census is used. Another weakness is the lack of indicators in some desired outcome areas such as human rights and the environment.
5b The Big Cities Quality of Life project
In an example of regionally based social reporting, the councils of the six largest cities in New Zealand began a project to measure the quality of life in their respective cities in 1999. Those involved have since expanded to include twelve territorial authorities. (Some additional assistance from the MSD has ensured that �‘the rest of NZ�’ has been covered in some related indicator work.) The project was a response to the growing pressures on these urban communities, and to concerns about the impacts of urbanisation and its effects on the citizens in these communities.
8
The framework for selecting indicators incorporated aspects of three models: goal based, sector-based and pressure �– state �– response. The terms �‘quality of life�’ and �‘wellbeing�’ were used to describe the concepts underlying the project. The groupings used to organise the indicators were: demographics, housing, health, education, employment and economy, safety, urban environment, community cohesion and democracy. The development team took around two years to identify the relevant mix of subjective and objective indicators and �“began with the objective of selecting a set of key indicators to measure change in social conditions�” (Six Cities Project, 2001). Problems with unavailability of data impinged upon the indicators selected, including data being unavailable for the geographic regions specified, issues with different agencies having different regional boundaries, the lack of consistent definitions between councils and problems of the timeliness of data. These issues combined to result in a considerable reliance on data from the five yearly Census. However, the project now uses a survey of residents to obtain data which is not available elsewhere. So far two reports have been published, one in 2001 and another in 2003. The latest residents�’ survey was conducted in 2004 and as with previous rounds the survey results will be included in the full Quality of Life Report and also made available separately.4 A third report is in preparation for release in 2007 once data from the 2006 Census has been incorporated. The Big Cities project uses a mix of subjective and objective indicators to paint a comprehensive picture of the state of each of the six cities, providing a good example of social reporting. The predominant limitation in the Big Cities project is its use of large number of indicators which will preclude an easy analysis of any change. In addition, examining differences across so many cities is another analytical challenge. 5c The Family and Whanau Wellbeing Project (FWWP) The Family and Whanau Wellbeing project is part of a five year research programme supported by the Social Science funding pool of the Foundation for Research, Science and Technology.5 The principal goal of this programme is to develop ways to use Census data to examine and monitor the social and economic determinants of family and whanau wellbeing and how these have changed over the period 1981 to 2001. Indicators of family wellbeing were constructed using information available from the Census. This focus on family contrasts with most other analytical work which focuses on the individual level, partly because consistent retrieval of family data is more difficult to achieve. The use of Census data to construct indicators of wellbeing has three main advantages. First, using the census allows for an assessment of societal patterns over a long segment of time (20 years). Previous New Zealand research using wellbeing indicators has generally only examined much shorter time periods. Second, information obtained from the Census covers (almost) all members of the population rather than just a small sample of the population as in most other indicator work. The level of detail available from the Census allows us to examine the wellbeing of all
4 To see the data from the 2004 survey visit http://www.bigcities.govt.nz/index.htm 5 See website: http://www.nzssn.org.nz/pages/index.php
9
New Zealanders, and provides information on small population groupings, at the family and household level. Third, while the Census collects no information on the subjective elements of wellbeing many of the core outcomes (good jobs, adequate income, education and health) identified by New Zealanders are based on objective living conditions, which are in turn intrinsically related to people�’s command over resources, which in turn affects their quality of life. Thus, in many instances a strong link exists between the more objective measures of wellbeing and the subjective measures of wellbeing. Therefore, although the census provides little direct information on the subjective intangible aspects of wellbeing, it can nonetheless provide some indirect insights into these. The limitations in using Census data to construct indicators and measure family wellbeing are the trade-offs between broad coverage, consistency of information and the depth or richness of detail that the information provides, and the frequency of census data collection at five-yearly intervals. First; the selection of indicators is constrained by the information available through census data. Family and household wellbeing may be influenced by other factors (e.g., the perceived quality of family/household relationships) for which no census data is available. Second, a lack of data availability may constrain time series analysis. Some census questions that may be relevant to family/household wellbeing are no longer asked (e.g., housing insulation) while other census information (e.g., smoking) is not asked in every Census. This means we cannot monitor changes in such domains as frequently as we wish. Third, a lack of in-depth information may place limits on interpreting change in some indicators. For example, because income data is collected in bands rather than discrete amounts, indicator construction requires some estimation. Fourth; the census definition of �‘family�’ only incorporates those family members that live within one household. Census wellbeing measures may be particularly poor indicators for families whose members do not all reside within the one household. In particular, this relates to parents who usually share custody of their children, and children who live across two households. The ability to monitor the wellbeing of those in extended family situations is also constrained by this household-based definition of wellbeing. Despite these drawbacks the use of wellbeing indicators derived from Census data will prove a useful additional resource to the monitoring of wellbeing in New Zealand and particularly how this has varied for various sub-groups of the population.
6 Issues
The recent social indicators and social reporting initiatives in New Zealand face similar issues, the most important of which are those of data availability and timeliness. In addition, there are the interlinked issues of indicator proliferation and threats to the long term viability of such initiatives. The issue of availability refers to having data available in order that valid indicators of change can be constructed. In comparison with other countries such as Australia, Canada, the United Kingdom and most European countries, official social statistics in New Zealand are underdeveloped. The statistics are fragmented and there are significant gaps in the existing bodies of data. As a result the available statistics do not provide a firm basis for institutionalising a set of social indicators in New Zealand. Many of the current developments, including The Social Report and the Big
10
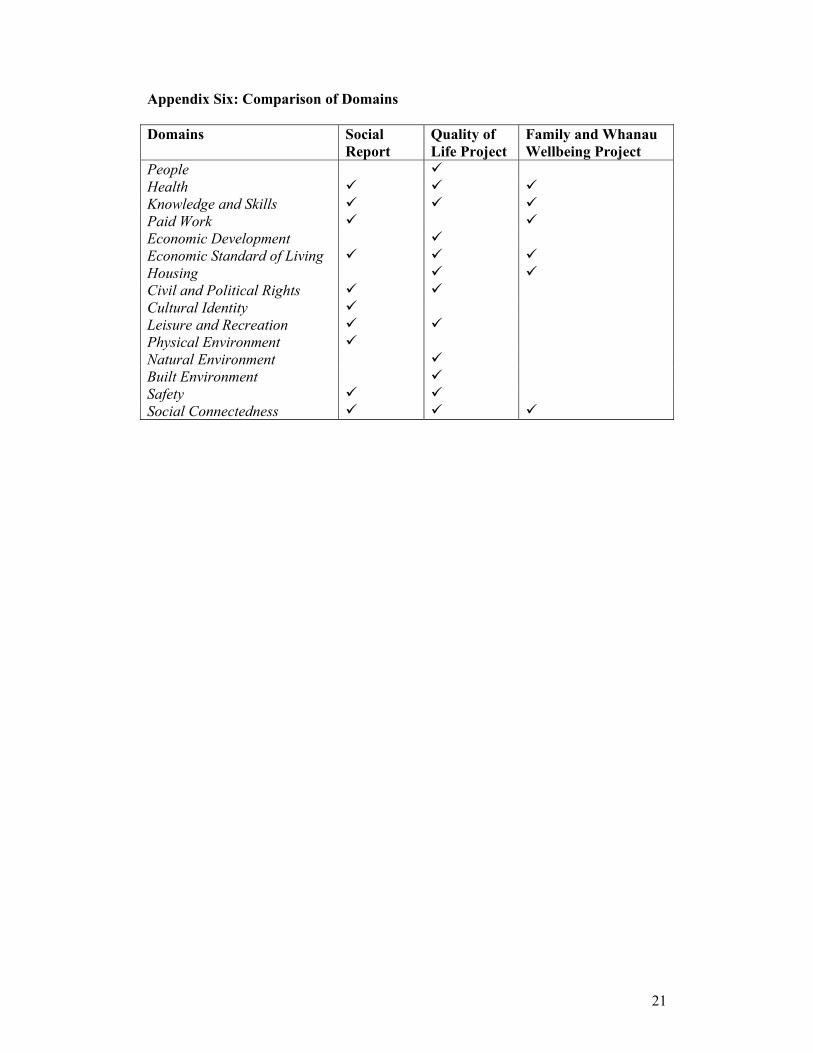
Cities project have mentioned the issue of the lack of data as a significant impediment in the development and progress of their work. The issue of data timeliness relate to the availability of up-to-date information. The 2006 Social Report notes that �“Twenty five of the 42 indicators in the report have been updated this year�” (Ministry of Social Development 2006), the remaining 17 indicators (approximately 40 percent) not being updated due to lack of new data to do so. For the indicators projects output to be useful to the analyses of outcomes data needs to be as up-to-date as possible. The issue of the long run viability of various social indicator and social reporting initiatives has two aspects. The first of these relates to the question of potential political interference in their production. For example, an incoming government may not be keen to measure outcomes in some areas, especially if they are reporting the negative effects of policy introduced by that government, and may cease their publication. Crothers (2006) notes the existence of disquiet among the opposition National Party when the Labour government used material from the 2005 Social Report prior to the general election to promote its policy choices. The second aspect refers to the proliferation of indicator and reporting projects. As indicated earlier, there are multiple indicator and social reporting initiatives underway in New Zealand. This is a large number of initiatives for a relatively small country and even allowing for the different focus of many of the projects, calls into question the financial viability of such projects which tend to resource intensive. A third concern involves the extent to which indicators project overlap and reinforce each other while jointly ensuring that the fullest range of areas of concern is covered. To examine this issue a series of appendices are attached to this report, listing the domains and specific indicators of each of the reports covered (Social Monitoring �– Appendix 2, the Social Report �– Appendix 3, Big Cities QOL �– Appendix 4 and then two comparative tables comparing domains �– Appendix 6 - and specific indicators �– Appendix 7 �– across the latter three projects). Of the 12 domains to be covered, the Social Report and the Big Cities QOL cover each, whereas FWWP covers only half the range. The 15 indicators deployed by FWWP contrast with the 45 or so in the SR and the very wide array of indicators mobilised by the BCQOL. Nevertheless, as is argued above, what the FWWP datasets lack for in terms of breadth of coverage is somewhat compensated for by depth �– both in terms of the length of the time-series and also the capacity for disaggregated analyses. The �‘maps�’ of appendices six and seven allow readers to relate the coverage of each of the three projects to each other.
7 Future developments
A key theme among the recent developments has been the issue of data availability. This lack of data is being addressed in two ways. First, the Big Cities project and the MSD�’s Social Report have jointly commissioned further surveys to gather needed data, and are working together in producing common survey datasets. Second, SNZ has recently conducted a review of the social statistics collected in New Zealand and will shortly conduct a General Social Survey in order to obtain much needed data.
11
SNZ proposes that the General Social Survey will collect information on an array of social topics on a recurrent basis. Data collected across a range of domains including population, health, leisure and recreation, knowledge and skills, paid work, economic standard of living, housing, physical environment, culture and identity, safety and security and social connectedness. The survey is currently being piloted and will go into the field in April 2008.
8 Conclusion
The raft of social indicators and social reporting initiatives underway in New Zealand would suggest that future of such projects assured. However, these projects face the issues of data availability threats from issues of data quality and the uncertainty of long-term funding.
12
Bibliography
Andrews, F. (1990). "The Evolution of a Movement." Journal of Public Policy 9(4): 401-405. Bulmer, M. (1990). "Problems of Theory and Measurement " Journal of Public Policy 9(4): 407-412. Crothers, C. (2000). "Monitoring the Changing Social Conditions of New Zealanders." Social Policy Journal of New Zealand 15: 102-120. Crothers, C. (2006). The Development of Indicators in New Zealand: indicatorisation. International Sociological Association. Durban. Davey, J. (1993). From Birth to Death III. Wellington, Institute of Policy Studies, Victoria University of Wellington. Davey, J. (1998). Tracking social change in New Zealand : from birth to death IV. Wellington, Institute of Policy Studies. Davey, J. (2000). "From Birth to Death: A Social Monitoring Framework from New Zealand " Social Indicators Research 49: 51-67. Davey, J. (2003). Two decades of change in New Zealand: from birth to death V Wellington, Institute of Policy Studies. Department of Statistics (1977). Social Trends in New Zealand. Wellington, Department of Statistics. Ministry of Social Development (2006). The Social Report 2006. Wellington, Ministry of Social Development. New Zealand Planning Council (1985). From Birth to Death: The First Report of the Social Monitoring Group. Wellington, New Zealand Planning Council. Noll, H.-H. and W. Zapf (1994). Social Indicators Research: Societal Monitoring and Social Reporting. Trends and Perspectives in Empirical Social Research. I. Borg and P. Mohler. Berlin, Walter de Gruyter. Vogel, J. (1994). "Social Indicators and Social Reporting." Statistical Journal of the United Nations 11: 241-260.
13
Appendices
Appendix One: Summary of Recent Developments
Objective indicators
Subjective indicators
Concepts used
Frequency of publication
Number of indicators
Monitoring Social Conditions
Yes No Quality of life 66
Quality of Life in New Zealand’s Six Largest Cities
Yes Yes Quality of life,Social wellbeing
Approx. 95
The Social Report
Yes Yes Quality of life, Wellbeing
Annual
36
Family and Whanau Wellbeing project
Yes No Wellbeing Five yearly 17
14
Appendix Two: Monitoring Social Conditions – Domains and Indicators
Economic conditions and economic-related conditions
Government indebtedness percent Inflation change Economic growth rate Employment numbers Public debt Taxation ($) Taxation percent Unemployment rate Top quintile Middle quintile Bottom quintile Bankruptcies (000) Into receivership Court-ordered liquidations Voluntary liquidations Stock exchange firms, overseas Stock exchange firms, New Zealand Share price index New companies registered (000) Companies struck off register
Labour market conditions Trade union memberships Trade unions Number of stoppages Person-days lost (000) Persons striking (000)
Political conditions Party in power (seats in Parliament) Number of state asset sales
Demographic conditions Estimated population (000) Divorce rate Marriage rate Net migration (000) In-migration (000) Out-migration (000) Net migration Pacific Islands Total fertility rate Ex-nuptial births (%) Age at death, males Age at death, females Age at marriage Female age at birth
Government service delivery Unemployment benefits (000) Sickness benefits (000) Invalid benefits (000) Domestic Purposes Benefits (000) National Superannuation (000) Housing supplement allowance (000) Number of pre-schoolers (000) University students (000)
15
Polytechnic students (000) Hospital waiting list (000)
Social Consequences Suicide rate Number of violent crimes Number of crimes Imprisonment rate Abortion rate First mental hospital admissions, M ori First mental hospital admissions, non-M ori Road deaths Road accident rate Alcohol consumption Tobacco consumption Complaints to Race relations Office
Cultural outcomes Subsidised condoms (M) Number of hours local TV (00) New Zealand publication titles
16
Appendix Three: The MSD Social Report 2006 – Domains and Indicators
Health Health expectancy Life expectancy Suicide Cigarette smoking Obesity
Knowledge and skills Participation in early childhood education School leavers with higher school qualifications Participation in tertiary education Educational attainment of the adult population Adult literacy skills in English
Paid Work Unemployment Employment Median hourly earnings Workplace injury claims Satisfaction with work-life balance
Economic Standard of Living Market income per person Income inequality Population with low incomes Population with low living standards Housing affordability Household crowding
Civil and political rights Voter turnout (general elections) Voter turnout (local authority elections) Representation of women in government Perceived discrimination Perceived corruption
Cultural identity Local content programming on New Zealand television M ori language speakers Language retention
Leisure and recreation Satisfaction with leisure time Participation in sport and active leisure Participation in cultural and arts activities
Physical environment Air quality Drinking water quality
Social Connectedness Telephone and Internet access in the home Regular contact with family/friends Trust in others Loneliness Contact between young people and their parents
17
Appendix Four: The Big Cities Project – Domains and indicators
People Population Growth Ethnicity Age Families and Households
Housing Household Tenure Housing Costs and Affordability Household Crowding Government Housing Provision Urban Housing Intensification
Health Life Expectancy Low Birth Weights Infant Mortality Teenage parents Diseases Access to GPs Mental Health and Emotional Wellbeing Health Status Modifiable Risk Factors
Knowledge and Skills Early Childhood Education School Decile Ratings Suspensions and Stand-downs Qualification Levels Community Education
Economic Development Economic Growth Employment Growth in the Number of businesses Retail Sales Building Consents Tourism
Economic Standard of Living Income Costs Household Expenditure Social Deprivation
Safety Perceptions of Safety Child Safety Road Casualties Crime Levels
Built environment Look and Feel of the City City Green Space Graffiti Noise Pollution Traffic and Transport Public Transport
Natural Environment Waste Management and Recycling Biodiversity Air Quality Beach and Stream/Lake Water Quality Drinking Water Quality
18
Social Connectedness Quality of Life Diversity Community Strength and Spirit Electronic Communication
Civil and Political Rights Treaty of Waitangi Involvement in Decision Making Voter Turnout Representation
19
Appendix Five: The Family and Whanau Wellbeing Project – Domains and Indicators
Wellbeing component
Indicators selected
Definition
Income Equivalised family income (CPI-adjusted)
The median value of all equivalised family income
Income source The proportion of all families with one or more family member receiving any type of government transfer
Proportion of families with low equivalised incomes
The proportion of all families whose equivalised gross family income is less than 60 percent of the median equivalised gross family income
Income inequality
The X proportion of all families who earn Y percentage of the total income of all families
Education Secondary educational attainment
The proportion of families who have one or more family member(s) aged over 15 with any secondary qualifications
Post-secondary educational attainment
The proportion of all families who have one or more family member(s) aged over 15 with any post-secondary qualifications
Work Unemployment The proportion of all families containing at least one family member who is unemployed
Hours worked The proportion of all families containing at least one family member who works more than 48 hours a week
Housing Tenure The proportion of households that live in owner-occupied dwellings
Rental affordability
The proportion of all households in rented dwellings whose weekly rent is greater than 25 percent of their gross equivalised household income
Habitability: dwelling type
The proportion of all households living in temporary private dwellings
Habitability: Fuels used to heat the dwelling
The proportion of all households that have not used any form of fuel to heat their dwellings
Crowding The proportion of all households that require at least one additional bedroom to meet the sleeping needs of the household
Social Connectedness
Telephone access
The proportion of all households that have access to a telephone
Motor vehicle access
The proportion of all households that have the private use of one or more motor vehicles
Internet access The proportion of all households that have access to the Internet
20
Health Current cigarette smoking status
The proportion of all families that contain one or more member(s) aged 15 and over who smoke cigarettes regularly (i.e., one or more per day)
21
Appendix Six: Comparison of Domains
Domains Social Report
Quality of Life Project
Family and Whanau Wellbeing Project
People Health Knowledge and Skills Paid Work Economic Development Economic Standard of Living Housing Civil and Political Rights Cultural Identity Leisure and Recreation Physical Environment Natural Environment Built Environment Safety Social Connectedness
22
Appendix Seven: Comparison of Indicators
Domains Social Report
Big Cities QOL FWWP
Contextual Population Growth Ethnicity Age Family and Households Health Mental Health &
Wellbeing Modifiable Risk Factors Low Birth Weights Teenaged Parents Infant Mortality Access to GPs Health Status Diseases
Health expectancy Life expectancy Suicide Cigarette smoking Current
cigarette smoking status
Obesity Education Suspensions &
Stand-downs School Decile Ratings Community Education
Participation in early childhood education
School leavers with higher qualifications
Secondary educational attainment
Participation in tertiary education Educational attainment of the adult population
Secondary educational attainment
Post-secondary educational attainment
Adult literacy skills in English
23
Economic Development Growth in Businesses Building Consents Economic Growth Retail Sales Tourism
Unemployment Unemployment Employment Hours worked Median hourly earnings Workplace injury claims Satisfaction with work-life balance Household
Expenditure Social Deprivation Income Costs
Market income per person Equivalised
family income (CPI-adjusted)
Income source Income inequality Income
inequality Population with low incomes Proportion of
families with low equivalised incomes
Population with low living standards
Housing Government Housing Provision Urban Housing Intensification