14
Health Reports Catalogue no. 82‑003‑X ISSN 1209‑1367 by Heather Gilmour and Pamela L. Ramage‑Morin Social isolation and mortality among Canadian seniors Release date: June 17, 2020
Health Reports
Catalogue no. 82‑003‑X ISSN 1209‑1367
by Heather Gilmour and Pamela L. Ramage‑Morin
Social isolation and mortality among Canadian seniors
Release date: June 17, 2020
How to obtain more informationFor information about this product or the wide range of services and data available from Statistics Canada, visit our website, www.statcan.gc.ca. You can also contact us by Email at STATCAN.infostats‑[email protected] Telephone, from Monday to Friday, 8:30 a.m. to 4:30 p.m., at the following numbers:
• Statistical Information Service 1‑800‑263‑1136 • National telecommunications device for the hearing impaired 1‑800‑363‑7629 • Fax line 1‑514‑283‑9350
Depository Services Program
• Inquiries line 1‑800‑635‑7943 • Fax line 1‑800‑565‑7757
Note of appreciationCanada owes the success of its statistical system to a long‑standing partnership between Statistics Canada, the citizens of Canada, its businesses, governments and other institutions. Accurate and timely statistical information could not be produced without their continued co‑operation and goodwill.
Standards of service to the publicStatistics Canada is committed to serving its clients in a prompt, reliable and courteous manner. To this end, Statistics Canada has developed standards of service that its employees observe. To obtain a copy of these service standards, please contact Statistics Canada toll‑free at 1‑800‑263‑1136. The service standards are also published on www.statcan.gc.ca under “Contact us” > “Standards of service to the public.”
Published by authority of the Minister responsible for Statistics Canada
© Her Majesty the Queen in Right of Canada as represented by the Minister of Industry, 2020
All rights reserved. Use of this publication is governed by the Statistics Canada Open Licence Agreement.
An HTML version is also available.
Cette publication est aussi disponible en français.
AbstractBackground: Subjective and objective measures of isolation have been associated with increased risk of mortality in many studies, and some have found differential effects.Data and methods: Canadian Community Health Survey-Healthy Aging data (2008/2009) linked to the Canadian Vital Statistics—Death Database were used to estimate the prevalence of social isolation measured objectively (low social participation) and subjectively (feelings of loneliness and weak sense of community belonging). Associations with death during the 8 to 9 year follow-up period were examined with multivariate Cox proportional hazards models controlling for sociodemographic and health-related characteristics. Structural equation models (SEM) examined direct paths with survival time and indirect effects through health status controlling for covariates that were significant in the Cox models. Analyses were stratified by sex.Results: An estimated 525,000 people (12%) aged 65 or older felt socially isolated and over 1 million (1,018,000) (24%) reported low participation. In multivariate Cox models, low participation was significantly associated with death for men and women even when the potential confounding effects of subjective isolation, socio-demographic characteristics, health status, and health behaviours were considered. Subjective isolation was not associated with death in final multivariate models for men or women. SEM revealed significant associations between low participation and survival time for men and women. In addition to the direct effects, there were significant indirect effects mediated by health status. There were no direct effects of subjective isolation on survival for men or women, only indirect effects mediated through health status.Interpretation: Subjective and objective isolation differed in their association with mortality.
Keywords: loneliness, morbidity, data linkage, path analysis, structural equation modelling, agingDOI: https://www.doi.org/10.25318/82-003-x202000300003-eng
Authors: Heather Gilmour ([email protected]) and Pamela L. Ramage-Morin are with the Health Analysis Division at Statistics Canada, Ottawa, Ontario, K1A 0T6.
The impact of social isolation and loneliness on health and well-being is recognized globally as a public health issue.
The United Kingdom appointed a Ministerial lead on loneli-ness1 and the World Health Organization recognizes the impact of social isolation on disability and death.2 Research generally demonstrates that social isolation is associated with increased risk of mortality3-7 on par with or greater than more traditional risk factors such as alcohol use, smoking and obesity.8
Social isolation can be experienced at any age, although some circumstances relate more specifically to older ages.9-12 These may include transitions to retirement and accompanying role loss, ill health, loss of a spouse or friends, mobility problems, vision and hearing loss, lower income, residential changes, and changes in access to transportation. At a broader social level, ageism may contribute to social isolation.12 Social isolation experienced by marginalized populations such as the LGBTQ community can continue into the senior years, adding to other factors associated with aging.13
While there may be an intuitive understanding of social iso-lation, measurement of this concept varies. Objective measures such as the size of social networks and the frequency of social participation reflect the structural aspects of social relationships while subjective feelings of social isolation11 or loneliness14 embody the functional aspects of relationships.3 Associations between both subjective and objective measures of isolation and risk of death are evident in some studies 5,7,15-18 although others report different associations depending on the measure.19-21
The primary goal of this study was to examine an objective and a subjective measure of social isolation and their associations with mortality for Canadian seniors aged 65 or older. Prevalence
estimates of social isolation using each measure are presented. Selected factors associated with social isolation were examined prior to their inclusion in the multivariate models. Note that data on transitions (e.g. retirement) and changes in life circumstances (e.g. loss of spouse) were not available in the cross-sectional data on which this study was based. Associations with survival were assessed with multivariate Cox proportional hazards models adjusting for selected sociodemographic and health-related characteristics. Structural equation models (SEM) were used to examine direct relationships between social isolation measures and death and indirect effects mediated through health status.
Social isolation was defined objectively as infrequent social participation (low participation) and subjectively as feelings of loneliness and a weak sense of community belonging (subjective isolation). Because of evidence showing different associations between measures of social isolation and mortality by sex,6,22-24 men and women were analyzed separately.
MethodsData sources
Canadian Community Health Survey—Healthy Aging (CCHS-HA)The cross-sectional 2008/2009 CCHS-HA collected informa-tion about factors that contribute to healthy aging, targeting people aged 45 or older living in private dwellings in the 10 provinces. About 4% of the population were excluded: residents of the three territories, First Nations reserves, certain remote regions, institutions and Canadian Forces bases, and full-time
Social isolation and mortality among Canadian seniorsby Heather Gilmour and Pamela L. Ramage-Morin
27Statistics Canada, Catalogue no. 82-003-X • Health Reports, Vol. 31, no. 3, pp. 27-38, June 2020Social isolation and mortality among Canadian seniors • Research Article
members of the Canadian Forces. Data were collected from December 2008 through November 2009. Computer-assisted personal interviews were conducted for 94% of the sample; tele-phone interviews were permitted to accommodate the language needs of respondents. The overall response rate was 74.4%. Detailed documentation for the CCHS–HA is available at: http://www23.statcan.gc.ca/imdb/p2SV.pl?-Function=getSurvey&SDDS=5146.
The Canadian Vital Statistics—Death Database (CVSD) The CVSD is an administrative dataset that includes demographic and cause of death information for deaths that occur in Canada. Data are collected annually from provincial and territorial vital statis-tics registries. Deaths that occurred from December 2008 through December 31, 2017 that linked to CCHS-HA records were used in this analysis. Detailed docu-mentation for the CVSD is available at: http://www23.statcan.gc.ca/imdb/p2SV.pl?Function=getSurvey&Id=1202355.
Data linkageLinkage approval (007-2018) was granted by the Chief Statistician of Canada and performed in accordance with the Directive on Record Linkage. CCHS-HA respondents who agreed to share and link their data were probabil-istically linked to the Derived Record Depository (DRD) in the Social Data Linkage Environment (SDLE) at Statistics Canada. Probabilistic record linkage works with non-unique identi-fiers (e.g., name, sex, date of birth, and postal code) and estimates the likelihood that records refer to the same entity.25 Only employees directly involved in the process have access to the information required for linkage and do not access health and/or death-related information. An analytical file without identifying information was created for this study.
Study sample The study was based on CCHS-HA respondents aged 65 or older with data linked to the CVSD for those who died
(Appendix Table A). Follow-up ranged from 8 to 9 years, from the CCHS-HA interview date to December 31, 2017. The study sample comprised 13,037 individuals (5,408 men, 7,629 women); 4,953 respondents (2,175 men, 2,778 women) died in the follow-up period between their CCHS-HA interview and December 31, 2017.
Definitions
Social isolation measuresLow participation was based on the social participation module that questions respondents about eight community-re-lated activities. Respondents were asked how often in the past 12 months (at least once a day/week/month/year or never) they participated in each activity. Individuals whose overall participation was less than weekly were classified as having low participation versus high participation (one activity or more on a daily or weekly basis). The “weekly” benchmark was selected based on earlier studies.13,26
● family or friendship activities outside the household
● church or religious activities such as services, committees or choirs
● sports or physical activities with others
● other recreational activities involving others, including hobbies, bingo and other games
● educational and cultural activities involving others such as attending courses, concerts or visiting museums
● service club or fraternal organization activities
● neighbourhood, community or pro-fessional association activities
● volunteer or charity workAlthough low participators did not
participate in any of the eight activities on a weekly basis, 4% of them partici-pated in 4 or more activities on a monthly basis.
Subjective isolation was a composite of two measures capturing loneliness and sense of community belonging. The three-Item Loneliness Scale was
based on the Revised UCLA Loneliness Scale.27 Respondents were asked “How often do you feel: that you lack com-panionship? left out? isolated from others?” Response category values (1 = hardly ever; 2 = some of the time; 3 = often) were summed. Respondents who scored 4 to 9 were categorized as lonely versus a score of 3. Sense of community belonging was determined with one question: “How would you describe your sense of belonging to your local community? Would you say it is very strong? Somewhat strong? Somewhat weak? Very weak?” Individuals who were lonely and reported a “somewhat” or “very” weak sense of community belonging were considered isolated.
CovariatesAge in years was grouped (65 to 74, 75 or older) for prevalence estimates and the number and percentage of deaths, and entered as a continuous variable in the multivariate analyses. Seniors refers to the study population, that is, those aged 65 or older. The highest level of educational attainment by any house-hold member (less than post-secondary, post-secondary graduation or more) was selected as a measure of socioeconomic status. It represents a family resource that is often correlated with levels of income and wealth28 and is suitable when transitions from employment to retirement are likely in the population. Place of residence was dichotomized as urban or rural. A combination of marital status and living arrangements classi-fied individuals as married/common-law versus not married/common-law (i.e. single, widowed or divorced); the latter was further divided into those who were living alone versus with others where “others” could be a child, friend, sibling or other. A dichotomous vari-able classified respondents as married or common-law versus neither for the path analysis (SEM).
The Health Utility Index Mark 3 (HUI3)29 was used to assess functional health status in eight domains: vision, hearing, speech, mobility, dexterity, cognition, emotion, and pain and dis-comfort. Overall scores were categorized
28 Health Reports, Vol. 31, no. 3, pp. 27-38, June 2020 • Statistics Canada, Catalogue no. 82-003-XSocial isolation and mortality among Canadian seniors • Research Article
into levels of disability for reporting prevalence: no/mild disability (0.89 to 1.00), moderate disability (0.70 to 0.88), or severe disability (less than 0.70)30 Continuous HUI3 scores were used in multivariate models – higher scores equate to better health status.
Smoking status was categorized as current (daily or occasional), former, or never smoked. For the path analysis current and former smokers were grouped together and compared to those who had never smoked.
Physical activity was based on the Physical Activity Scale for the Elderly (PASE). It captures self-reported occu-pational, household and leisure activity over the previous 7 days.31 Higher scores indicate higher levels of physical activity. Using scores from the popula-tion (weighted), respondents’ activity levels were classified into quartiles as least active (score: < 58), low to mod-erate (58 to 99), moderate to high (100 to 143), or most active (> 143). Continuous PASE scores were used in the multi-variate analyses.
Analytical techniquesCross-tabulations were used to estimate the prevalence of low participation and subjective isolation, and the number and percentage of deaths by social isolation measures and selected characteristics. Associations between social isolation and mortality were examined using Cox proportional hazards models with sub-jective isolation and low participation entered into models simultaneously. These social isolation variables were moderately correlated (0.28 for men and 0.38 for women), suggesting that they are related, but distinct, concepts. Variance inflation factors (≤ 2.9) and tolerance estimates (≥ 0.2) demonstrated that multicolinearity was not a problem. Adjusted models controlled for potential confounders measured at the time of the CCHS-HA interview. The first model controlled for age; the second added sociodemographic variables (house-hold education; marital status and living arrangements; urban/rural residence) and the final model included health-re-
lated characteristics (health status, smoking status, and physical activity). The selection of covariates was based on the literature and availability in the CCHS–HA. The proportional hazards assumption was tested by visual exam-ination of SAS PROC LIFETEST plots.
The direct and indirect impact of subjective isolation and low participa-tion on survival were assessed using SEM with Stata/MP 14.2. Indirect paths were assessed with functional health status (HUI3) as a single hypothesized mediator. HUI3 underwent an arc sine transformation to approximate a normal distribution. The SEM analyses controlled for covariates found to be sig-nificantly associated with mortality in the fully-adjusted Cox proportional hazards models (men: age, smoking status, physical activity; women: age, smoking status, physical activity, household edu-cation, living arrangement). An arc sine transformation was also applied to the outcome variable, time to death. The model goodness of fit was assessed using the Standardized RMR (SRMR) and the coefficient of determination (CD).
Sampling weights were used to account for the survey design and non-re-sponse, and to adjust for differences in agreement to link and share. The use of sampling weights is essential to account for unequal probabilities of selection and to reduce the potential for bias resulting from differing response, share, and agreement to link rates. Bootstrap weights were applied using SAS-Callable SUDAAN 11.0 to account for underestimation of standard errors due to the complex survey design.32 The signifi-cance level was set at p < 0.05.
ResultsBaseline characteristics of the study populationThe weighted study sample (n=13,037) represented 4.2 million people aged 65 or older with a mean age of 74 years in 2008/2009. Almost half (45%) were men, and most (63%) were married or com-mon-law; 54% lived in households where at least one person was a postsecondary
What is already known on this subject?
■ There is no gold standard for the definition and measurement of social isolation.
■ Some definitions focus on objectively measured characteristics such as the number of social contacts or frequency of social participation.
■ Others are based on subjective feelings such as loneliness or perceptions of being excluded.
■ Both subjective and objective assessments of social isolation have been associated with increased risk of death.
What does this study add?
■ Men and women aged 65 or older were equally likely to be low participators – an objective measure of social isolation.
■ Women were more likely than men to report feelings of social isolation.
■ Low participation was associated with risk of death (shorter survival time) for both men and women.
■ Subjective social isolation was not directly associated with death; there was an indirect effect mediated through health status.
graduate; 79% lived in an urban setting; 10% were current smokers, 56% former smokers and 35% had never smoked; mean physical activity (PASE) score was 106 and mean HUI3 score was 0.81.
Subjective isolation and low social participationFrom the 2008/2009 CCHS-HA, an esti-mated 525,000 people (12%) age 65 or older felt isolated in that they reported feelings of loneliness and a weak or somewhat weak sense of community belonging. At 15%, women were more likely than men (10%) to report sub-
29Statistics Canada, Catalogue no. 82-003-X • Health Reports, Vol. 31, no. 3, pp. 27-38, June 2020Social isolation and mortality among Canadian seniors • Research Article
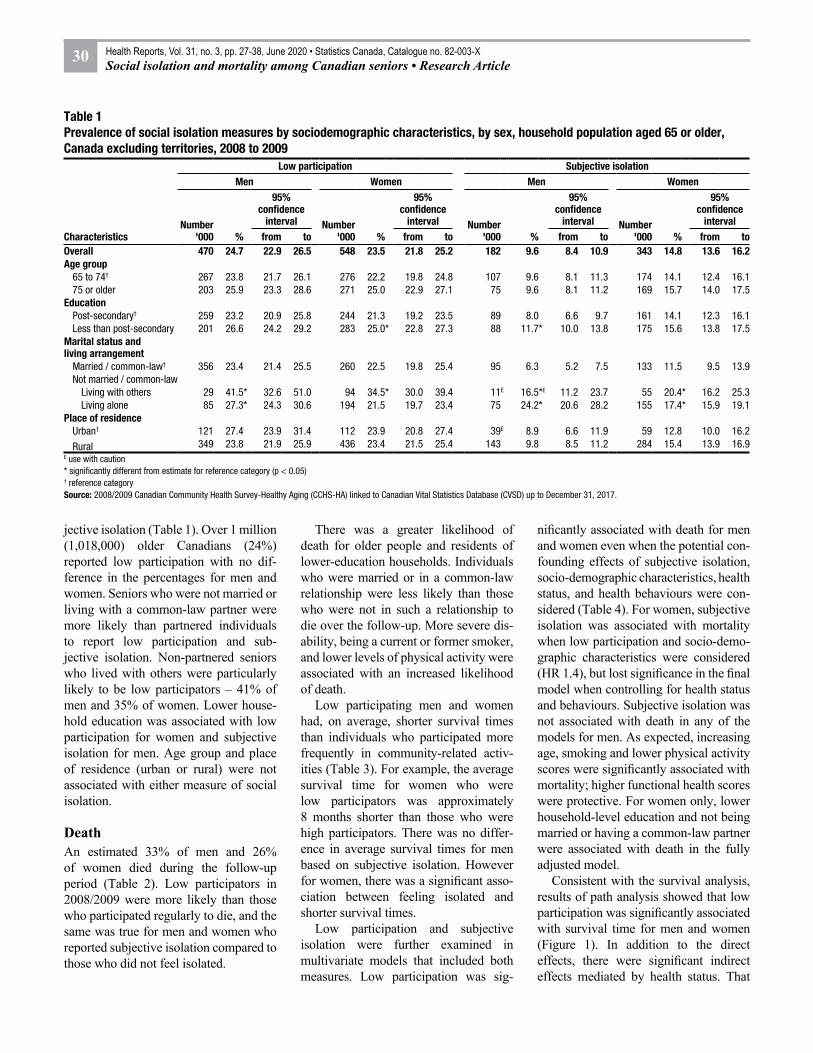
jective isolation (Table 1). Over 1 million (1,018,000) older Canadians (24%) reported low participation with no dif-ference in the percentages for men and women. Seniors who were not married or living with a common-law partner were more likely than partnered individuals to report low participation and sub-jective isolation. Non-partnered seniors who lived with others were particularly likely to be low participators – 41% of men and 35% of women. Lower house-hold education was associated with low participation for women and subjective isolation for men. Age group and place of residence (urban or rural) were not associated with either measure of social isolation.
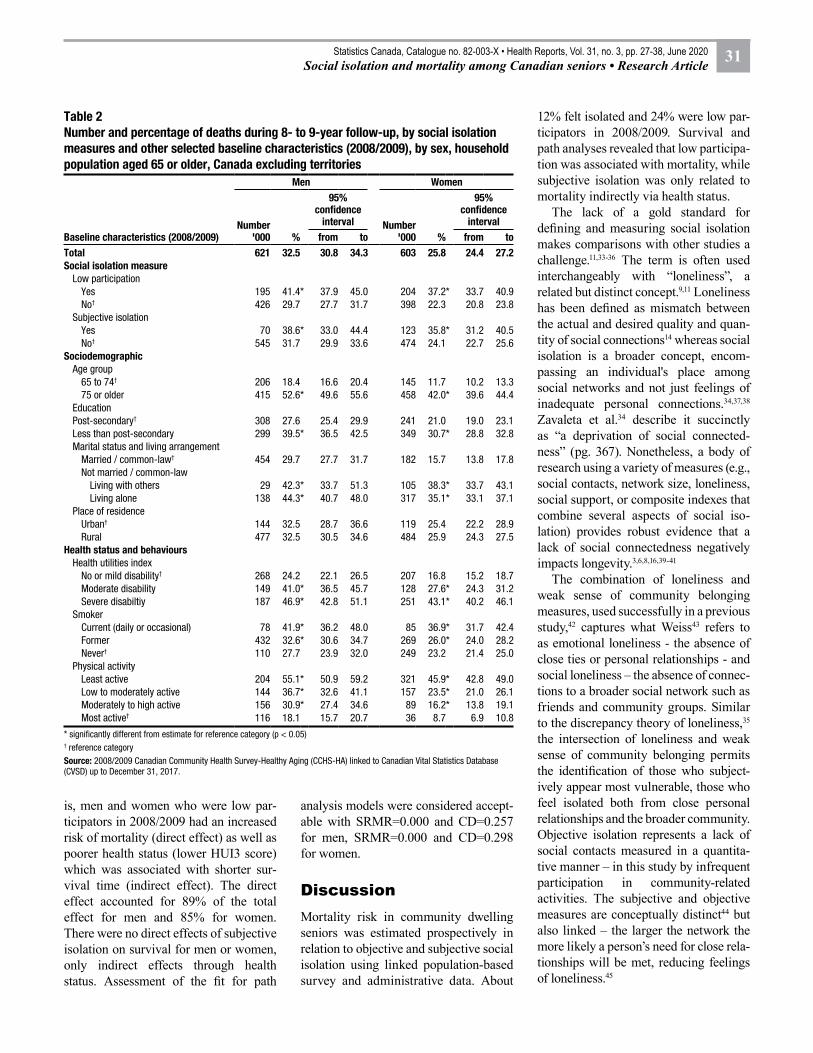
Death An estimated 33% of men and 26% of women died during the follow-up period (Table 2). Low participators in 2008/2009 were more likely than those who participated regularly to die, and the same was true for men and women who reported subjective isolation compared to those who did not feel isolated.
There was a greater likelihood of death for older people and residents of lower-education households. Individuals who were married or in a common-law relationship were less likely than those who were not in such a relationship to die over the follow-up. More severe dis-ability, being a current or former smoker, and lower levels of physical activity were associated with an increased likelihood of death.
Low participating men and women had, on average, shorter survival times than individuals who participated more frequently in community-related activ-ities (Table 3). For example, the average survival time for women who were low participators was approximately 8 months shorter than those who were high participators. There was no differ-ence in average survival times for men based on subjective isolation. However for women, there was a significant asso-ciation between feeling isolated and shorter survival times.
Low participation and subjective isolation were further examined in multivariate models that included both measures. Low participation was sig-
nificantly associated with death for men and women even when the potential con-founding effects of subjective isolation, socio-demographic characteristics, health status, and health behaviours were con-sidered (Table 4). For women, subjective isolation was associated with mortality when low participation and socio-demo-graphic characteristics were considered (HR 1.4), but lost significance in the final model when controlling for health status and behaviours. Subjective isolation was not associated with death in any of the models for men. As expected, increasing age, smoking and lower physical activity scores were significantly associated with mortality; higher functional health scores were protective. For women only, lower household-level education and not being married or having a common-law partner were associated with death in the fully adjusted model.
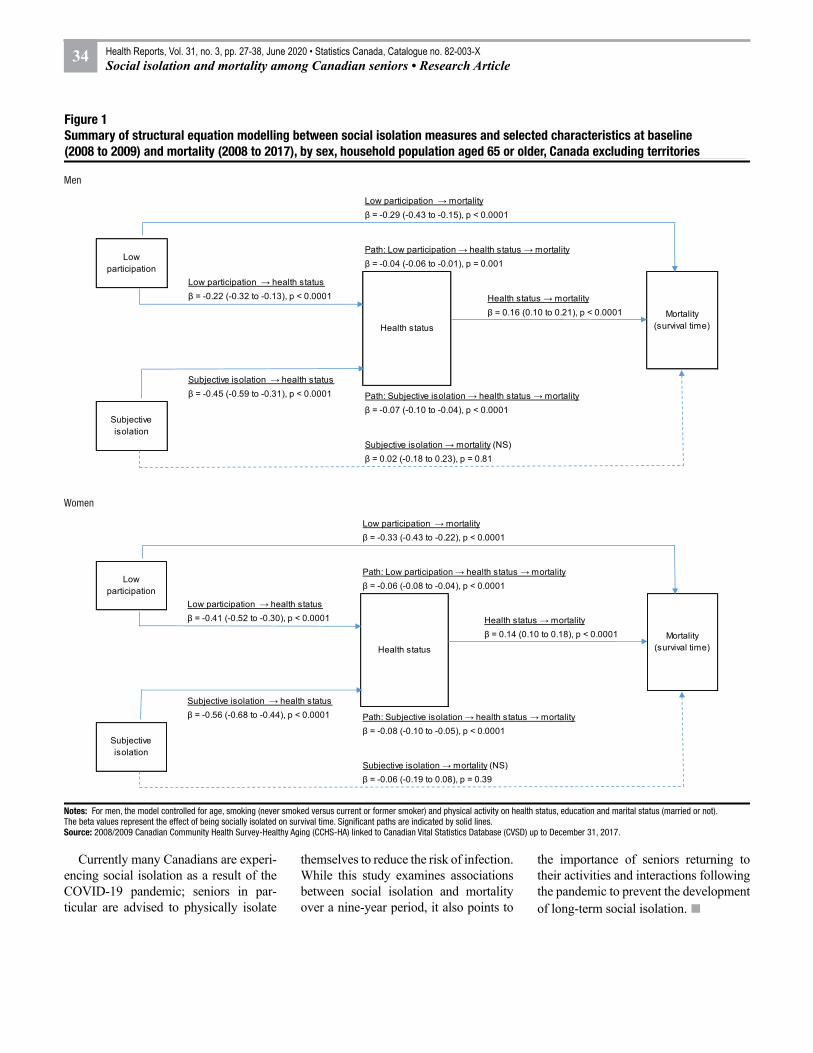
Consistent with the survival analysis, results of path analysis showed that low participation was significantly associated with survival time for men and women (Figure 1). In addition to the direct effects, there were significant indirect effects mediated by health status. That
Table 1 Prevalence of social isolation measures by sociodemographic characteristics, by sex, household population aged 65 or older, Canada excluding territories, 2008 to 2009
Characteristics
Low participation Subjective isolationMen Women Men Women
Number '000 %
95% confidence
interval Number '000 %
95% confidence
interval Number '000 %
95% confidence
interval Number '000 %
95% confidence
intervalfrom to from to from to from to
Overall 470 24.7 22.9 26.5 548 23.5 21.8 25.2 182 9.6 8.4 10.9 343 14.8 13.6 16.2Age group
65 to 74† 267 23.8 21.7 26.1 276 22.2 19.8 24.8 107 9.6 8.1 11.3 174 14.1 12.4 16.175 or older 203 25.9 23.3 28.6 271 25.0 22.9 27.1 75 9.6 8.1 11.2 169 15.7 14.0 17.5
EducationPost-secondary† 259 23.2 20.9 25.8 244 21.3 19.2 23.5 89 8.0 6.6 9.7 161 14.1 12.3 16.1Less than post-secondary 201 26.6 24.2 29.2 283 25.0* 22.8 27.3 88 11.7* 10.0 13.8 175 15.6 13.8 17.5
Marital status and living arrangement
Married / common-law† 356 23.4 21.4 25.5 260 22.5 19.8 25.4 95 6.3 5.2 7.5 133 11.5 9.5 13.9Not married / common-law
Living with others 29 41.5* 32.6 51.0 94 34.5* 30.0 39.4 11E 16.5*E 11.2 23.7 55 20.4* 16.2 25.3Living alone 85 27.3* 24.3 30.6 194 21.5 19.7 23.4 75 24.2* 20.6 28.2 155 17.4* 15.9 19.1
Place of residenceUrban† 121 27.4 23.9 31.4 112 23.9 20.8 27.4 39E 8.9 6.6 11.9 59 12.8 10.0 16.2
Rural 349 23.8 21.9 25.9 436 23.4 21.5 25.4 143 9.8 8.5 11.2 284 15.4 13.9 16.9E use with caution* significantly different from estimate for reference category (p < 0.05)† reference categorySource: 2008/2009 Canadian Community Health Survey-Healthy Aging (CCHS-HA) linked to Canadian Vital Statistics Database (CVSD) up to December 31, 2017.
30 Health Reports, Vol. 31, no. 3, pp. 27-38, June 2020 • Statistics Canada, Catalogue no. 82-003-XSocial isolation and mortality among Canadian seniors • Research Article
is, men and women who were low par-ticipators in 2008/2009 had an increased risk of mortality (direct effect) as well as poorer health status (lower HUI3 score) which was associated with shorter sur-vival time (indirect effect). The direct effect accounted for 89% of the total effect for men and 85% for women. There were no direct effects of subjective isolation on survival for men or women, only indirect effects through health status. Assessment of the fit for path
analysis models were considered accept-able with SRMR=0.000 and CD=0.257 for men, SRMR=0.000 and CD=0.298 for women.
DiscussionMortality risk in community dwelling seniors was estimated prospectively in relation to objective and subjective social isolation using linked population-based survey and administrative data. About
12% felt isolated and 24% were low par-ticipators in 2008/2009. Survival and path analyses revealed that low participa-tion was associated with mortality, while subjective isolation was only related to mortality indirectly via health status.
The lack of a gold standard for defining and measuring social isolation makes comparisons with other studies a challenge.11,33-36 The term is often used interchangeably with “loneliness”, a related but distinct concept.9,11 Loneliness has been defined as mismatch between the actual and desired quality and quan-tity of social connections14 whereas social isolation is a broader concept, encom-passing an individual's place among social networks and not just feelings of inadequate personal connections.34,37,38 Zavaleta et al.34 describe it succinctly as “a deprivation of social connected-ness” (pg. 367). Nonetheless, a body of research using a variety of measures (e.g., social contacts, network size, loneliness, social support, or composite indexes that combine several aspects of social iso-lation) provides robust evidence that a lack of social connectedness negatively impacts longevity.3,6,8,16,39-41
The combination of loneliness and weak sense of community belonging measures, used successfully in a previous study,42 captures what Weiss43 refers to as emotional loneliness - the absence of close ties or personal relationships - and social loneliness – the absence of connec-tions to a broader social network such as friends and community groups. Similar to the discrepancy theory of loneliness,35 the intersection of loneliness and weak sense of community belonging permits the identification of those who subject-ively appear most vulnerable, those who feel isolated both from close personal relationships and the broader community. Objective isolation represents a lack of social contacts measured in a quantita-tive manner – in this study by infrequent participation in community-related activities. The subjective and objective measures are conceptually distinct44 but also linked – the larger the network the more likely a person’s need for close rela-tionships will be met, reducing feelings of loneliness.45
Table 2 Number and percentage of deaths during 8- to 9-year follow-up, by social isolation measures and other selected baseline characteristics (2008/2009), by sex, household population aged 65 or older, Canada excluding territories
Baseline characteristics (2008/2009)
Men Women
Number '000 %
95% confidence
interval Number '000 %
95% confidence
intervalfrom to from to
Total 621 32.5 30.8 34.3 603 25.8 24.4 27.2Social isolation measure
Low participationYes 195 41.4* 37.9 45.0 204 37.2* 33.7 40.9No† 426 29.7 27.7 31.7 398 22.3 20.8 23.8
Subjective isolationYes 70 38.6* 33.0 44.4 123 35.8* 31.2 40.5No† 545 31.7 29.9 33.6 474 24.1 22.7 25.6
SociodemographicAge group
65 to 74† 206 18.4 16.6 20.4 145 11.7 10.2 13.375 or older 415 52.6* 49.6 55.6 458 42.0* 39.6 44.4
EducationPost-secondary† 308 27.6 25.4 29.9 241 21.0 19.0 23.1Less than post-secondary 299 39.5* 36.5 42.5 349 30.7* 28.8 32.8Marital status and living arrangement
Married / common-law† 454 29.7 27.7 31.7 182 15.7 13.8 17.8Not married / common-law
Living with others 29 42.3* 33.7 51.3 105 38.3* 33.7 43.1Living alone 138 44.3* 40.7 48.0 317 35.1* 33.1 37.1
Place of residenceUrban† 144 32.5 28.7 36.6 119 25.4 22.2 28.9Rural 477 32.5 30.5 34.6 484 25.9 24.3 27.5
Health status and behavioursHealth utilities index
No or mild disability† 268 24.2 22.1 26.5 207 16.8 15.2 18.7Moderate disability 149 41.0* 36.5 45.7 128 27.6* 24.3 31.2Severe disabiltiy 187 46.9* 42.8 51.1 251 43.1* 40.2 46.1
SmokerCurrent (daily or occasional) 78 41.9* 36.2 48.0 85 36.9* 31.7 42.4Former 432 32.6* 30.6 34.7 269 26.0* 24.0 28.2Never† 110 27.7 23.9 32.0 249 23.2 21.4 25.0
Physical activityLeast active 204 55.1* 50.9 59.2 321 45.9* 42.8 49.0Low to moderately active 144 36.7* 32.6 41.1 157 23.5* 21.0 26.1Moderately to high active 156 30.9* 27.4 34.6 89 16.2* 13.8 19.1Most active† 116 18.1 15.7 20.7 36 8.7 6.9 10.8
* significantly different from estimate for reference category (p < 0.05)† reference categorySource: 2008/2009 Canadian Community Health Survey-Healthy Aging (CCHS-HA) linked to Canadian Vital Statistics Database (CVSD) up to December 31, 2017.
31Statistics Canada, Catalogue no. 82-003-X • Health Reports, Vol. 31, no. 3, pp. 27-38, June 2020Social isolation and mortality among Canadian seniors • Research Article
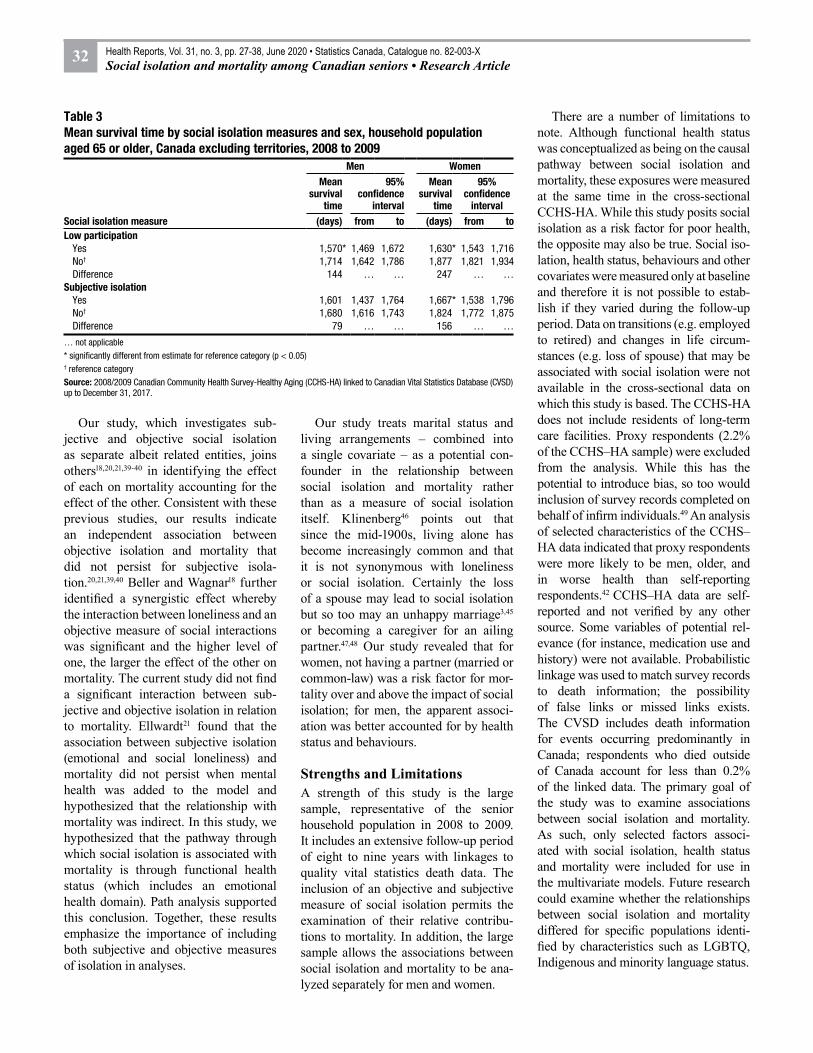
Table 3 Mean survival time by social isolation measures and sex, household population aged 65 or older, Canada excluding territories, 2008 to 2009
Social isolation measure
Men WomenMean
survival time
95% confidence
interval
Mean survival
time
95% confidence
interval(days) from to (days) from to
Low participationYes 1,570* 1,469 1,672 1,630* 1,543 1,716No† 1,714 1,642 1,786 1,877 1,821 1,934Difference 144 … … 247 … …
Subjective isolationYes 1,601 1,437 1,764 1,667* 1,538 1,796No† 1,680 1,616 1,743 1,824 1,772 1,875Difference 79 … … 156 … …
… not applicable* significantly different from estimate for reference category (p < 0.05)† reference categorySource: 2008/2009 Canadian Community Health Survey-Healthy Aging (CCHS-HA) linked to Canadian Vital Statistics Database (CVSD) up to December 31, 2017.
Our study, which investigates sub-jective and objective social isolation as separate albeit related entities, joins others18,20,21,39-40 in identifying the effect of each on mortality accounting for the effect of the other. Consistent with these previous studies, our results indicate an independent association between objective isolation and mortality that did not persist for subjective isola-tion.20,21,39,40 Beller and Wagnar18 further identified a synergistic effect whereby the interaction between loneliness and an objective measure of social interactions was significant and the higher level of one, the larger the effect of the other on mortality. The current study did not find a significant interaction between sub-jective and objective isolation in relation to mortality. Ellwardt21 found that the association between subjective isolation (emotional and social loneliness) and mortality did not persist when mental health was added to the model and hypothesized that the relationship with mortality was indirect. In this study, we hypothesized that the pathway through which social isolation is associated with mortality is through functional health status (which includes an emotional health domain). Path analysis supported this conclusion. Together, these results emphasize the importance of including both subjective and objective measures of isolation in analyses.
Our study treats marital status and living arrangements – combined into a single covariate – as a potential con-founder in the relationship between social isolation and mortality rather than as a measure of social isolation itself. Klinenberg46 points out that since the mid-1900s, living alone has become increasingly common and that it is not synonymous with loneliness or social isolation. Certainly the loss of a spouse may lead to social isolation but so too may an unhappy marriage3,45 or becoming a caregiver for an ailing partner.47,48 Our study revealed that for women, not having a partner (married or common-law) was a risk factor for mor-tality over and above the impact of social isolation; for men, the apparent associ-ation was better accounted for by health status and behaviours.
Strengths and LimitationsA strength of this study is the large sample, representative of the senior household population in 2008 to 2009. It includes an extensive follow-up period of eight to nine years with linkages to quality vital statistics death data. The inclusion of an objective and subjective measure of social isolation permits the examination of their relative contribu-tions to mortality. In addition, the large sample allows the associations between social isolation and mortality to be ana-lyzed separately for men and women.
There are a number of limitations to note. Although functional health status was conceptualized as being on the causal pathway between social isolation and mortality, these exposures were measured at the same time in the cross-sectional CCHS-HA. While this study posits social isolation as a risk factor for poor health, the opposite may also be true. Social iso-lation, health status, behaviours and other covariates were measured only at baseline and therefore it is not possible to estab-lish if they varied during the follow-up period. Data on transitions (e.g. employed to retired) and changes in life circum-stances (e.g. loss of spouse) that may be associated with social isolation were not available in the cross-sectional data on which this study is based. The CCHS-HA does not include residents of long-term care facilities. Proxy respondents (2.2% of the CCHS–HA sample) were excluded from the analysis. While this has the potential to introduce bias, so too would inclusion of survey records completed on behalf of infirm individuals.49 An analysis of selected characteristics of the CCHS–HA data indicated that proxy respondents were more likely to be men, older, and in worse health than self-reporting respondents.42 CCHS–HA data are self- reported and not verified by any other source. Some variables of potential rel-evance (for instance, medication use and history) were not available. Probabilistic linkage was used to match survey records to death information; the possibility of false links or missed links exists. The CVSD includes death information for events occurring predominantly in Canada; respondents who died outside of Canada account for less than 0.2% of the linked data. The primary goal of the study was to examine associations between social isolation and mortality. As such, only selected factors associ-ated with social isolation, health status and mortality were included for use in the multivariate models. Future research could examine whether the relationships between social isolation and mortality differed for specific populations identi-fied by characteristics such as LGBTQ, Indigenous and minority language status.
32 Health Reports, Vol. 31, no. 3, pp. 27-38, June 2020 • Statistics Canada, Catalogue no. 82-003-XSocial isolation and mortality among Canadian seniors • Research Article
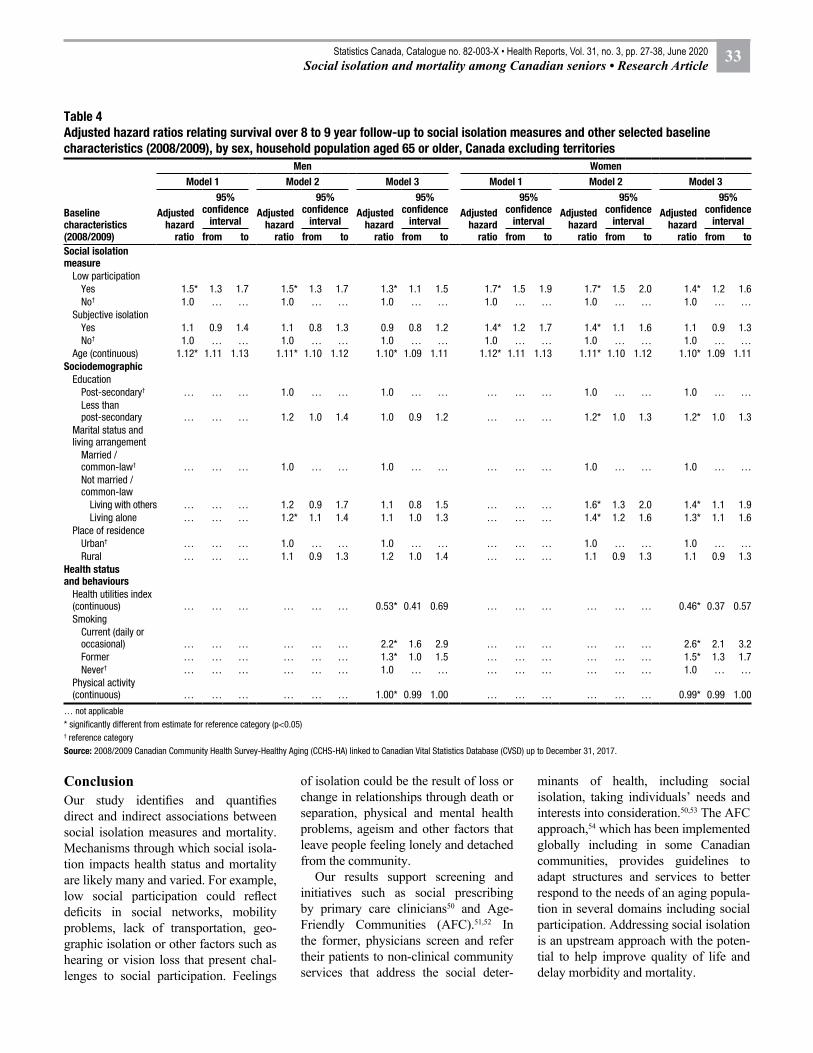
ConclusionOur study identifies and quantifies direct and indirect associations between social isolation measures and mortality. Mechanisms through which social isola-tion impacts health status and mortality are likely many and varied. For example, low social participation could reflect deficits in social networks, mobility problems, lack of transportation, geo-graphic isolation or other factors such as hearing or vision loss that present chal-lenges to social participation. Feelings
of isolation could be the result of loss or change in relationships through death or separation, physical and mental health problems, ageism and other factors that leave people feeling lonely and detached from the community.
Our results support screening and initiatives such as social prescribing by primary care clinicians50 and Age-Friendly Communities (AFC).51,52 In the former, physicians screen and refer their patients to non-clinical community services that address the social deter-
minants of health, including social isolation, taking individuals’ needs and interests into consideration.50,53 The AFC approach,54 which has been implemented globally including in some Canadian communities, provides guidelines to adapt structures and services to better respond to the needs of an aging popula-tion in several domains including social participation. Addressing social isolation is an upstream approach with the poten-tial to help improve quality of life and delay morbidity and mortality.
Table 4 Adjusted hazard ratios relating survival over 8 to 9 year follow-up to social isolation measures and other selected baseline characteristics (2008/2009), by sex, household population aged 65 or older, Canada excluding territories
Baseline characteristics (2008/2009)
Men WomenModel 1 Model 2 Model 3 Model 1 Model 2 Model 3
Adjusted hazard
ratio
95% confidence
intervalAdjusted
hazard ratio
95% confidence
intervalAdjusted
hazard ratio
95% confidence
intervalAdjusted
hazard ratio
95% confidence
intervalAdjusted
hazard ratio
95% confidence
intervalAdjusted
hazard ratio
95% confidence
intervalfrom to from to from to from to from to from to
Social isolation measure
Low participationYes 1.5* 1.3 1.7 1.5* 1.3 1.7 1.3* 1.1 1.5 1.7* 1.5 1.9 1.7* 1.5 2.0 1.4* 1.2 1.6No† 1.0 … … 1.0 … … 1.0 … … 1.0 … … 1.0 … … 1.0 … …
Subjective isolationYes 1.1 0.9 1.4 1.1 0.8 1.3 0.9 0.8 1.2 1.4* 1.2 1.7 1.4* 1.1 1.6 1.1 0.9 1.3No† 1.0 … … 1.0 … … 1.0 … … 1.0 … … 1.0 … … 1.0 … …
Age (continuous) 1.12* 1.11 1.13 1.11* 1.10 1.12 1.10* 1.09 1.11 1.12* 1.11 1.13 1.11* 1.10 1.12 1.10* 1.09 1.11Sociodemographic
EducationPost-secondary† … … … 1.0 … … 1.0 … … … … … 1.0 … … 1.0 … …Less than post-secondary … … … 1.2 1.0 1.4 1.0 0.9 1.2 … … … 1.2* 1.0 1.3 1.2* 1.0 1.3
Marital status and living arrangement
Married / common-law† … … … 1.0 … … 1.0 … … … … … 1.0 … … 1.0 … …Not married / common-law
Living with others … … … 1.2 0.9 1.7 1.1 0.8 1.5 … … … 1.6* 1.3 2.0 1.4* 1.1 1.9Living alone … … … 1.2* 1.1 1.4 1.1 1.0 1.3 … … … 1.4* 1.2 1.6 1.3* 1.1 1.6
Place of residenceUrban† … … … 1.0 … … 1.0 … … … … … 1.0 … … 1.0 … …Rural … … … 1.1 0.9 1.3 1.2 1.0 1.4 … … … 1.1 0.9 1.3 1.1 0.9 1.3
Health status and behaviours
Health utilities index (continuous) … … … … … … 0.53* 0.41 0.69 … … … … … … 0.46* 0.37 0.57Smoking
Current (daily or occasional) … … … … … … 2.2* 1.6 2.9 … … … … … … 2.6* 2.1 3.2Former … … … … … … 1.3* 1.0 1.5 … … … … … … 1.5* 1.3 1.7Never† … … … … … … 1.0 … … … … … … … … 1.0 … …
Physical activity (continuous) … … … … … … 1.00* 0.99 1.00 … … … … … … 0.99* 0.99 1.00
… not applicable* significantly different from estimate for reference category (p<0.05)† reference categorySource: 2008/2009 Canadian Community Health Survey-Healthy Aging (CCHS-HA) linked to Canadian Vital Statistics Database (CVSD) up to December 31, 2017.
33Statistics Canada, Catalogue no. 82-003-X • Health Reports, Vol. 31, no. 3, pp. 27-38, June 2020Social isolation and mortality among Canadian seniors • Research Article
Currently many Canadians are experi-encing social isolation as a result of the COVID-19 pandemic; seniors in par-ticular are advised to physically isolate
themselves to reduce the risk of infection. While this study examines associations between social isolation and mortality over a nine-year period, it also points to
the importance of seniors returning to their activities and interactions following the pandemic to prevent the development of long-term social isolation. ■
Notes: For men, the model controlled for age, smoking (never smoked versus current or former smoker) and physical activity on health status, education and marital status (married or not). The beta values represent the effect of being socially isolated on survival time. Significant paths are indicated by solid lines.Source: 2008/2009 Canadian Community Health Survey-Healthy Aging (CCHS-HA) linked to Canadian Vital Statistics Database (CVSD) up to December 31, 2017.
Figure 1 Summary of structural equation modelling between social isolation measures and selected characteristics at baseline (2008 to 2009) and mortality (2008 to 2017), by sex, household population aged 65 or older, Canada excluding territories
Men
Women
Low participation → mortalityβ = -0.29 (-0.43 to -0.15), p < 0.0001
Path: Low participation → health status → mortalityβ = -0.04 (-0.06 to -0.01), p = 0.001
Low participation → health statusβ = -0.22 (-0.32 to -0.13), p < 0.0001 Health status → mortality
β = 0.16 (0.10 to 0.21), p < 0.0001
Subjective isolation → health statusβ = -0.45 (-0.59 to -0.31), p < 0.0001 Path: Subjective isolation → health status → mortality
β = -0.07 (-0.10 to -0.04), p < 0.0001
Subjective isolation → mortality (NS)β = 0.02 (-0.18 to 0.23), p = 0.81
Low participation
Health statusMortality
(survival time)
Subjective isolation
Low participation → mortalityβ = -0.33 (-0.43 to -0.22), p < 0.0001
Path: Low participation → health status → mortalityβ = -0.06 (-0.08 to -0.04), p < 0.0001
Low participation → health statusβ = -0.41 (-0.52 to -0.30), p < 0.0001 Health status → mortality
β = 0.14 (0.10 to 0.18), p < 0.0001
Subjective isolation → health statusβ = -0.56 (-0.68 to -0.44), p < 0.0001 Path: Subjective isolation → health status → mortality
β = -0.08 (-0.10 to -0.05), p < 0.0001
Subjective isolation → mortality (NS)β = -0.06 (-0.19 to 0.08), p = 0.39
Low participation
Health statusMortality
(survival time)
Subjective isolation
34 Health Reports, Vol. 31, no. 3, pp. 27-38, June 2020 • Statistics Canada, Catalogue no. 82-003-XSocial isolation and mortality among Canadian seniors • Research Article

AcknowledgementsStatistics Canada thanks all partici-pants for their input and advice during the development of the 2008/2009 CCHS–HA. The survey content was developed by the Health Statistics
Division at Statistics Canada in consul-tation with Health Canada, the Public Health Agency of Canada, and experts conducting the Canadian Longitudinal Study on Aging (CLSA), a major initia-tive of the Canadian Institutes of Health
Research. Consultations included stake-holders from Human Resources and Social Development Canada and prov-incial and territorial health ministries. The addition of 5,000 respondents aged 45 to 54 was funded by the CLSA.
35Statistics Canada, Catalogue no. 82-003-X • Health Reports, Vol. 31, no. 3, pp. 27-38, June 2020Social isolation and mortality among Canadian seniors • Research Article
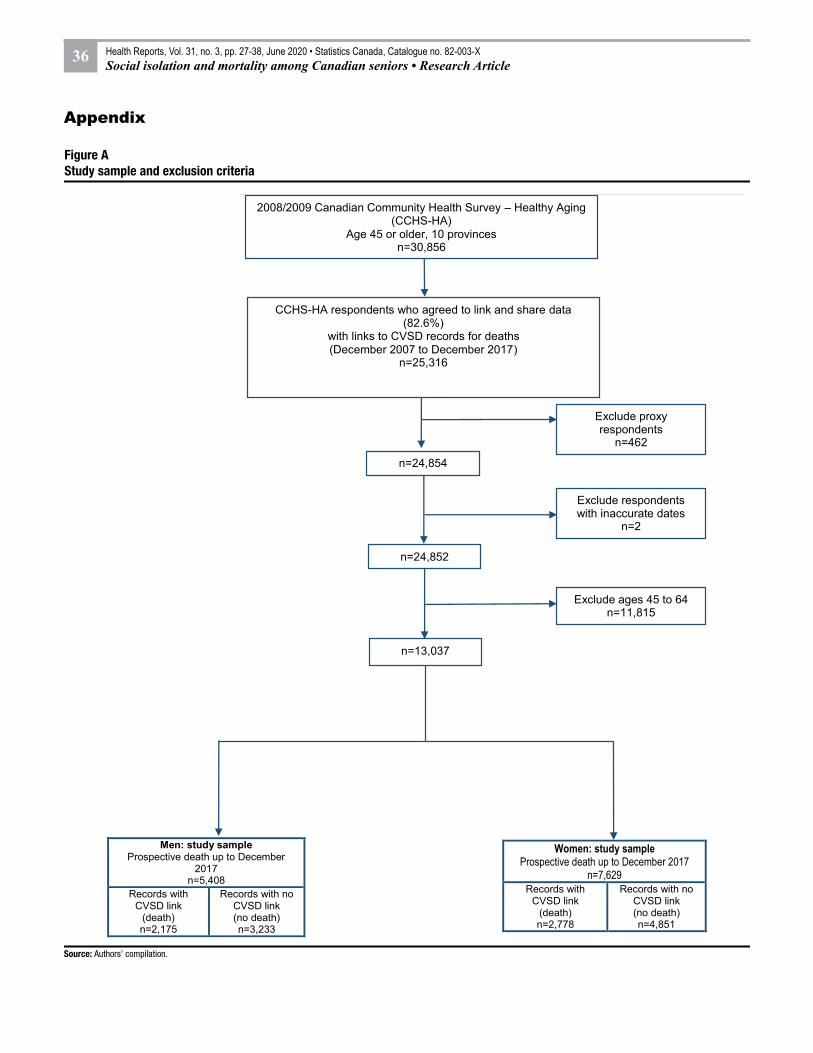
Source: Authors’ compilation.
Figure A Study sample and exclusion criteria
Women: study sampleProspective death up to December 2017
n=7,629Records with
CVSD link (death)n=2,778
Records with no CVSD link (no death)n=4,851
Men: study sampleProspective death up to December
2017n=5,408
Records with CVSD link
(death)n=2,175
Records with no CVSD link (no death)n=3,233
2008/2009 Canadian Community Health Survey – Healthy Aging (CCHS-HA)
Age 45 or older, 10 provincesn=30,856
CCHS-HA respondents who agreed to link and share data (82.6%)
with links to CVSD records for deaths(December 2007 to December 2017)
n=25,316
Exclude proxy respondents
n=462
n=24,854
Exclude ages 45 to 64n=11,815
n=13,037
Exclude respondents with inaccurate dates
n=2
n=24,852
Appendix
36 Health Reports, Vol. 31, no. 3, pp. 27-38, June 2020 • Statistics Canada, Catalogue no. 82-003-XSocial isolation and mortality among Canadian seniors • Research Article

References1. HM Government. A connected society:
a strategy for tackling loneliness. London: Department for Digital, Culture, Media and Sport, 2018. Available at: https://assets.publishing.service.gov.uk/government/uploads/system/uploads/attachment_data/file/750909/6.4882_DCMS_Loneliness_Strategy_web_Update.pdf
2. World Health Organization (WHO). World Report on Ageing and Health; 2015. Available at: https://apps.who.int/iris/handle/10665/186463
3. Holt-Lunstad J, Smith TB, Layton JB. Social relationships and mortality risk: A meta-analytic review. PLoS Medicine 2010; 7(7): e1000316. Doi:10.1371/journal.pmed.1000316.
4. Nyqvist F, Pape B, Pellfolk T, et al. Structural and cognitive aspects of social capital and all-cause mortality: A meta-analysis of cohort studies. Social Indicators Research 2014; 116(2): 545-566.
5. Rico-Uribe LA, Caballero FF, Martín- María N, et al. Association of loneliness with all-cause mortality: A meta-analysis. PLOS One 2018; 13(1): e0190033.
6. Shor E, Roelfs DJ. Social contact frequency and all-cause mortality: A meta-analysis and meta-regression. Social Science & Medicine 2015; 128: 76-86.
7. Leigh-Hunt N, Bagguley D, Bash K, et al. An overview of systematic reviews on the public health consequences of social isolation and loneliness. Public Health 2017; 152: 157-171.
8. Pantell M, Rehkopf D, Jutte D, Syme L, Balmes J, Adler N. Social isolation: A predictor of mortality comparable to traditional risk factors. American Journal of Public Health 2013; 103(11): 2056-2062.
9. Community Development Halton (CDH). Seniors: Loneliness and Social Isolation. 2016. Available at: https://cdhalton.ca/2016/03/31/seniors-loneliness-and-social-isolation/
10. Andrew, M; Keefe, J. Social vulnerability among older adults: A social ecology perspective from the National Population Health Survey of Canada. BMC Geriatrics 2014; 14(90):1–14.
11. Keefe K, Andrew M, Fancey P, Hall M. Final Report: A Profile of Social Isolation in Canada, 2006. Available at: https://www.health.gov.bc.ca/library/publications/year/2006/keefe_social_isolation_final_report_may_2006.pdf
12. Bryant T, Brown I, Cogan T, et al. What do Canadian seniors say supports their quality of life? Canadian Journal of Public Health 2004; 95(4):299-303.
13. Anderson GO, Thayer CE. Loneliness and social connections: A national survey of adults 45 and older. AARP Research and GfK Custom Research, Inc. 2018. DOI: doi.org/10.26419/res.00246.001
14. de Jong Gierveld J. A review of loneliness: concept and definitions, determinants and consequences. Reviews in Clinical Gerontology 1998; 8: 73-8.
15. Berkman L, Syme S. Social networks, host resistance, and mortality: a nine-year follow-up study of Alameda county residents. American Journal of Epidemiology 1979; 109(2):186-204. DOI: 10.1093/aje/kwx103
16. Holt-Lunstad J, Smith TB, Baker M, et al. Loneliness and social isolation as risk factors for mortality: a meta-analytic review. Perspectives on Psychological Science 2015; 10(2):227-37.
17. Perissinotto CM, Stijacic Cenzer I, Covinsky KE. Loneliness in older persons: A predictor of functional decline and death. Archives of Internal Medicine 2012; 172(14): 1078-1083.
18. Beller J, Wagner A. Loneliness, social isolation, their synergistic interaction, and morality. Health Psychology 2018; 17(39):808-813.
19. Shaw JG, Farid M, Noel-Miller C, et al. Social isolation and Medicare spending: Among older adults, objective social isolation increases expenditures while loneliness does not. Journal of Aging and Health 2017; 29(7): 1119-1143.
20. Steptoe A, Shankar A, Demakakos, Wardle J. Social isolation, loneliness, and all-cause mortality in older men and women. Proceedings of the National Academy of Sciences 2013; 110 (15): 5797–5801
21. Ellwardt L, van Tilburg T, Aartsen M et al. Personal networks and mortality risk in older adults: A twenty-year longitudinal study. PLOS One 2015; 10(3):e0116731.
22. House J, Robbins C, Metzner H. The association of social relationship and activities with mortality: prospective evidence from the Tecumseh Community Health Study. American Journal of Epidemiology 1982; 116(1):123-140.
23. Forster L, Stoller E. The impact of social support on mortality: a seven-year follow-up of older men and women. Journal of Applied Gerontology 1992; 11(2):173-186.
24. Tilvis RS, Laitala V, Routasalo PR, Pitkälä KH. Suffering from loneliness indicates significant mortality risk of older people. Journal of Aging Research 2011; Article ID 534781.
25. Sanmartin C, Decady Y, Trudeau R, et al. Linking the Canadian Community Health Survey and the Canadian Mortality Database: An enhanced data source for the study of mortality. Health Reports 2016; 27(12): 10-8.
26. Gilmour H. Social participation and the health and well-being of Canadian seniors. Health Reports 2012; 23(4): 23-32.
27. Hughes ME, Waite LJ, Hawkley LC, Cacioppo JT. A short scale for measuring loneliness in large surveys: Results from two population based studies. Research on Aging 2004; 26(6): 655-672.
28. Diemer MA, Mistry RS, Wadsworth ME, et al. Best practices in conceptualizing and measuring social class in psychological research. Analysis of Social Issues and Public Policy 2013; 13(1): 77-113.
29. Feeny D, Furlong W, Torrance GW et al. Multi-attribute and single-attribute utility functions for the Health Utilities Index Mark 3 system. Medical Care 2002; 40: 113-128.
30. Feng Y, Bernier J, McIntosh C, Orpana H. Validation of disability categories derived from Health Utilities Index Mark 3 scores. Health Reports 2009; 20(2): 43-50.
31. Washburn RA, Smith KW, Jette AM, Janney CA. The Physical Activity Scale for the Elderly (PASE): Development and Evaluation. Journal of Clinical Epidemiology 1993; 46(2):153-162.
32. Rust KF, Rao JNK. Variance estimation for complex surveys using replication techniques. Statistical Methods in Medical Research 1996; 5(3): 283-310.
33. Cornwell EY, Waite LJ. Social Disconnectedness, Perceived Isolation, and Health among Older Adults. Journal of Health and Social Behavior 2009; 50(1): 31-48. DOI: doi.org/10.1177/002214650905000103.
34. Zavaleta D, Samuel K, Mills CT. Measures of social isolation. Social Indicators Research 2017; 131(1): 367-391. DOI: 10.1007/s11205-016-1252-2.
35. Newall NEG, Menec VH. Loneliness and social isolation of older adults: Why it is important to examine these two social aspects together. Journal of Social and Personal Relationships 2017; 36(3): 925-939. DOI: 10.1177/0265407517749045.
36. Wister A, Cosco T, Mitchell B, et al. Development and concurrent validity of a composite social isolation index for older adults using the CLSA. Canadian Journal on Aging 2019; 38(2): 180-192. doi: 10.1017/S0714980818000612.
37Statistics Canada, Catalogue no. 82-003-X • Health Reports, Vol. 31, no. 3, pp. 27-38, June 2020Social isolation and mortality among Canadian seniors • Research Article
37. Zavaleta D, Samuel K, Mills C. Social Isolation: A Conceptual and Measurement Proposal. Oxford Poverty and Human Development Initiative (OPHI), Working Paper no. 67. Oxford, United Kingdom: University of Oxford, 2014.
38. Hawthorne G. Measuring social isolation in older adults: Development and initial validation of the friendship scale. Social Indicators Research 2006; 77(3): 521-548.
39. Hakulinen C, Pulkki-Råback L, Virtanen M, et al. Social isolation and loneliness as risk factors for myocardial infarction, stroke and mortality: UK Biobank cohort study of 479 054 men and women. Heart 2018; 104(18):1536-1542. DOI: 10.1136/heartjnl-2017-312663.
40. Tanskanen J, Anttila T. A prospective study of social isolation, loneliness, and mortality in Finland. American Journal of Public Health 2016; 106(11):2042-2048.
41. Holt-Lunstad J. Why social relationships are important for physical health: A systems approach to understanding and modifying risk and protection. Annual Review of Psychology 2018; 69:437-458.
42. Ramage-Morin PL. Hearing difficulties and feelings of social isolation among Canadians aged 45 or older Health Reports 2016; 27(11): 3-12.
43. Weiss R.S. (1973) Loneliness: The experience of emotional and social isolation. Cambridge, MA: The MIT Press.
44. Cornwell E, Waite LJ. Measuring social isolation among older adults using multiple indicators from the NSHAP study. Journal of Gerontology: Social Sciences 2009; 64B(S1): i38-46.
45. de Jong Gierveld J, van Tilburg TG, Dykstra PA. Loneliness and social isolation. Author version, accepted for publication (2016) in: Vangelisti A, Perlman D, Eds. The Cambridge Handbook of Personal Relationships, second edition. Cambridge: Cambridge University Press. Available at: https://pdfs.semanticscholar.org/67bc/66d9f7d27349de61b163bdddd8b6557d15ae.pdf.
46. Klinenberg E. Social isolation, loneliness, and living alone: Identifying the risks for public health (editorial). American Journal of Public Health 2016; 106(5): 786-786. Follow-up on: Pantell M, Rehkopf D, Jutte D, Syme L, Balmes J, Adler N. Social isolation: A predictor of mortality comparable to traditional risk factors. American Journal of Public Health 2013; 103(11): 2056-2062.
47. Turcotte M. Family caregiving: What are the consequences? Insights on Canadian Society (Catalogue 75-006-X) Ottawa: 2013. Available at: https://www150.statcan.gc.ca/n1/pub/75-006-x/2013001/article/11858-eng.htm.
48. Turner A, Findlay L. Informal caregiving for seniors. Health Reports 2012; 23(3): 33-36.
49. Shields M. Proxy reporting of health information. Health Reports 2004; 15(3): 21-33.
50. Alliance for Healthier Communities. Rx: Community – Social Prescribing in Ontario, Progress Report, 2019. Available at: https://www.allianceon.org/sites/default/files/documents/Rx-Community-Progress-Report-EN-June2019-web.pdf
51. Cao Q, Dabelko-Schoeny HI, White KM, Choi MS. Age-friendly communities and perceived disconnectedness: the role of the built environment and social engagement. Journal of Aging and Health 2019; Jul 26:898264319865421.
52. Levasseur M, Dubois M-F, Généreux M, et al. Capturing how age-friendly communities foster positive health, social participation and health equity: a study protocol of key components and processes that promote population health in aging Canadians. BMC Public Health 2017; 17:502.
53. Mulligan K, Bhatti S, Raymer J, Hsiung S. Social prescribing: Creating pathways towards better health and wellness. Journal of the American Geriatrics Society 2019. DOI: 10.1111/jgs.16249.
54. World Health Organization (WHO). Towards and age-friendly world. Available at https://www.who.int/ageing/age-friendly-world/en/ Accessed April 14 2020.
38 Health Reports, Vol. 31, no. 3, pp. 27-38, June 2020 • Statistics Canada, Catalogue no. 82-003-XSocial isolation and mortality among Canadian seniors • Research Article


