competitiveness, and external economic environment). Considered by marketers and financial
analysts to be the most effective channels among new social media (eMarketer 2011), online user
reviews and blogs provide product- and brand-specific information compared with other popular
forms of social media such as videos and networking sites (Tirunillai and Tellis 2012). Different
5
from conventional online consumer behavior metrics, social media metrics are featured by their
ability to generate, share, and spread information virally, which creates a social contagious effect
largely driving the unprecedented speed of information diffusion through the Internet (Aral and
Walker 2011). Our study also compares the strength of the predictive value of social media
versus conventional online consumer behavior metrics, i.e., web traffic and search volume.
More specifically, this study aims to answer the following research questions:
• Is there a significant predictive relationship between social media, particularly online user
reviews and blogs, and firm equity value?
• Is social media a relatively stronger indicator, compared with conventional online
consumer behavior metrics, of firm equity value?
• What are the dynamics of the relationship between social media and firm equity value?
In the remainder of the paper, we first present the theoretical background and hypotheses in
Section 2. Section 3 introduces the measures and data sample. Section 4 describes the time-series
model. The findings are presented in Section 5. The last section discusses the implications.
2. Theoretical Background and Hypotheses
2.1 Social Media as a Leading Indicator of Firm Equity Value
In the finance literature, the efficient market hypothesis holds that any new information that
changes market expectations will move firm stock price (Fama 1970, Samuelson 1970). No price
movement should be expected unless new information arrives. Finance studies also suggest the
notion of information asymmetry in the stock market (Healy and Palepu 2001, Hirshlerfer and
Teoh 2009). To overcome this asymmetry and better evaluate firm value, investors seek
additional sources of information beyond sales to predict firm equity value. New information that
changes market expectations among investors will have an impact on firm equity value
6
(Samuelson 1965, Fama 1970). Prior to the social media era, information resources include firms’
reports and announcements of sales, new products, R&D, and other assets (Chen et al. 2011,
Tirunillai and Tellis 2012). This source of information is usually only available at a low
frequency such as monthly or quarterly. Social media and web 2.0 applications are
fundamentally changing interactions between consumers and firms (Gallaugher and Ransbotham
2010). With the popularity of social media and the accompanying creation and consumption of
user-generated content, online WOM, such as consumer opinions and user experiences in
product reviews and blogs, is becoming a major source of new information for consumer opinion
and brand performance prospects (Chen and Xie 2008, Chen et al. 2012, Gu et al. 2012).
More specifically, social media would predict firm equity value for several reasons. First,
social media currently accounts for almost a quarter of user online time, ranking well before
gaming and email (Gallaugher and Ransbotham 2010). The heavily decentralized and largely
independent thoughts voiced through social media best represents and amplifies the “wisdom of
the crowd”, which fundamentally contribute to the explosion of social media. There is a great
deal of evidence that customers and investors pay attention to what other users are sharing
thorough various social media communication paths (Chen et al. 2011, Deans 2011). Empirical
evidence also suggests that peer-based advice through social media has increasing influence in
facilitating less informed or undecided consumers for purchasing decisions (Tirunillai and Tellis
2012). Social media may amplify user opinions and actions that would shape product success
and molds investor expectations and prospects of the firm equity value.
Second, social media content is generated and diffused in the widest adopted media, the
Internet, and in an open style, that is, any consumers can read and write reviews and blogs.
Therefore, the content represents and influences a broader consumer population. Moreover, the
7
Internet technologies truthfully and accurately record consumers’ self-revealed content with an
altruismistic intention (Dellarocas and Wood 2008). Social media content in terms of online
product reviews and blog is expected to be less biased and much more acceptable and absorbed
by consumers and investors. As a result, social media metrics of online ratings and blogs may
embody social impressions and represent a significant WOM channel that has high credibility,
trustworthiness, and likeability among customers (Hanson and Kalyanam 2007). Therefore,
social media may enable investors to effectively monitor the firm’s customer sentiment and
brand performance prospects of the firm and predict its future equity value. That is, social media
metrics can have a significant predictive relationship with firm equity value.
Moreover, investment and engagement in social media is part of intangible assets of firms
and organizations. When estimating the value of firms, investors often attempt to incorporate
their intangible assets. Previous detailed investigation of some of these types of assets, especially
the IT-related intangible assets, has found that they are often large in magnitude and have
important productivity benefits (Brynjolfsson et al. 2002). Stock market valuation of firms has
been increasingly influenced by the growing application of IT and the associated investment
(Hall 2000, Matolcsy and Wyatt 2008). The stock market value of a firm that has leveraged the
extensive social media investment and presence should be substantially greater than companies
with little or no social media engagement activity (Brynjolfsson et al. 2002, Wyatt 2005). Thus,
H1: Social media metrics, online product reviews and blogs in particular, have a
significant predictive relationship with firm equity value.
2.2 Social Media as a Stronger Indicator in Predicting Firm Equity Value Compared with
Conventional Online Consumer Behavior Metrics
8
Before the emergence of Web 2.0 social media applications, online consumers are largely
involved in browsing firm and product webpages and exploring information in search engines
and platforms. The interactions between consumers to consumers and consumers to firms are
limited to either mass communication (e.g., web advertising) or asynchronous media (e.g., email)
(Gallaugher and Ransbotham 2010). Individual consumers have limited ability to observe or
influence other consumers’ purchasing and investing decisions. Web traffic and the Internet
search metrics are conventional measurements of online consumer behavior in both industry
applications and academic research. Website visits (traffic) refers to the number of visitors to a
website and the number of web pages they visit or browse. When users search product and
service information on a search engine such as Google, attention is paid to the brand and
company, and brand exposure is stimulated regardless of the final decision of buying or not
(Davenport and Beck 2001). Prior studies suggest that conventional consumer behavior metrics
such as web visits directly gauge the popularity of a company’s website (Moe 2003). Financial
accounting research reports that web visits are related to firm value (Trueman et al. 2000,
Demers and Lev 2001, Dewan et al. 2002), though not in Gupta et al. (2004). Regarding Internet
search, Da et al. (2011) provide evidence that search frequency of stock tickers in Google is a
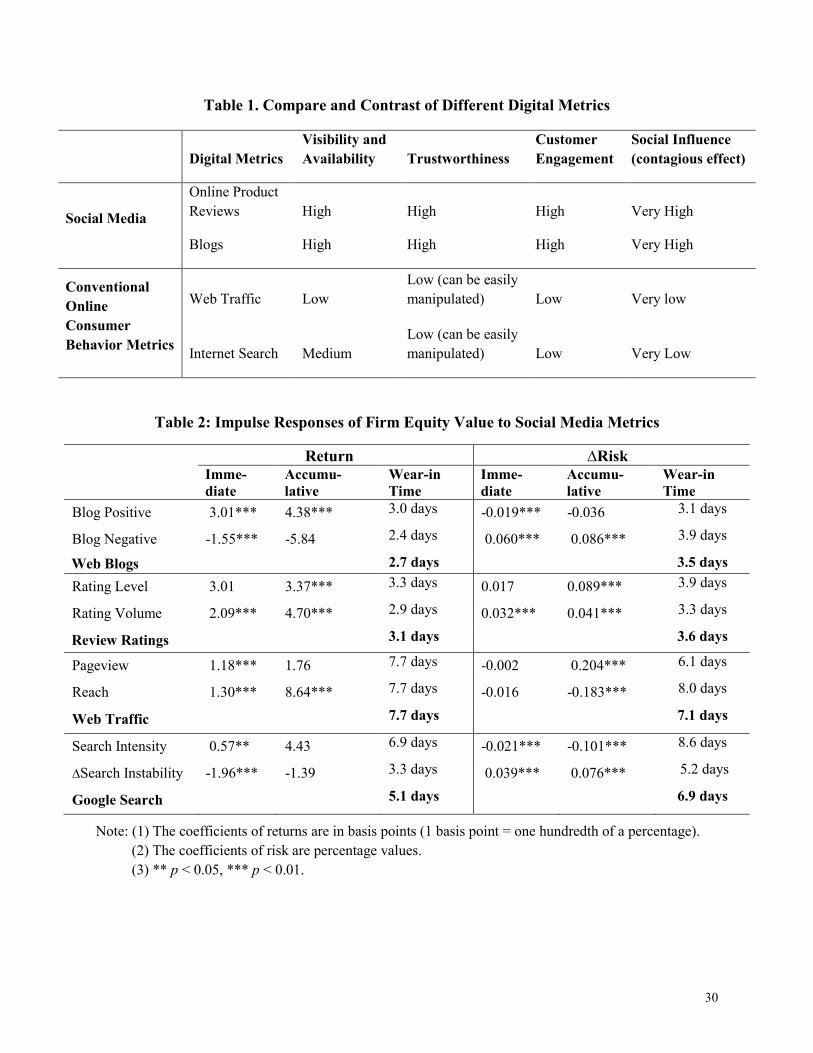
strong indicator of stock trading by retail investors. Table 1 compares and contrasts the social
media and conventional consumer behavior metrics.
--------Table 1 about Here-------
We expect social media metrics have a stronger predictive relationship with firm equity value
than convention metrics for several reasons. Social media is more socially “contagious” than web
traffic and search. Blogs and reviews are more visible and available. They appear on the websites
and are shared to the public or in a community, thus generating external WOM effects, whereas
9
web traffic and search tend not to be communicated, exchanged, or spread directly among users.
Finance literature has recognized that social influence is central to how information is
transmitted and that information contagion should play an important role in examining investor
behavior (Hirshleifer and Teoh 2009). Such contagion often leads to the herd behavior (Duan et
al. 2009).1 Herd behavior could be particularly prominent on the Internet, because social media’s
broadcast and interactions provide much more information about other users’ choices and
preferences. Facing vast amounts of information on the Web and virtually unlimited choices of
products, online shoppers and investors often find it could be the most efficient and rational way
to follow others’ choices and suggestions, especially facilitated by the viral spread of social
media connections (Hirshleifer and Teoh 2009).
Further, social media represents a higher degree of customer engagement and a deeper level
of connections with the brand and firm, more so than traffic and search metrics. Social media
currently accounts for the large majority of user online time (Gallaugher and Ransbotham 2010).
Consumers who spend considerable more time and effort in social media interactions, i.e.,
writing reviews and posting blogs, are those with higher commitment levels to a brand and
presumably are more loyal consumers and contribute more to the firm’s equity value (Gupta et al.
2004). Hence, social media metrics are expected to have a stronger predictive relationship with
firm equity value than the more conventional metrics.
H2: Social media metrics have a stronger predictive relationship with firm equity value
than the conventional online consumer behavior metrics.
2.3 Dynamics of the Predictive Value of Social Media
1 Herd behavior may lead to suboptimal social allocation (Bikhchandani et al. 1998). Readers are encouraged to consult Hirshleifer and Teoh (2009) for a thorough review of contagious behavior in capital market.
10
Previous marketing literature has shown the dynamics of stock market responses to WOM
and online user-generated content. Luo (2007, 2009) uncovers the short- and long-term effects of
WOM on cash flows and stock prices. Tirunillai and Tellis (2012) show that negative user
reviews have a significant relationship with stock returns with “wear-in” effect, which is defined
as how long time it takes before the stock market response of social media reaches the peak point.
Consistent with this line of research, we expect that the predictive relationship between social
media and firm equity value may demonstrate significant dynamics, more so than conventional
online consumer behavior metrics. This is because information transmits and diffuses at the
unprecedented speed facilitated by the viral spread features (wide subscription, wide access, and
wide reach) of social media channels (Datamonitor 2010). As shown in Table 1, compared with
conventional online consumer behavior metrics, social media metrics have much higher visibility
and availability due to the wide subscription, access, and reach of social media platforms. Social
media content is updated on a daily, even hourly basis and spread virally. Customer attention and
engagement is also higher in social media channels, which accounts for the dominant amount of
user online time.
Moreover, social media content can be voted, linked, reproduced, broadcast and spread
virally, hence creating richness of information and speed of diffusion not matched by
conventional online behavior metrics (Aggarwal et al. 2011, Gu et al. 2011). Social media
content travels much faster and can be easily and instantly obtained by investors at the highly
frequent temporal level, which makes the “wear-in” effect of stock market response to social
media much shorter compared with the effect of conventional website browsing and the Internet
search. Thus, we propose the following hypothesis.
11
H3: Social media metrics have a shorter “wear-in” effect in predicting firm equity value
compared with conventional online behavior metrics.
3. Data and Measures
In this study, we selected the computer hardware and software industries for two reasons.
First, as described by Moore’s Law, computing products have experienced rapid technology
advancements and greatly reduced product life cycles. Hence, companies in the computer
industry frequently introduce and promote new products (Goeree 2008). Second, customers of
computer products are more likely to participate in and be influenced by various digital media.
As such, companies in this industry tend to more heavily leverage on social media to engage
customers and promote products online. Indeed, most literature on social media has focused on
one industry. For example, Dellarocas et al. (2007), Liu (2006), and Chintagunta et al. (2009)
examined movies; Forman et al. (2008) and Chevalier and Mayzlin (2006) on books; Dhar and
Chang (2009), and Dewan and and Ramaprasad (2011) on music; Godes and Mayzlin (2004) on
TV; Zhu and Zhang (2010) on video games; and Luo (2009) on airline services.
Within these two industries, we select those firms that are publicly traded (for stock price data
availability), and that serve the consumer markets to ensure the availability of consumer product
reviews. Nine firms which are all major industry leaders satisfy the above criteria. The selected
computer hardware companies (HP, Dell, Acer, Toshiba, Apple, and Sony) are top PC sellers in
the industry with a total of more than 80% of the U.S. market share. The software companies
included (Microsoft, Adobe, and Corel) are also popular consumer software brands.
The daily data were collected from multiple sources (Google search, Alexa, CNET,
Lexis/Nexus, CRSP, COMPUSTAST and Yahoo Finance) during the period of August 1, 2007
12
to July 31, 2009. The merged data set contains 4,518 observations, representing the nine firms
over 505 trading days (Acer has only 478 days of data due to some missing traffic data).
3.1 Data and Measures for Firm Equity Value
Prior studies in information systems, marketing, and finance (Dewan and Ren 2007, Luo
2009, Srinivasan and Hanssens 2009) suggest the two most common measures of firm value:
stock return and risk. Return or abnormal return is firm equity value beyond what is expected by
the average stock market derived from the extended Fama-French Model widely used in finance
(Fama and French 1993, 1996, Carhart 1997). Risk or idiosyncratic risk refers to the
vulnerability or volatility of firm equity value, measured as standard deviation of the residuals of
the extended Fama-French model (Goyal and Santa-Clara 2003, p. 980).
on asset (ROA), industry competitive intensity, Merger and Acquisition (M&A), and economic
crisis.
We control for product quality because it can influence both digital user metrics and firm
value and therefore may introduce endogeneity bias in data analyses. Product quality is
measured by the rating of an unbiased third party -- CNET editors, who conduct independent
industry-standard benchmark tests, assess product specifications and company support polices,
and use their expert judgment to impartially evaluate technology products based on such key
aspects as design, features, performance, service and support (Tellis and Johnson 2007, Duan et
al. 2009). IT-related intangible assets measure the IT investment of those technology firms that
17
can potentially create value in the future, collected from the 10Q forms of firms’ financial reports.
R&D expenditure is measured as research and development expenses (XRDQ) scaled by total
assets from COMPUSTAT. New product announcements (which reflect IT capabilities of the
firm) are collected from the Lexis/Nexis news search. Prior marketing study has also used
Lexis/Nexis news search to measure new product announcements (Sood and Tellis 2009). Firm
size is measured by total assets of the firm (variable ATQ). Revenue is the REVTQ variable in the
COMPUSTAT database. Financial leverage is the ratio of long-term book debt (DLTTQ) to total
assets. Liquidity is the current ratio of a firm (LCTQ/ACTQ). Return on assets measures firm
profitability and is calculated as the ratio of a firm’s operating income to its book value of total
assets, which are variables OIBDPQ and ATQ from COMPUSTAT. In addition, industry and
economy conditions are also controlled with variables of competitive intensity and economic
crisis. Competitive intensity is gauged by the Hirschmann-Herfindahl index measure of industry
concentration, which is the sum of squared market shares of firms in the industry derived from
sales revenue, 2
1
N
ii
s=∑ , where is is the market share of firm i in each of the computer hardware and
software industries (Hou and Robinson 2006). To match those quarterly financial variables with
our daily social media and digital user metrics, we follow Hamilton (1994), Statman et al. (2006)
and Luo (2009) by adopting the VAR-bootstrapping scheme with 5000 simulated databases to
generate the values of those variables for each observed day.
Also, we construct a dummy variable events to control the M&A and new product
announcements (from Lexis/Nexis news search), and a dummy variable economic crisis
indicated by the financial market crash in October 2008.
4. VARX Model Specification
4.1 Rationale for VARX
18
We employ a time-series technique, namely, vector-autoregressive model with exogenous
covariates (VARX). This modeling approach allows us to capture dynamic interactions and
feedback effects (Dekimpe and Hanssens 1999, Luo 2009, Adomavicius et al. 2012). For our
study, VARX has several advantages over alternative models. Specifically, it can track the short-
term (immediate) and long-term (cumulative) value of social media metrics in predicting firm
equity value (direct effects). In addition, it accounts for biases such as endogeneity, auto
correlations, and reversed causality. The endogenous treatment in VARX model implies that
search, traffic, ratings, and blogs are explained by both past variables of themselves
(autoregressive carry-over effects) and past variables of each other (cross effects). VARX
models also capture complex feedback loops that may include the reversed impact of firm equity
value on future social media metrics (feedback effects). For example, an increase in firm stock
return can raise the firm’s brand recognition and interests so that consumers are more likely to
blog its products and brand experience information. Thus, VARX can model complex chained
effects in a full cycle, uncovering the full predictive value of user metrics. Our empirical time-
series analysis proceeds in the following steps that are applied to each firm separately
(Srinivasan et al. 2010). Recently, VAR models have been adopted by information systems
researchers (Adomavicius et al. 2012).
4.2 Step 1: Model Specification on the Predictive Value of Social Media Metrics
We estimate a ten-equation VARX model, where endogenous variables are two firm equity
value metrics (return and risk), two online product rating variables (level and volume), two blog
sentiment variables (positive and negative), two Google search variables (intensity and volatility),
and two web traffic variables (pageview per user and reach). We also have eleven exogenous
control variables: product quality, R&D, IT-related intangible assets, new product
19
announcements, firm size, revenue, financial leverage, liquidity, ROA, M&A, industry
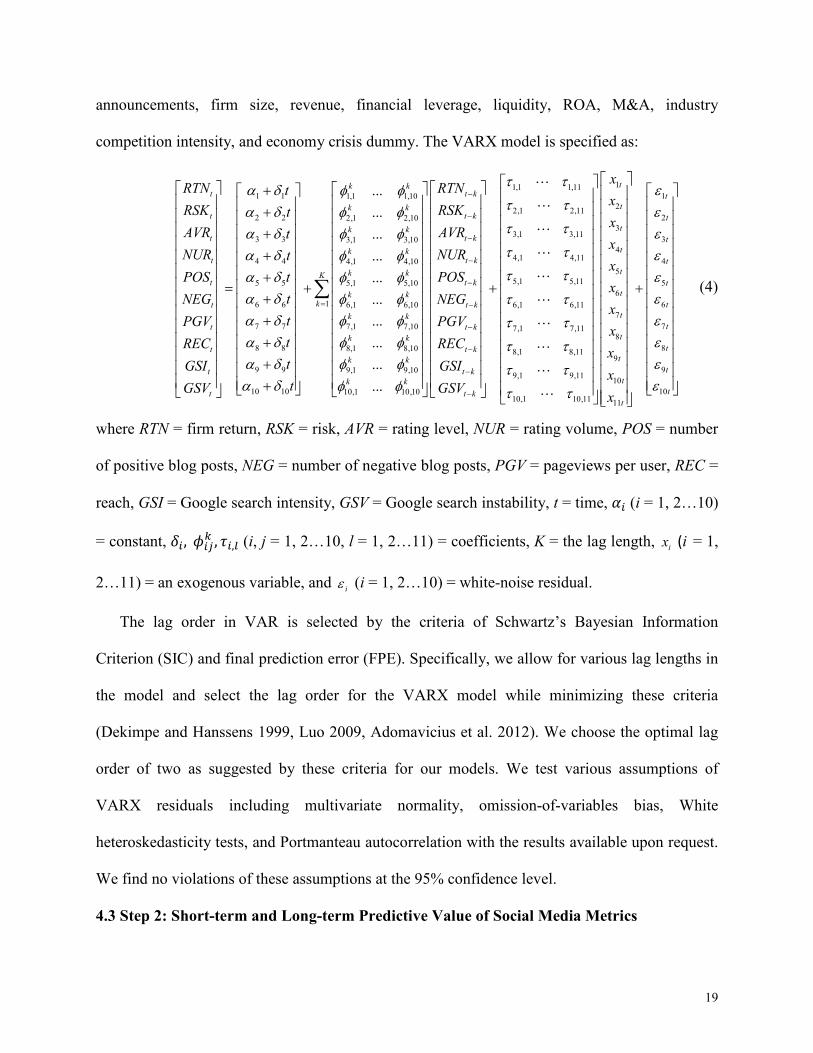
competition intensity, and economy crisis dummy. The VARX model is specified as:
1 1 1,1 1,10
2 2 2,1 2,10
3 3 3,1
4 4
5 5
6 6
7 7
8 8
9 9
10 10
...
...
k kt
k kt
t
t
t
t
t
t
t
t
RTN tRSK tAVR tNUR tPOS t
tNEGtPGVtRECtGSItGSV
α δ φ φα δ φ φα δ φα δα δα δα δα δα δα δ
+ + +
+ + = +
+ + + + +
3,10
4,1 4,10
5,1 5,10
1 6,1 6,10
7,1 7,10
8,1 8,10
9,1 9,10
10,1 10,10
...
...
...
...
...
...
...
...
t k
t k
k kt k
k kt k
k kKt k
k kk t k
k kt k
k kt k
k kt
k k
RTN
RSK
AVR
NUR
POS
NEG
PGV
REC
GSI
φφ φφ φφ φφ φφ φφ φφ φ
−
−
−
−
−
= −
−
−
−
∑
11,1 1,11
22,1 2,11
33,1 3,11
44,1 4,11
55,1 5,11
66,1 6,11
7
7,1 7,118
8,1 8,11
9,1 9,11
10,1 10,11
t
t
t
t
t
t
t
t
k
t k
x
x
x
x
x
x
x
x
GSV
τ τ
τ τ
τ τ
τ τ
τ τ
τ τ
τ τ
τ τ
τ τ
τ τ−
+
L
L
L
L
L
L
L
L
L
L
1
2
3
4
5
6
7
89
910
1011
t
t
t
t
t
t
t
tt
tt
tt
x
x
x
εεεεεεεεεε
+
(4)
where RTN = firm return, RSK = risk, AVR = rating level, NUR = rating volume, POS = number
of positive blog posts, NEG = number of negative blog posts, PGV = pageviews per user, REC =
reach, GSI = Google search intensity, GSV = Google search instability, t = time, ,� (i = 1, 2…10)
= constant, 3�� �4�56 � 7��8 (i, j = 1, 2…10, l = 1, 2…11) = coefficients, K = the lag length, ix (i = 1,
2…11) = an exogenous variable, and iε (i = 1, 2…10) = white-noise residual.
The lag order in VAR is selected by the criteria of Schwartz’s Bayesian Information
Criterion (SIC) and final prediction error (FPE). Specifically, we allow for various lag lengths in
the model and select the lag order for the VARX model while minimizing these criteria
(Dekimpe and Hanssens 1999, Luo 2009, Adomavicius et al. 2012). We choose the optimal lag
order of two as suggested by these criteria for our models. We test various assumptions of
VARX residuals including multivariate normality, omission-of-variables bias, White
heteroskedasticity tests, and Portmanteau autocorrelation with the results available upon request.
We find no violations of these assumptions at the 95% confidence level.
4.3 Step 2: Short-term and Long-term Predictive Value of Social Media Metrics
20
In the next step, we use the estimated parameters of the full VARX model kijφ to generate the
Generalized Impulse Response Functions (GIRFs), ( )ij tψ , which is the net result of a one-unit
shock to digital user metrics i on firm value metric j at time t (Dekimpe and Hanssens 1999).
Standard errors are derived by simulating the fitted VARX model by Monte Carlo simulation
with 1,000 runs to test the statistical significance of parameters (p = 0.05). Note that because the
white-noise residuals can still be contemporaneously correlated and thus generate misleading
results, we apply an orthogonal transformation to correct this bias (Luo 2009).
We derive the following summary statistics from each GIRF: (1) short-term, immediate
predictive value; (2) long-term, total cumulative value that combines all effects across “dust-
settling” periods; (3) dynamics as measured by wear-in time, that is, the lag number of periods
before peak predictive relationship is reached. We obtain wear-in time of each user metric as
days with the largest (in absolute value) impulse response coefficients (Pauwels 2004). To report
the findings, we average results across firms as in Srinivasan et al. (2010).
4.4 Step 3: Variance of Return and Risk Explained by Digital User Metrics
Based on the VARX parameters, we derive Generalized Forecast Error Variance
Decomposition (GFEVD) estimates to examine which user metric explain more variance of firm
equity value than the others in a systematic model. Like a dynamic R2, GFEVD gauges the
relative power over time of shocks initiated by each metric in explaining the variance of firm
value, without assuming a causal ordering (Dekimpe and Hanssens 1999). GFEVD estimates are
derived from:
2
0
2
0 0
( ( ))( ) , , 1,..., .
( ( ))
t
ijk
ij t m
ijk j
kt i j m
t
ψθ
ψ
=
= =
= =∑
∑∑ (5)
21
GFEVD attributes 100% of the forecast error variance in firm equity value to all endogenous
variables. That is, it estimates the extent to which social media and conventional online behavior
metrics explain the variance of firm value. This relative importance of endogenous variables is
established based on GFEVD values at twenty days, which reduces sensitivity to short-term
fluctuations. To establish the statistical significance of GFEVD estimates (p = 0.05), we obtain
standard errors using Monte Carlo simulations with 1,000 runs.
5. Findings
5.1 Test for Stationarity in Time Series
The process of estimating VARX models begins with unit-root tests to check whether
variables are evolving or stationary. Stationarity implies that, although a shock to endogenous
variables in VARX can cause fluctuations over time, its effects diminish ultimately. Then,
endogenous variables revert back to the deterministic (mean + trend + seasonality) pattern
without a permanent regime lift. The variance of stationary variables is finite and time-invariant.
We conduct augmented Dickey-Fuller (ADF) tests to check stationarity (Dekimpe and Hanssens
1999). The ADF tests of almost all metrics across firms are less than the critical value -2.89 and
can reject the null hypothesis of a unit root with a 95% confidence level except for seven firms’
risk metric series and four firms’ search instability series. We use the first difference of the series
of those two metrics. The ADF test results for the corrected data series range from -187.39 to -
2.93, suggesting that the series do not cointegrate in equilibrium (Hamilton 1994).
5.2 Test for Granger Causality
We conduct Granger Causality test following Tirunillai and Tellis (2011). Results suggest
that social media metrics have significant temporal-based causal relationships with firm equity
value. Almost all social media metrics significantly “Granger cause” stock return and risk:
22
positive and negative blogs, and rating volume “Granger cause” firm stock return (p = 0.03, 0.04
and 0.03, respectively), and negative blog, rating level and rating volume “Granger cause” stock
risk (p = 0.03, 0.04 and 0.04, respectively). The reverse feedback from return and risk to the
social media metrics is not significant (median p value ranging from 0.08 to 0.29). These results
confirm the temporal predictive relationship between social media metrics and firm equity value,
providing initial evidence for H1.
Regarding conventional online behavior metrics, pageview per user is the only one behavior
metric that significantly “Granger causes” stock return and risk (p = 0.04 and 0.05, respectively).
The reverse feedback from stock return to traffic and search is not significant but stock risk is
found to significantly “Granger cause” search intensity, pageview per user and reach (p = 0.03,
0.05 and 0.05, respectively).
5.3 Short-term and Long-term Predictive Value of Social Media Metrics
Table 2 reports the immediate and cumulative impulsive response elasticities, as well as the
wear-in time from the VARX results. The magnitude of elasticity results reflects the change in
basis point (1 basis point = one hundredth of a percentage) of stock return or percentage of stock
risk in response to one unit shock in a social media or conventional online behavior metric (1%
shock in traffic). These results largely support the hypotheses in this study. Next, we present the
details.
------ Table 2 about Here ------
Web Blog
As shown in Table 2, social media metrics in terms of positive blog posts show a significant
positive predictive relationship with firm return (3.01 and 4.38 basis points respectively, p<0.01)
for both the short- and long- term and significantly reduce short-term risk of the firm (-0.019
percent, p<0.01). That is, an increase in positive blog posts will predict a boost of daily stock
23
return up by 0.0003 and stock intra-day risk down by 0.00019 in the short term. Negative blog
posts are negatively related to firm short-term return (-1.55 basis points, p<0.01) and predict an
increase of intra-day risk for both the short and long term (0.06 and 0.086 percent, respectively,
p<0.01). Thus, the results largely suggest that blog posts are significant leading indicator of firm
equity value.
Online Product Ratings
In addition, results in Table 2 suggest that the rating level has a significant long-term
relationship with firm return (3.37 basis points, p<0.01), though insignificant in the immediate.
This suggests that a change in rating is associated with an increase of firm return in the long run.
The volume of rating shows a strong positive predictive value with returns in both the short-term
(2.09 basis points, p<0.01) and long-term (4.70 basis points, p<0.01). As such, these results
suggest strong empirical evidence for H1, that social media metrics, online product reviews and
blogs in particular, have a significant predictive relationship with firm equity value.
Interestingly, the findings suggest that though predicting a boost in stock returns, review
ratings also have some dark effects, in that the rating level is associated with a higher stock risk
(0.089 percent, p<0.1) in the long run, and the volume of ratings is significantly (p<0.01)
associated with stock risks in both short- and long- term.
Search and Traffic
As shown in Table 2, all search and web traffic metrics can (at least p<0.05) predict firm
return in both short- and long-term, which conforms to the theory and literature. For example,
more Google searches are associated with higher stock returns (Da et al. 2011). Also, more
pageviews per user and/or wider reach of the firm website predict higher firm returns.
5.4 Dynamics of the Predictive Value of Social Media Metrics
24
We recall that wear-in time measures the time it takes for a shock in each social media to
reach the peak of the predictive relationship with firm equity value. We obtain the wear-in time
results from the impulse response functions (Figure 1 shows the impulse response functions of
some social media metrics for Hewlett-Packard). The results reported in Table 2 show that social
media metrics (blogs and reviews) demonstrate significantly shorter wear-in time for both firm
stock return (parametric F = 11.02 and non-parametric Kruskal-Wallis = 7.09, both p < 0.01) and
risk (F = 32.25 and Kruskal-Wallis = 10.98, both p < 0.001). As for firm return, negative blogs
have the shortest wear-in time (2.4 days), followed by rating volume (2.9 days), while both
traffic metrics have the longest wear-in time (7.7 days). These results consistently support H3, in
that social media metrics have a shorter “wear-in” effect in predicting firm equity value
compared with conventional online behavior metrics.
------ Figure 1 about Here ------
5.5 Relative Strength of the Predictive Value of Social Media versus Conventional Online
Consumer Behavior Metrics
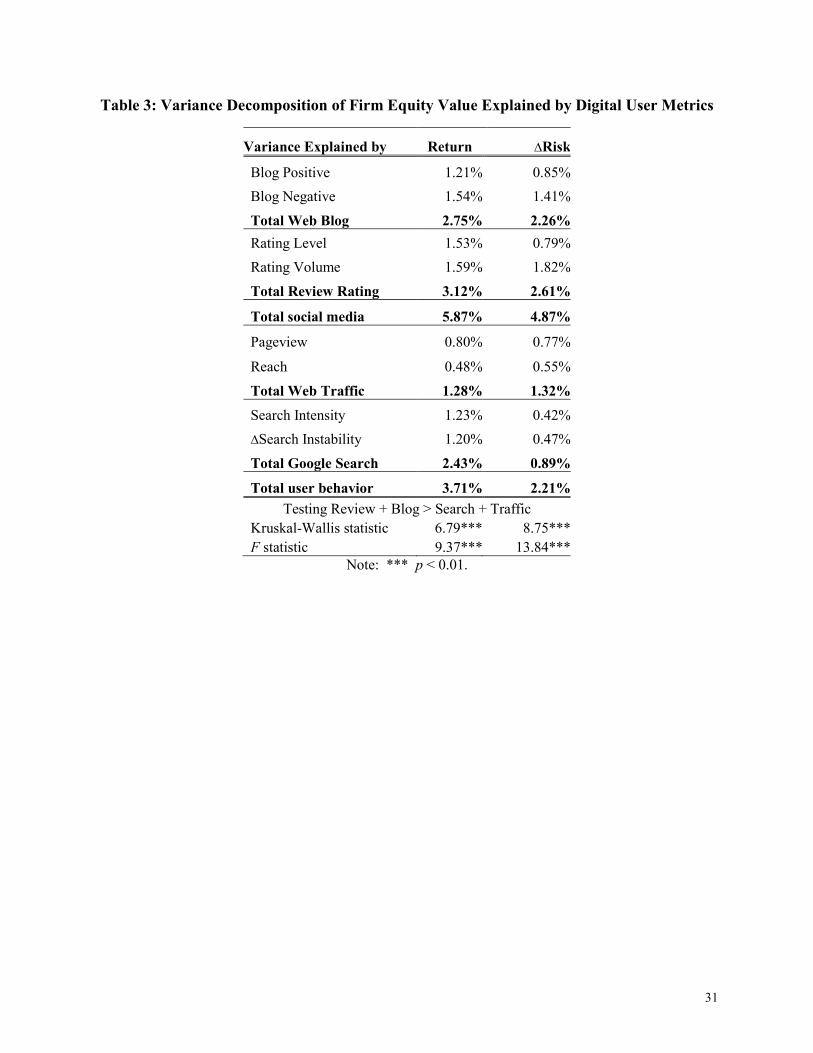
The variance decomposition of GFEVD results in Table 3 provides the relative power of each
metric in explaining the variance of firm equity value. All of the metrics explain non-trivial
portions of the variance. The results suggest the order of ratings (3.12%), blogs (2.75%), then
search (2.43%) and traffic (1.28%) in predicting long-term firm return, and the order of rating
(2.61%), blogs (2.26%), then traffic (1.32%) and search (0.89%) in predicting long-term firm
risk. Further, social media metrics account for a significantly greater proportions of the variance
than conventional online behavior metrics (5.87% vs. 3.71% in return and 4.87% vs. 2.21% in
risk, see Table 3). Thus, the findings support our expectation that social media metrics are more
effective in predicting firm return and risk. They contribute to 9.58% and 7.08% of the total
25
explained variance of firm stock return and risk, respectively. These differences are statistically
significant according to both F statistics and Kruskal-Wallis statistics as shown in Table 3. Thus,
the data support our H2, suggesting that social media metrics have a stronger predictive value
than the conventional online consumer behavior metrics.
------ Table 3 about Here ------
6. Discussion
As social media grows rapidly in terms of popularity and consumer adoption, recent business
practices now seek to transform businesses with social media and capitalize the financial value of
social media. This study intends to investigate the predictive power of social media and the
dynamics of the predictive relationship between social media and firm equity value. Our results
indicate that social media is a leading indicator of firm equity value (supported by Granger
Causality tests) and has a stronger predictive value than conventional online consumer behavior
metrics. In particular, our findings suggest that product reviews have the highest predictive
power for firm returns and risks. Google search and web traffic have significant but only
moderate predictive value. Our results also show that social media metrics have shorter “wear-in”
time than web traffic and search. Negative blogs have the shortest wear-in time in predicting firm
equity value.
Theory Implications
This research contributes to literature in multiple disciplines and has important implications
for academic researchers. It is the first to reveal empirical knowledge concerning social media as
a leading indicator in predicting business financial value. Our results divulge new insights on the
predictive value of social media metrics beyond sales. The strong predictive relationship between
social media and firm equity value demonstrates that firms should no longer treat social media as
26
a cost. Rather, social media metrics can be a significant leading indicator of firm equity value,
justifying the importance of investing in social media and new IT initiatives to transform
organization and create shareholder value.
In this sense, our study adds to the IS literature in studying IT productivity and the impact of
IT intangible assets (Hall 2000, Brynjolfsson et al. 2002, Gao and Hitt 2012) on business
performance and transformation. Social media investment is an indispensable asset for firms and
organizations not only for short-term performances, but also for long-term budget allocations for
business strategies and IT support in a social media platform. Our findings suggest that social
media, as a growing indispensable part of IT asset, has important productivity benefits inherently
connected to firm equity value. Our results suggest that social media investments pay off best in
terms of firm future return if focused on increasing product review ratings and reducing variation
of the ratings. Also, in terms of risk management, social media investments pay off best if
focused on increasing positive blogs and reducing both neutral and negative blogs. While
certainly not abandoning investments in online search and traffic, companies should be aware of
the relative larger power of social media in predicting firm future equity value. Thus, managers
must better prioritize and allocate appropriately the IT budgets among various social media
platforms according to their abilities to predict and affect business financial value.
In addition, some finance and marketing studies have shown that web traffic and search have
a significant relationship with firm financial performance (e.g., Moe and Fader 2004, Da et al.
2009). We agree with them and extend this stream of research by showing that social media is a
much stronger indicator of firm financial return than the simple “eyeball effect”. This is
important because social media provides managers a better measurement of customer attention
and product performance as well as prospects of firm future equity value in the social digital age.
27
Indeed, this is the first study to show the association between web blogs and business stock
performance across the IS, marketing, and finance disciplines. Positive blog posts can increase
trust, affection, and advocacy of the consumers or investors and therefore result in more demand,
higher firm value, and lower risk. Negative blog posts can damage the reputation of the firm and
are negatively related to firm performance. An interesting finding is that positive impacts are
relatively more enduring and negative impacts are quick. Therefore, firms should monitor and
respond quickly to negative blog posts by taking corrective actions to mitigate the potential
adverse effects on future performance. For example, Kryptonite announced a lock exchange plan
five business days after a video started circulating in the blogosphere about opening a Kryptonite
bike lock with a Bic-pen in September 2004.
This study develops time-series models that can gauge the long-term, accumulative value and,
therefore, avoid the danger of underestimating the power of digital user metrics because solely
focusing on short-term value would neglect the enduring and buzz effects of social media. Web
analytics and social media research should pay more attention to time-series models and long-
term, cumulative effects. In addition, we benchmark with shareholder value-based business
performance because shareholder value is the ultimate concern of the firm and is available at the
daily level, which allows for finer-grained analyses for managers and stock investors.
Managerial Implications
This research also has important implications for managers. The new social media platforms
allow managers to drive personalized relations with individual users for higher firm equity value.
Some managers may still hold mixed views of using new media to transform organizations and
are quite puzzled because they do not know which online media strategy pays off the highest or
the lowest. It is noted that “many corporations took the plunge into social media and now are
28
sitting on loads of uninstalled software” with wasted IT resources (Baker 2009, p. 57). Our
results suggest that social media are relevant to firm equity value, because social media metrics
can predict firm return and risk in the short and long runs.
Analyzing the immediate time effects of social media will alert managers to the urgency of
the predictive relationships so as to prioritize responsive actions. As noted, wear-in time
measures the number of days before peak impact is reached according to the VARX models. As
reported in Table 2, the dynamic wear-in times have several implications for managers. First,
wear-in times can provide an early warning signal to managers about future damages to firm
value. Because negative blog posts have the shortest wear-in time (2.4 days) in predicting firm
return, when observing a surge in the leading indicator of negative blog posts, managers should
pull the plug and take immediate actions in reversing the negative blogs so as to mitigate the
potential damage on future performance (i.e., in cases of recent Southwest Airlines flight
incidents and Toyota car recalls).
Second, the wear-in times indicate how soon or how late a shock in each user metric will
reach the peak of the predictive value. Managers can act upon the results to better allocate
resources. For example, the wear-in time of traffic measures for firm return responses is the
longest --7.7 days. Thus, to boost firm return, managers should allocate more IT resources for
other metrics such as ratings, blogs, or search queries. On the same token, to more quickly
reduce firm risk, managers should shift more IT resources for web blogs and review ratings
because they have relatively shorter weak-in times.
In conclusion, this study is an initial step in examining the predictive relationship between
social media and firm equity value. Given the importance of social media in transforming
29
business organizations, we strongly encourage future research to develop more scientific time
series and econometric models to discover more insights into the value of social media.
30
Table 1. Compare and Contrast of Different Digital Metrics
Digital Metrics Visibility and Availability Trustworthiness
Customer Engagement
Social Influence (contagious effect)
Social Media
Online Product Reviews High High High Very High
Blogs High High High Very High
Conventional Online Consumer Behavior Metrics
Web Traffic Low Low (can be easily manipulated) Low Very low
Internet Search Medium Low (can be easily manipulated) Low Very Low
Table 2: Impulse Responses of Firm Equity Value to Social Media Metrics
Return ∆Risk Imme-diate
Accumu-lative
Wear-in Time
Imme-diate
Accumu-lative
Wear-in Time
Blog Positive 3.01*** 4.38*** 3.0 days -0.019*** -0.036 3.1 days
Blog Negative -1.55*** -5.84 2.4 days 0.060*** 0.086*** 3.9 days
Web Blogs 2.7 days 3.5 days
Rating Level 3.01 3.37*** 3.3 days 0.017 0.089*** 3.9 days
Rating Volume 2.09*** 4.70*** 2.9 days 0.032*** 0.041*** 3.3 days
Review Ratings 3.1 days 3.6 days
Pageview 1.18*** 1.76 7.7 days -0.002 0.204*** 6.1 days
Reach 1.30*** 8.64*** 7.7 days -0.016 -0.183*** 8.0 days
Web Traffic 7.7 days 7.1 days
Search Intensity 0.57** 4.43 6.9 days -0.021*** -0.101*** 8.6 days
∆Search Instability -1.96*** -1.39 3.3 days 0.039*** 0.076*** 5.2 days
Google Search 5.1 days 6.9 days
Note: (1) The coefficients of returns are in basis points (1 basis point = one hundredth of a percentage). (2) The coefficients of risk are percentage values. (3) ** p < 0.05, *** p < 0.01.
31
Table 3: Variance Decomposition of Firm Equity Value Explained by Digital User Metrics
Variance Explained by Return ∆Risk
Blog Positive 1.21% 0.85%
Blog Negative 1.54% 1.41%
Total Web Blog 2.75% 2.26%
Rating Level 1.53% 0.79%
Rating Volume 1.59% 1.82%
Total Review Rating 3.12% 2.61%
Total social media 5.87% 4.87%
Pageview 0.80% 0.77%
Reach 0.48% 0.55%
Total Web Traffic 1.28% 1.32%
Search Intensity 1.23% 0.42%
∆Search Instability 1.20% 0.47%
Total Google Search 2.43% 0.89%
Total user behavior 3.71% 2.21%Testing Review + Blog > Search + Traffic
Figure 1: Accumulated Impulse Response Functions of Key Social Media Metrics
-5
-4
-3
-2
-1
01 2 3 4 5 6 7 8 9 10 11 12 13 14 15 16 17 18 19
Basi
s po
ints
Negative blog on stock returns
0
1
2
3
4
5
6
7
1 2 3 4 5 6 7 8 9 10 11 12 13 14 15 16 17 18 19
Basi
s po
ints
Review volume on stock returns
-0.6
-0.5
-0.4
-0.3
-0.2
-0.1
01 2 3 4 5 6 7 8 9 10111213141516171819
Perc
enta
ge
Positive blog on risks
0
0.2
0.4
0.6
0.8
1
1.2
1.4
1 2 3 4 5 6 7 8 9 10 1112 13 1415 1617 18 19
Perc
enta
ge
Rating leve on risks
33
References
Adomavicius, G., J.C. Bockstedt and A Gupta (2012) “Modeling the Dynamics of Innovation in IT Components, Products, and Infrastructure: An Empirical Analysis Using Vector Autoregression,” Information Systems Research 23(2), 397-417.
Aggarwal, R., R. Gopal, R. Sankaranarayanan and R.V. Singh (2011) “Blog, Blogger, and the Firm: Can Negative Employee Posts Lead to Positive Outcomes,” forthcoming at Information Systems Research.
Animesh, A., S. Viswanathan and R. Agarwal (2011) “Competing Creatively in Sponsored Search Markets: the Effect of Rank, Differentiation Strategy, and Competition on Performance,” Information Systems Research 22(1), 153-169.
Aral, S. and D. Walker (2011) “Creating Social Contagion through Viral Product Design: A Randomized Trial of Peer Influence in Networks,” Management Science 57(9), 1623-1639.
Barber, B.M. and T. Odean (2008) “All That Glitters: The Effect of Attention and News on the Buying Behavior of Individual and Institutional Investors,” The Review of Financial Studies 21(2) 785-818.
Berger, J., A.T. Sorensen and S.J. Rasmussen (2010) “Positive Effects of Negative Publicity: When Negative Reviews Increases Sales,” Marketing Science 29(5), 815-827.
Brynjolfsson, E., L. Hitt and S. Yang (2002) “Intangible Assets: Computers and Organizational Capital,” Brookings Papers on Economic Activity: Macroeconomics 137-199.
Bucklin, R.E. and C. Sismeiro (2003) “A Model of Website Browsing Behavior Estimated on Clickstream Data,” Journal of Marketing Research 40(3), 249–267.
Chan, T. Y., C. Wu and Y. Xie (2011) “Measuring the Lifetime Value of Customers Acquired from Google Search Advertising,” Marketing Science forthcoming.
Chen, H., P. De, Y. Hu and B. Hwang (2012), “Customers as Advisors: The Role of Social Media in Financial,” Working paper, Available at SSRN: http://ssrn.com/abstract=1807265.
Chen, P-Y., S-Y. Wu, and J. Yoon (2004) “The Impact of Online Recommendations and Consumer Feedback on Sales,” Proceedings of the International Conference on Information Systems (ICIS), Washington, D.C., 711-724.
Chen, Y. and J. Xie (2008) “Online consumer reviews: A new element of marketing communications mix,” Management Science, 54(3), 477–491.
Chen, Y., Y. Liu and J. Zhang (2011), “When Do Third-party Product Reviews Affect Firm Value and What Can Firms Do? The Case of Media Critics and Professional Movie Reviews,” Journal of Marketing, 75, 116-134.
Chevalier, J.D. and D. Mayzlin (2006) “The Effect of Word of Mouth on Sales: Online Book Reviews,” Journal of Marketing Research 43(3), 345-354.
Chintagunta, P.K., S. Gopinath and S. Venkataraman (2010) “Online word-of-mouth effects on the offline sales of sequentially released new products: An application to the movie market,” Marketing Science 29(5), 944-957.
Da, Z., J. Engelberg and P. Gao (2011) “In Search of Attention,” Journal of Finance 66(5), 1461-1499. Das, S.R. and M.Y. Chen (2007) “Yahoo! For Amazon: Sentiment Extraction from Small Talk on the
Web,” Management Science 53(9) 1375-1388. De, P., Y. Hu and M. S. Rahman (2010) “Technology Usage and Online Sales: An Empirical Study,” Management Science 56(11), 1930-1945.
Deans, P.C. (2011), “The Impact of Social Media on C-Level Roles,” MIS Quarterly Executive, 10(4), 187-200.
Dekimpe, M. and D. M. Hanssens (1999) “Sustained Spending and Persistent Response: A New Look at Long-term Marketing Profitability,” Journal of Marketing Research 36(4), 397-412.
Dellarocas, C., X. Zhang and N. Awad (2007) “Exploring the Value of Online Product Reviews in Forecasting Sales: the Case of Motion Pictures,” Journal of Interactive marketing 21(4), 23-45.
Dewan, R., M. Friemer and J. Zhang (2002) “Management and Evaluation of Advertisement-Supported Web Sites,” Journal of Management Information Systems 19(3), 87-98.
Dewan, S. and J. Ramaprasad (2011) “Music Blogging, Online Sampling, and the Long Tail,” forthcoming at Information Systems Research.
Dewan, S., C. Shi and V. Gurbaxani (2007) “Investigating the Risk–Return Relationship of Information Technology Investment: Firm-Level Empirical Analysis,” Management Science 53(12) 1829-1842.
Dhar, V. and E. Chang (2009) “Does Chatter Matter? The Impact of User-Generated Content on Music Sales,” Journal of Interactive Marketing 23(4) 300-307.
Duan, W., B. Gu and A. B. Whinston (2009) “Informational Cascades and Software Adoption on the Internet: An Empirical Investigation,” MIS Quarterly 33(1), 23-48.
Fama, E. and K. French (1996) “Multifactor Explanations of Asset Pricing Anomalies,” Journal of Finance 51(1), 55-84.
Forman, C., A. Ghose, B. Wiesenfeld (2008) “Examining the Relationship between Reviews and Sales: The Role of Reviewer Identity Disclosure in Electronic Markets,” Information Systems Research 19(3), 291-313.
Gallaugher, J. and S. Ransbotham (2010) “Social Media and Customer Dialog Management at Starbucks,” MIS Quarterly Executive, 9(4), 197-212.
Gao, G., and Hitt, L.M. (2012) “Information Technology and Trademarks: Implications for Product Variety,” forthcoming at Management Science.
Ghose, A., S. Yang (2009) “An Empirical Analysis of Search Engine Advertising: Sponsored Search in Electronic Markets,” Management Science, 55 (10), 1605-1622.
Godes, D. and D. Mayzlin (2009) “Firm-created Word-of-mouth Communication: Evidence from a Field Test,” Marketing Science, 28(4), 721-739.
Granger, C. (1969) “Investigating Causal Relations by econometric Models and Cross-Spectral Methods,” Econometrica, 37(3), 424-438.
Gu, B., J. Park and P. Konana (2012), “The Impact of External Word-of-Mouth Sources on Retailer Sales of High-Involvement Products,” Information Systems Research, 23(1), 182-196.
Gupta, S., D.R. Lehmann and J.A. Stuart (2004) “Valuing Customers” Journal of Marketing Research, 41(1), 7-18.
Krishnamurthy, S., R. Patel and A. Kaushal (2005) “Online Competition,” Marketing Research 17(4), 20-25.
Luo, X. (2009) “Quantifying the Long-Term Impact of Negative Word of Mouth on Cash Flows and Stock Prices,” Marketing Science, 28(1), 148-65.
Moe, W.W. (2003) “Buying, Searching, or Browsing: Differentiating between Online Shoppers Using In-Store Navigational Clickstream,” Journal of Consumer Psychology 13(1), 29-39.
Montgomery, A. L., S. Li, K. Srinivasan and J. C. Liechty (2004) “Modeling Online Browsing and Path Analysis Using Clickstream Data,” Marketing Science 23(4), 579-595.
Morgan, N.A. and L.L. Rego (2006) “The Value of Different Customer Satisfaction and Loyalty Metrics in Predicting Business Performance,” Marketing Science 25(5), 426–439.
Palmer, J.W. (2002) “Web Site Usability, Design, and Performance Metrics,” Information Systems Research 13(2), 151-167.
Pauwels, K.H. (2004) “How Dynamic Consumer Response, Competitor Response, Company Support and Company Inertia Shape Long-term Marketing Effectiveness,” Marketing Science 3(4), 596-610.
Rutz, O., M. Trusov and R.E. Bucklin (2011), “Modeling Indirect Effects of Paid Search Advertising: Which Keywords Lead to More Future Visits?” Marketing Science 30(4), 646-665.
Srinivasan, S., M. Vanhuele and K. Pauwels (2010) “Mind-Set Metrics in Market Response Models: An Integrative Approach,” Journal of Marketing Research 47 (4), 293–312.
Tirunillai, S. and G. Tellis (2012) “Does Chatter Matter? The Impact of Online Consumer Generated Content on a Firm’s Financial Performance,” Marketing Science, 31(2), 198-215.
Trueman, B., F. Wong and X-J Zhang, (2000) “The Eyeballs Have It: Searching for the Value in Internet Stocks,” Journal of Accounting Research, 38(Supplement), pp. 137-170.
Zhu, F. and X. Zhang (2010) Impact of online consumer reviews on sales: The moderating role of product and consumer characteristics. Journal of Marketing, 74(2), 133–148.