Social Media Data Collection & Network Analysis with Netlytic and R Anatoliy Gruzd [email protected]@gruzd Canada Research Chair in Social Media Data Stewardship Associate Professor, Ted Rogers School of Management Director, Social Media Lab Ryerson University HKBU, Hong Kong Dec 3, 2015 Twitter: @gruzd ANATOLIY GRUZD 1
Transcript
Social Media Data Collection & Network Analysis with Netlytic and R
Canada Research Chair in Social Media Data Stewardship Associate Professor, Ted Rogers School of ManagementDirector, Social Media LabRyerson University
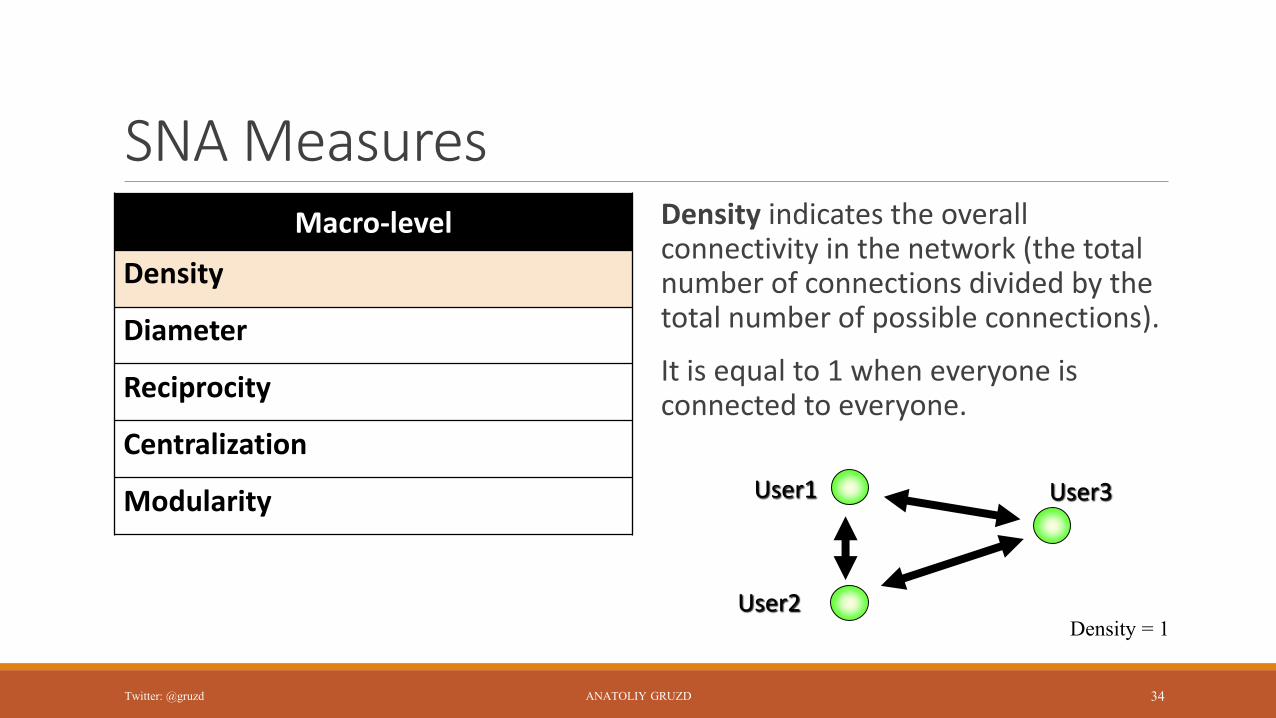
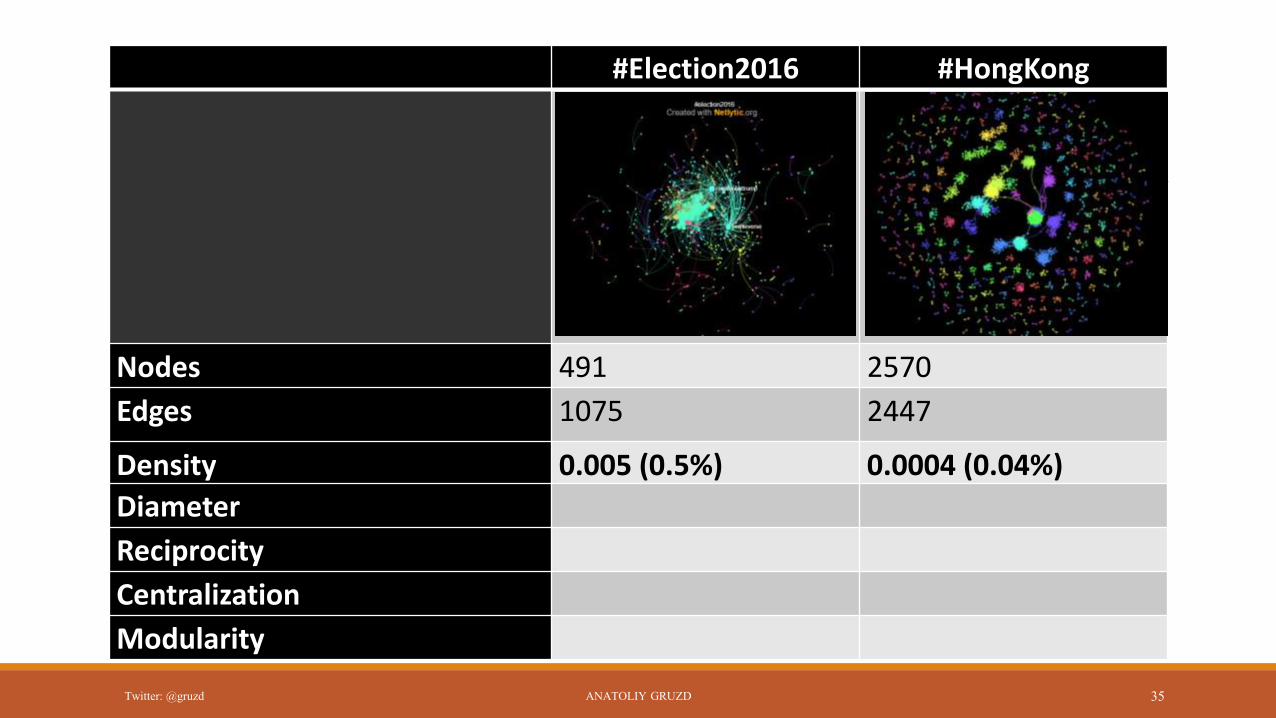
Density indicates the overall connectivity in the network (the total number of connections divided by the total number of possible connections).
It is equal to 1 when everyone is connected to everyone.
ANATOLIY GRUZD 34Twitter: @gruzd
User1 User3
User2Density = 1
#Election2016 #HongKong
Nodes 491 2570
Edges 1075 2447
Density 0.005 (0.5%) 0.0004 (0.04%)
Diameter
Reciprocity
Centralization
Modularity
ANATOLIY GRUZD 35Twitter: @gruzd
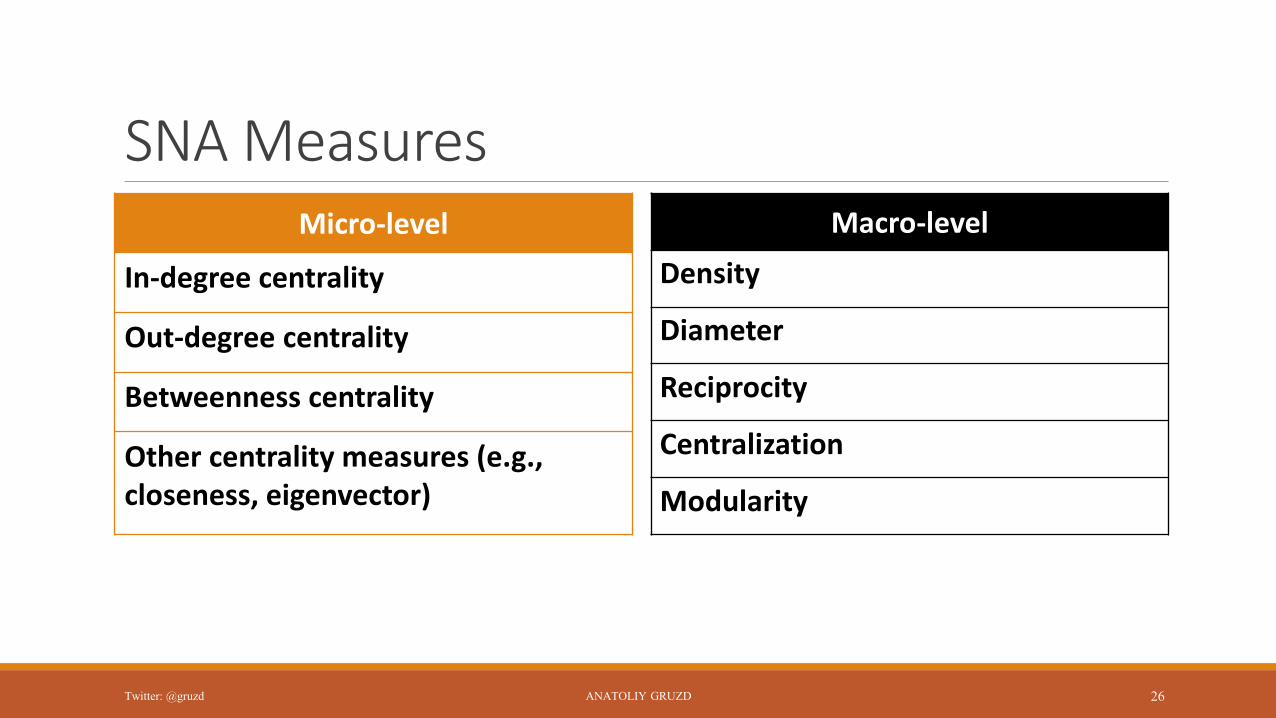
SNA MeasuresMacro-level
Density
Diameter
Reciprocity
Centralization
Modularity
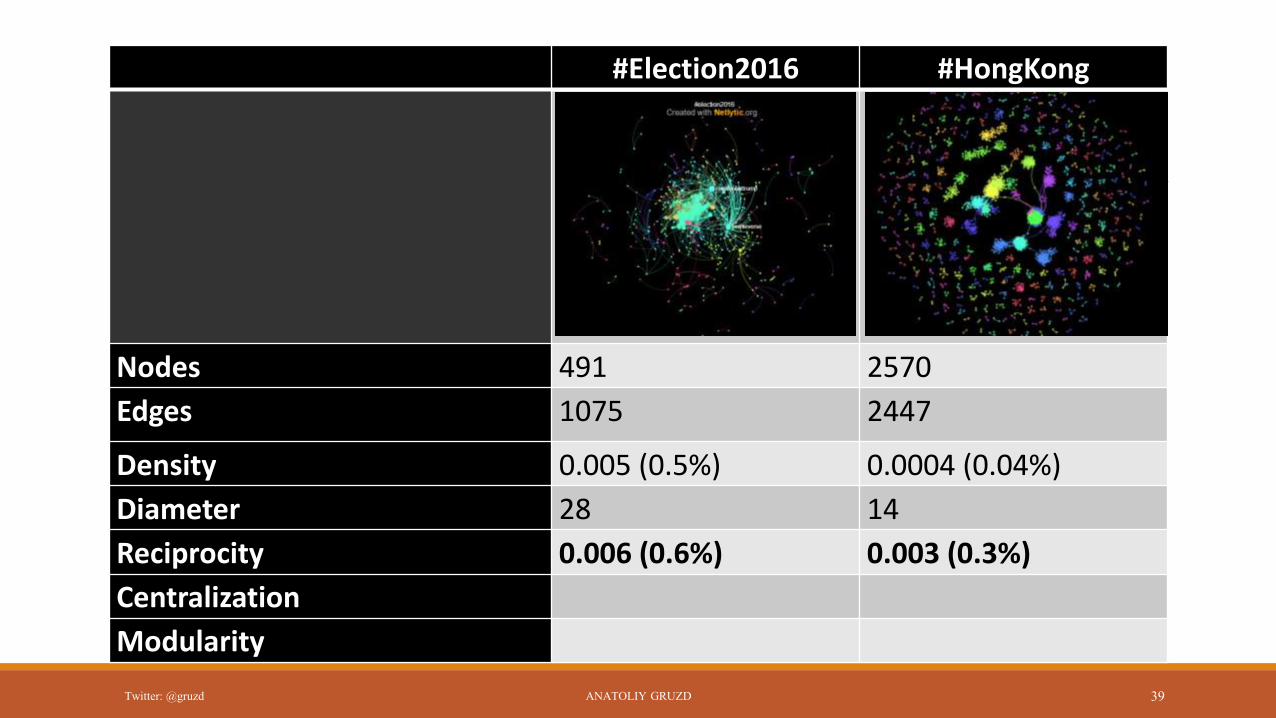
Diameter gives a general idea of how “wide” the network is; the longest of the shortest paths between any two nodes in the network.
ANATOLIY GRUZD 36Twitter: @gruzd
#1
User1User3
User2
User4
Diameter = 3
#2
#3
#Election2016 #HongKong
Nodes 491 2570
Edges 1075 2447
Density 0.005 (0.5%) 0.0004 (0.04%)
Diameter 28 14
Reciprocity
Centralization
Modularity
ANATOLIY GRUZD 37Twitter: @gruzd
SNA MeasuresMacro-level
Density
Diameter
Reciprocity
Centralization
Modularity
Reciprocity shows how many online participants are having two-way conversations.
In a scenario when everyone replies to everyone, the reciprocity value will be 1.
ANATOLIY GRUZD 38Twitter: @gruzd
User2
User1User3
User4 Reciprocity=1
#Election2016 #HongKong
Nodes 491 2570
Edges 1075 2447
Density 0.005 (0.5%) 0.0004 (0.04%)
Diameter 28 14
Reciprocity 0.006 (0.6%) 0.003 (0.3%)
Centralization
Modularity
ANATOLIY GRUZD 39Twitter: @gruzd
SNA MeasuresMacro-level
Density
Diameter
Reciprocity
Centralization
Modularity
Centralization indicates whether a network is dominated by few central participants (values are closer to 1),
or whether more people are contributing to discussion and information dissemination (values are closer to 0).
ANATOLIY GRUZD 40Twitter: @gruzd
User2
User1User3
User4 Centralization=1
#Election2016 #HongKong
Nodes 491 2570
Edges 1075 2447
Density 0.005 (0.5%) 0.0004 (0.04%)
Diameter 28 14
Reciprocity 0.006 (0.6%) 0.003 (0.3%)
Centralization 0.05 0.11
Modularity
ANATOLIY GRUZD 42Twitter: @gruzd
SNA MeasuresMacro-level
Density
Diameter
Reciprocity
Centralization
Modularity
Modularity provides an estimate of whether a network consists of one coherent group of participants who are engaged in the same conversation and who are paying attention to each other (values closer to 0);
or whether a network consists of different conversations and communities with a weak overlap (values closer to 1).