Social Media Image Labeling and Extraction: Using Convolutional Neural Networks to Identify Threats to National Security Nicholas Forrest, Sheamus Larkin, Josh Radjenovich, Andrew Tien, Lt Col James Lotspeich, Lt Col Gregory Steeger, Brian Snedic, and Aaron Reite Operations Research Program, United States Air Force Academy, Colorado, USA Corresponding author's Email: [email protected]Author Note: Nicholas Forrest, Sheamus Larkin, Josh Radjenovich, and Andrew Tien are senior cadets at the United States Air Force Academy, collectively working on this project as part of a year-long operations research capstone course. The student authors would like to extend thanks to the advisors involved with this project as well as the client organization, National Security Agency and the National Geospatial-Intelligence Agency. Abstract: As social media becomes more prevalent in society, it creates new platforms to gather information, which aids intelligence organizations. This project answers the question, “How can convolutional neural networks and image recognition be used to further identify national security threats revealed through social media?” The innovative approach used is Naïve Bayesian statistics to predict whether an image pertains to national security based on the objects detected from a convolutional neural network. The final model scans through a set of images, identifies key features within those images, and labels images posing potential threats to national security. The model performs at 85.5% test accuracy with a 1.5% false positive rate, correctly classifying 170 out of 200 images. These results prove that conditioning the probability of an image being a threat on the objects detected in the convolutional neural networks improves overall model accuracy when searching for images of national security interest. Keywords: Convolutional Neural Network, CNN, Image Recognition, Social Media, National Security, Bayesian 1. Introduction The cyber world has provided an extensive global information bank that continuously monitors the cyber world for up-to-date global intelligence and has become imperative for cyber defense. Rapid growth of social media has turned online interaction into a key component of modern culture. The ease of access makes social media platforms ideal for constant social communication and active regional updates. This increase in online activity has caused social media application programming interfaces (APIs) to become extensive, global information repositories. Every time someone uses a web application such as Google, Facebook, Twitter, etc., the API sends data back and forth between the website and the computer or phone. Finding ways to access this information is crucial in identifying and classifying hazards in order to prevent targets or events that could be threatening to national security. This report outlines one particular method for accessing these global information repositories through the use of image recognition techniques. According to Meeker (2017) over 1.8 billion photos are posted to various social media websites every single day. This enormous amount of real-time data presents an opportunity to gain an intelligence advantage on adversaries that intentionally or unintentionally post images that reveal threats to our nation’s security. Analyzing geographic social media image trends gives the National Geospatial-Intelligence Agency (NGA) and National Security Agency (NSA) a significant edge in recognizing increased threatening activity in areas anywhere in the world. This advantage helps support the mission of the NGA and NSA by compiling necessary information to help policymakers, warfighters, first responders and others make decisions regarding national security. An algorithm functioning as a tool to identify geospatial trends through images among different social media platforms can substantially impact the intelligence community by finding images of national security concern where the adversary least expects it. While the NGA and NSA probably have a tool that utilizes Social Media Image Labeling and Extraction (SMILE) capabilities to detect images of military interest, this study is focused on finding alternate means of doing so. At present, the NGA and NSA focus heavily on satellite imagery and social media word detection to initially identify possible global threats or disaster. Operating on a basis that U.S. enemies are ignorant about how easily available social media information is to the public and security agencies, this project aims to develop an image recognition and deep learning model that can be applied to any social media platform. 209 Proceedings of the Annual General Donald R. Keith Memorial Conference West Point, New York, USA May 3, 2018 A Regional Conference of the Society for Industrial and Systems Engineering ISBN: 97819384961-2-7
Transcript
Social Media Image Labeling and Extraction: Using Convolutional Neural
Networks to Identify Threats to National Security
Nicholas Forrest, Sheamus Larkin, Josh Radjenovich, Andrew Tien, Lt Col James Lotspeich, Lt
Col Gregory Steeger, Brian Snedic, and Aaron Reite
Operations Research Program, United States Air Force Academy, Colorado, USA
Author Note: Nicholas Forrest, Sheamus Larkin, Josh Radjenovich, and Andrew Tien are senior cadets at the United States
Air Force Academy, collectively working on this project as part of a year-long operations research capstone course. The
student authors would like to extend thanks to the advisors involved with this project as well as the client organization,
National Security Agency and the National Geospatial-Intelligence Agency.
Abstract: As social media becomes more prevalent in society, it creates new platforms to gather information, which aids
intelligence organizations. This project answers the question, “How can convolutional neural networks and image recognition
be used to further identify national security threats revealed through social media?” The innovative approach used is Naïve
Bayesian statistics to predict whether an image pertains to national security based on the objects detected from a
convolutional neural network. The final model scans through a set of images, identifies key features within those images, and
labels images posing potential threats to national security. The model performs at 85.5% test accuracy with a 1.5% false
positive rate, correctly classifying 170 out of 200 images. These results prove that conditioning the probability of an image
being a threat on the objects detected in the convolutional neural networks improves overall model accuracy when searching
for images of national security interest.
Keywords: Convolutional Neural Network, CNN, Image Recognition, Social Media, National Security, Bayesian
1. Introduction
The cyber world has provided an extensive global information bank that continuously monitors the cyber world for
up-to-date global intelligence and has become imperative for cyber defense. Rapid growth of social media has turned online
interaction into a key component of modern culture. The ease of access makes social media platforms ideal for constant
social communication and active regional updates. This increase in online activity has caused social media application
programming interfaces (APIs) to become extensive, global information repositories. Every time someone uses a web
application such as Google, Facebook, Twitter, etc., the API sends data back and forth between the website and the computer
or phone. Finding ways to access this information is crucial in identifying and classifying hazards in order to prevent targets
or events that could be threatening to national security. This report outlines one particular method for accessing these global
information repositories through the use of image recognition techniques.
According to Meeker (2017) over 1.8 billion photos are posted to various social media websites every single day.
This enormous amount of real-time data presents an opportunity to gain an intelligence advantage on adversaries that
intentionally or unintentionally post images that reveal threats to our nation’s security. Analyzing geographic social media
image trends gives the National Geospatial-Intelligence Agency (NGA) and National Security Agency (NSA) a significant
edge in recognizing increased threatening activity in areas anywhere in the world. This advantage helps support the mission
of the NGA and NSA by compiling necessary information to help policymakers, warfighters, first responders and others
make decisions regarding national security. An algorithm functioning as a tool to identify geospatial trends through images
among different social media platforms can substantially impact the intelligence community by finding images of national
security concern where the adversary least expects it.
While the NGA and NSA probably have a tool that utilizes Social Media Image Labeling and Extraction (SMILE)
capabilities to detect images of military interest, this study is focused on finding alternate means of doing so. At present, the
NGA and NSA focus heavily on satellite imagery and social media word detection to initially identify possible global threats
or disaster. Operating on a basis that U.S. enemies are ignorant about how easily available social media information is to the
public and security agencies, this project aims to develop an image recognition and deep learning model that can be applied
to any social media platform.
209
Proceedings of the Annual General Donald R. Keith Memorial Conference West Point, New York, USA May 3, 2018 A Regional Conference of the Society for Industrial and Systems Engineering
The purpose of this study is to answer the question, “How can convolutional neural networks and image recognition
be used to further identify national security threats revealed through social media?” The algorithm in this project augments
previously built convolutional neural networks in order to specialize in objects of military interest. The objects of military
interest include: guns, uniforms, tanks, and other images pertaining to national security. The tool will automatically generate
a report that describes the most prominent object within an image and can be used to classify an image as an indicator of
possible threat or not. This tool will allow improvement in advanced social media intelligence collection capabilities
regarding counterterrorism, event and transportation security, and even global crises. We quantify the success of our tool by
measuring the object recognition classification rate. This rate is measured by the amount of images correctly identified as
containing an item of military interest. For the purpose of recognizing objects of military interest, an object recognition
classification rate of at least 70% is expected for this project. This means that 70% of all images containing threatening
components are accurately labeled as a possible threat. Related works have determined that the most efficient and accurate
algorithmic method to recognize objects within images is through the application of convolutional neural networks.
1.2 Related Work - Neural Networks
The current most effective algorithmic method in recognizing and detecting objects within digital images is through
the use of neural networks. Modeled by neural activity within the human brain, a neural network consists of a series of nodes
working simultaneously to apply a series of activation function to a particular given input in order to produce a specified
output (McCulloch and Pitts, 1943). Neural networks are used for a variety of applications such as identifying trends, or
recognizing components of images based on given parameters. Typically, neural networks consist of an input layer, at least
one hidden layer that contains functioning algorithms to evaluate the input, and an output layer (Ng, 2017). Deep neural
networks are essentially simple neural networks with multiple hidden layers. Activation functions reside in each individual
node creating hidden layers within a network. Hidden layers are the “behind the scenes” connections between the inputs and
outputs that consist of all neural nodes (Rowley et al., 1998). For this study in particular, all activation functions consist of a
series of mathematical equations that get chronologically applied across all segments of an image. The activation functions
within one layer produce a binary output to identify whether or not any part of an image has the specific feature that that node
evaluates. The specific segment of an image being evaluated at one time is referred to as the frame of reference, or kernel.
Within each node, each segment of an image consists of a cluster of pixels that acts as the kernel being applied to that node’s
activation function (Ng, 2017). Each hidden layer of a deep neural network can consist of any number of specified nodes to
identify key features of an image. The initial hidden layers generally work to identify basic characteristics within an image
such as prevalent horizontal or vertical lines. As a neural network get deeper with more hidden layers, nodes within higher-
level layers focus on more detailed description such as whether or not individual kernels contain characteristics of a person’s
face (Rowley et al., 1998).
1.3 Convolutional Neural Network Components
Some of the most commonly used methods of improving CNN’s include max pooling, padding, and soft max
functions. Max pooling is used to reduce the number of parameters in the model and simplify the results (Ng, 2017). Max
pooling is shown in the first step of Figure 1 where the image dimension, the size of the square, is reduced by moving a
kernel (grey square) across an image and using the most prominent features within that kernel as the output to represent that
set of multiple pixels. Max pooling therefore reduces the feature space, as shown in Figure 1 when the square filter gets
smaller. Max pooling is beneficial because it simplifies the parameters, thus allowing the algorithm to run faster and more
efficiently. However, by assuming the maximum values in each kernel are the only significant value, some assumptions and
minor risk are introduced to the accuracy of the model. Padding is the practice of adding blank pixels to the edges of an
image to ensure the kernel fits perfectly on the picture (Ng, 2017). For instance, if an image is 300X300 pixels and you were
using a filter that is 8X8 pixels, you would pad the image by adding 4 blank pixels to each column and row, to ensure the
kernel would be able to scan across the entire image without shrinking the size of the image as it is passed through the
algorithm. Once the pooling layers are complete, the model moves to the fully connected layers (see the second step in Figure
1). The fully connected layers are made up of multiple neural nodes containing algorithms for individual feature detection
and used looped deep learning techniques to combine significant image features from each layer to make a more complete
picture (Deshpande, 2016).
The last step in the CNN algorithm is using a softmax function which ultimately classifies the image as a bird,
sunset, dog, cat, etc. The softmax function takes a simple binary classification output that states whether an image contains an
210
Proceedings of the Annual General Donald R. Keith Memorial Conference West Point, New York, USA May 3, 2018 A Regional Conference of the Society for Industrial and Systems Engineering
ISBN: 97819384961-2-7
object in specified categories or not and converts it into the percent probability of each category being in the image
(Deshpande, 2016). The primary benefit in using a softmax function is to identify which categories are more likely to be in an
image in comparison with one another rather than using binary classification by rounding and outputting a value of 1 or 0
representing if a category is present or not, respectively. A softmax function can be used to obtain the probabilities expressed
Transfer Learning is a technique that shortcuts a lot of the work of fully-training a model. It allows for the user, who
might not be as proficient in computer science, to avoid intensive programming. Xia, X., Xu, C., & Nan, B. (2017, June) are
botanist who saw an application for machine learning for flower classification. In short, transfer learning takes a fully-trained
model and retrains the model for new categories. This is made possible by retraining the final layer of the Inception V3
model from scratch. While this method may not be as accurate as fully-training the model, it allows for less computer science
heavy researchers to take advantage of progress of high performing neural networks and apply it to many different fields and
projects.
1.4 Project Scope and Assumptions
This project focuses primarily on the labeling of social media images that pose a threat to national security and are
contained within the ImageNet Large Scale Visual Recognition Challenge (ILSVRC) 2012. The first assumption made in this
project is that the model will only be trained on images from this ILSVRC 2012 dataset. Only a small subset of the ILSVRC
image categories will be used to train this CNN that contain objects pertaining to national security. Specifically this subset
includes objects of military interest that are listed in the problem statement section. This includes 1,000 categories of the
possible 22,000 image categories in the ILSVRC dataset. This assumption reduces the sample space of the dataset, and will
immensely reduce the overall computing time of the CNN. The second assumption for this project is that social media images
will be able to be classified at the same accuracy as the images found in ImageNet. Due to data restrictions on open source
social media images, this project will replace the social media images found on Facebook or Twitter with images found in the
ILSVRC dataset. Therefore, web crawling techniques are out of scope of this project due to the accessibility of public image
sets. Other aspects that are out of scope include any classified data or information that the NGA possesses that may be
necessary for further implementation or building of the algorithm. Given research in computer vision, it was determined that
using convolutional neural networks is the current most accurate way of conducting image recognition.
2. Methodology
The typical method of training an image recognition algorithm requires a series of large datasets containing
thousands, or even millions, of images that are to be run through the algorithm. Using the training set, it is possible to
evaluate how well the current parameters within each layer identify a specific aspect of a picture. Throughout the training of
the model, sets of images are looped through the model over and over again until gradient descent applied to activation
functions allows the parameters for each node to reach optimal values. In the interest of time and effort, this study bypassed
the step of training the algorithm and imported publically available, pre-trained weights for all classifications within the
ImageNet dataset. The purpose of this study was not to create an algorithm that identifies features within an image. That has
been done before. Rather, the focus of the study aim to identify images that could pose a threat to national security, so using a
pre-trained set of feature weights is a justifiable means to reach the end goal.
In this particular study, the Inception V3 image recognition model referred to in “Rethinking the Inception
Architecture for Computer Vision” is augmented to meet specific needs regarding national security concerns of the NGA,
NSA and NRO organizations (Szegedy et al., 2016). The model code was translated using prebuilt software computational
libraries, such as TensorFlow and Keras, in order to simplify the extent of code used to run the algorithm and limit the overall
size of the model. For more information on the architecture of the Inception models, refer to the original article, “Going
Step 2 Step 3 Step 1
211
Proceedings of the Annual General Donald R. Keith Memorial Conference West Point, New York, USA May 3, 2018 A Regional Conference of the Society for Industrial and Systems Engineering
ISBN: 97819384961-2-7
Deeper with Convolutions” (Szegedy et al., 2014). Similar to how Xi Xu, and Nan retrained the Inception V3 model for
flower classification, this study approached the problem by augmenting the Inception V3 model to classify characters that
may trigger a threat to national security. While the original Inception V3 model simply identifies objects within an image,
this study has produced a model that weighs each of the 1000 total categories within the ILSVRC 2012 dataset in order to
identify the probability of possible threats within an image. Weights were determined using threat classification on the top
five outputs from each image of the 4,000 image dataset. A threat dictionary containing the name of all 1000 categories, a
threat weight for each category, and a non-threat weight for each category was built in order to store and update the training
data. By analyzing the top five outputs within each image, Naïve Bayesian classification was then applied to determine the
likelihood that an image contains a threat.
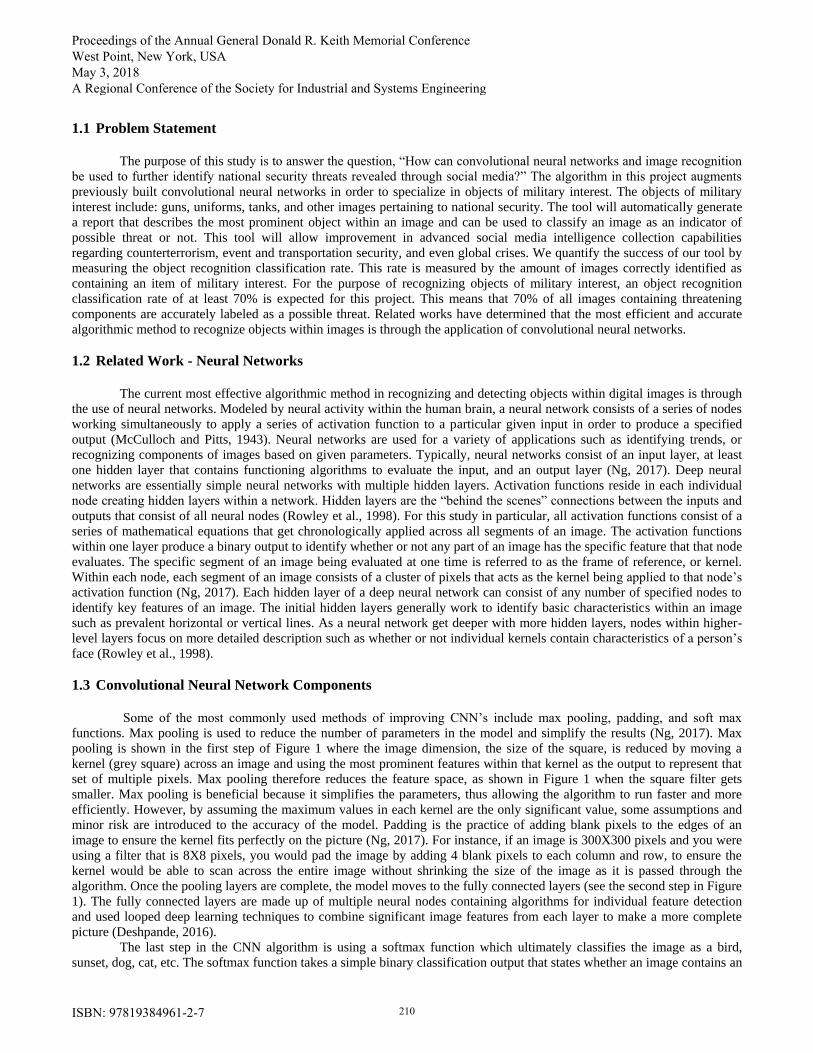
The following subsections are broken into the 4 main components of our methodology:1) Image threat labeling, 2)
Object detection, 3) Naïve Bayes threat probability calculation and 4) model threat classification (figure 2).
Figure 2: Methodology visualization
2.1 Image Threat Labeling
The first step in building our threat detection algorithm was creating a dataset that contains images that are classified
as threat or no-threat. 4000 images were randomly chosen from the ImageNet repository and used to build our initial threat
dataset. Our group created a threat classifier in python which looped the 4000 images with a graphical user interface that used
the right and left arrow keys to manually label the image as threat or no threat. The dataset was then stored as a text file with
the file name and the threat classification in two different columns. The purpose of labeling these images as threat or non-
threat is to discern which image categories are most commonly found in images pertaining to national security. It adds depth
and introduces context to the model by making it possible for an image to have an object that could be considered a threat to
national security in some circumstances and to classify it as a non-threat (correcting for false positives).
2.2 Convolutional Neural Network Top 5 Object Detection
The next step in our methodology was using the CNN network to output the top five image categories of the 4,000
images. The 4,000 images were run through the Inception V3 model to acquire the top five objects detected within each
image. Once this step was complete, the model outputs a text string containing the image name, whether or not the image was
a threat, and the top five categories that the V3 model classifies for that image (see example output below). <ImageName: n101942>, <Threat>, <Rifle, Ski-Mask, Dog, Bucket, Shovel>
2.3 Naïve Bayesian Threat Probability Calculation
After gaining insight on whether or not an image is a threat and the image’s top five objects, statistical analysis is
used to determine which objects are most likely to show up in a threatening image. This section shows an example of how a
threat probability is calculated using Naïve Bayesian Statistics for an image given the top five image categories that CNN
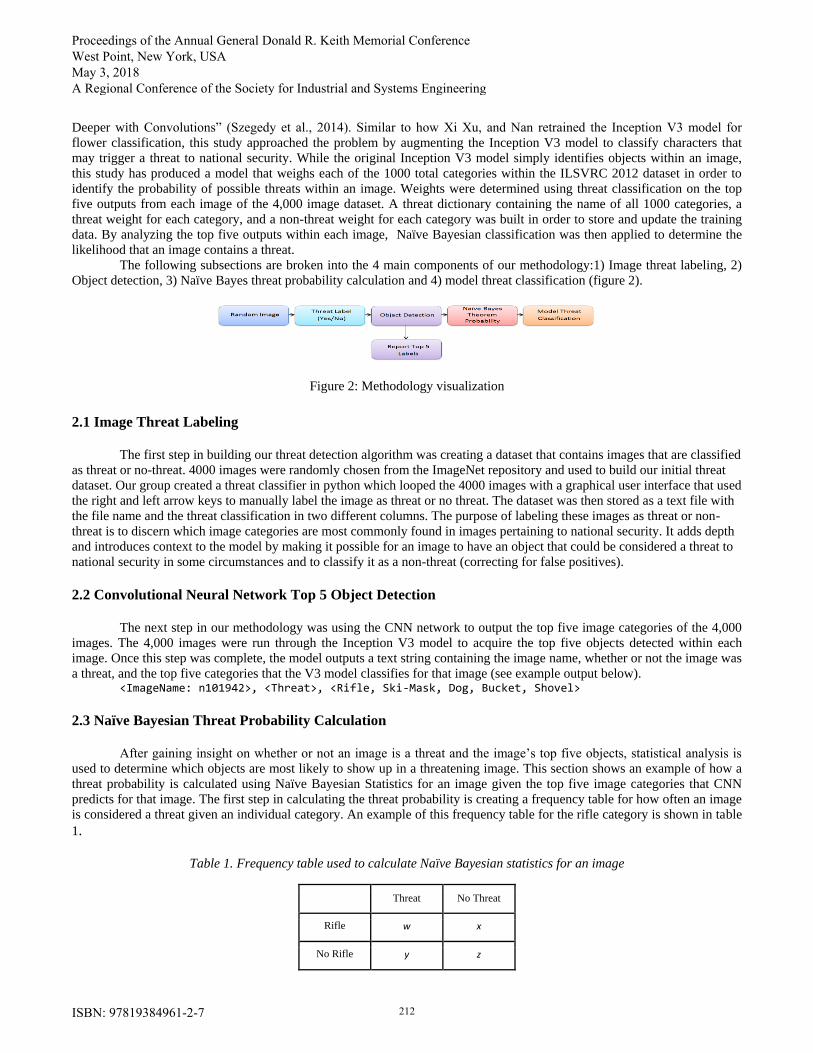
predicts for that image. The first step in calculating the threat probability is creating a frequency table for how often an image
is considered a threat given an individual category. An example of this frequency table for the rifle category is shown in table
1.
Table 1. Frequency table used to calculate Naïve Bayesian statistics for an image
Threat No Threat
Rifle w x
No Rifle y z
212
Proceedings of the Annual General Donald R. Keith Memorial Conference West Point, New York, USA May 3, 2018 A Regional Conference of the Society for Industrial and Systems Engineering
ISBN: 97819384961-2-7
From this frequency table, the probability of an image containing a rifle given that it is a threat is calculated as:
𝑃(𝑟𝑖𝑓𝑙𝑒 | 𝑡ℎ𝑟𝑒𝑎𝑡) = 𝑤
𝑤+𝑦 (1)
Similarly the probability of an image being a threat is easily calculated as:
𝑃(𝑡ℎ𝑟𝑒𝑎𝑡) =𝑤+𝑦
𝑤+𝑥+𝑦+𝑧 (2)
Lastly, the probability of an image containing a rifle is calculated as:
𝑃(𝑟𝑖𝑓𝑙𝑒) =𝑤+𝑥
𝑤+𝑥+𝑦+𝑧 (3)
With these three probabilities, the conditional probability of an image being a threat given that it has a rifle is given below,
using Bayes Theorem:
𝑃(𝑡ℎ𝑟𝑒𝑎𝑡|𝑟𝑖𝑓𝑙𝑒) =𝑃(𝑟𝑖𝑓𝑙𝑒 | 𝑡ℎ𝑟𝑒𝑎𝑡)∗𝑃(𝑡ℎ𝑟𝑒𝑎𝑡)
𝑃(𝑟𝑖𝑓𝑙𝑒) (4)
Taking this one step further, the ultimate goal is to find the probability that an image is a threat given that it contains
the top five image labels that the CNN outputs. To simplify the calculation, the group assumed that the image categories were
independent of one another; also known as the naïve assumption. Below is an example for how the threat probability of an
image containing a rifle, ski-mask, dog, bucket, and shovel is calculated. 𝑃(𝑡ℎ𝑟𝑒𝑎𝑡|𝑟𝑖𝑓𝑙𝑒, 𝑠𝑘𝑖𝑚𝑎𝑠𝑘, 𝑘𝑛𝑖𝑓𝑒, 𝑑𝑜𝑔, 𝑏𝑢𝑐𝑘𝑒𝑡, 𝑠ℎ𝑜𝑣𝑒𝑙) =
The CNN model chooses 5 out of the 1,000 categories and conditions the probability of an image being a threat
based on 8.25x10¹² possible combinations of image categories. As more images are labeled, the probabilities of these
categories become more accurate. All 4,000 training images, which were previously labeled as a threat or non-threat, were
then used to populate a frequency dictionary containing all 1,000 categories. These frequencies described how many times
the top five image categories showed up in the model that were labeled as threats and non-threats. Using these numbers,
Bayes Theorem was applied to calculate the probability that a picture is a threat given that it contains objects of a specific
category. This probability was calculated for all 1,000 image categories.
2.4 Model Threat Classification
The last step in the methodology is determining a threshold value to classify whether the Bayes’ probability is high
enough for the model to classify an image as a threat. It is obvious that a higher probability constitutes an image being more
likely to be a threat, but at what probability should that line be drawn? This is the threshold probability. After getting the
relative threat probabilities from the above steps, the group assigned an arbitrary threshold value that classified an image as a
threat if it was above the threshold probability and a non-threat if it was below the threshold probability. The model threat
classification was then compared to the actual threat classification from the validation set, and the threshold probability was
optimized to maximize the classification rate. The optimizer used in this project was Microsoft Excel’s solver function.
3. Results and Analysis
After determining the threat probabilities for all 1,000 image categories, the model determined which objects were
most commonly found in threatening images. The threat probabilities were very low due to the small number of images that
were classified as threats in the overall dataset. For example only 1.25% of the images in the test set contained assault rifles,
and of these images only 65% were classified as a threat. When multiplying these probabilities together using Bayesian
statistics, this creates very low threat probabilities. Expanding on this concept, the probabilities of certain categories being
threats grows more accurate if the algorithm is trained using more images.
213
Proceedings of the Annual General Donald R. Keith Memorial Conference West Point, New York, USA May 3, 2018 A Regional Conference of the Society for Industrial and Systems Engineering
ISBN: 97819384961-2-7
Using those threat probabilities, we concluded that a probability threshold of 0.011 would give us the most accurate
results in correctly classifying an image as a threat or a non-threat. This value was determined using Excel’s optimization
solver function. This means that any image with an average threat probability of 0.011or higher would be identified as a
threat and any image with an average threat probability lower than 0.011 would be considered a non-threat.
Only 200 test images were analyzed to determine the classification rate which potentially confounds the variance
among the two methods. After running the images through the final model with a threshold value of 0.011, the overall test-
classification rate was 85.5%. This value correctly identified 170 out of 200 images. The false positive rate for this model
was 1.5% meaning that out of the 200 images, 3 threatening images were missed. The false positive rate is very important to
agencies such as the NGA and the NSA because a high false positive rate means that image threats are not being detected. By
using more than 200 images, our model’s false positive rate will decrease as the threat probabilities are refined. These
classification results surpassed the goal classification rate by 15.5% and show how combining Naïve Bayesian statistics with
CNN object detection can achieve superior results.
To determine the validity of these results, we compared the results to an alternate threat classification approach that
omitted Naïve Bayesian statistics. In the alternate approach, 40 out of the 1000 categories were chosen and labeled as threat
categories. If the model identified any of these 40 categories as the most prominent object in an image, then that image would
automatically be identified as a threat. Otherwise, the image was labeled as a non threat. In doing so, the alternate approach
resulted in an 85% classification rate with a similar 1.5% false positive rate. The results after incorporating a Naïve Bayesian
network improved by 0.5% from the alternative CNN threat analysis, which did not include the Naïve Bayesian statistics.
The reason for this small delta in improvement is due to the small amount of data that was used for this analysis. However,
even while using this small set of data to initialize the Bayesian network, this method produced a more accurate threat
analysis.
4. Conclusion
In conclusion, the Naïve Bayes network derived from the CNN object detection resulted in an 85.5% classification
rate, a 1.5% false positive rate, and a 0.011 threat probability threshold. By initializing the Bayesian network using larger and
more diverse datasets, the model can learn what should and should not be considered a threat based on the top five objects
within an image. It is possible to apply machine learning techniques to allow the model to constantly update the CNN and
Bayesian network so that the program continues to learn and become more accurate as more images of threats and non-threats
are run through. The classification rate of the alternative approach will stay constant with the addition of new data because it
is reliant on fixed definitions of threats. However, as the Bayesian network continues to operate on more data, the threat
probabilities will become more accurate as the model learns more about what threatening images consist of, and the 85.5%
classification rate will increase as well. This project shows how convolutional neural networks and statistics can be combined
to create an accurate image recognition tool that can be used to improve national security threat identification.
5. References
Deshpande, Adit. (2016) A Beginner's Guide To Understanding Convolutional Neural Networks.”A Beginner's Guide To
Understanding Convolutional Neural Networks – Adit Deshpande – CS Undergrad at UCLA ('19) Meeker, M. (2017) Kleiner Perkins Caufield Byers. 2017 Internet Trends Report. Dream Bigger — Kleiner Perkins Caufield
Byers, 31 May 2017.
McCulloch, W. S., & Pitts, W. (1943). A logical calculus of the ideas immanent in nervous activity. The bulletin of
mathematical biophysics, 5(4), 115-133.
Ng, Andrew. (2017). Neural Networks and Deep Learning. Coursera, 13 Nov. 2017, www.coursera.org/learn/neural-
networks-deep-learning/home/week/1.
Rowley, H. A., Baluja, S., & Kanade, T. (1998). Neural network-based face detection. IEEE Transactions on pattern analysis
and machine intelligence, 20(1), 23-38.
Russakovsky, O., Deng, J., Su, H., Krause, J., Satheesh, S., Ma, S., ... & Berg, A. C. (2015). Imagenet large scale visual
recognition challenge. International Journal of Computer Vision, 115(3), 211-252.
Szegedy, C., Vanhoucke, V., Ioffe, S., Shlens, J., & Wojna, Z. (2016). Rethinking the inception architecture for computer
vision. In Proceedings of the IEEE Conference on Computer Vision and Pattern Recognition (pp. 2818-2826).
Szegedy, Christian, et al. “Going Deeper with Convolutions.” 2015 IEEE Conference on Computer Vision and Pattern
Recognition (CVPR), 17 Sept. 2014.
Xia, X., Xu, C., & Nan, B. (2017, June). Inception-v3 for flower classification. In Image, Vision and Computing (ICIVC),
2017 2nd International Conference on (pp. 783-787). IEEE
214
Proceedings of the Annual General Donald R. Keith Memorial Conference West Point, New York, USA May 3, 2018 A Regional Conference of the Society for Industrial and Systems Engineering