13
© 2015 AZBlue | www.AZblueinc.com A Z b SOCIAL MEDIA MANAGEMENT SERIES PROFESSIONAL SERVICES OPPORTUNITIES 1
| Date post: | 16-Jul-2015 |
| Category: |
Social Media |
| Upload: | jim-clark |
| View: | 50 times |
| Download: | 1 times |

© 2015 AZBlue | www.AZblueinc.com
AZb
SOCIAL MEDIA MANAGEMENT SERIES
PROFESSIONAL SERVICES OPPORTUNITIES
1

© 2015 AZBlue | www.AZblueinc.com
AZb
MARKETING INTELLIGENCE: THE GAP BETWEEN BRANDS & TECHNOLOGY
2
“gray area”
Brand Investments
Brand Strategy, Goals & KPI’s
How to integrate the top layer and bottom layers in a way that allows the Enterprise, as a whole, to function as one and maximize both investments
and results?
Creation of strategies based on existing Marketing Intelligence
Investments to drive & manage Marketing Intelligence to focus on results in-line with KPI’s
• Brands are purchasing/using social marketing platforms without totally understanding their capabilities/limitations
Marketing Intelligence tools are not currently designed to the specific needs of the
brand end-user!

© 2015 AZBlue | www.AZblueinc.com
AZb
MARKETING INTELLIGENCE CAPABILITIES – TODAY
The Gap between Brands and Partner Sales Teams

© 2015 AZBlue | www.AZblueinc.com
AZb
THE GAP BETWEEN CUSTOMERS AND PARTNER SALES
The Gap• Brands today don’t know what they don’t know and are unable to articulate their needs
relevant to the platforms they use• Partner Sales Teams do not understand their customers business and cannot ask the
right questions to design specific to their needs
The Reason• Brands buy tools with standard data capture and presentation capabilities (dashboards
and data import) without know what they can actually do while at the same time sales teams do not know enough of their customers business to ask the questions needed to make recommendations that will meet their needs– Example – Customer Care has different needs than PR or Marketing and yet they all receive the
same data.
• More importantly the data they do receive is not contextual in that it does not have “three dimensional” capability to say whether results are good or bad in context to other data it is being compared to– Example – Comparing FB Likes or Engagements of two different brands doesn’t necessarily
mean success…it only means more investment in one area of the larger marketing landscape
The Opportunity• Strategic Platform Service Providers should create or expand their professional services
capabilities to include workshops and audits to better understand customer needs to advise them on the right solution vs. cookie-cutter, one-screen-fits-all approach
4

© 2015 AZBlue | www.AZblueinc.com
AZb
MARKETING INTELLIGENCE FUNNEL – HOW IT CAN WORK
5
Data Filtering Layer
Analysis Layer
MeasurementLayer
Planning & Activation
Presentation Layer
Routing Layer
Facebook Twitter YouTube Google Facebook WebsitesBlogs
Platforms used to buy paid media, publish, manage social media and/or listen to conversations that provide basic quantitative data e.g. Radian6, Tracx, Brandwatch, Facebook, Google, Hootsuite, Sprout, Spredfast etc.
At this layer data is presented via dashboards sorted by basic categories e.g. likes, posts, sentiment, shares, PTAT, geographic location, channel, or click thru.
Using the graphics available within the dashboards, brands make visual correlations between their brand status, campaigns and market trends in contrast to similar data captured about their competitors.
Once the data has been captured and specific trends identified, it is imported into excel files for manual manipulation and comparison to other imported market research data to extract/make assumed correlations
Ad hoc reports and graphics are then used to support brand strategies as well as measure success/ROI
Once the data is collected from the platform it is manually assessed by type, severity, requirements and “actionability” (flagged & tagged) and routed to the appropriate owner for resolution
• Brands are deeply invested in digital/social technologies to plan, execute, manage and measure marketing initiatives– If designed & optimized correctly, these assets can maximize the brands efforts to meet/exceed
critical KPI’s
Designing the right solution & capabilities to
meet customer needs
Opportunity
Designing the right processes to get specific
data to the right end-user
Designing the right set of screens/dashboards to
meet specific needs focused on KPI’s
Collaborating with clients to create state of the art
trending analyses abilities
Collaborating with clients to create contextual
reports that provide 3 dimensional insights
Collaboration with clients to design & execute effective marketing
based on specific trends

© 2015 AZBlue | www.AZblueinc.com
AZb
MARKETING INTELLIGENCE FUNNEL – HOW IT REALLY
WORKS
6
Brands use basic tools to listen, manage communities, engage and publish data and collect basic quantitative data sorted by categories.
This is where most brands assume that the data they need (or can access) is aggregated into basic graphs, word clouds, timelines etc. to assess trends
Using the graphics available within the dashboards, brands make visual correlations between their brand status, campaigns and market trends in contrast to similar data captured about their competitors.
Once the data has been captured and specific trends identified, it is imported into excel files for manual manipulation and comparison to other imported market research data to extract/make assumed correlations
Ad hoc reports and graphics are then used to support brand strategies as well as measure success/ROI
This is a key layer that is ignored by 99% of all brands and social technology providers because it is costly, requires manual intervention and is resource/time intensive so they move directly to the Presentation layer.
• In reality, brands do not have the experience/knowledge to know how to use these platforms “contextually” or how to articulate to SaaS Partners how to design/customize them specific to their needs– At the same time, these Partners sales teams are not able to ask the right questions to get there
Data Filtering Layer
Analysis Layer
MeasurementLayer
Planning & Activation
Presentation Layer
Routing Layer
Facebook Twitter YouTube Google Facebook WebsitesBlogs
Major gap between clients and service
providers
Issues
Disconnect between data and
client needs
Trends determined on data that is not
contextual
Decisions made on data that is not
contextual
Measurements made on data that is
not contextual

© 2015 AZBlue | www.AZblueinc.com
AZb
THE ROADMAP TO SUCCESS: MAPPING THE JOURNEY
• Before the SMP can be created, the Brand must create a map of what [they envision] happens, what causes it, how it assessed and ultimately how it resolved & measured.
7
EfficienciesBest
Practices
SWOT
Trend Identification Resources Solution Timelines Tracking Assessment Measurement OptimizationListening
Negative social trending around brand detected
Confirmation that an issue
exists
Determining the type and priority
of the issue
What is needed to resolve the
problem
What is required to execute a
remedy
Based on severity, when it will be resolved
Determining if the solution is
working
Did the process meet the
objectives.
How well did the process work
What lessons were learned to
improve
Who owns the Issue? What is the next step
Trend or
anomaly?
Alarms
triggered?
Pre-set
threshold?
Impacting
/ Valid?Online? Offline? Positive? Negative? Value? ROI?
Actionable?How
severe?Support?SLA’s?
Resources
used well?
Care
PR
Legal
HR
Marketing
Skills? Budget?
Content? Process?
Engagement?
People?
Change?

© 2015 AZBlue | www.AZblueinc.com
AZb
CREATING THE RIGHT SOLUTION
8
OPTIMIZE
BUILD
MANAGE
DESIGN
Visualize the end-state
Imagine
• What is the purpose of the SMP?• What does success look like?• How will it work?• How will success meet/exceeds the needs of the Customer?
• Who will run it on a day-to-day basis?• What assets do you have?• What assets do you need?• Who are the customers and what are
their needs/expectations?• Will it be scalable to meet short-term
and long-terms needs?
Making it work!
Creating the right platform
• How does it work on Day 1+ ?• Is it running efficiently?• Are the customers happy?• Are they receiving value?• Can it be better?• What needs to be altered/added?• What is the growth plan?• Are the right skill sets in-place?
• What technologies exist now?• Is there a workflow in-place?• How do you integrate existing
investments into the platform?• What/who are the right
complimentary tools & partners• What are the priorities in terms
of Day 1 production?• Who owns the process?• Is it internal, external or matrix
managed?
What does it need to get there?
Ideation
Creation
Activation
• What is in-place today?• What are the brands SWOT?• What current assets are available –
tools, technology, people, training & content?
• What investments have been made?• How are things done now (process)?• Are the KPI’s & Metrics applicable
and measureable?• How is [will] success measured?• What is realistic?

© 2015 AZBlue | www.AZblueinc.com
AZb
PROFESSIONAL SERVICES – SMP DESIGN SOLUTIONS
9
Co-Manage
Manage
Consult
Support
Perform a Social Assessment of Client:• Processes• Tools/Technology• Content• Personnel• Reports
Audits
Create a document on assessing their Social:• Processes• Tools/Technology• Content• Personnel• Reports
Provide Monthly Feeds:• Required Data fields to
build ad-hoc SMP Performance Reports
Deliver Benchmarks:• Performance Metrics• KPI Metrics• Objectives Metrics• Competitive SWOT• Industry BIP/Trends
Performance Reporting
Create/Design Reports:• Performance Metrics• KPI Metrics• Objectives Metrics• Competitive SWOT• Industry BIP/Trends
Client SMP:• 2 Week Live “In the
Chair” Training –Customer Site
Deliver Training Programs:• SMP Workflow• Platform Configuration
Training
Create Training Programs:• Social Marketing• Social Care• Social PR• Social Sales
Service Provider SMP:• 2 Week Live “In the
Chair” Training - NYC
Command Center:• Daily Operations
Command Center:• Planning• Design• Build• Integration• Evolution/Upgrade
SMP/COE
Create Recommendations:• Technology Needs• Staffing Needs• Operational Processes• Workflow• SMP Evolution to COE• Business Continuity
Command Center:• Daily Operations
Lead workshops on:• Social Processes &
Enterprise Integration
Optimization
Create Recommendations:• Enterprise Social
Strategy (SMP/COE)• Organizational
Integration
Remote SMP?
Design, Build & Run SMP with Client Team:• Tools/Technology• Content• Personnel• Reports
Design, Build & Run SMP:• Tools/Technology• Content• Personnel• Reports
Technology/ Platform
Design & Recommend SMP:• Tools/Technology• Content• Personnel• Reports
Design, Build & Support SMP Client Team:• Tools/Technology• Content• Personnel• Reports
© 2015 AZBlue | www.AZblueinc.com
AZb
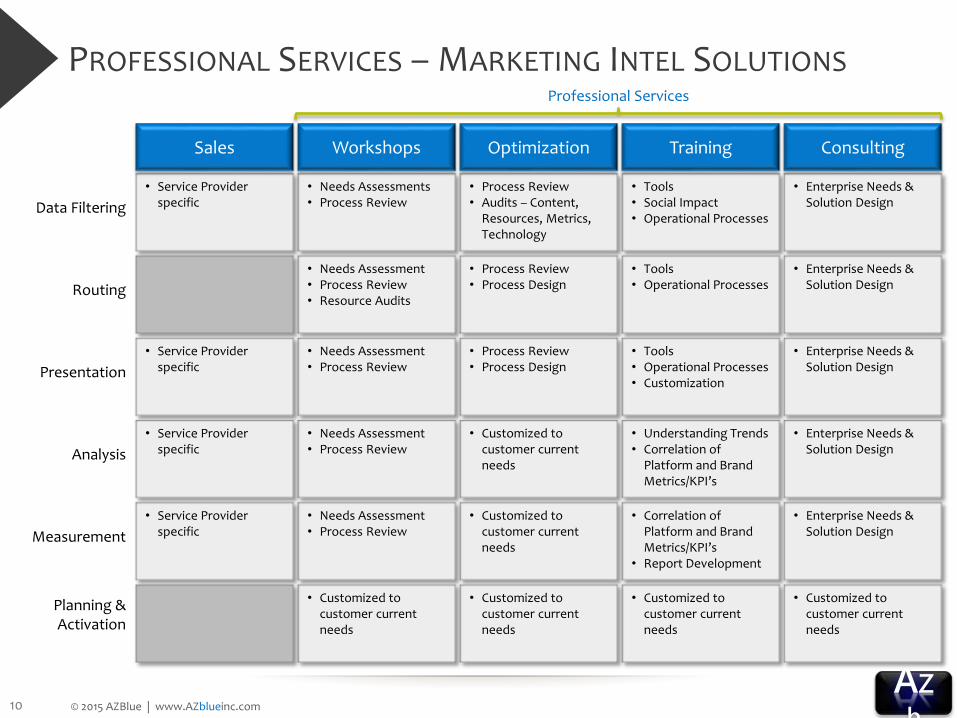
PROFESSIONAL SERVICES – MARKETING INTEL SOLUTIONS
10
• Tools• Social Impact• Operational Processes
Training
• Tools• Operational Processes
• Tools• Operational Processes• Customization
• Understanding Trends• Correlation of
Platform and Brand Metrics/KPI’s
• Correlation of Platform and Brand Metrics/KPI’s
• Report Development
• Customized to customer current needs
• Process Review• Audits – Content,
Resources, Metrics, Technology
Optimization
• Process Review• Process Design
• Process Review• Process Design
• Customized to customer current needs
• Customized to customer current needs
• Customized to customer current needs
• Needs Assessments• Process Review
Workshops
• Needs Assessment• Process Review• Resource Audits
• Needs Assessment• Process Review
• Needs Assessment• Process Review
• Needs Assessment• Process Review
• Customized to customer current needs
• Service Provider specific
Sales
• Service Provider specific
• Service Provider specific
• Service Provider specific
Data Filtering
Routing
Presentation
Analysis
Measurement
Planning & Activation
Professional Services
• Enterprise Needs & Solution Design
Consulting
• Enterprise Needs & Solution Design
• Enterprise Needs & Solution Design
• Enterprise Needs & Solution Design
• Enterprise Needs & Solution Design
• Customized to customer current needs

© 2015 AZBlue | www.AZblueinc.com
AZb
PERFORMANCE REPORTS
11
Ad-Hoc Reports
Trend Analysis – Ad-hoc report on specific issues that are trending and require resolution
Event Timeline – Event timeline reviewing start and end of events and actions taken and timeframes each step of workflow occurred and was completed.
Resolution Case Study – Detailed version of Timeline report with narrative for Enterprise-wide analysis and public sharing
SMP Value Analysis – A comparative analysis of the issues (sentiment) before and after the issue has been resolved to determine the impact of the SMP process on the overall solution
SMP Workload Measurements (Benchmarks)
Sentiment Rate – Normal Mode Sentiment Levels to establish Alert Thresholds
Alert Rate – Total Alerts raised
Tracking Rate – Total Posts Tracked/Confirmed
Qualification Rate – Total Posts Qualified by Standard & Non-standard)
Value Rate – Total Posts Accepted & Not Accepted
Categorization Rate – Total Posts Categorized by each Tag (e.g. Care, Brand etc.)
Triage Rate – Total Posts Categorized by each Flag (e.g. Level 1, 2 etc.)
Routing Rate – Total Posts Routed
Escalations Rate – Total Number of Posts Escalated
Follow Up Rate – Total Posts Confirmed & Tracked
Engagement Rate – Total Posts Requiring Engagement
Completion Rate – Total Posts Closed
Non-Completion Rate – Total Posts Still Open
SMP Performance/MBO Metrics
Confirmation Ratio - Ratio of posts Tracked & Confirmed vs. Total Alerts = % of the total
Qualification Ratio – Ratio of posts qualified as Standard and Non-standard = % of the total
Value Ratio – Ratio of posts qualified by each Value Assignment (Work/Don’t Work) = % of the total
Categorization Ratio – Ratio of posts qualified by each Tag (e.g. Brand, Customer Care etc.) and expressed as a % of the total
Triage Ratio – Ratio of posts qualified by each Flag (Level 1 - 5) = % of the total
Routing Ratio – Total Number of Issues Routed by day or Category = % of the total
Response Time (Avg.) – Average time per response to a) receipt, b) acknowledgement and c) resolution
Escalation Ratio – Total number of posts escalated vs. normal routing and resolution posts expressed as a % of the total.
Commitment Ratio – Total number of commitments met (Triage Level) vs. not met
Commitment Scorecard – Total number of commitments met (by Priority and SLA) vs. not met expressed by a grade of “Fully Met,” “Partially Met” and “Missed.”

© 2015 AZBlue | www.AZblueinc.com
AZb
PERFORMANCE REPORTS
12
Ad-Hoc ReportsSMP Workload Measurements
(Benchmarks)SMP Performance/
MBO Metrics
Completion Ratio – Total number of posts Closed vs. Open = % of the total
Completion Scorecard – Grading System/Scorecard – Showing percentages of each of the five categories with A=Close Resolved and F= Open Unresolved
First Post Resolution (FPR) – Total number of Issues resolved on first engagement vs. required follow-up = % of the total
Resource Utilization – Ratio of Total Hours expressed as a percentage of each of the 5 Post Status’ (e.g. 32 Hours/Closed – Resolved Issues)
Resource Productivity – Ratio of Total Expense/Budget expressed as a percentage of each of the 5 Post Status’ (e.g. $57/Closed – Resolved Issues)
SMP Productivity – Ratio of Total Hours expressed as a percentage of Total Posts Tracked vs. Resolved (e.g. 32 Hours/Non-standard Issues or Engagements etc.)
SMP ROI – Ratio of Total Expense/Budget expressed as a percentage of Total Posts Tracked vs. Resolved (e.g. $57/Non-standard Issues or Engagements etc.)

© 2015 AZBlue | www.AZblueinc.com
AZb
Strategy without tactics is the slowest route to victory. Tactics without strategy is the noise before defeat – General Sun Tzu
azurite blue inc. - we are a consulting firm that has the
experience and ability to help clients articulate their needs
with regards to “all things social,” and create an operational
roadmap to get there!
More importantly, we help design strategies that are based upon executable
tactics and tactics that support achievable strategies!
Contact: Jim Clark – 908-305-8475
www.linkedin.com/in/azblue/


