67

• Director, Digital Engagement and Social Media - CDW
• Background: Advertising, Brand Management, Analytics, CRM and Sales
• Industry Recognitions: Women to Watch in BtoB Marketing: FierceCMO; Top 25 Digital Marketers BtoB Magazine; 10 Hottest Digital Marketers 2013- iMedia
• Passion: Volunteering and Photography
• Name
• What do you do?
• Why are you here?
Tell me about you

Social Media is easy. Doing it well is hard.
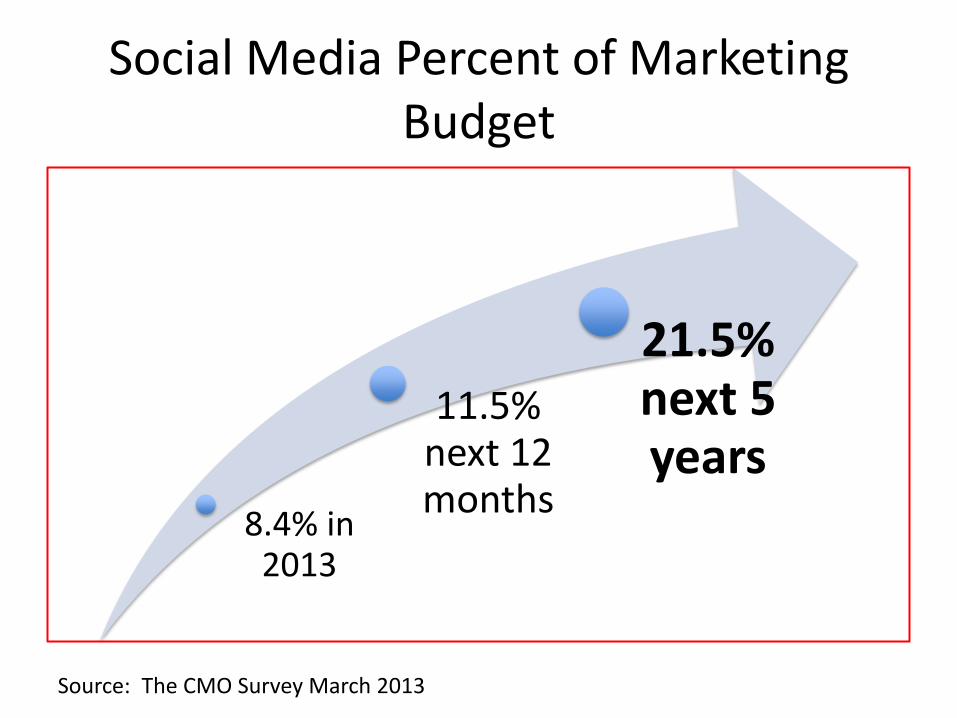
Social Media Percent of Marketing Budget
8.4% in 2013
11.5% next 12 months
21.5% next 5 years
Source: The CMO Survey March 2013


If you could only learn one thing….

4 Key Takeaways:
1. C-Suite View of Social Media
2. The 6 Value Areas of Social Media.
3. How to think about measuring the impact of Social Media.
4. Tools and Platforms for Measureable Social Media Programs

C-Suite view of social media is evolving
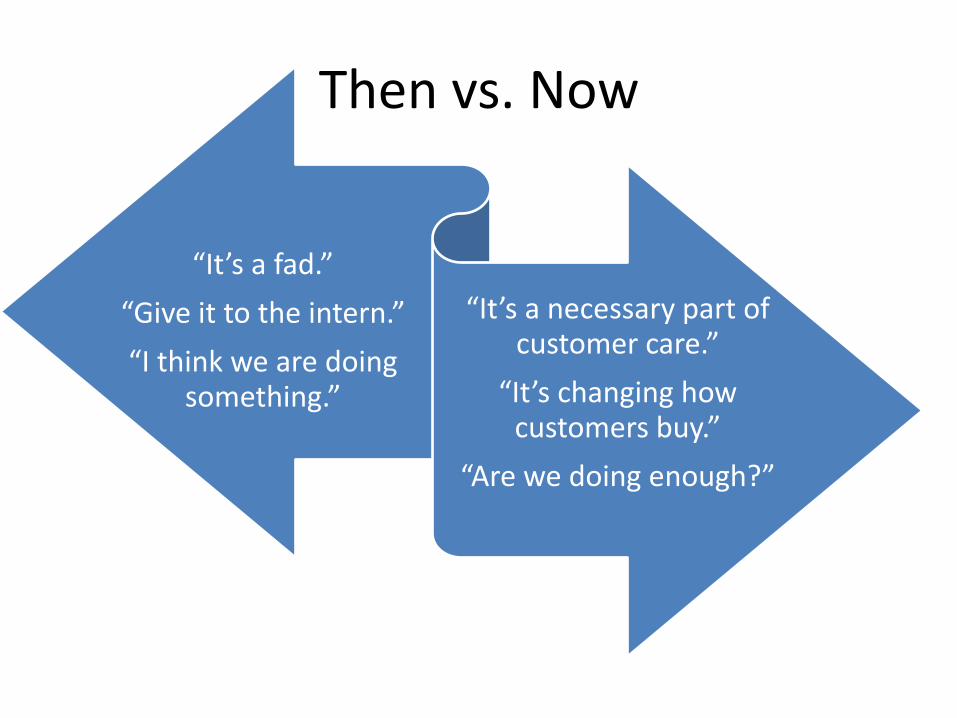
Then vs. Now
“It’s a fad.”
“Give it to the intern.”
“I think we are doing something.”
“It’s a necessary part of customer care.”
“It’s changing how customers buy.”
“Are we doing enough?”
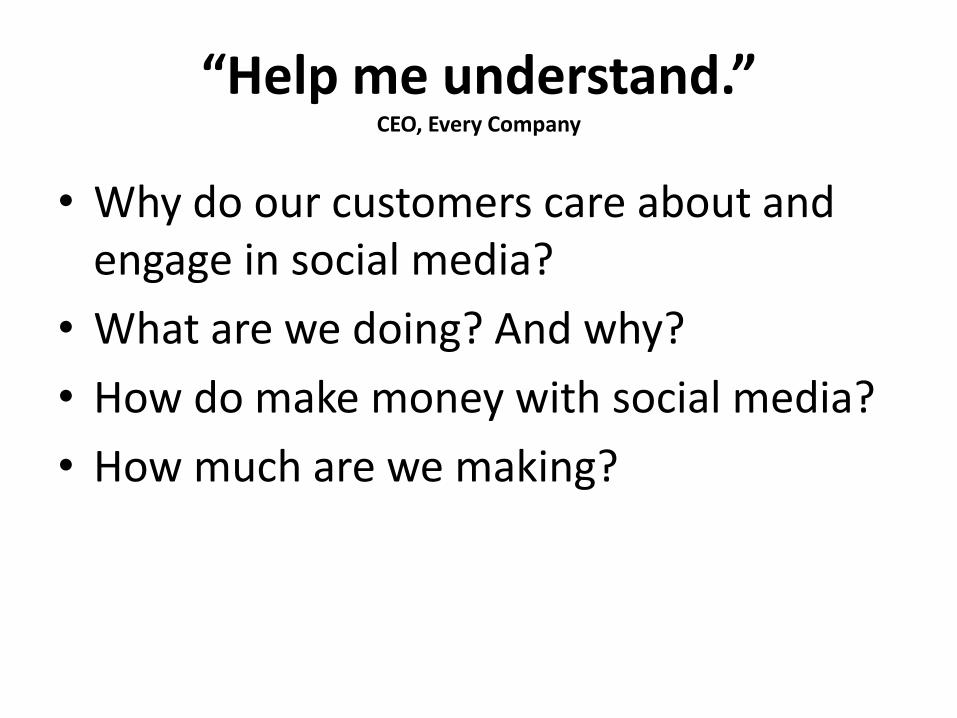
“Help me understand.” CEO, Every Company
• Why do our customers care about and engage in social media?
• What are we doing? And why?
• How do make money with social media?
• How much are we making?

Define “Social Media”
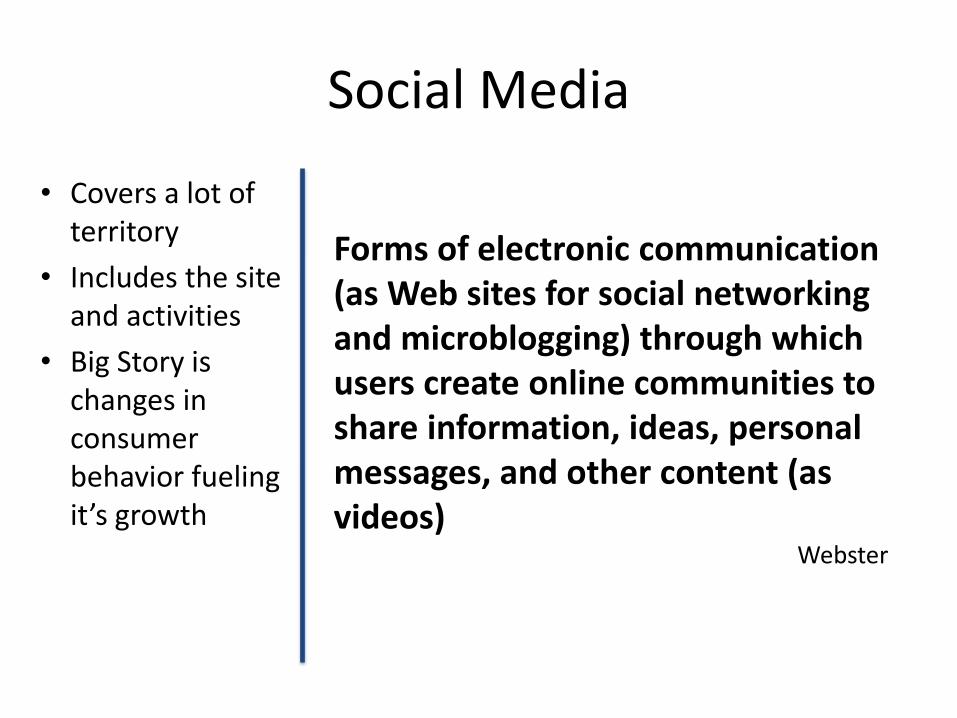
Social Media
• Covers a lot of territory
• Includes the site and activities
• Big Story is changes in consumer behavior fueling it’s growth
Forms of electronic communication (as Web sites for social networking and microblogging) through which users create online communities to share information, ideas, personal messages, and other content (as videos)
Webster

Impact. It’s relative.

Fight fire with fire. Be strategic.
Exercise #1
Marketing Objectives
1. ____________________________
2. ____________________________
3. ____________________________
4. ____________________________
5. ____________________________
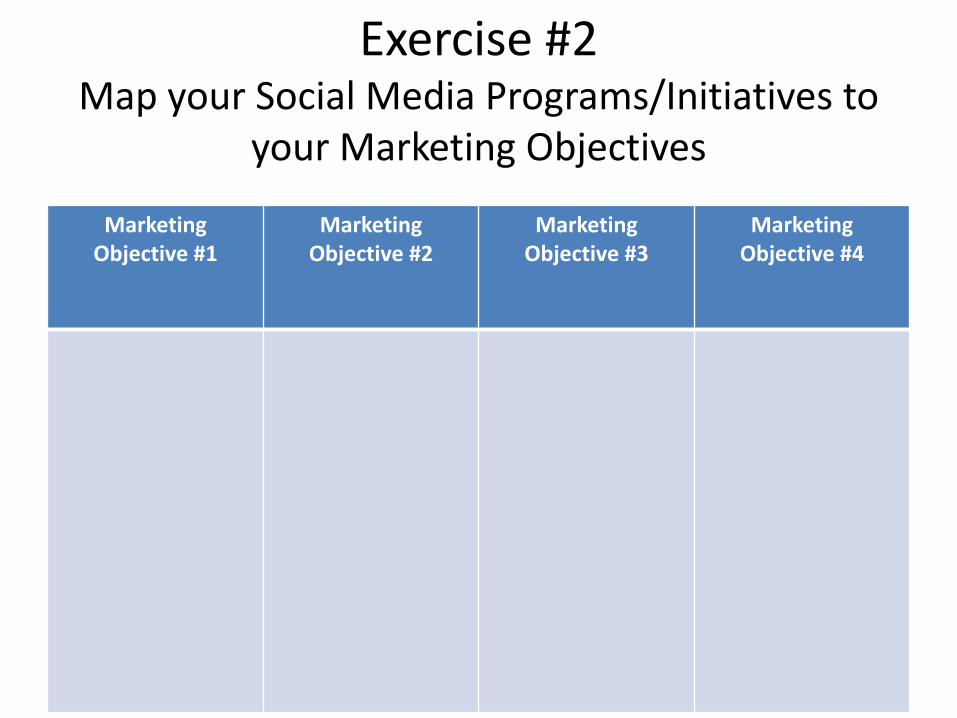
Marketing Objective #1
Marketing Objective #2
Marketing Objective #3
Marketing Objective #4
Exercise #2 Map your Social Media Programs/Initiatives to
your Marketing Objectives
Every tactic does not deliver immediate revenue; but it should put us on the path.

6 Social Media Value Driver
Areas
Insight
Awareness
Perception
Revenue
Advocacy
Operational Efficiency

1. Insight

Insight = Voice of the Customer
Demonstrate relevant and actionable information that was gleaned exclusively via social media.
Insight = Voice of the Customer
Demonstrate relevant and actionable information that was gleaned exclusively via social media.

Definition: Social Media Listening
Social media listening, also known as social media monitoring, is the process of identifying and assessing what is being said about a company, individual, product or brand.

Common Monitoring Metrics and Learnings
Metrics So What?
Followers Monitor social interest in the brand
Engagement • Strength and Appeal of posts/conversations • Differences by platform
Content Engagement Trends Content creation input
Daypart Engagement Trends Improve engagement rates and increase program efficiency
Mentions Volume of WOM (along with reach) Share of Voice relative to the competition
Influencers Who’s talking? Who’s voice carries? Should we find ways to engage them?
Topic Trends Volume of conversation about a topic. What is being said.

Listening for Solution Insights
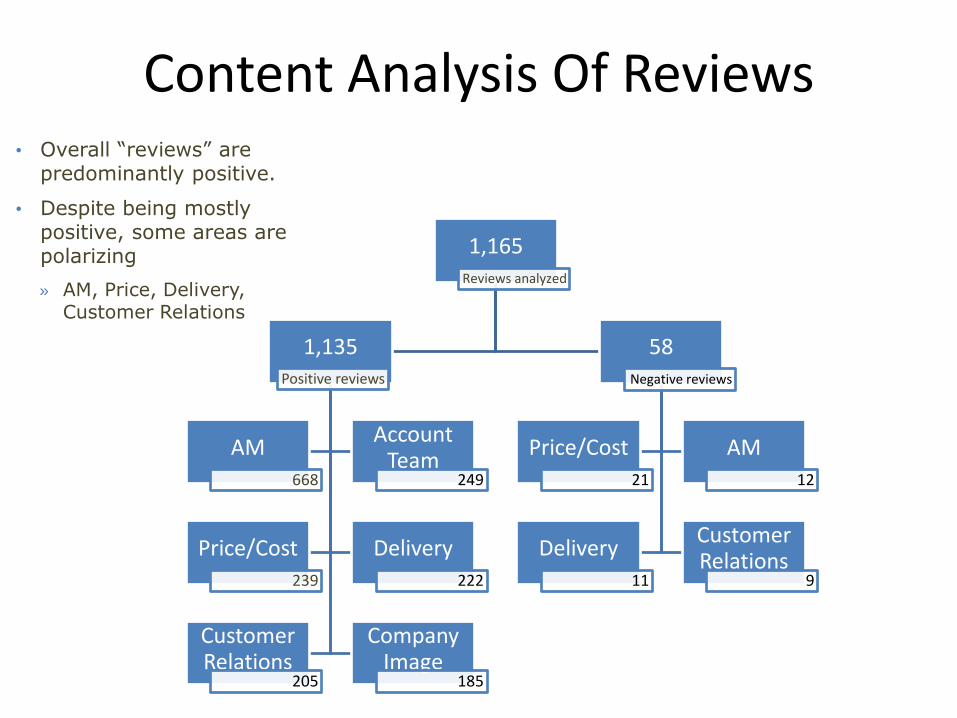
Content Analysis Of Reviews
1,165 Reviews analyzed
1,135 Positive reviews
AM
668
Account Team
249
Price/Cost
239
Delivery
222
Customer Relations
205
Company Image
185
58 Negative reviews
Price/Cost
21
AM
12
Delivery
11
Customer Relations
9
• Overall “reviews” are predominantly positive.
• Despite being mostly positive, some areas are polarizing
» AM, Price, Delivery, Customer Relations

Content Analysis of Reviews. So What?
• Sales Implication: – Rethink Account Manager Productivity Metrics
• Training Implication: – Examples of what the customer values
– Service delivery prioritization
• Creative Implication: – Quotes and verbatims for copy support
• Paid Social Implication: – Authentic posts as creative

2. Awareness

Awareness
Show that brand/product awareness and consideration is higher among social media users in general or our social media followers in particular.

Brand Awareness Study
• Include social media related questions in your Brand Awareness Tracking Survey such as: – Do you use social media for _________?
– Do you engage with [brand/product] via social media on at least one platform?
– Which platforms do you engage with [brand/product] on?
– How frequently do you engage with [brand/product]
– What actions do you take after engaging with [brand/product] on social media?
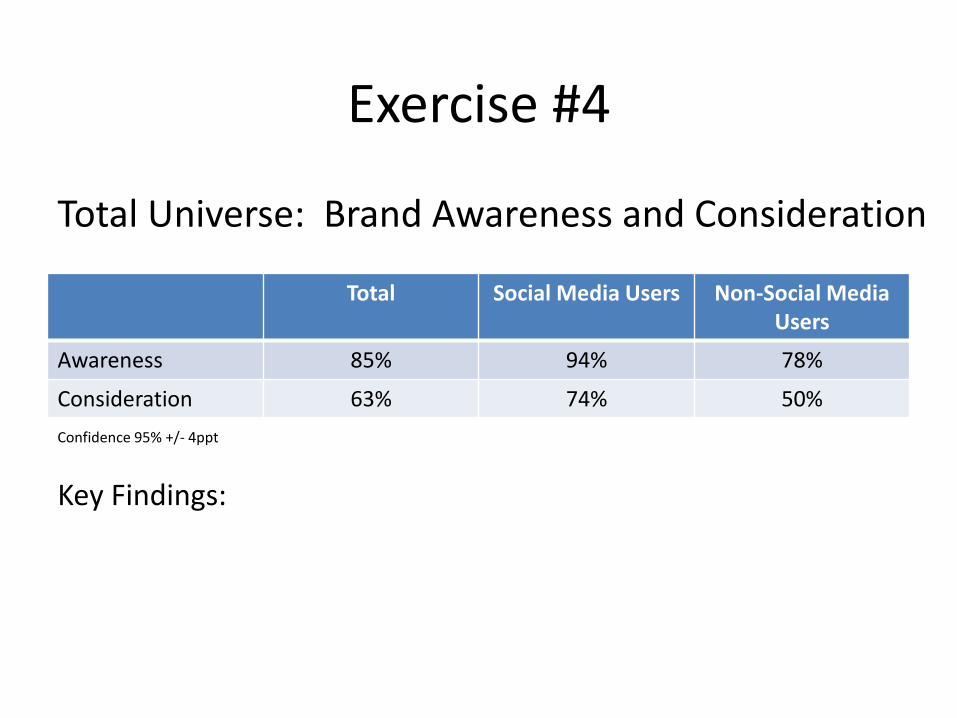
Exercise #4
Total Social Media Users Non-Social Media Users
Awareness 85% 94% 78%
Consideration 63% 74% 50%
Confidence 95% +/- 4ppt
Key Findings:
Total Universe: Brand Awareness and Consideration

Exercise #5
Total Brand Social Media
Engagers
TV Email Print
Consideration 63% 75% 78% 62% 55%
Confidence 95% +/- 4ppt
Key Findings:
Those aware of brand
Brand Consideration By Marketing Vehicle
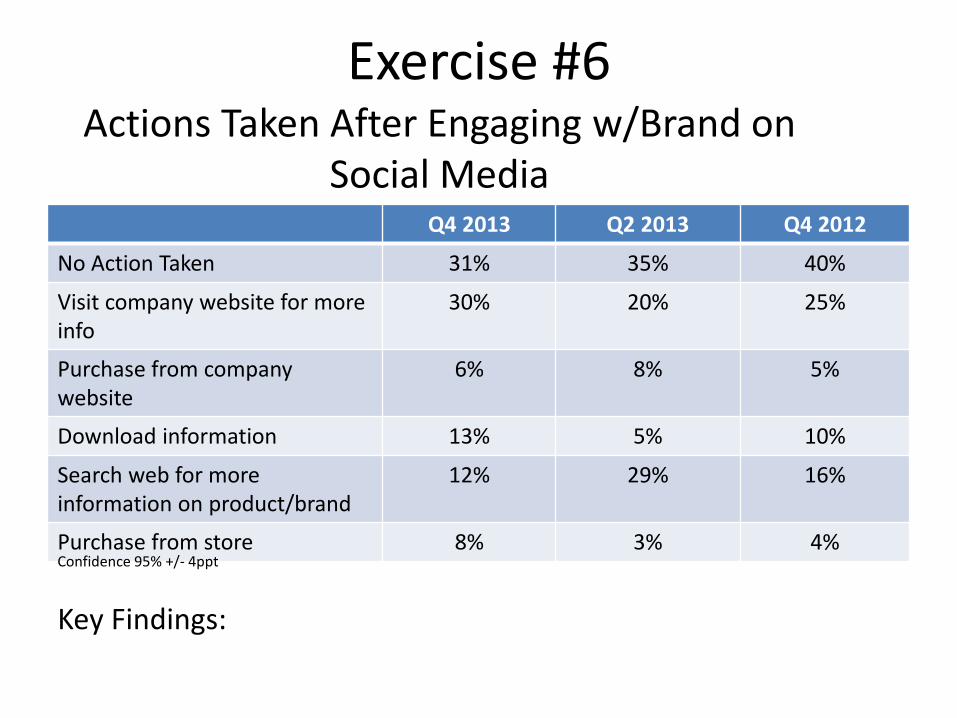
Exercise #6
Q4 2013 Q2 2013 Q4 2012
No Action Taken 31% 35% 40%
Visit company website for more info
30% 20% 25%
Purchase from company website
6% 8% 5%
Download information 13% 5% 10%
Search web for more information on product/brand
12% 29% 16%
Purchase from store 8% 3% 4% Confidence 95% +/- 4ppt
Key Findings:
Actions Taken After Engaging w/Brand on Social Media
3. Perception

Perception
Show that social media engagers have a more positive perception of the brand than non-social media engagers. Explore the difference in perception compared to other tactics.
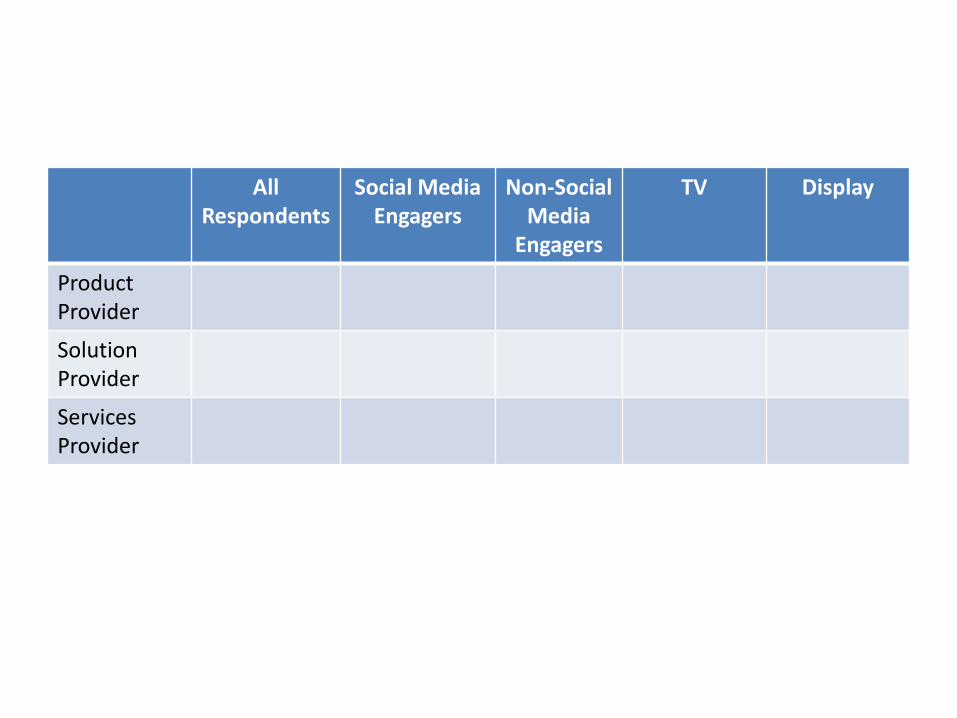
All Respondents
Social Media Engagers
Non-Social Media
Engagers
TV Display
Product Provider
Solution Provider
Services Provider
Exercise 7
• List three attributes or perceptions that are important to your brand.
– ______________________
– ______________________
– ______________________
4. Revenue
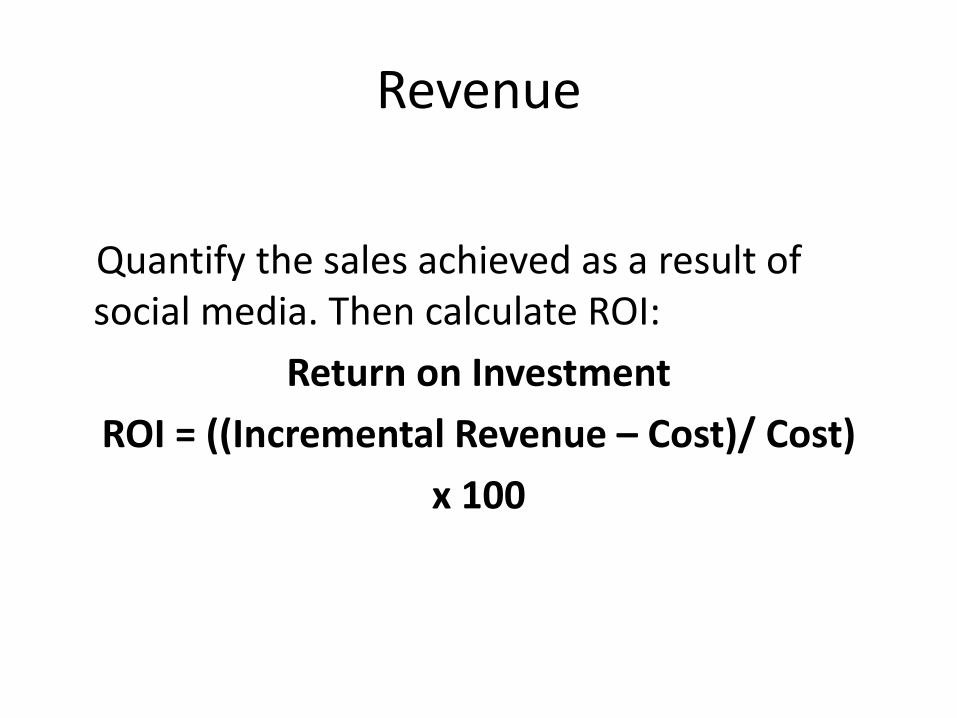
Revenue
Quantify the sales achieved as a result of social media. Then calculate ROI:
Return on Investment
ROI = ((Incremental Revenue – Cost)/ Cost)
x 100

Hypothesis
• Social Media engagers (people that clicked on a post link) have a higher likelihood of purchasing
– Aware of the brand by virtue of Followers or noticing the brand in their newsfeed
– Consideration by virtue of trusting messages and content from our brand

SharegraphTM - PATENTED AUDIENCE AMPLIFICATION
• ShareGraphTM is proprietary software that:
• Utilizes a variety of algorithms to analyze user behaviors and interactions
• Maps user behaviors to identify users who are closely connected to your audience
• Amplifies these segments to create a unique and large scale enhanced audience
• Improves ad targeting and content personalization
SEED AUDIENCE
SOCIAL CONNECTIONS/SIGNALS OF INTENT
ANONYMOUS DIGITAL PERSONAS
SCALED RELEVANT AUDIENCE
ShareGraphTM expands a small seed audience into a large, relevant, targetable new audience.

New audiences through modeling
Social Engager Lift

Social Media Revenue Metrics
Measure traffic to product/landing pages
• Coremetrics or Omniture
Coupons/Promotional Codes
• Redemption
Content Lead Generation
• # of Leads
• Cost Per Lead
• Conversion Rate
• Conversion Revenue

Social Media Revenue Metrics
On-Domain Product Review
• Incremental cart conversion when viewing a page with a review
• Incremental Revenue
On-Domain Video
• Page Conversion Lift
• Incremental Revenue
Community Value
• Overlap Analysis
• Single Sign-on
• Average Customer Value Comparison
• Customer Growth Rate Comparison

5. Advocacy
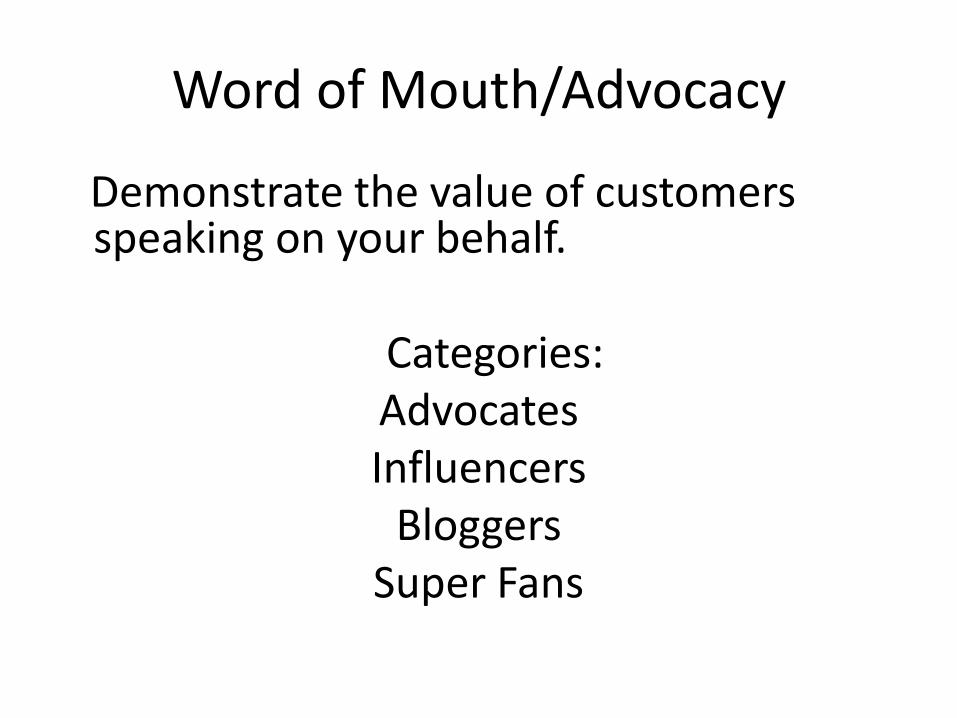
Word of Mouth/Advocacy
Demonstrate the value of customers speaking on your behalf.
Categories:
Advocates Influencers
Bloggers Super Fans
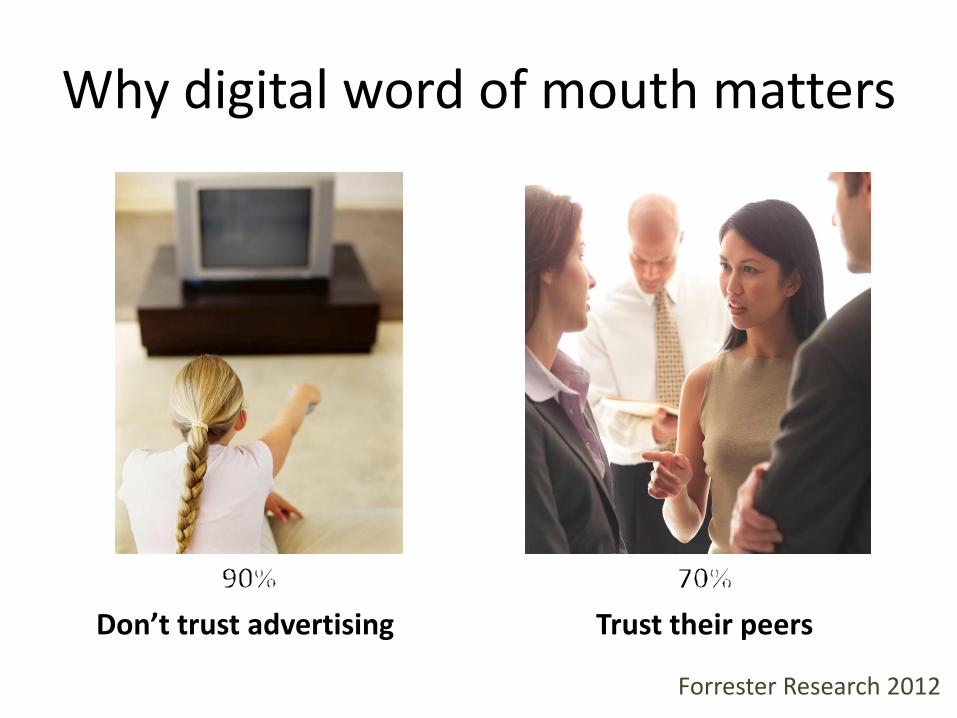
Why digital word of mouth matters
Don’t trust advertising. Trust their peers
Forrester Research 2012

Advocate Word of Mouth
Brand sends message to Lauren
“Lauren, refer your friends”
Share this $50 off coupon with your friends. You’ll get $50 off your next purchase for each friend who purchases.
Lauren sends message and offer to friends
“Check this out”
You’ll love this. Plus, you’ll get $50 if you buy this by June 1. Use my personal referral code: A123
Link to brand’s online store or other “buy page”
Friends click through to brand’s online store or other “buy page”
Enter referral code:
“Order this product now”
Brand gives credit to Lauren once referred friend has purchased product
A123
49

Notes about Case Studies
• Each Advocate was given unique personal referral code
– This allows us to track referrals and sales back to individual Advocate
• # impressions is calculated as follows:
– # Advocates x 150 people reached
– Source for # people reached by Advocates: Forrester Research
• Incentives were provided to encourage referrals
50

Consumer Electronics Mfr Item Amount
# Customers invited to refer friends 500,000
# Advocates “Advocate” is a customer who referred at least one friend. About 11% customers served as Advocates.
53,494
Total # prospects referred # prospects who visited web site or landing page directly from Advocate referral
76,693
Ave. # prospects referred per Advocate 1.4
# Units Sold # units sold as result of Advocate referral
766
Conversion rate 766 units sold divided by 76,693 prospects referred
1%
Sales Value: Revenues Ave. revenue per unit sold $500
$383,000
Media Value: Impressions Value per impression: 25 cents x 8 million impressions
$2,006,025
Total Campaign Value $2,389,025
Total Campaign investment Includes fees paid to Advocate marketing company; referral incentives; promotional costs
$100,000
ROI 23X
Notes: 60-day campaign; Advocates were entered into a $10,000 drawing 51

Business Software Company Item Amount
# Customers invited to refer friends 1,000,000
# Advocates “Advocate” is customer who referred at least one friend. About 7% served as Advocates.
70,253
Total # prospects referred # prospects who visited web site or landing page directly from Advocate referral
132,681
Ave. # prospects referred per Advocate 1.9
# Units Sold # software units sold as result of Advocate referral
1,552
Conversion rate 1,552 units sold divided by 132,681 prospects referred
1.1%
Sales Value: Revenues Ave. revenue per unit sold $300
$465,600
Media Value: Impressions Value per impression: 50 cents x 10.5 million impressions
$5,250,000
Total Campaign Value $5,715,600
Total Campaign investment Includes fees paid to Advocate marketing company; referral incentives; promotional costs
$125,000
ROI 45X
Notes: 90-day campaign; Advocates were entered into a drawing for Hawaii trip, valued at $10,000 52
53
1. Compelling incentives
2. Rewards for Advocates and referred friends
3. Meaningful offers
4. Make it easy for Advocates to refer
5. Pro-active promotion
6. Track and optimize program
Six Referral Marketing Best Practices
www.zuberance.com

54
Learn More
Subscribe www.zuberance.com

Employee Advocacy
Amplify the “voice” of your employee advocates helping them increase their personal brand while distributing relevant content on social media

Employee Advocacy
Increase the reach of brand related content
Quantify Earned Media
Quantify Offer Conversion
Increase traffic to your site
Higher Engagement Rates

6. Operational Efficiency
Operational Efficiency
Demonstrate that costs are lower, service is quicker or
communication is more efficient with social media. This is due to the efficient flow of information between information seekers and sharers.
This is true inside the company: employee to employee. And outside of the company: -employees to customers -brand to customers

Impact Examples
Cost to Serve
Customer Service
Time Savings
Internal Social
Networks i.e. Chatter or Yammer
Media Efficiency
Value of Earned
Impressions
Lower Cost Per Click,
Per Engagement or Per Lead

Social Media is easy. Doing it well is hard.

5 Social Media Measurement Tips for Success
1. Align programs to your business objective
2. Identify key metrics before you start
3. Set goals whenever possible
4. Know why something worked or didn’t work. It’s the key to improving.
5. Don’t keep social media in the “Marketing Silo”. Identify ways your efforts can impact other parts of the business.

4 Key Takeaways:
1. C-Suite View of Social Media
2. The 6 Value Areas of Social Media.
3. How to think about measuring the impact of Social Media.
4. Tools and Platforms for Measureable Social Media Programs

Questions?

Stay In Touch! @lmccadney
laurenmccadney@sbcglobal linkedin.com/in/laurenmccadney

Appendix Scorecards and Dashboard


