+ All Categories
Home > Documents > Social media, sentiment and public opinions: Evidence from ... · social media. Bots have a...

Social media, sentiment and public opinions: Evidence from ... · social media. Bots have a...

Date post: 26-May-2020
Category:
Upload: others
View: 6 times
Download: 0 times
Share this document with a friend
40
1 Social media, sentiment and public opinions: Evidence from #Brexit and #USElection Yuriy Gorodnichenko University of California, Berkeley Tho Pham Swansea University Oleksandr Talavera* Swansea University First draft: 17.01.2017 Current draft: 26.04.2018 Abstract: This paper studies information diffusion in social media and the role of bots in shaping public opinions. Using Twitter data on the 2016 E.U. Referendum (“Brexit”) and the 2016 U.S. Presidential Election, we find that diffusion of information on Twitter is largely complete within 1-2 hours. Stronger interactions across agents with similar beliefs are consistent with the “echo chambers” view of social media. Bots have a tangible effect on the tweeting activity of humans but the degree of bots’ influence depends on whether bots provide information consistent with humans’ priors. Overall, our results suggest that the aggressive use of Twitter bots, coupled with the fragmentation of social media and the role of sentiment, could contribute to the vote outcomes. JEL classification: D70; D72; L86 Keywords: Brexit; U.S. Election; Information diffusion; Echo chambers; Political Bots; Twitter * Corresponding author. School of Management, Swansea University, Bay Campus, Fabian Way, Swansea, SA1 8EN. E-mail: [email protected]. The standard disclaimer applies. We are grateful to participants of the 2017 Royal Economics Society Conference, the 12 th Annual Conference - Warsaw International Economic Meeting, and the 15 th Annual Media Economics Workshop for comments.
Transcript

1

Social media, sentiment and public opinions: Evidence from

#Brexit and #USElection

Yuriy Gorodnichenko

University of California, Berkeley

Tho Pham

Swansea University

Oleksandr Talavera*

Swansea University

First draft: 17.01.2017

Current draft: 26.04.2018

Abstract: This paper studies information diffusion in social media and the role of

bots in shaping public opinions. Using Twitter data on the 2016 E.U. Referendum

(“Brexit”) and the 2016 U.S. Presidential Election, we find that diffusion of

information on Twitter is largely complete within 1-2 hours. Stronger interactions

across agents with similar beliefs are consistent with the “echo chambers” view of

social media. Bots have a tangible effect on the tweeting activity of humans but

the degree of bots’ influence depends on whether bots provide information

consistent with humans’ priors. Overall, our results suggest that the aggressive use

of Twitter bots, coupled with the fragmentation of social media and the role of

sentiment, could contribute to the vote outcomes.

JEL classification: D70; D72; L86

Keywords: Brexit; U.S. Election; Information diffusion; Echo chambers; Political Bots; Twitter

* Corresponding author. School of Management, Swansea University, Bay Campus, Fabian Way,

Swansea, SA1 8EN. E-mail: [email protected]. The standard disclaimer applies.

We are grateful to participants of the 2017 Royal Economics Society Conference, the 12th Annual

Conference - Warsaw International Economic Meeting, and the 15th Annual Media Economics

Workshop for comments.

2

1. Introduction

The rise of Internet has changed the way people communicate and acquire information. Recent

years have witnessed a decline in the traditional news media consumption (Stempel et al., 2000)

while the number of online news users soars (Gottfried and Shearer, 2016; Bialik and Matsa, 2017).

Among different types of Internet-based media, social network has become an increasingly

important information source for many people. Through social media, individuals can have instant

and open access to news and narratives and can build networks to interact and share opinions. Key

questions are how this communication revolution has influenced information flows across

individuals and how one can influence these flows.

We attempt to answer this question by examining information dissemination in social

media and using recent developments in the U.K. (2016 E.U. Referendum) and the U.S. (2016

Presidential Election) as two natural experiments. These two events were extremely high-profile

so that people paid as much attention to these as one may reasonably expect. In addition, these

experiments are “clean” in the sense that platforms in these plebiscites were diametrically opposed,

which allows us to separate providers of information as well as consumers of information.

In this exercise, we identify sources of information that might have been used to shape

public opinions. Specifically, we study two types of social media agents: real (“human”) users and

social bots, computer algorithms used to produce automated content. Bots can create new bits of

information and a sense of consensus in the society that is favorable for a given candidate/outcome.

We use these bots as a source of variation in people’s information sets and see how this information

influences “humans”, how it is spread across “humans”, and how the sentiment (tonality) of bots’

messages affects “humans”.

Data employed in this study were collected using Twitter Streaming Application

Programming Interface (API).1 Twitter is one of the most popular microblogging platforms with a

significant number of users. For example, as of 2016, the number of U.K. Twitter users is estimated

at 15.8 million while the number of U.S. Twitter users is about 67 million (Benoit, 2017). Given

this popularity, Twitter generates an enormous quantity of legally available data for research.2

1 Twitter streaming API is a developer tool that allows collecting a random sample of real-time tweets with pre-defined

attributes (e.g. keywords, usernames, or hashtags). See for details https://developer.twitter.com/en/docs/tweets/filter-

realtime/guides/powertrack_rules_and_filtering, accessed on April 27, 2018. 2 In contrast to Cambridge Analytica/Facebook case, out data are collected directly from Twitter and the collection

process does not breach any terms and condition of Twitter development tools.

3

These data include records of the users, tweets, and their metadata that allow us to track tweeting

activities of different types of Twitter agents (bots and humans). Additionally, compared to other

social network sites, Twitter’s connections are more about connecting with people for information

sharing purposes rather than personal interactions (Gruzd et al., 2011). Hence, one would expect

to see clear information flows as well as different information clusters during important political

events on Twitter. Furthermore, Twitter is used by people with extreme views whose voices are

often invisible in the mainstream media. Thus, data from Twitter could give us a broader picture

about public opinions during the EU Referendum in the U.K. and the 2016 U.S. Presidential

Election beyond what we can observe from the traditional media.

We find that information about the Brexit and the 2016 U.S. Presidential Election is

disseminated and absorbed among Twitter users within 50-70 minutes. This suggests that

information rigidity could be very low for critically important issues with wide coverage or that

news cycles in social media are short-lived. We also observe the differential impact of tweeting

activities by user type. For example, “remain” supporters in the Brexit Referendum respond

stronger and faster to messages created by other “remain” supporters when compared with the

reaction to messages from “leave” supporters. Furthermore, human tweeting activity could be

influenced by bots. The degree of influence depends on whether a bot provides information

consistent with the priors of a human. For instance, a bot supporting the “leave” campaign has a

stronger impact on a “leave” supporter than a “remain” supporter. Similarly, Trump supporters are

more likely to react to messages spread by pro-Trump bots. Further examination shows that the

sentiment of tweets plays an important role in how information is spread: a message with positive

(negative) sentiment generates another message with the same sentiment. These results provide

evidence consistent with the “echo chambers” effect in social media, that is, people tend to select

themselves into groups of like-minded people so that their beliefs are reinforced while information

from outsiders might be ignored. Therefore, social media platforms like Twitter could enhance

ideological segmentation and make information more fragmented rather than more uniform across

people. Finally, we provide a quantitative assessment of how bots’ traffic contributed to the actual

vote outcomes. Our results suggest that, given narrow margins of victories in each vote, bots’ effect

was likely marginal but possibly large enough to affect the outcomes.

This study is related to several strands of research. The first strand has assessed the influence

of news media on the economic and political outcomes. For example, Tetlock (2007), Engelberg and

4

Parsons (2011), and Chen et al. (2014) show that media coverage of a company’s stock is

significantly related to future stock prices and trading volume. Media exposure could also have

impacts on political outcomes or voter behaviors. Gerber et al. (2009) find that subscription to either

Washington Post or Washington Times increases the support for Democratic candidates. Similarly,

DellaVigna and Kaplan (2007) suggest that the introduction of Fox News channel increases the vote

shares of Republican candidates as well as increases voter turnout. In contrast, the introduction of

television which has less political coverage leads to a decline in political knowledge and thus turnout

rates (Gentzkow, 2006). We contribute to this literature by examining information flows in online

media. To the best of our knowledge, our paper is among very few studies that empirically

investigate the influence of information consumption in social media on political outcomes.

The strong impact of news content documented in the first strand has motivated the second

strand which examines the motivations of news and information consumption. Some papers suggest

the ideological segregation that people tend to select themselves into group of like-minded people

so their beliefs are reinforced (see, e.g., Mullainathan and Shleifer, 2005; Halberstam and Knight,

2016). This view holds for political communication when individuals are more likely to expose to

news and information consistent with their political views (Adamic and Glance, 2005; Garrett,

2009a; Gruzd and Roy, 2014; Hong and Kim, 2016). However, Gentzkow and Shapiro (2011)

suggest that although ideological segregation does exist in both online and offline news

consumption, the level of polarization is low. In other words, exposure to information reinforcing

individuals’ pre-existing views does not shield them from following information that they disagree

with (Hargittai et al., 2008; Garrett, 2009b; DellaVigna et al., 2014). Our contribution to this strand

of research is in documenting interaction across different groups of users at high frequencies.

The third strand of research investigates the role of sentiment in the transmission of

information (e.g., Heath, 1996; Chen and Lurie, 2013). In political discourse on Twitter, it is

observed that tweets containing a high degree of emotionality reach wider readership and are more

likely to be disseminated (Kim and Yoo, 2012; Dang-Xuan et al., 2013; Stieglitz and Dang-Xuan,

2013). There is also evidence for the negativity bias in information consumption that people react

faster to the information having emotionally negative tone (e.g., Baumeister et al., 2001). For

example, Meffert et al. (2006) find the existence of negativity bias in voters’ information selection,

processing and recall during a political campaign. However, it is not always the case. During the

2012 U.S. General Election, voters are more exposed to the content mentioning their favorite

5

candidates with positive sentiment (Halberstam and Knight, 2016). In a contribution to this line of

research, we show how sentiment intensity of messages posted by bots influences reactions of

“human” users.

This paper also contributes to the fourth strand of literature on the presence of bots in social

media. It has been documented that social bots become increasingly sophisticated and can mimic

human behaviors, making bots detection more difficult (Ferrara et al., 2016; Haustein et al., 2016). We

contribute to this literature by documenting the behavior of bots as well as their influence on humans.

The rest of this paper is organized as follows. In the next section, we describe the dataset

and how we collected data. Section 3 presents our empirical strategy and results. Section 4

concludes and provides implications.

2. Data

This section describes how data were collected and filtered and presents a summary of the dataset.

We distinguish the tweeting activities of bots and humans to examine later how these two types of

agents interact. Next, we perform the sentiment analysis and classify the tone of a tweet into

positive, neutral, or negative. Finally, we explore the power of tweeting intensity to predict

outcomes of the E.U. Referendum and the 2016 U.S. Presidential Election.

2.1. Data collection and cleaning

The data for analysis were collected using Twitter Streaming API. API can be viewed as a tool for

collecting data directly from Twitter in effectively real-time. A user sets selection criteria (e.g.

keywords or location) and Twitter sends a sample of selected tweets as they happen. In this study,

we make requests to collect tweets that contain certain keywords and leave the connections open

to collect as many tweets as possible during the harvested periods. Each retrieved tweet contains

the plain text of the tweet as well as information about users like user ID (user name) and other

fields such as date, source, location, friend counts, follower counts, URL, retweet counts, etc.

The Brexit-related tweets are collected from 24 May 2016 to 17 August 2016. Tweets are

tracked if they contain the keyword “Brexit”. The 2016 U.S. Election-related tweets are collected

from 8 October 2016 to 8 December 2016. We collected all tweets containing the following

keywords: “Election2016”, “BlackLivesMatter”, “CampaignZero”, “ClintonEmails”,

6

“ImWithHer”, “NeverClinton”, “FeelTheBern”, “CruzCrew”, “MakeAmericanGreatAgain”,

“Trump”, “Clinton”. Given that we collect tweets during high intensity events, our sample is likely

to have about 1% of all tweets with keywords mentioned above.

The screening and cleaning process is as follows. First, we process each tweet to extract

the relevant content and store in a new tweet content variable. Specifically, we exclude special

characters such as link tokens (starting with “http://”, “https://”, “www.”) or user identifier tokens

(starting with “@”) from the tweet content. Second, we do not include tweets that contained only

links or URLs in our analysis.3 Third, we separate tweets whose language description is English

from those whose language description is other languages. Finally, we adopt the approach

proposed by Howard and Kollanyi (2016) and Kollanyi et al. (2016)4 and define campaign

endorsement for each tweet based on the hashtags specified in Appendix Table A1. After

screening, our sample contains about 2.7 million tweets for the EU Referendum and 7.2 million

tweets for the 2016 U.S. Presidential Election.

In the next step, we identify original tweets (i.e., the tweets were created rather than copied)

and their retweets. First, we screen each tweet’s content in the original dataset and create a new

indicator variable RT which equals 1 if the tweet starts with “RT @” (which means a retweet in

the Twitter language; that is, a repost of an original tweet) and 0 otherwise. Next, we extract the

content after “@” and before the main text and refer it as RT_from. This RT_from is simply the

user name of the Twitter account from which the tweet was retweeted. After these steps, we could

identify (1) the original tweets, (2) their direct retweets, and (3) their indirect retweets. An example

of this process is provided in Appendix Table A2.

2.2. Identification of bots

Previous research (e.g., Chu et al., 2010; Sivanesh et al., 2013; Cook et al., 2014) documents

several patterns that help distinguish bots and human users. First, a human agent tends to be more

3 This criterion effectively removes Twitter accounts of many standard media (e.g., BBC, Times) because these media

typically post only links (URLs) to articles on their Twitter pages. 4 In these studies, the authors analyse all Brexit-related and U.S. Election-related tweets and use some specific hashtags

to define supporting sides. Our approach is different in two ways. First, we do not analyse the tweets that contain only a

URL even if the URL includes the hashtags. Second, we do not include some of the hashtags/keywords used by Howard

and Kollanyi (2016) and Kollanyi et al. (2016) such as #Brexit, #Trump, or #Clinton to classify tweets as being in favour

or against a side of a campaign because these hashtags have been often used to support both sides of the argument.

7

active in tweeting during the regular workdays and during the daytime while the daily and hourly

tweeting activity of a bot agent is even. Second, bots often tweet the same content many times

while humans do not. Given the aggressive use of social bots during the political events like

election, previous studies also suggest some event-specific criteria to detect bots. For example, bot

accounts are more likely to be created just on or about the event announcement date. Further, bot

agents could have the inactivity before and after the event while create mass tweets or retweets on

event-specific days and times.

Building on these earlier results, we use the following procedure to classify twitter accounts

into humans and bots. Consider a given Twitter account on a given day. We flag this account/day

as a potential bot if any of the following conditions is satisfied.

First, Haustein et al. (2016) document that the average number of daily tweets for a bot is

about 5 (standard deviation ≈5) while the daily average for humans is about 2 (standard deviation

≈2). Given these differences in the volume of tweeting, our first criterion is an unusually large

number of tweets in a day created by an account. For the Brexit sample, we choose the threshold

of 10 which is about 4 standard deviations above normal human activity. Because the Twitter usage

including the number of Twitter users and the tweet volumes in the U.S. is substantially greater

than that in the U.K., we raise this threshold to 15 for the U.S. Election sample.

Second, since the period from 00:00 to 06:00 is often considered as the inactive time for

humans, any actively tweeting activities during this time period could be viewed as “abnormal

tweeting time”. We flag an account as a potential bot if the account creates at least five tweets and

10 tweets during the abnormal tweeting time on a given day for the Brexit sample and the U.S.

Election sample, respectively. Abnormal time is defined based on British Summer Time for U.K.

or Eastern Time for U.S.

Third, previous studies in computer science (e.g., Lee et al., 2010; Chu et al., 2012) suggest

that one of bots’ characteristics is to repeatedly post identical messages. Thus, we flag an account

as a potential bot if the number of tweets with the same content per day is 3 or more for both U.K.

and U.S. samples.

Fourth, Twitter bots may be created and used for particular events. Hence, the next criterion

examines newly created accounts. We define an account as “newly created” if the account is

created on or after 20 February 2016 for the Brexit sample when the Referendum was announced

and 15 July 2016 for the 2016 U.S. Election sample when by-then Republican presumptive

8

nominee Donald Trump announced his vice-presidential running mate. These accounts are flagged

as potential bots if they have an unusually high average daily tweet volume relative to what one

might have expected for a twitter account of that age. The chosen thresholds are 10 and 15 for the

Brexit and U.S. Presidential Election samples, respectively.

If an account is flagged as a bot for majority of days (that is, more than 50 percent of days)

during its lifetime in the sample, then the account is defined as a bot; otherwise the user is defined

as a human. We experimented with variations of these criteria (e.g., a user is defined as a bot if

tweeting activities are observed for at least three days and on more than 50 percent of days tweeting

activities match all four criteria; raising or lowering the threshold point for each criterion) and we

found similar results in our regression analysis. To check the validity of our procedure to identify

bots, we compare our bot definition with bot detection based on an online classification tool called

Botometer (formerly BotorNot).5 We find that these two approaches have 90% consistency in

classification of accounts into bots and non-bots in our U.K. sample.

Since there is a growing concern about the influence of foreign nations like Russia in the

2016 U.S. Presidential Election and Brexit through social media, we also examine the behavior of

Twitter accounts that self-declare Russian as their profile language. Obviously, having Russian as

the profile language does not imply that an account is sponsored by the Russian government.

However, Twitter offers default language based on the language of the operating system of a person

who wants to open a Twitter account and thus the location of the person may be unintentionally

disclosed.6 If a large volume of tweets is generated from accounts that have Russian as the profile

language, one may suspect that these accounts played a potentially unusual role.

2.3. Dynamics of Twitter posts

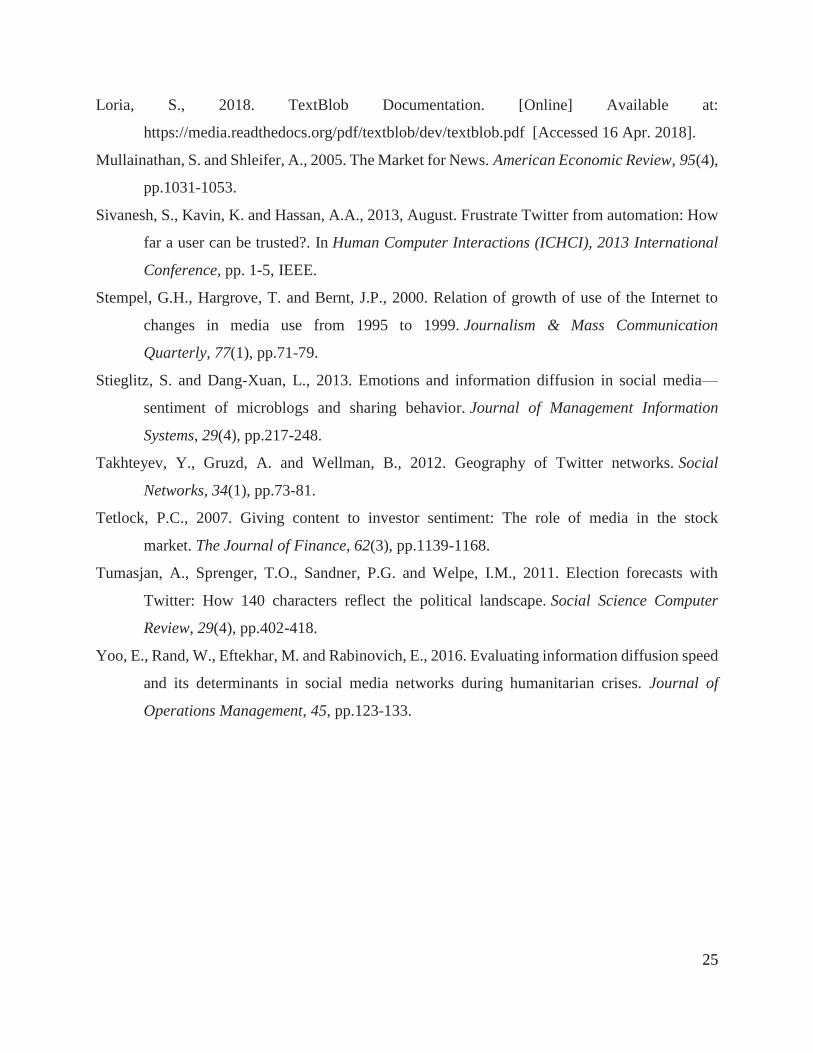
Figure 1 illustrates the evolution in the daily and hourly volumes of Brexit-related tweets for

humans (Panels B and D) and bots (Panels A and C). There is a significant increase in the number

of tweets created by humans on the 23rd and 24th June 2016. While bots also show more intensity

around these dates but the increase is much more modest. Interestingly, the daily volume of pro-

leave tweets was always higher than the daily volume of pro-remain tweets. This gap was greatest

5 This tool is developed by researchers from Indiana University and Northeastern University. Botometer tool cannot

classify the accounts that have been suspended or deactivated. 6 A user may manually change the language and location.

9

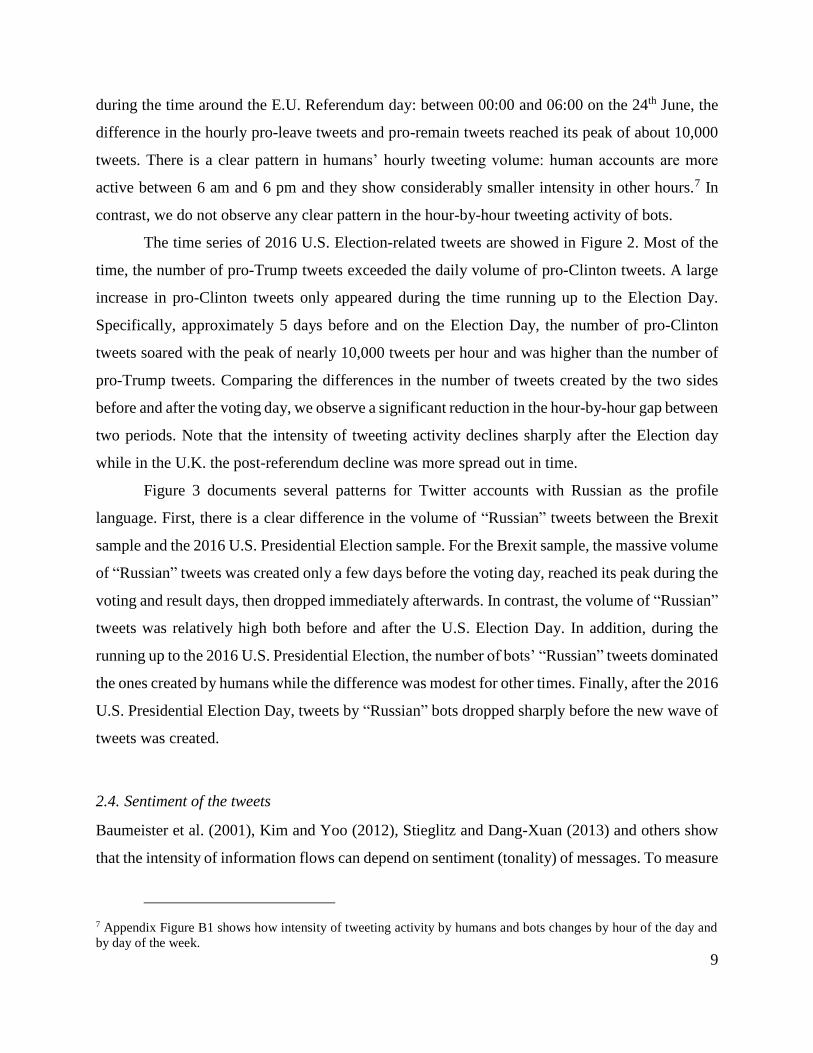
during the time around the E.U. Referendum day: between 00:00 and 06:00 on the 24th June, the

difference in the hourly pro-leave tweets and pro-remain tweets reached its peak of about 10,000

tweets. There is a clear pattern in humans’ hourly tweeting volume: human accounts are more

active between 6 am and 6 pm and they show considerably smaller intensity in other hours.7 In

contrast, we do not observe any clear pattern in the hour-by-hour tweeting activity of bots.

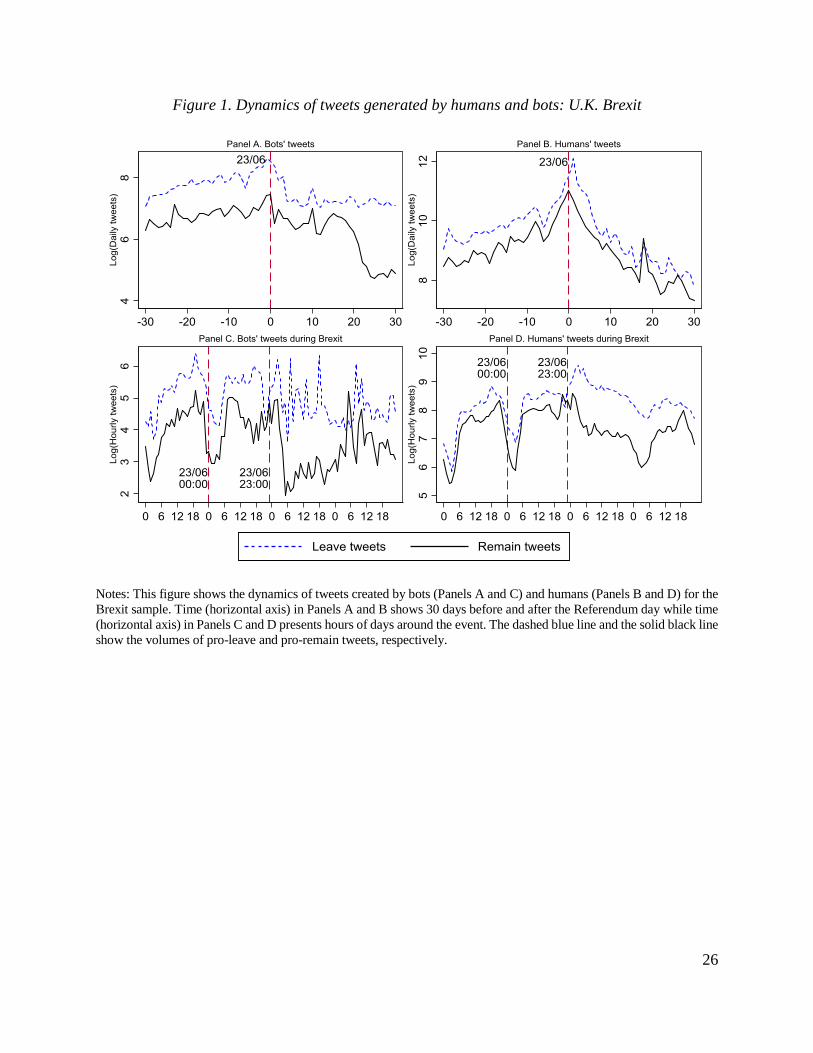
The time series of 2016 U.S. Election-related tweets are showed in Figure 2. Most of the

time, the number of pro-Trump tweets exceeded the daily volume of pro-Clinton tweets. A large

increase in pro-Clinton tweets only appeared during the time running up to the Election Day.

Specifically, approximately 5 days before and on the Election Day, the number of pro-Clinton

tweets soared with the peak of nearly 10,000 tweets per hour and was higher than the number of

pro-Trump tweets. Comparing the differences in the number of tweets created by the two sides

before and after the voting day, we observe a significant reduction in the hour-by-hour gap between

two periods. Note that the intensity of tweeting activity declines sharply after the Election day

while in the U.K. the post-referendum decline was more spread out in time.

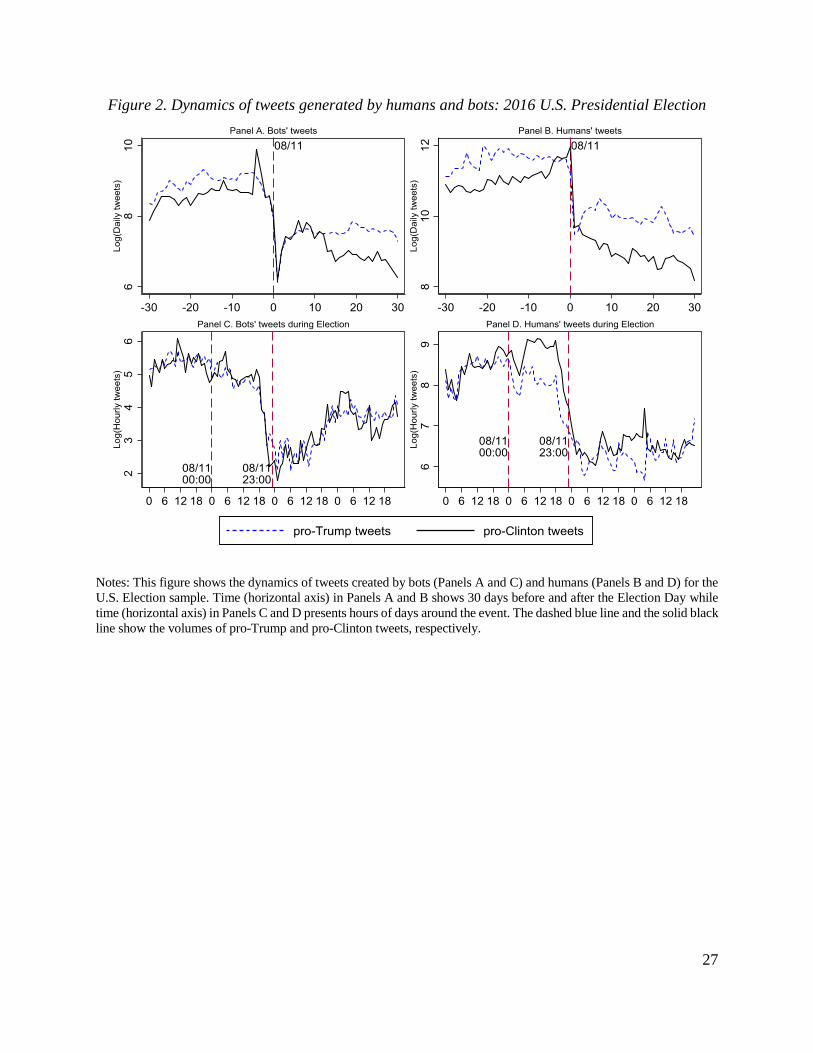
Figure 3 documents several patterns for Twitter accounts with Russian as the profile

language. First, there is a clear difference in the volume of “Russian” tweets between the Brexit

sample and the 2016 U.S. Presidential Election sample. For the Brexit sample, the massive volume

of “Russian” tweets was created only a few days before the voting day, reached its peak during the

voting and result days, then dropped immediately afterwards. In contrast, the volume of “Russian”

tweets was relatively high both before and after the U.S. Election Day. In addition, during the

running up to the 2016 U.S. Presidential Election, the number of bots’ “Russian” tweets dominated

the ones created by humans while the difference was modest for other times. Finally, after the 2016

U.S. Presidential Election Day, tweets by “Russian” bots dropped sharply before the new wave of

tweets was created.

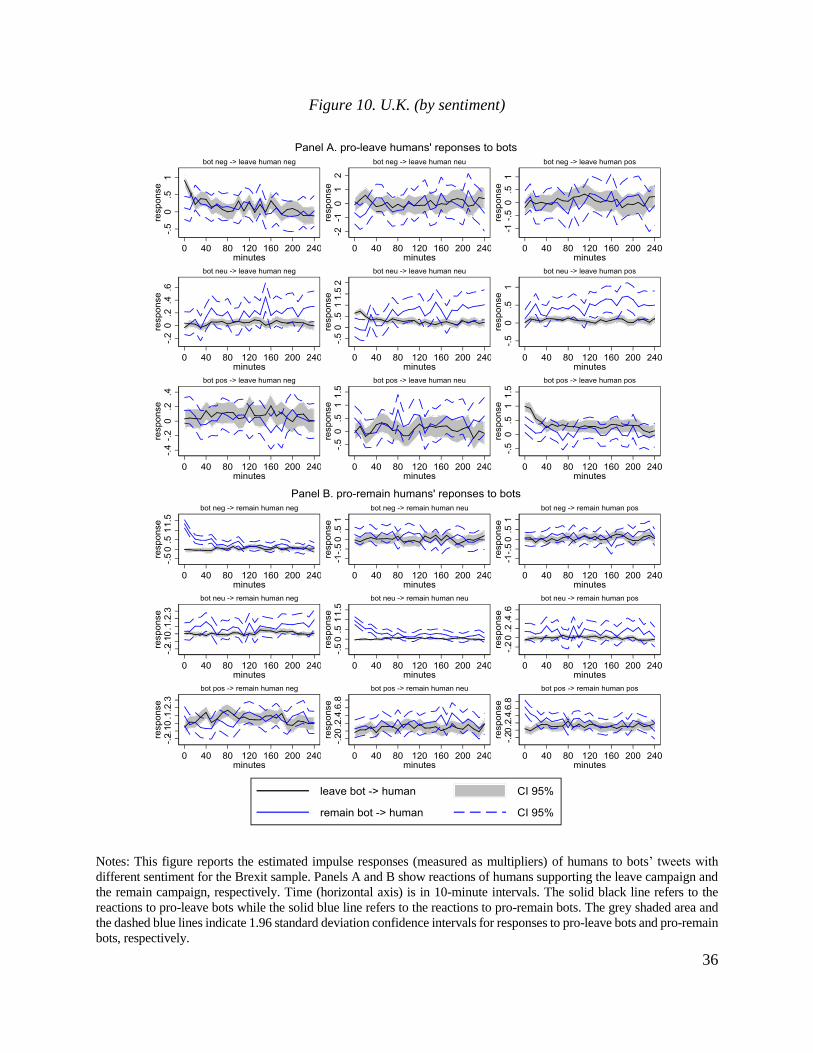
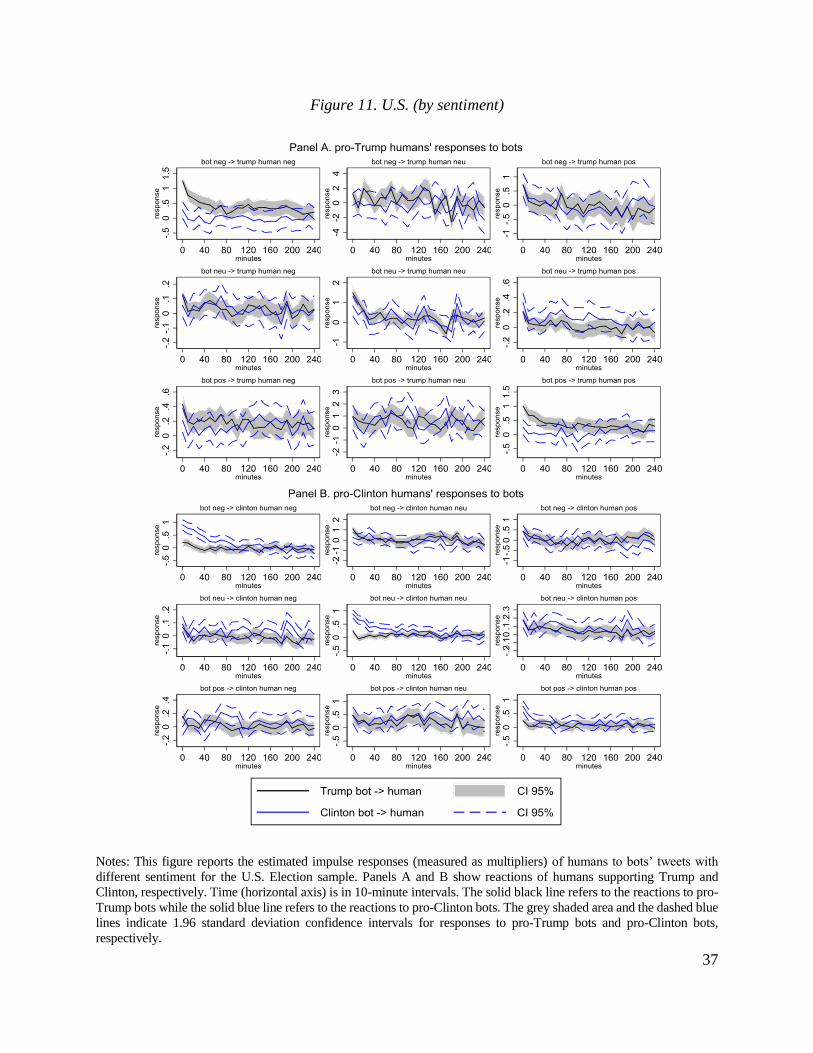
2.4. Sentiment of the tweets

Baumeister et al. (2001), Kim and Yoo (2012), Stieglitz and Dang-Xuan (2013) and others show

that the intensity of information flows can depend on sentiment (tonality) of messages. To measure

7 Appendix Figure B1 shows how intensity of tweeting activity by humans and bots changes by hour of the day and

by day of the week.

10

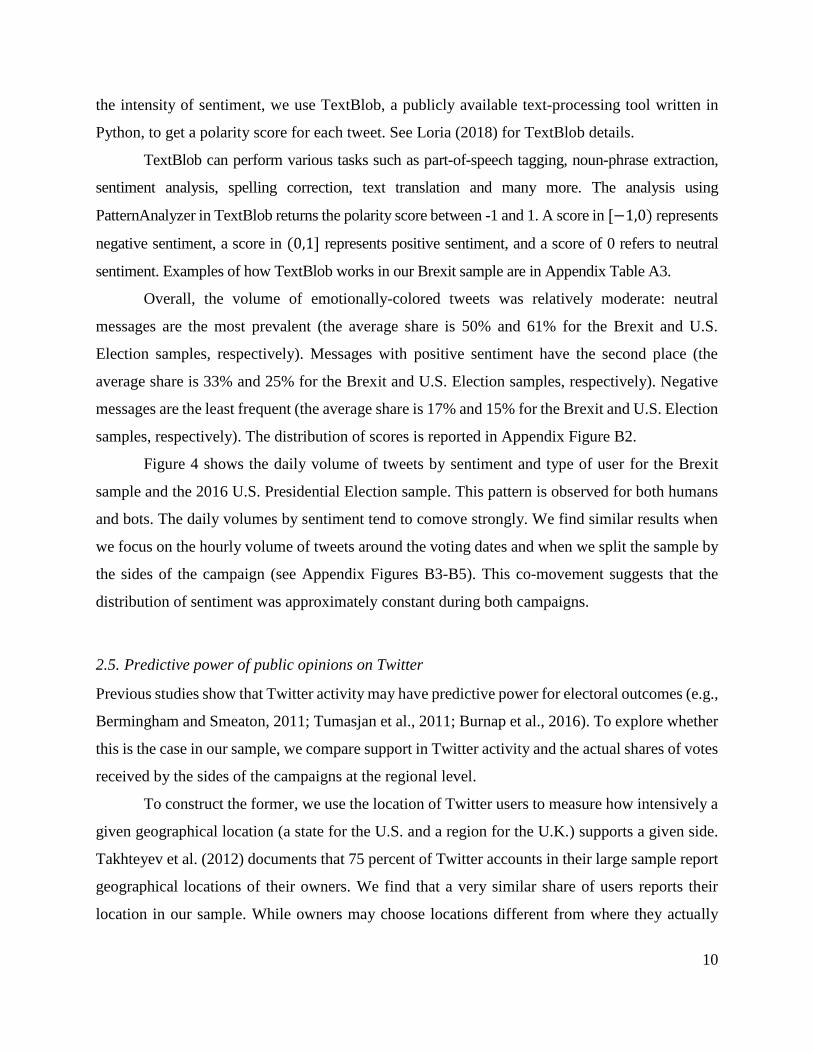
the intensity of sentiment, we use TextBlob, a publicly available text-processing tool written in

Python, to get a polarity score for each tweet. See Loria (2018) for TextBlob details.

TextBlob can perform various tasks such as part-of-speech tagging, noun-phrase extraction,

sentiment analysis, spelling correction, text translation and many more. The analysis using

PatternAnalyzer in TextBlob returns the polarity score between -1 and 1. A score in [−1,0) represents

negative sentiment, a score in (0,1] represents positive sentiment, and a score of 0 refers to neutral

sentiment. Examples of how TextBlob works in our Brexit sample are in Appendix Table A3.

Overall, the volume of emotionally-colored tweets was relatively moderate: neutral

messages are the most prevalent (the average share is 50% and 61% for the Brexit and U.S.

Election samples, respectively). Messages with positive sentiment have the second place (the

average share is 33% and 25% for the Brexit and U.S. Election samples, respectively). Negative

messages are the least frequent (the average share is 17% and 15% for the Brexit and U.S. Election

samples, respectively). The distribution of scores is reported in Appendix Figure B2.

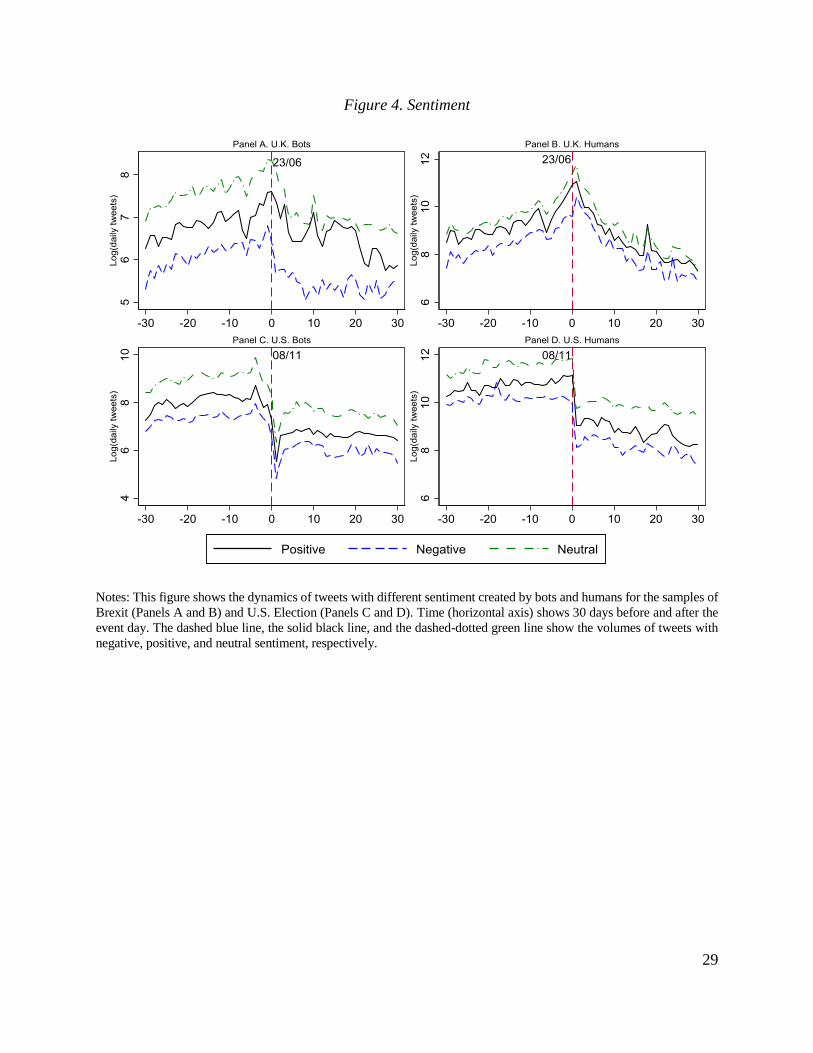
Figure 4 shows the daily volume of tweets by sentiment and type of user for the Brexit

sample and the 2016 U.S. Presidential Election sample. This pattern is observed for both humans

and bots. The daily volumes by sentiment tend to comove strongly. We find similar results when

we focus on the hourly volume of tweets around the voting dates and when we split the sample by

the sides of the campaign (see Appendix Figures B3-B5). This co-movement suggests that the

distribution of sentiment was approximately constant during both campaigns.

2.5. Predictive power of public opinions on Twitter

Previous studies show that Twitter activity may have predictive power for electoral outcomes (e.g.,

Bermingham and Smeaton, 2011; Tumasjan et al., 2011; Burnap et al., 2016). To explore whether

this is the case in our sample, we compare support in Twitter activity and the actual shares of votes

received by the sides of the campaigns at the regional level.

To construct the former, we use the location of Twitter users to measure how intensively a

given geographical location (a state for the U.S. and a region for the U.K.) supports a given side.

Takhteyev et al. (2012) documents that 75 percent of Twitter accounts in their large sample report

geographical locations of their owners. We find that a very similar share of users reports their

location in our sample. While owners may choose locations different from where they actually

11

reside, available evidence (e.g., Takhteyev et al., 2012; Haustein and Costas, 2014) suggests that,

while imperfect, this information is useful for determining geography of twitter users.

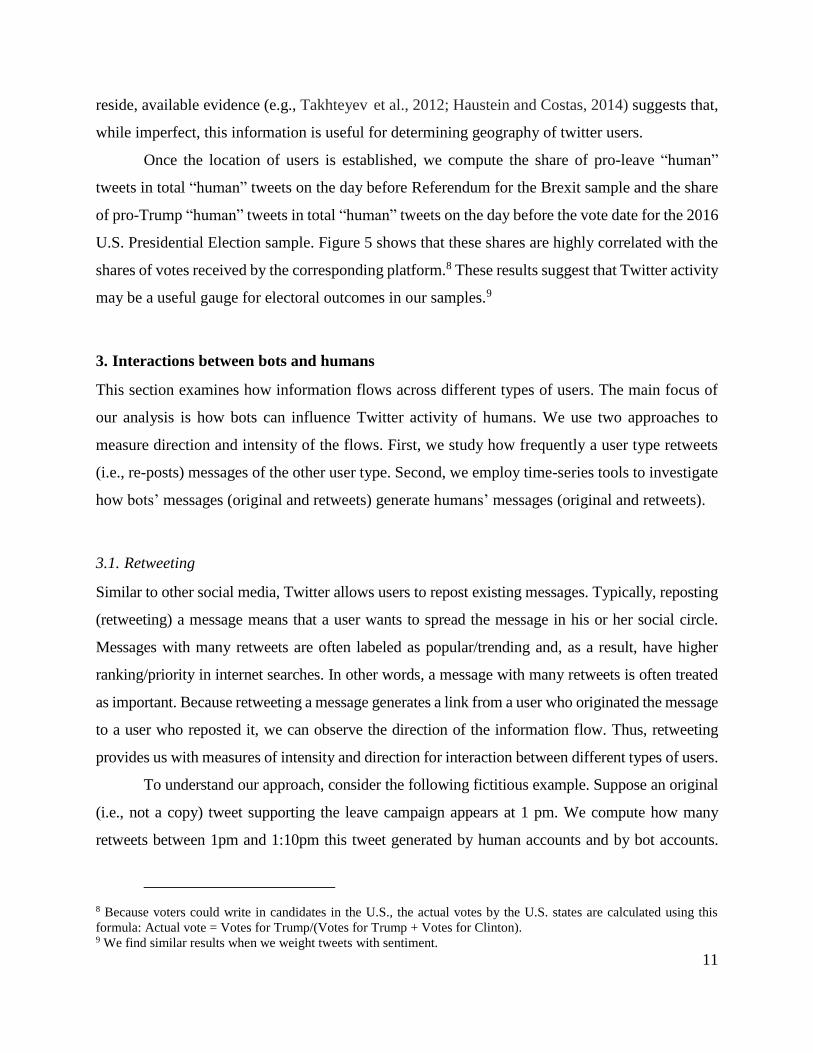
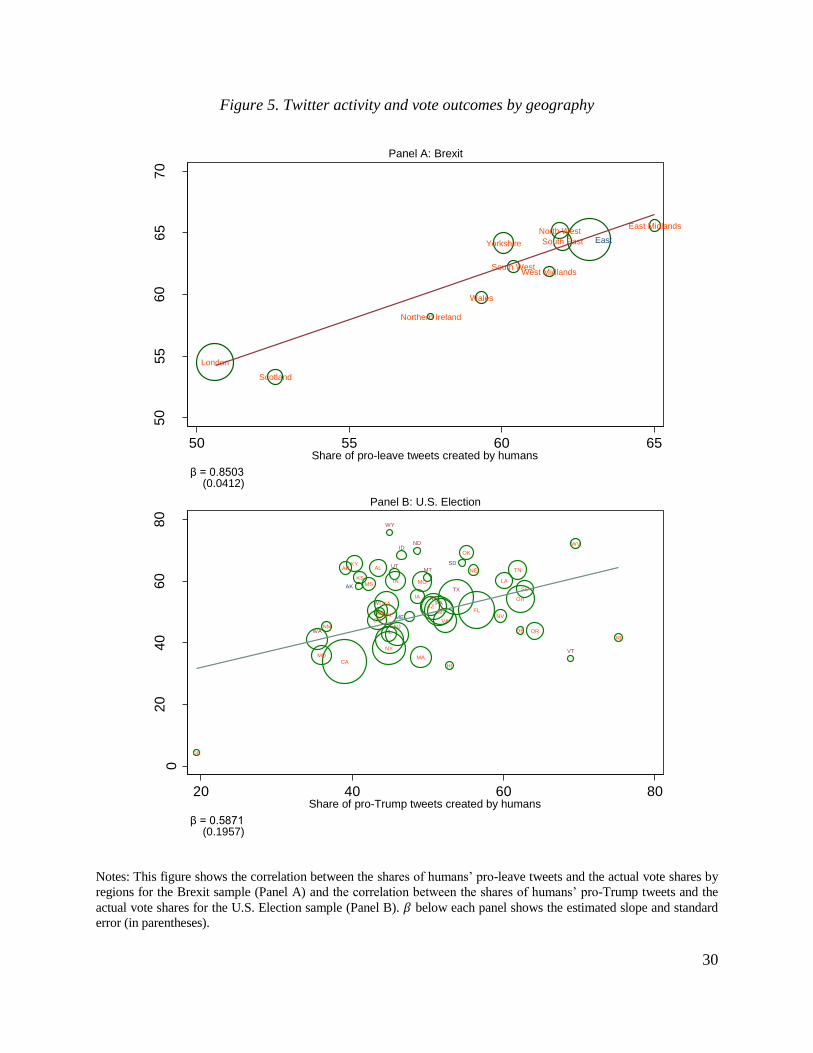
Once the location of users is established, we compute the share of pro-leave “human”

tweets in total “human” tweets on the day before Referendum for the Brexit sample and the share

of pro-Trump “human” tweets in total “human” tweets on the day before the vote date for the 2016

U.S. Presidential Election sample. Figure 5 shows that these shares are highly correlated with the

shares of votes received by the corresponding platform.8 These results suggest that Twitter activity

may be a useful gauge for electoral outcomes in our samples.9

3. Interactions between bots and humans

This section examines how information flows across different types of users. The main focus of

our analysis is how bots can influence Twitter activity of humans. We use two approaches to

measure direction and intensity of the flows. First, we study how frequently a user type retweets

(i.e., re-posts) messages of the other user type. Second, we employ time-series tools to investigate

how bots’ messages (original and retweets) generate humans’ messages (original and retweets).

3.1. Retweeting

Similar to other social media, Twitter allows users to repost existing messages. Typically, reposting

(retweeting) a message means that a user wants to spread the message in his or her social circle.

Messages with many retweets are often labeled as popular/trending and, as a result, have higher

ranking/priority in internet searches. In other words, a message with many retweets is often treated

as important. Because retweeting a message generates a link from a user who originated the message

to a user who reposted it, we can observe the direction of the information flow. Thus, retweeting

provides us with measures of intensity and direction for interaction between different types of users.

To understand our approach, consider the following fictitious example. Suppose an original

(i.e., not a copy) tweet supporting the leave campaign appears at 1 pm. We compute how many

retweets between 1pm and 1:10pm this tweet generated by human accounts and by bot accounts.

8 Because voters could write in candidates in the U.S., the actual votes by the U.S. states are calculated using this

formula: Actual vote = Votes for Trump/(Votes for Trump + Votes for Clinton). 9 We find similar results when we weight tweets with sentiment.

12

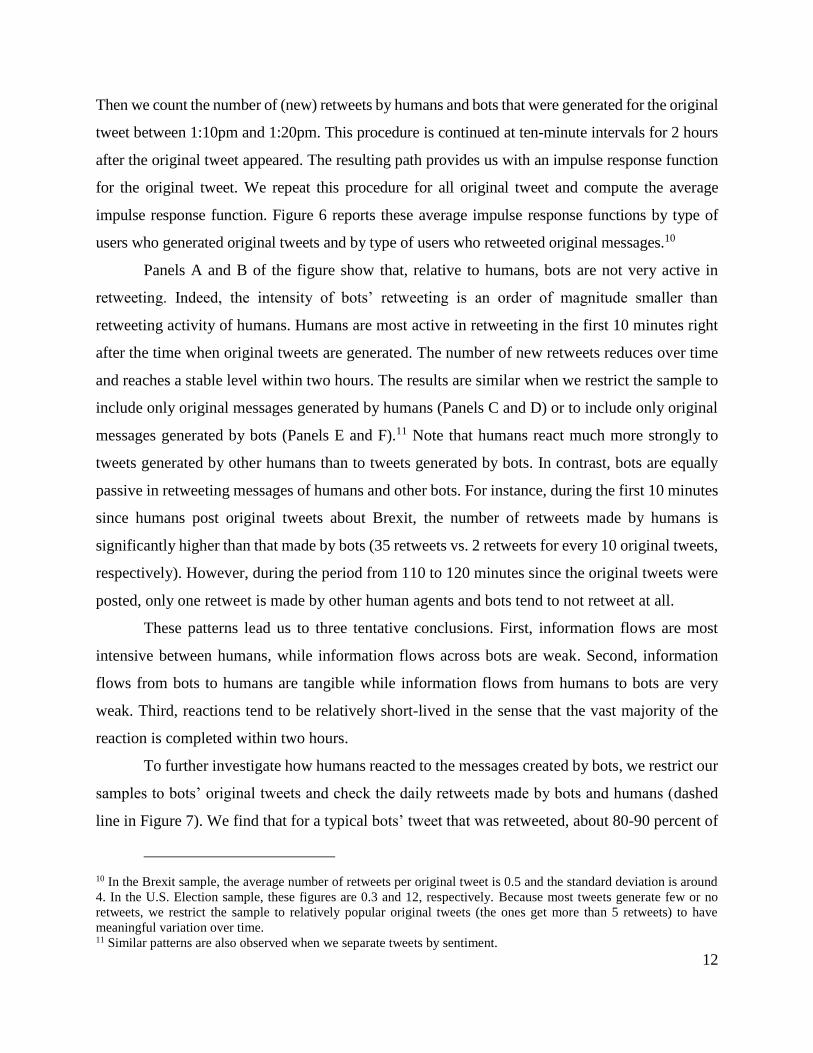
Then we count the number of (new) retweets by humans and bots that were generated for the original

tweet between 1:10pm and 1:20pm. This procedure is continued at ten-minute intervals for 2 hours

after the original tweet appeared. The resulting path provides us with an impulse response function

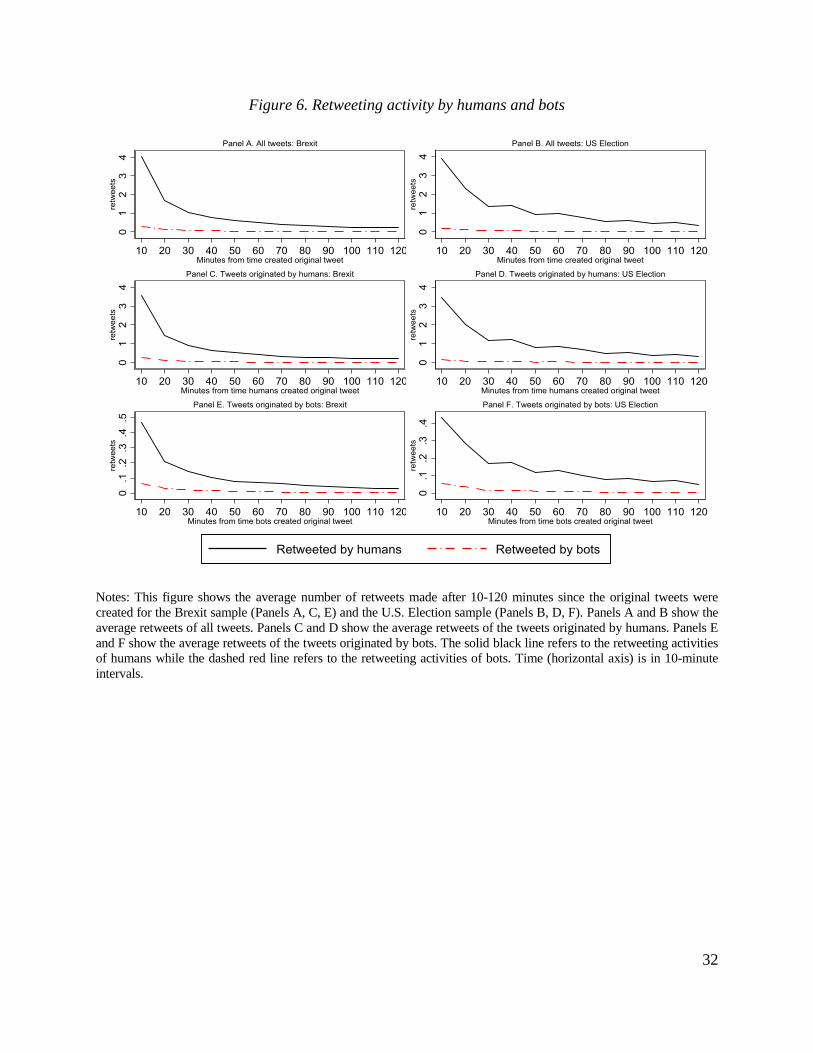
for the original tweet. We repeat this procedure for all original tweet and compute the average

impulse response function. Figure 6 reports these average impulse response functions by type of

users who generated original tweets and by type of users who retweeted original messages.10

Panels A and B of the figure show that, relative to humans, bots are not very active in

retweeting. Indeed, the intensity of bots’ retweeting is an order of magnitude smaller than

retweeting activity of humans. Humans are most active in retweeting in the first 10 minutes right

after the time when original tweets are generated. The number of new retweets reduces over time

and reaches a stable level within two hours. The results are similar when we restrict the sample to

include only original messages generated by humans (Panels C and D) or to include only original

messages generated by bots (Panels E and F).11 Note that humans react much more strongly to

tweets generated by other humans than to tweets generated by bots. In contrast, bots are equally

passive in retweeting messages of humans and other bots. For instance, during the first 10 minutes

since humans post original tweets about Brexit, the number of retweets made by humans is

significantly higher than that made by bots (35 retweets vs. 2 retweets for every 10 original tweets,

respectively). However, during the period from 110 to 120 minutes since the original tweets were

posted, only one retweet is made by other human agents and bots tend to not retweet at all.

These patterns lead us to three tentative conclusions. First, information flows are most

intensive between humans, while information flows across bots are weak. Second, information

flows from bots to humans are tangible while information flows from humans to bots are very

weak. Third, reactions tend to be relatively short-lived in the sense that the vast majority of the

reaction is completed within two hours.

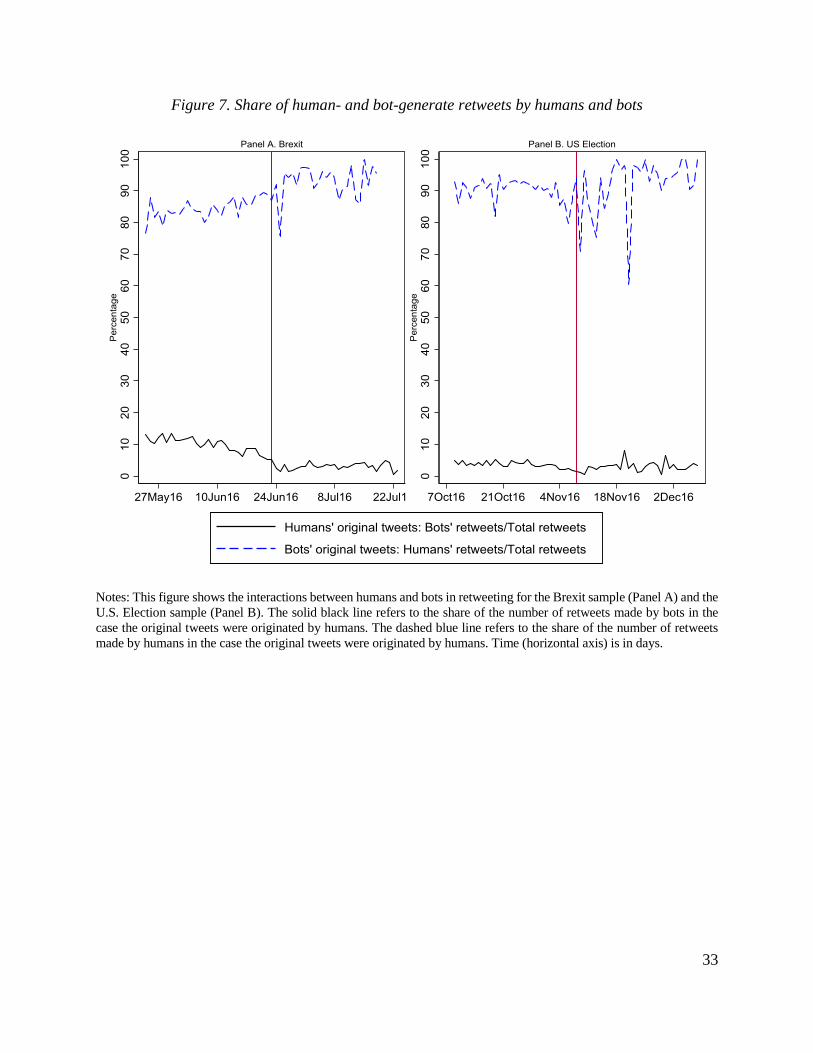
To further investigate how humans reacted to the messages created by bots, we restrict our

samples to bots’ original tweets and check the daily retweets made by bots and humans (dashed

line in Figure 7). We find that for a typical bots’ tweet that was retweeted, about 80-90 percent of

10 In the Brexit sample, the average number of retweets per original tweet is 0.5 and the standard deviation is around

4. In the U.S. Election sample, these figures are 0.3 and 12, respectively. Because most tweets generate few or no

retweets, we restrict the sample to relatively popular original tweets (the ones get more than 5 retweets) to have

meaningful variation over time. 11 Similar patterns are also observed when we separate tweets by sentiment.

13

retweets were made by humans. However, when we restrict our samples to humans’ original tweets

and check the daily retweets made by bots and humans (solid line in Figure 7), we find that bots

account for only 5 to 10 percent of retweets generated in response to humans’ original tweets.

Thus, humans tended to spread messages that were originally generated by bots while bots did not

spread messaged generated by humans.

These results are consistent with the view that humans had little (if any) effect on bots

while bots had a perhaps limited, but tangible effect on humans. The asymmetric response of

humans to posts consistent and inconsistent with their views suggests that social media can create

“echo chambers” fostering amplification of messages within a group of similarly-minded people

and inhibiting communication of people with different views. These results also suggest that bots

are not likely to be successful in persistently moving tweeting activity of humans. The short

duration of the response is consistent with the fast news cycles in social media (e.g., Kwak et al.,

2010; Yoo et al., 2016) and/or low information rigidity (Coibion and Gorodnichenko, 2012).

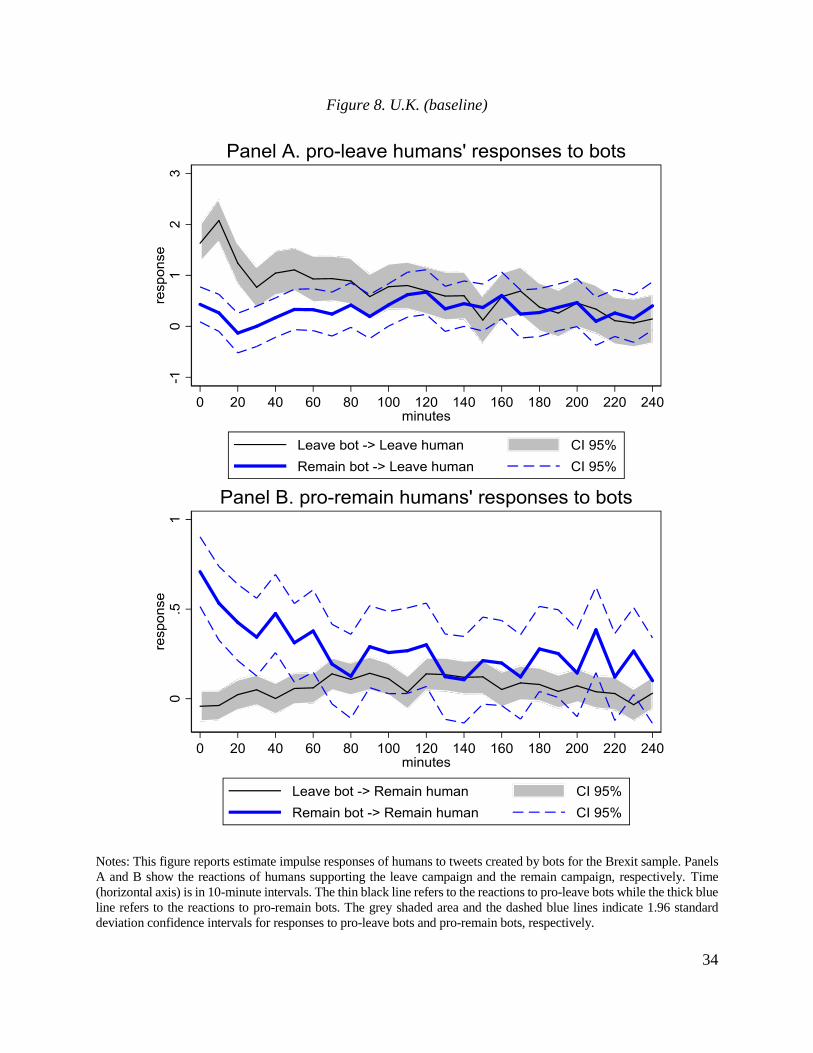
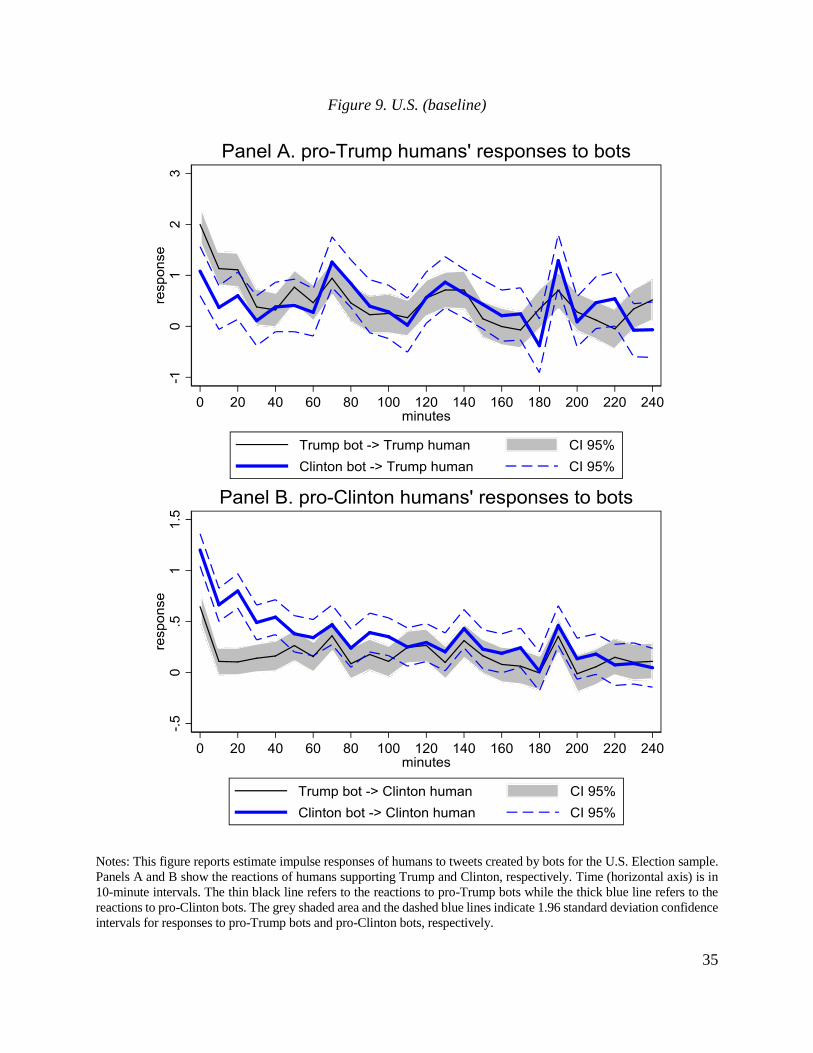
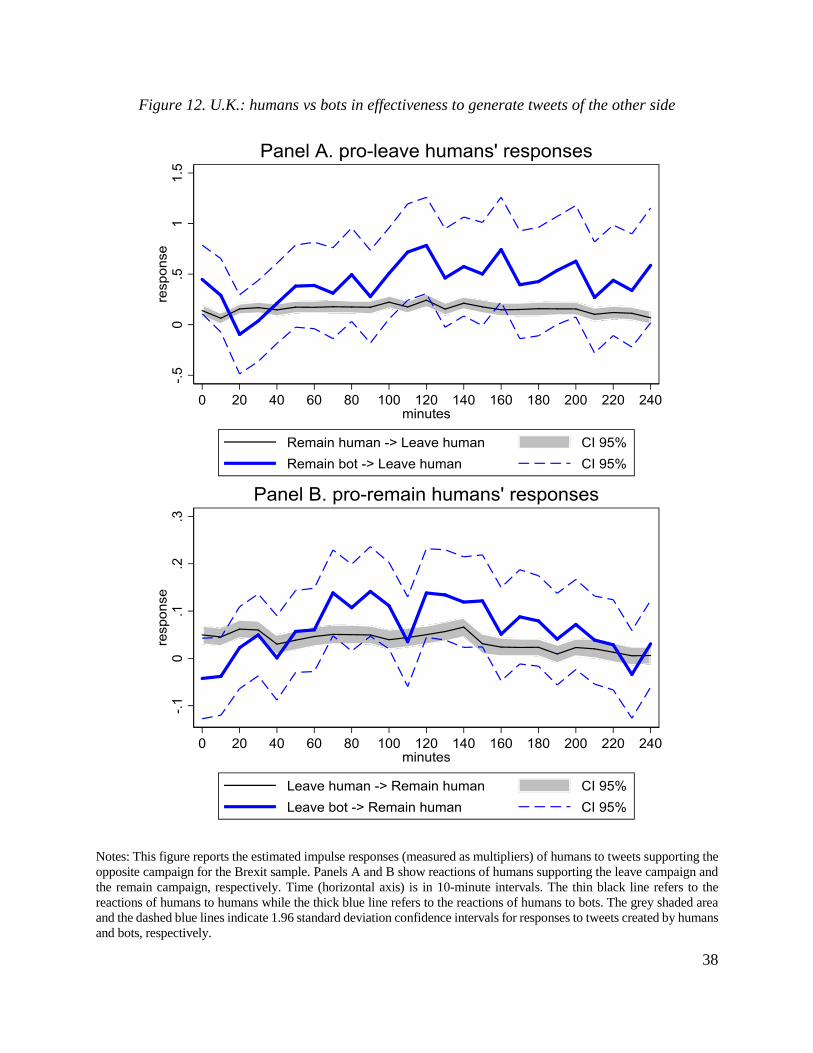
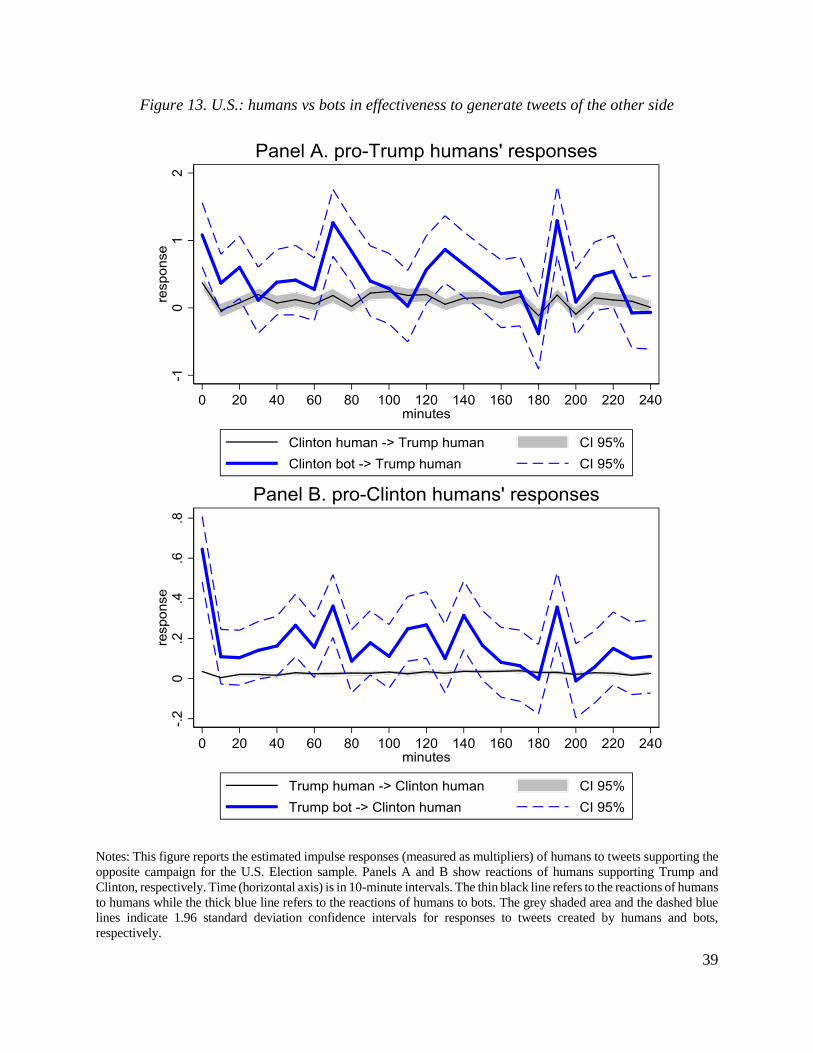
3.2. Time series analysis

While the analysis in the previous section is informative, it is focused on reposts of original

messages. Obviously, interaction between different types of users may also happen via generation

of new messages. In this subsection, we use standard tools of time-series analysis to construct

impulse responses of all messages (that is, retweets and new posts) by a type of users to a message

generated by a given type of users.

This exercise relies on two key ingredients. First, we build on our earlier findings for

retweets and assume that humans can respond contemporaneously to bots while bots do not

respond contemporaneously to humans. Second, to ensure that this identifying assumption holds,

we use data at 10-minute intervals. Apart from strengthening our identification, this short duration

of time intervals allows us to control for low-frequency variation in the volume of tweeting activity

(e.g., days closer to the vote date have higher volume than more distant days).

A. Econometric specification

To estimate impulse responses flexibly, we use local projections method developed by Jordà

(2005). To see how this method works, suppose we are interested in estimating reactions of humans

14

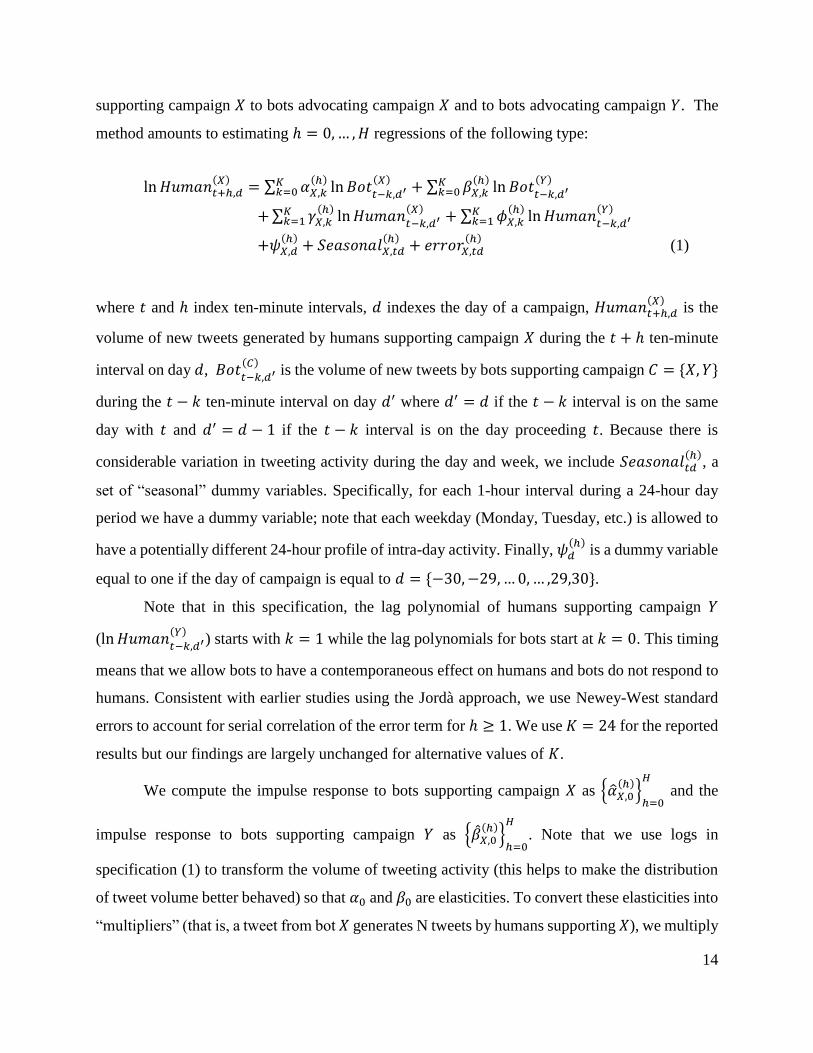
supporting campaign 𝑋 to bots advocating campaign 𝑋 and to bots advocating campaign 𝑌. The

method amounts to estimating ℎ = 0,… ,𝐻 regressions of the following type:

ln 𝐻𝑢𝑚𝑎𝑛𝑡+ℎ,𝑑(𝑋) = ∑ 𝛼𝑋,𝑘

(ℎ) ln 𝐵𝑜𝑡𝑡−𝑘,𝑑′(𝑋)𝐾

𝑘=0 + ∑ 𝛽𝑋,𝑘(ℎ) ln 𝐵𝑜𝑡

𝑡−𝑘,𝑑′(𝑌)𝐾

𝑘=0

+∑ 𝛾𝑋,𝑘(ℎ) ln𝐻𝑢𝑚𝑎𝑛

𝑡−𝑘,𝑑′(𝑋)𝐾

𝑘=1 + ∑ 𝜙𝑋,𝑘(ℎ) ln 𝐻𝑢𝑚𝑎𝑛

𝑡−𝑘,𝑑′(𝑌)𝐾

𝑘=1

+𝜓𝑋,𝑑(ℎ) + 𝑆𝑒𝑎𝑠𝑜𝑛𝑎𝑙𝑋,𝑡𝑑

(ℎ) + 𝑒𝑟𝑟𝑜𝑟𝑋,𝑡𝑑(ℎ)

(1)

where 𝑡 and ℎ index ten-minute intervals, 𝑑 indexes the day of a campaign, 𝐻𝑢𝑚𝑎𝑛𝑡+ℎ,𝑑(𝑋)

is the

volume of new tweets generated by humans supporting campaign 𝑋 during the 𝑡 + ℎ ten-minute

interval on day 𝑑, 𝐵𝑜𝑡𝑡−𝑘,𝑑′(𝐶)

is the volume of new tweets by bots supporting campaign 𝐶 = {𝑋, 𝑌}

during the 𝑡 − 𝑘 ten-minute interval on day 𝑑′ where 𝑑′ = 𝑑 if the 𝑡 − 𝑘 interval is on the same

day with 𝑡 and 𝑑′ = 𝑑 − 1 if the 𝑡 − 𝑘 interval is on the day proceeding 𝑡. Because there is

considerable variation in tweeting activity during the day and week, we include 𝑆𝑒𝑎𝑠𝑜𝑛𝑎𝑙𝑡𝑑(ℎ)

, a

set of “seasonal” dummy variables. Specifically, for each 1-hour interval during a 24-hour day

period we have a dummy variable; note that each weekday (Monday, Tuesday, etc.) is allowed to

have a potentially different 24-hour profile of intra-day activity. Finally, 𝜓𝑑(ℎ)

is a dummy variable

equal to one if the day of campaign is equal to 𝑑 = {−30,−29,…0,… ,29,30}.

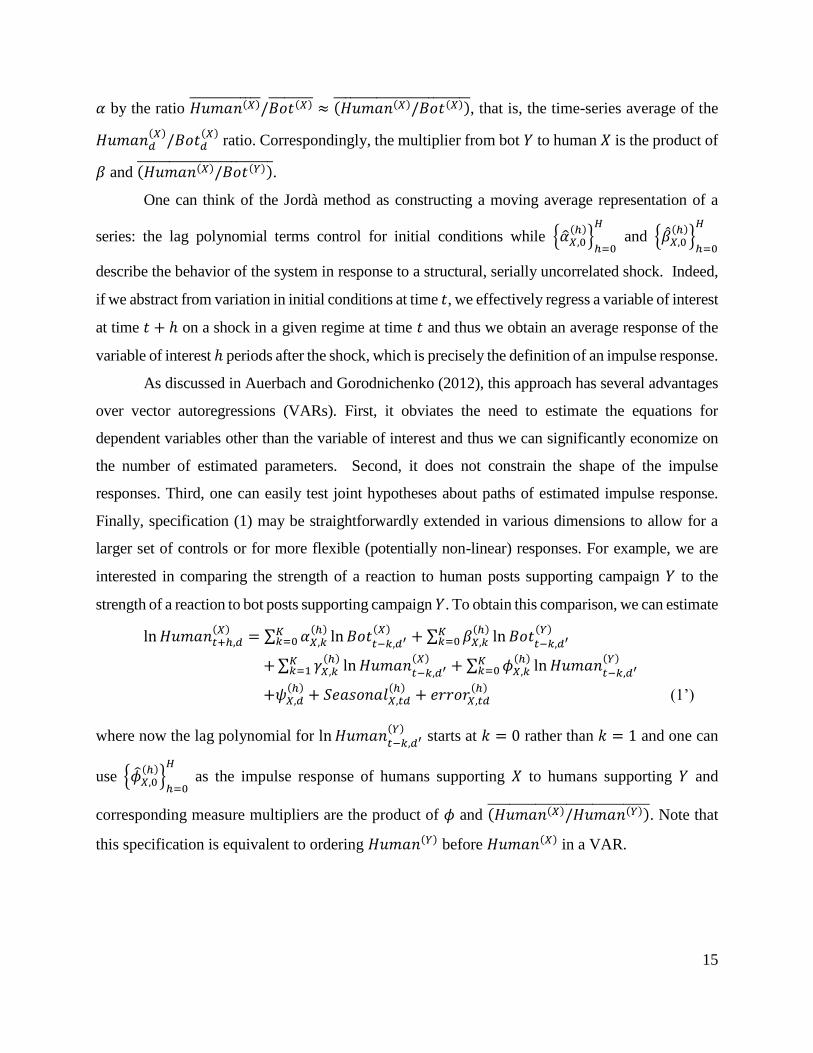
Note that in this specification, the lag polynomial of humans supporting campaign 𝑌

(ln 𝐻𝑢𝑚𝑎𝑛𝑡−𝑘,𝑑′(𝑌)

) starts with 𝑘 = 1 while the lag polynomials for bots start at 𝑘 = 0. This timing

means that we allow bots to have a contemporaneous effect on humans and bots do not respond to

humans. Consistent with earlier studies using the Jordà approach, we use Newey-West standard

errors to account for serial correlation of the error term for ℎ ≥ 1. We use 𝐾 = 24 for the reported

results but our findings are largely unchanged for alternative values of 𝐾.

We compute the impulse response to bots supporting campaign 𝑋 as {�̂�𝑋,0(ℎ)}

ℎ=0

𝐻

and the

impulse response to bots supporting campaign 𝑌 as {�̂�𝑋,0(ℎ)}

ℎ=0

𝐻

. Note that we use logs in

specification (1) to transform the volume of tweeting activity (this helps to make the distribution

of tweet volume better behaved) so that 𝛼0 and 𝛽0 are elasticities. To convert these elasticities into

“multipliers” (that is, a tweet from bot 𝑋 generates N tweets by humans supporting 𝑋), we multiply

15

𝛼 by the ratio 𝐻𝑢𝑚𝑎𝑛(𝑋)̅̅ ̅̅ ̅̅ ̅̅ ̅̅ ̅̅ ̅̅ /𝐵𝑜𝑡(𝑋)̅̅ ̅̅ ̅̅ ̅̅ ̅ ≈ (𝐻𝑢𝑚𝑎𝑛(𝑋)/𝐵𝑜𝑡(𝑋))̅̅ ̅̅ ̅̅ ̅̅ ̅̅ ̅̅ ̅̅ ̅̅ ̅̅ ̅̅ ̅̅ ̅̅ ̅̅ , that is, the time-series average of the

𝐻𝑢𝑚𝑎𝑛𝑑(𝑋)/𝐵𝑜𝑡𝑑

(𝑋) ratio. Correspondingly, the multiplier from bot 𝑌 to human 𝑋 is the product of

𝛽 and (𝐻𝑢𝑚𝑎𝑛(𝑋)/𝐵𝑜𝑡(𝑌))̅̅ ̅̅ ̅̅ ̅̅ ̅̅ ̅̅ ̅̅ ̅̅ ̅̅ ̅̅ ̅̅ ̅̅ ̅̅ .

One can think of the Jordà method as constructing a moving average representation of a

series: the lag polynomial terms control for initial conditions while {�̂�𝑋,0(ℎ)}

ℎ=0

𝐻

and {�̂�𝑋,0(ℎ)}

ℎ=0

𝐻

describe the behavior of the system in response to a structural, serially uncorrelated shock. Indeed,

if we abstract from variation in initial conditions at time 𝑡, we effectively regress a variable of interest

at time 𝑡 + ℎ on a shock in a given regime at time 𝑡 and thus we obtain an average response of the

variable of interest ℎ periods after the shock, which is precisely the definition of an impulse response.

As discussed in Auerbach and Gorodnichenko (2012), this approach has several advantages

over vector autoregressions (VARs). First, it obviates the need to estimate the equations for

dependent variables other than the variable of interest and thus we can significantly economize on

the number of estimated parameters. Second, it does not constrain the shape of the impulse

responses. Third, one can easily test joint hypotheses about paths of estimated impulse response.

Finally, specification (1) may be straightforwardly extended in various dimensions to allow for a

larger set of controls or for more flexible (potentially non-linear) responses. For example, we are

interested in comparing the strength of a reaction to human posts supporting campaign 𝑌 to the

strength of a reaction to bot posts supporting campaign 𝑌. To obtain this comparison, we can estimate

ln 𝐻𝑢𝑚𝑎𝑛𝑡+ℎ,𝑑(𝑋) = ∑ 𝛼𝑋,𝑘

(ℎ) ln 𝐵𝑜𝑡𝑡−𝑘,𝑑′(𝑋)𝐾

𝑘=0 + ∑ 𝛽𝑋,𝑘(ℎ) ln 𝐵𝑜𝑡

𝑡−𝑘,𝑑′(𝑌)𝐾

𝑘=0

+∑ 𝛾𝑋,𝑘(ℎ) ln 𝐻𝑢𝑚𝑎𝑛

𝑡−𝑘,𝑑′(𝑋)𝐾

𝑘=1 + ∑ 𝜙𝑋,𝑘(ℎ) ln 𝐻𝑢𝑚𝑎𝑛

𝑡−𝑘,𝑑′(𝑌)𝐾

𝑘=0

+𝜓𝑋,𝑑(ℎ) + 𝑆𝑒𝑎𝑠𝑜𝑛𝑎𝑙𝑋,𝑡𝑑

(ℎ) + 𝑒𝑟𝑟𝑜𝑟𝑋,𝑡𝑑(ℎ)

(1’)

where now the lag polynomial for ln 𝐻𝑢𝑚𝑎𝑛𝑡−𝑘,𝑑′(𝑌)

starts at 𝑘 = 0 rather than 𝑘 = 1 and one can

use {�̂�𝑋,0(ℎ)}

ℎ=0

𝐻

as the impulse response of humans supporting 𝑋 to humans supporting 𝑌 and

corresponding measure multipliers are the product of 𝜙 and (𝐻𝑢𝑚𝑎𝑛(𝑋)/𝐻𝑢𝑚𝑎𝑛(𝑌))̅̅ ̅̅ ̅̅ ̅̅ ̅̅ ̅̅ ̅̅ ̅̅ ̅̅ ̅̅ ̅̅ ̅̅ ̅̅ ̅̅ ̅̅ ̅. Note that

this specification is equivalent to ordering 𝐻𝑢𝑚𝑎𝑛(𝑌) before 𝐻𝑢𝑚𝑎𝑛(𝑋) in a VAR.

16

B. Baseline results

Figure 8 reports estimated impulse responses for the Brexit sample. Panel A of the figure shows

the reaction of humans supporting the leave campaign to messages generated by bots supporting

the leave campaign and by bots supporting the remain campaign. The response to “remain” bots

is generally small with a weak reaction on impact and a modest, positive multiplier in subsequent

periods. In contrast, the contemporaneous reaction of “leave” humans to “leave” bots is strong: the

multiplier is close to 2, that is, a new bot post generates two new human posts. However, this

elevated tweeting activity of humans is short-lived: after approximately 2-4 hours of the bot post

we observe little difference in the response of “leave” humans to “leave” bots and to “remain”

bots. These patterns are similar to the behavior of humans in retweeting posts thus providing

additional evidence of “echo chambers” as well as fast news cycles and/or low information rigidity.

Panel B of the figure plots the responses of “remain” humans to “leave” bots and “remain”

bots. Similar to what we observe in Panel A, the reaction of “remain” humans to bots advocating

the other side of the campaign is rather mute (the multiplier is close to zero), while the reaction to

bots from the same side of the campaign is stronger (the multiplier is about 0.7 which is smaller in

absolute terms than the contemporaneous multiplier for “leave” humans in response to “leave”

bots). Likewise, the effect of “remain” bots on “remain” humans is rather transitory.

The patterns are similar for the 2016 U.S. Presidential Election (Figure 9). Human

supporters of the Trump (Clinton) campaign are more reactive to messages posted by bots

supporting the Trump (Clinton) campaign than to messages posted by bots supporting the Clinton

(Trump) campaign. In a similar spirit, the reactions are not persistent and most of the response

happens within a few hours after a message appears.

C. Sentiment

As discussed above, the intensity of human responses may vary with the strength of the sentiment

in messages posted by bots. To study this possible heterogeneity in responses, we modify

specification (1) as follows:

ln 𝐻𝑢𝑚𝑎𝑛𝑡+ℎ,𝑑(𝜏,𝑋) = ∑ ∑ 𝛼𝑋,𝑠→𝜏,𝑘

(ℎ) ln 𝐵𝑜𝑡𝑡−𝑘,𝑑′(𝑠,𝑋)𝐾

𝑘=0𝑠∈{𝑝𝑜𝑠𝑖𝑡𝑖𝑣𝑒,𝑛𝑒𝑢𝑡𝑟𝑎𝑙,𝑛𝑒𝑔𝑎𝑡𝑖𝑣𝑒}

+∑ ∑ 𝛽𝑋,𝑠→𝜏,𝑘(ℎ) ln 𝐵𝑜𝑡

𝑡−𝑘,𝑑′(𝑠,𝑌)𝐾

𝑘=0𝑠∈{𝑝𝑜𝑠𝑖𝑡𝑖𝑣𝑒,𝑛𝑒𝑢𝑡𝑟𝑎𝑙,𝑛𝑒𝑔𝑎𝑡𝑖𝑣𝑒}

+∑ ∑ 𝛾𝑋,𝑠→𝜏,𝑘(ℎ) ln𝐻𝑢𝑚𝑎𝑛

𝑡−𝑘,𝑑′(𝑠,𝑋)𝐾

𝑘=1𝑠∈{𝑝𝑜𝑠𝑖𝑡𝑖𝑣𝑒,𝑛𝑒𝑢𝑡𝑟𝑎𝑙,𝑛𝑒𝑔𝑎𝑡𝑖𝑣𝑒}

17

+∑ ∑ 𝜙𝑋,𝑠→𝜏,𝑘(ℎ) ln 𝐻𝑢𝑚𝑎𝑛

𝑡−𝑘,𝑑′(𝑠,𝑌)𝐾

𝑘=1𝑠∈{𝑝𝑜𝑠𝑖𝑡𝑖𝑣𝑒,𝑛𝑒𝑢𝑡𝑟𝑎𝑙,𝑛𝑒𝑔𝑎𝑡𝑖𝑣𝑒}

+𝜓𝑋,𝜏,𝑑(ℎ) + 𝑆𝑒𝑎𝑠𝑜𝑛𝑎𝑙𝑋,𝜏,𝑡𝑑

(ℎ) + 𝑒𝑟𝑟𝑜𝑟𝑋,𝜏,𝑡𝑑(ℎ)

(2)

where 𝜏 and 𝑠 index sentiment (tonality) from positive to neutral to negative. One can now interpret

slopes as the strength of the response that may vary by tonality of messages posted by humans and

bots. For example, 𝛼𝑋,𝑠→𝜏,𝑘(ℎ)

measures the elasticity of the h-horizon response of humans supporting

campaign 𝑋 with sentiment 𝜏 to bot posts supporting campaign 𝑋 with sentiment 𝑠. Then we use

appropriate ratios of the regressand to a regressor to convert the estimated elasticities into

multipliers. Figure 10 and Figure 11 plot the estimated impulse responses (measured as

multipliers) for the U.K. and U.S. samples respectively. By and large, we observe results similar

to the baseline results: humans supporting a given side of a campaign tend to react stronger to posts

generated by bots supporting the same side and the sentiment of human responses mimics the

sentiment of bot posts.

D. Humans vs. bots

Our analysis so far has presented evidence consistent with the view that the Twitter activity of bots

can affect the Twitter activity of humans who share beliefs advocated by bots. However, bots

appear to have a weak effect on humans who have beliefs opposite to what is advocated by bots.

Would humans be more effective in reaching across the aisle?

To answer this question, we use specification (1’) to compare response multipliers for

humans who support a given campaign side to posts by humans and bots from the other camp.

Panel A of Figure 12 shows response multipliers of “leave” humans in the Brexit sample to tweets

posted by “remain” humans and “remain” bots. We observe that, if anything, bots appear to have

larger multipliers than humans. Likewise, “remain” humans appear to have larger multipliers in

response to “leave” bots than to “leave” humans (Panel B). The results are similar for the U.S.

sample (Figure 13): bots appear to be as effective (if not more effective) as humans in moving

humans with opposite views.

These results suggest that while human touch and personal connections may be important,

in the world of social media bots and other “strangers” can play an equally important role in bringing

together or distancing people with different beliefs. Given that bot traffic is considerably cheaper

18

than traffic generated by humans (Forelle et al., 2015), one may anticipate ever greater use of bots

in political campaigns as well as various attempts of humans to shield themselves from bots.

E. Historical contribution of bots

Our analysis suggests that bots may have tangible influence on the tweeting activity of humans.

To quantify the contribution of bots’ traffic to the volume of human tweets, we use the method

developed by Coibion et al. (2017) to construct historical decomposition of the time series for

human tweet volumes. In particular, we are interested in constructing counterfactual time series of

human tweets that would have been observed in the absence of bot traffic.

To implement the Coibion et al. method, we make two departures from specification (1).

First, we use innovations to bots’ volume of tweets rather than the level of bots’ tweets on the

right-hand side of specification (1).12 This step is necessary to have the dynamics of human tweet

activity as a moving average process in terms of “bot” shocks so that we can construct a

counterfactual dynamic of human tweet activity when we turn off “bot” shocks. We continue using

lags of human tweets in levels (rather than in shocks). As a result, we have a combination of

moving average (MA) terms (that is, current and lagged values of bot shocks) and autoregressive

(AR) terms (that is, lags of human traffic supporting campaign 𝑋 and lags of human traffic

supporting campaign 𝑌). To ensure that we have enough persistence in this vector ARMA

representation of the stochastic process for human tweets, we increase the number of lags 𝐾 from

24 to 99. We find that impulse responses based on this modification are virtually identical to the

impulse responses based on specification (1). Thus, for all practical purposes, this modification

does not alter our previous conclusions.

Second, we do not include dummies 𝜓𝑑 for each day of a campaign. While these dummy

variables are helpful to control for trends in the data, they also demean bots’ traffic so that the

contribution of bots to the daily volume of human tweet activity is zero by construction.

Fortunately, we find that removing 𝜓𝑑 makes little difference for the estimated impulse response

and, therefore, our previous conclusions continue to apply.

12 The shocks to bots are constructed as follows. We use specification (1) with bot traffic as the dependent variable

and all lag polynomials starting with 𝑘 = 1. We estimate this specification separately for bots supporting campaign 𝑋

and for bots supporting campaign 𝑌. The residual of each regression is interpreted as the shock to bots supporting the

corresponding campaign.

19

Note that the dynamics of human tweets are now modelled as a system of two equations

with two endogenous variables (e.g., “leave” human tweets and “remain” human tweets) driven

by bot shocks (e.g., “leave” bot shocks and “remain” bot shocks) and by shocks to human tweet

activity (e.g., 𝑒𝑟𝑟𝑜𝑟"𝑙𝑒𝑎𝑣𝑒",𝑡𝑑 and 𝑒𝑟𝑟𝑜𝑟"𝑟𝑒𝑚𝑎𝑛",𝑡𝑑). By plugging these shocks into the estimated

vector ARMA process, we recover actual time series of human tweet activity. By setting bot shocks

to zero, we construct counterfactual dynamics for human tweet activity when bots are not present.

To make time series easier to interpret, we aggregate the generated volumes from 10-minute

frequency to daily frequency.

Panel A of Figure 14 plots times series of actual and counterfactual (“no bot”) daily volume

for pro-“leave” human tweets in the Brexit sample. The difference between the lines is the bots’

contribution. The dynamics of the series suggest that bots had a considerable quantitative effect

on the volume of human tweeting with the largest contribution around the vote date. Panel B of

the figure documents a similar pattern for pro-“remain” human tweets. Importantly, the two surges

generated by bots roughly offset each other: the share of pro-“leave” human tweets in all tweets is

similar for actual tweeting volume and counterfactual tweeting volume (Panel C). Specifically, the

actually observed share of pro-“leave” human tweets on the day before the vote day is 62.76

percent, while the counterfactual share is 60.69 percent. This is a small absolute difference but one

should bear in mind that the Brexit outcome was decided by a small margin (the share of “leave”

votes was at 51.9 percent). Our analysis in Section 2.5 indicates that a percentage point increase

in the share of pro-“leave” tweets in total tweets is associated with a 0.85 percentage point increase

in the share of actual pro-“leave” votes. Hence, the difference between actual and counterfactual

traffic could translate into 1.76 percentage points of actual pro-“leave” vote share. Thus, while

bots nearly offset each other, the difference could have been sufficiently large to influence the

outcome given how close the actual vote was.

Panels D-F replicate the analysis for the 2016 U.S. Presidential Election sample. Similar

to the Brexit sample, bots appear to have a considerable contribution to the human tweet traffic. In

a similar spirit, the pro-Trump and pro-Clinton human traffic generated by bots nearly offsets each

other: actual and counterfactual shares of pro-Trump human tweet volume in total tweet volume

are 48.42 and 53.89 percent respectively on the day before the vote date (note that pro-Clinton

traffic surged days before the vote date while pro-Trump traffic was more stable so that bots

“helped” the Clinton campaign). But again, even this small difference could have played an

20

important role in the outcome of these close-call elections. Specifically, our analysis in Section 2.5

suggests that a percentage point increase in the share of pro-Trump tweets in total tweets is

associated with a 0.59 percentage point increase in the share of actual pro-Trump votes. Therefore,

the observed difference between actual and counterfactual pro-Trump tweet shares suggests that

3.23 percentage points of the actual vote could be rationalized with the influence of bots.

4. Concluding remarks

Social media are a powerful tool for spreading news and information. However, social media might

also propagate misinformation and fake news, especially during high-impact events. It is necessary

to understand how information is diffused and acquired in social networks as it might affect

individuals’ decision-making in real life. Furthermore, the rise of bots (automated agents) in social

media potentially creates greater risks of manipulation as humans cannot detect bots and thus could

be driven and possibly deceived by bots.

This study explores the diffusion of information on Twitter during two high-impact

political events in the U.K. (2016 E.U. Referendum, “Brexit”) and the U.S. (2016 Presidential

Election). Specifically, we empirically examine how information flows during these two events

and how individuals’ actions might be influenced by different types of agents. We have two key

results. First, information about the Brexit Referendum and the U.S. Election is disseminated

quickly on Twitter. During these two highly covered campaigns, reaction to new messages is

largely complete within 1-2 hours which is consistent with fast news cycles and/or low information

rigidity in social media.

Second, we find that individuals are more active in interacting with similar-minded Twitter

users. That is, pro-leave users react faster and stronger to the messages created by other pro-“leave”

users. We document that the extent to which bots can affect humans’ tweeting activities depends

on whether bots’ information is consistent with humans’ preferences. For example, a message by

a pro-leave bot generates a response of pro-leave humans and approximately no response of pro-

remain humans. Furthermore, bots’ messages with a given sentiment largely generate human

messages with the same sentiment. These results lend support to the “echo chambers” view that

Twitter and other social media create networks for individuals sharing the similar political beliefs

so that they tend to interact with others from the same communities and thus their beliefs are

reinforced. By contrast, information from outsiders is more likely to be ignored. Consequently,

21

ideological polarization in social media like Twitter is likely amplified rather than attenuated,

which makes reaching consensus on important public issues more difficult.

Since Twitter and other platforms of social media may create a sense of public consensus

or support, social media could indeed affect public opinions in new ways. Specifically, social bots

could spread and amplify (mis)information thus influencing what humans think about a given issue

and likely reinforcing humans’ beliefs. Not surprising, bots were used during the two campaigns

we study to energize voters and, according to our simple calculations, bots could marginally

contribute to the outcomes of the Brexit and the 2016 U.S. Presidential Election.

These two campaigns and subsequent debates about the role of bots in shaping the

campaigns raise a number of questions about whether policymakers should consider mechanisms

to prevent abuse of bots in the future. Obviously, regulating information flows is an extremely

delicate business in a democratic society characterized by diverse views and tolerance for this

diversity. However, cherishing diversity does not mean that one should allow dumping lies and

manipulations to the extent that the public cannot make a well-informed decision. Where one

should draw the line (e.g., improve media literacy, introduce "code of practice" for social

networks) is a central question for the society.

5. References

Adamic, L.A. and Glance, N., 2005, August. The political blogosphere and the 2004 US election:

divided they blog. In Proceedings of the 3rd International Workshop on Link Discovery,

pp. 36-43, ACM.

Auerbach, A.J. and Gorodnichenko, Y., 2012. Fiscal multipliers in recession and expansion.

In Fiscal Policy after the Financial Crisis, pp. 63-98, University of Chicago press.

Baumeister, R.F., Bratslavsky, E., Finkenauer, C. and Vohs, K.D., 2001. Bad is stronger than

good. Review of General Psychology, 5(4), p.323.

Benoit, K., 2017. The Brexit Debate through Social Media: Deliberative Discussion, or Deliberate

Dysfunction?. [Online] London School of Economics and Political Science. Available at:

http://www.lse.ac.uk/Events/2017/01/20170125t1830vHKT/The-Brexit-Debate-through-

Social-Media [Accessed 23 Apr. 2018].

22

Bermingham, A. and Smeaton, A., 2011. On using Twitter to monitor political sentiment and

predict election results. In Proceedings of the Workshop on Sentiment Analysis where AI

meets Psychology (SAAIP 2011), pp. 2-10.

Bialik, K. and Matsa, K., 2017. Key trends in social and digital news media. [Online] Pew

Research Center. Available at: http://www.pewresearch.org/fact-tank/2017/10/04/key-

trends-in-social-and-digital-news-media/ [Accessed 15 Apr. 2018].

Burnap, P., Gibson, R., Sloan, L., Southern, R. and Williams, M., 2016. 140 characters to victory?:

Using Twitter to predict the UK 2015 General Election. Electoral Studies, 41, pp.230-233.

Chen, H., De, P., Hu, Y.J. and Hwang, B.H., 2014. Wisdom of crowds: The value of stock opinions

transmitted through social media. Review of Financial Studies, 27(5), pp.1367-1403.

Chen, Z. and Lurie, N.H., 2013. Temporal contiguity and negativity bias in the impact of online

word of mouth. Journal of Marketing Research, 50(4), pp.463-476.

Chu, Z., Gianvecchio, S., Wang, H. and Jajodia, S., 2010. Who is tweeting on Twitter: human, bot,

or cyborg?. In Proceedings of the 26th Annual Computer Security Applications

Conference, pp. 21-30, ACM.

Chu, Z., Gianvecchio, S., Wang, H. and Jajodia, S., 2012. Detecting automation of twitter

accounts: Are you a human, bot, or cyborg?. IEEE Transactions on Dependable and Secure

Computing, 9(6), pp.811-824.

Coibion, O. and Gorodnichenko, Y., 2012. What can survey forecasts tell us about information

rigidities?. Journal of Political Economy, 120(1), pp.116-159.

Coibion, O., Gorodnichenko, Y., Kueng, L. and Silvia, J., 2017. Innocent Bystanders? Monetary

Policy and Inequality. Journal of Monetary Economics, 88, pp.70-89.

Cook, D.M., Waugh, B., Abdipanah, M., Hashemi, O. and Rahman, S.A., 2014. Twitter deception

and influence: Issues of identity, slacktivism, and puppetry. Journal of Information

Warfare, 13(1), pp.58-IV.

Dang-Xuan, L., Stieglitz, S., Wladarsch, J. and Neuberger, C., 2013. An investigation of

influentials and the role of sentiment in political communication on Twitter during election

periods. Information, Communication & Society, 16(5), pp.795-825.

DellaVigna, S. and Kaplan, E., 2007. The Fox News effect: Media bias and voting. The Quarterly

Journal of Economics, 122(3), pp.1187-1234.

23

DellaVigna, S., Enikolopov, R., Mironova, V., Petrova, M. and Zhuravskaya, E., 2014. Cross-

border media and nationalism: Evidence from Serbian radio in Croatia. American

Economic Journal: Applied Economics, 6(3), pp.103-132.

Engelberg, J.E. and Parsons, C.A., 2011. The causal impact of media in financial markets. The

Journal of Finance, 66(1), pp.67-97.

Ferrara, E., Varol, O., Davis, C., Menczer, F. and Flammini, A., 2016. The rise of social

bots. Communications of the ACM, 59(7), pp.96-104.

Forelle, M., Howard, P., Monroy-Hernández, A. and Savage, S., 2015. Political bots and the

manipulation of public opinion in Venezuela. arXiv preprint arXiv:1507.07109.

Garrett, R.K., 2009a. Echo chambers online?: Politically motivated selective exposure among

Internet news users. Journal of Computer‐Mediated Communication, 14(2), pp.265-285.

Garrett, R.K., 2009b. Politically motivated reinforcement seeking: Reframing the selective

exposure debate. Journal of Communication, 59(4), pp.676-699.

Gentzkow, M. and Shapiro, J.M., 2011. Ideological segregation online and offline. The Quarterly

Journal of Economics, 126(4), pp.1799-1839.

Gentzkow, M., 2006. Television and voter turnout. The Quarterly Journal of Economics, 121(3),

pp.931-972.

Gerber, A.S., Karlan, D. and Bergan, D., 2009. Does the media matter? A field experiment

measuring the effect of newspapers on voting behavior and political opinions. American

Economic Journal: Applied Economics, 1(2), pp.35-52.

Gottfried, J. and Shearer, E., 2016. News Use Across Social Media Platforms 2016. [Online] Pew

Research Center's Journalism Project. Available at:

http://www.journalism.org/2016/05/26/news-use-across-social-media-platforms-2016/

[Accessed 16 Apr. 2018].

Gruzd, A. and Roy, J., 2014. Investigating political polarization on Twitter: A Canadian

perspective. Policy & Internet, 6(1), pp.28-45.

Gruzd, A., Wellman, B. and Takhteyev, Y., 2011. Imagining Twitter as an imagined

community. American Behavioral Scientist, 55(10), pp.1294-1318.

Halberstam, Y. and Knight, B., 2016. Homophily, group size, and the diffusion of political

information in social networks: Evidence from Twitter. Journal of Public Economics, 143,

pp.73-88.

24

Hargittai, E., Gallo, J. and Kane, M., 2008. Cross-ideological discussions among conservative and

liberal bloggers. Public Choice, 134(1-2), pp.67-86.

Haustein, S. and Costas, R., 2014. Determining Twitter audiences: Geolocation and number of

followers. ALM, 4, p.6.

Haustein, S., Bowman, T.D., Holmberg, K., Tsou, A., Sugimoto, C.R. and Larivière, V., 2016.

Tweets as impact indicators: Examining the implications of automated “bot” accounts on

Twitter. Journal of the Association for Information Science and Technology, 67(1),

pp.232-238.

Heath, C., 1996. Do people prefer to pass along good or bad news? Valence and relevance of news

as predictors of transmission propensity. Organizational Behavior and Human Decision

Processes, 68(2), pp.79-94.

Hong, S. and Kim, S.H., 2016. Political polarization on twitter: Implications for the use of social

media in digital governments. Government Information Quarterly, 33(4), pp.777-782.

Howard, P.N. and Kollanyi, B., 2016. Bots, #StrongerIn, and #Brexit: Computational Propaganda

during the U.K.-EU Referendum. Working Paper 2016.1. Oxford, U.K.: Project on

Computational Propaganda.

Jordà, Ò., 2005. Estimation and inference of impulse responses by local projections. American

Economic Review, 95(1), pp.161-182.

Kim, J. and Yoo, J., 2012, December. Role of sentiment in message propagation: Reply vs. retweet

behavior in political communication. In 2012 International Conference on Social

Informatics, pp. 131-136, IEEE.

Kollanyi, B., Howard, P.N. and Woolley, S.C., 2016. Bots and Automation over Twitter during

the U.S. Election. Data Memo 2016.4. Oxford, U.K.: Project on Computational

Propaganda.

Kwak, H., Lee, C., Park, H. and Moon, S., 2010. What is Twitter, a social network or a news

media?. In Proceedings of the 19th International Conference on World Wide Web, pp. 591-

600, ACM.

Meffert, M.F., Chung, S., Joiner, A.J., Waks, L. and Garst, J., 2006. The effects of negativity and

motivated information processing during a political campaign. Journal of

Communication, 56(1), pp.27-51.

25

Loria, S., 2018. TextBlob Documentation. [Online] Available at:

https://media.readthedocs.org/pdf/textblob/dev/textblob.pdf [Accessed 16 Apr. 2018].

Mullainathan, S. and Shleifer, A., 2005. The Market for News. American Economic Review, 95(4),

pp.1031-1053.

Sivanesh, S., Kavin, K. and Hassan, A.A., 2013, August. Frustrate Twitter from automation: How

far a user can be trusted?. In Human Computer Interactions (ICHCI), 2013 International

Conference, pp. 1-5, IEEE.

Stempel, G.H., Hargrove, T. and Bernt, J.P., 2000. Relation of growth of use of the Internet to

changes in media use from 1995 to 1999. Journalism & Mass Communication

Quarterly, 77(1), pp.71-79.

Stieglitz, S. and Dang-Xuan, L., 2013. Emotions and information diffusion in social media—

sentiment of microblogs and sharing behavior. Journal of Management Information

Systems, 29(4), pp.217-248.

Takhteyev, Y., Gruzd, A. and Wellman, B., 2012. Geography of Twitter networks. Social

Networks, 34(1), pp.73-81.

Tetlock, P.C., 2007. Giving content to investor sentiment: The role of media in the stock

market. The Journal of Finance, 62(3), pp.1139-1168.

Tumasjan, A., Sprenger, T.O., Sandner, P.G. and Welpe, I.M., 2011. Election forecasts with

Twitter: How 140 characters reflect the political landscape. Social Science Computer

Review, 29(4), pp.402-418.

Yoo, E., Rand, W., Eftekhar, M. and Rabinovich, E., 2016. Evaluating information diffusion speed

and its determinants in social media networks during humanitarian crises. Journal of

Operations Management, 45, pp.123-133.

26

Figure 1. Dynamics of tweets generated by humans and bots: U.K. Brexit

Notes: This figure shows the dynamics of tweets created by bots (Panels A and C) and humans (Panels B and D) for the

Brexit sample. Time (horizontal axis) in Panels A and B shows 30 days before and after the Referendum day while time

(horizontal axis) in Panels C and D presents hours of days around the event. The dashed blue line and the solid black line

show the volumes of pro-leave and pro-remain tweets, respectively.

27

Figure 2. Dynamics of tweets generated by humans and bots: 2016 U.S. Presidential Election

Notes: This figure shows the dynamics of tweets created by bots (Panels A and C) and humans (Panels B and D) for the

U.S. Election sample. Time (horizontal axis) in Panels A and B shows 30 days before and after the Election Day while

time (horizontal axis) in Panels C and D presents hours of days around the event. The dashed blue line and the solid black

line show the volumes of pro-Trump and pro-Clinton tweets, respectively.

28

Figure 3. Time series of tweets created by Russian-language accounts

Notes: This figure shows the dynamics of daily tweets created by bot and human accounts that have Russian as the profile

language. Panels A and B show the number of daily tweets in logarithm for the Brexit and U.S. Election samples,

respectively. The left vertical axis shows the logarithm of the number of bots’ tweets while the right vertical axis shows

the logarithm of the number of humans’ tweets. Time (horizontal axis) shows 30 days before and after the event day. The

dashed blue line and the solid black line show the volumes of humans’ and bots’ tweets, respectively.

29

Figure 4. Sentiment

Notes: This figure shows the dynamics of tweets with different sentiment created by bots and humans for the samples of

Brexit (Panels A and B) and U.S. Election (Panels C and D). Time (horizontal axis) shows 30 days before and after the

event day. The dashed blue line, the solid black line, and the dashed-dotted green line show the volumes of tweets with

negative, positive, and neutral sentiment, respectively.

30

Figure 5. Twitter activity and vote outcomes by geography

Notes: This figure shows the correlation between the shares of humans’ pro-leave tweets and the actual vote shares by

regions for the Brexit sample (Panel A) and the correlation between the shares of humans’ pro-Trump tweets and the

actual vote shares for the U.S. Election sample (Panel B). 𝛽 below each panel shows the estimated slope and standard

error (in parentheses).

East Midlands

London

North West

Northern Ireland

Scotland

South East

South West

Wales

West Midlands

Yorkshire East

50

55

60

65

70

Sh

are

of

rep

ort

ed lea

ve v

ote

s

50 55 60 65Share of pro-leave tweets created by humans

β = 0.8503 (0.0412)

Panel A: Brexit

AL

AZ

AR

CA

CO

DE

DC

FLGA

HI

IN

IA

KS

KY

LA

MD MA

MIMN

MS MO

NE

NVNH

NM

NY

OH

OK

OR

RI

SC

TN

VA

WV

AK

ME

SD

CT

ID

IL

MT

NJ

NC

ND

PA

TX

UT

VT

WA

WI

WY

020

40

60

80

Sh

are

of

rep

ort

ed p

ro-T

rum

p v

ote

s

20 40 60 80Share of pro-Trump tweets created by humans

β = 0.5871 (0.1957)

Panel B: U.S. Election

31

32

Figure 6. Retweeting activity by humans and bots

Notes: This figure shows the average number of retweets made after 10-120 minutes since the original tweets were

created for the Brexit sample (Panels A, C, E) and the U.S. Election sample (Panels B, D, F). Panels A and B show the

average retweets of all tweets. Panels C and D show the average retweets of the tweets originated by humans. Panels E

and F show the average retweets of the tweets originated by bots. The solid black line refers to the retweeting activities

of humans while the dashed red line refers to the retweeting activities of bots. Time (horizontal axis) is in 10-minute

intervals.

33

Figure 7. Share of human- and bot-generate retweets by humans and bots

Notes: This figure shows the interactions between humans and bots in retweeting for the Brexit sample (Panel A) and the

U.S. Election sample (Panel B). The solid black line refers to the share of the number of retweets made by bots in the

case the original tweets were originated by humans. The dashed blue line refers to the share of the number of retweets

made by humans in the case the original tweets were originated by humans. Time (horizontal axis) is in days.

34

Figure 8. U.K. (baseline)

Notes: This figure reports estimate impulse responses of humans to tweets created by bots for the Brexit sample. Panels

A and B show the reactions of humans supporting the leave campaign and the remain campaign, respectively. Time

(horizontal axis) is in 10-minute intervals. The thin black line refers to the reactions to pro-leave bots while the thick blue

line refers to the reactions to pro-remain bots. The grey shaded area and the dashed blue lines indicate 1.96 standard

deviation confidence intervals for responses to pro-leave bots and pro-remain bots, respectively.

35

Figure 9. U.S. (baseline)

Notes: This figure reports estimate impulse responses of humans to tweets created by bots for the U.S. Election sample.

Panels A and B show the reactions of humans supporting Trump and Clinton, respectively. Time (horizontal axis) is in

10-minute intervals. The thin black line refers to the reactions to pro-Trump bots while the thick blue line refers to the

reactions to pro-Clinton bots. The grey shaded area and the dashed blue lines indicate 1.96 standard deviation confidence

intervals for responses to pro-Trump bots and pro-Clinton bots, respectively.

36

Figure 10. U.K. (by sentiment)

Notes: This figure reports the estimated impulse responses (measured as multipliers) of humans to bots’ tweets with

different sentiment for the Brexit sample. Panels A and B show reactions of humans supporting the leave campaign and

the remain campaign, respectively. Time (horizontal axis) is in 10-minute intervals. The solid black line refers to the

reactions to pro-leave bots while the solid blue line refers to the reactions to pro-remain bots. The grey shaded area and

the dashed blue lines indicate 1.96 standard deviation confidence intervals for responses to pro-leave bots and pro-remain

bots, respectively.

37

Figure 11. U.S. (by sentiment)

Notes: This figure reports the estimated impulse responses (measured as multipliers) of humans to bots’ tweets with

different sentiment for the U.S. Election sample. Panels A and B show reactions of humans supporting Trump and

Clinton, respectively. Time (horizontal axis) is in 10-minute intervals. The solid black line refers to the reactions to pro-

Trump bots while the solid blue line refers to the reactions to pro-Clinton bots. The grey shaded area and the dashed blue

lines indicate 1.96 standard deviation confidence intervals for responses to pro-Trump bots and pro-Clinton bots,

respectively.

38

Figure 12. U.K.: humans vs bots in effectiveness to generate tweets of the other side

Notes: This figure reports the estimated impulse responses (measured as multipliers) of humans to tweets supporting the

opposite campaign for the Brexit sample. Panels A and B show reactions of humans supporting the leave campaign and

the remain campaign, respectively. Time (horizontal axis) is in 10-minute intervals. The thin black line refers to the

reactions of humans to humans while the thick blue line refers to the reactions of humans to bots. The grey shaded area

and the dashed blue lines indicate 1.96 standard deviation confidence intervals for responses to tweets created by humans

and bots, respectively.

39

Figure 13. U.S.: humans vs bots in effectiveness to generate tweets of the other side

Notes: This figure reports the estimated impulse responses (measured as multipliers) of humans to tweets supporting the

opposite campaign for the U.S. Election sample. Panels A and B show reactions of humans supporting Trump and

Clinton, respectively. Time (horizontal axis) is in 10-minute intervals. The thin black line refers to the reactions of humans

to humans while the thick blue line refers to the reactions of humans to bots. The grey shaded area and the dashed blue

lines indicate 1.96 standard deviation confidence intervals for responses to tweets created by humans and bots,

respectively.

40

Figure 14. Historical contribution

Notes: This figure reports the historical contribution of bots’ traffic to humans’ tweet volumes. Panels A, B, and C show

bots’ contribution to the volumes of pro-leave, pro-remain tweets and the share of pro-leave tweets, respectively. Panels

D, E, and F show bots’ contribution to the volumes of pro-Trump, pro-Clinton tweets, and the share of pro-Trump tweets,

respectively. Time (horizontal axis) is in days. The solid black line refers to the observed human tweet activity while the

dashed red line refers to human tweet activity when bots are not present.


Recommended