1 January 4 th 2011 Social Mood, “Deep” History, and the Elliott Wave Principle J. Casti 1 , J. Meyer 2 , R.P Taylor 3 1. International Institute for Applied Systems Analysis, Laxenburg, Austria 2. Independent Scholar, Boulder, Colorado 3. Physics Department, University of Oregon, Eugene, OR97403, USA Abstract: In this paper, we propose that the collective mood of society changes in a recognizable pattern. We further argue that Elliott waves, traditionally used to map the patterns of peaks and troughs observed in financial market price movements, serve as a strong candidate for describing this pattern. Using this formulism, we characterize the historical record of civilization over a period of more than five thousand years. Keywords: Social Mood, Collective Events, Emergence, Elliot Waves. Introduction: Social Mood and Collective Events One of the most evident facts in psychology is that group behavior may often be very different from the behavior displayed by any individual making up the group. To a system theorist, “crowd behavior” is what’s termed an “emergent” property, since it comes out of the interaction of the individuals composing the group, and cannot be seen by examination of any single individual; it is a group property, not the property of any person in the group. Examples of such collective social events are phenomena like shifts in political ideology, tastes in books, films and music, or the outcome of an election. The goal of this paper is to look at social events over much longer timescale events, like the rise and fall of an empire or an economic phenomenon like globalization and their relationship to the “mood” of a population. In order to proceed, the concept of social mood needs to be defined - what it means and how it might be measured. At any moment the mood of a group – an institution, state, continent or the world – is how that group feels about the future. Is the group optimistic, pessimistic, or neutral? This question has to be answered on the time scale appropriate for the kind of event being studied. For instance, for research focused on a short timescale event like the type of movies people will like next year, it would be incorrect to monitor the mood of the population over a span of decades. However, decades would be the appropriate timescale for a phenomenon like globalization. But decades might be too short for a phenomenon like the collapse of a world power. How can social mood be measured once the appropriate timescale has been selected? Public opinion surveys and questionnaires have limited value, since they don’t necessarily reflect what people actually do. Nor do surveys take into account that people are influenced by others and 1 Corresponding email: [email protected]2 [email protected]3 [email protected]
Transcript
1
January 4th 2011
Social Mood, “Deep” History, and the Elliott Wave Principle
J. Casti1, J. Meyer2, R.P Taylor3
1. International Institute for Applied Systems Analysis, Laxenburg, Austria 2. Independent Scholar, Boulder, Colorado 3. Physics Department, University of Oregon, Eugene, OR97403, USA
Abstract: In this paper, we propose that the collective mood of society changes in a recognizable pattern. We further argue that Elliott waves, traditionally used to map the patterns of peaks and troughs observed in financial market price movements, serve as a strong candidate for describing this pattern. Using this formulism, we characterize the historical record of civilization over a period of more than five thousand years.
Keywords: Social Mood, Collective Events, Emergence, Elliot Waves.
Introduction: Social Mood and Collective Events
One of the most evident facts in psychology is that group behavior may often be very different from the behavior displayed by any individual making up the group. To a system theorist, “crowd behavior” is what’s termed an “emergent” property, since it comes out of the interaction of the individuals composing the group, and cannot be seen by examination of any single individual; it is a group property, not the property of any person in the group. Examples of such collective social events are phenomena like shifts in political ideology, tastes in books, films and music, or the outcome of an election. The goal of this paper is to look at social events over much longer timescale events, like the rise and fall of an empire or an economic phenomenon like globalization and their relationship to the “mood” of a population.
In order to proceed, the concept of social mood needs to be defined - what it means and how it might be measured. At any moment the mood of a group – an institution, state, continent or the world – is how that group feels about the future. Is the group optimistic, pessimistic, or neutral? This question has to be answered on the time scale appropriate for the kind of event being studied. For instance, for research focused on a short timescale event like the type of movies people will like next year, it would be incorrect to monitor the mood of the population over a span of decades. However, decades would be the appropriate timescale for a phenomenon like globalization. But decades might be too short for a phenomenon like the collapse of a world power.
How can social mood be measured once the appropriate timescale has been selected? Public opinion surveys and questionnaires have limited value, since they don’t necessarily reflect what people actually do. Nor do surveys take into account that people are influenced by others and
don’t make their choices independently. After all, the very essence of social cohesion is clustering together, the very opposite of stand-alone, independent decision-making.
In contrast, the financial market average is an effective measure of the social mood that reflects both actions and “herding” (Dreman, 1977). A market index like the Dow Jones Industrial Average (DJIA) in New York serves to characterize the “bets” people make about the future on all time scales. It is easy to obtain from the daily newspaper, has very little measurement error, and is available for very long periods of time – all highly desirable qualities for any practical “sociometer”. However, the historical events addressed in this paper occur over a time scale of millennia and therefore include eras when financial markets didn’t exist. It is then necessary to move beyond financial markets and consider alternative indicators of social mood.
Empirical evidence strongly suggests that the types of collective events that take place in periods of positive social mood differ dramatically from what can be expected when the mood is negative (Prechter, 1999, Casti, 2010). For example, when people are optimistic about the future (positive mood), everyday words like “unifying”, “liberating”, “togetherness”, “tolerant”, and “coming together”, describe the sorts of events that are likely to seen. Their opposites, labels such as “fragmentation”, “separation”, “restricting”, and “bigoted/xenophobic” characterize events that typically occur in times when the social mood is negative.
An alternative sociometer for determining mood might therefore be found by examining the character of historical events, and categorizing them according to the social mood (positive, negative, neutral) favoring such events. Previously, Robert Prechter carried out this procedure for events recorded in history, and produced a chart of social mood spanning two thousand years. Here we extend this approach to map social mood across five thousand years. By doing so, we argue that the increases and decreases of this record in regard to social wealth can be explained by Elliot waves – a pattern first described in the context of financial data by Ralph N. Elliott in the 1930s (Frost and Prechter, 1978).
Global Social Mood and the Process of Globalization
To begin the investigation, we illustrate the relationship between collective mood and collective events by considering the specific phenomenon of globalization. Globalization is a label for an economic landscape that treats the world as one gigantic marketplace in which there is a free flow of capital, labor, materials and ideas. As discussed in the introduction, during periods of maximum social mood, expected collective events are those labeled with words like “unifying”, “joining” and “expanding”. Globalization is similarly a reflection of positive social mood.
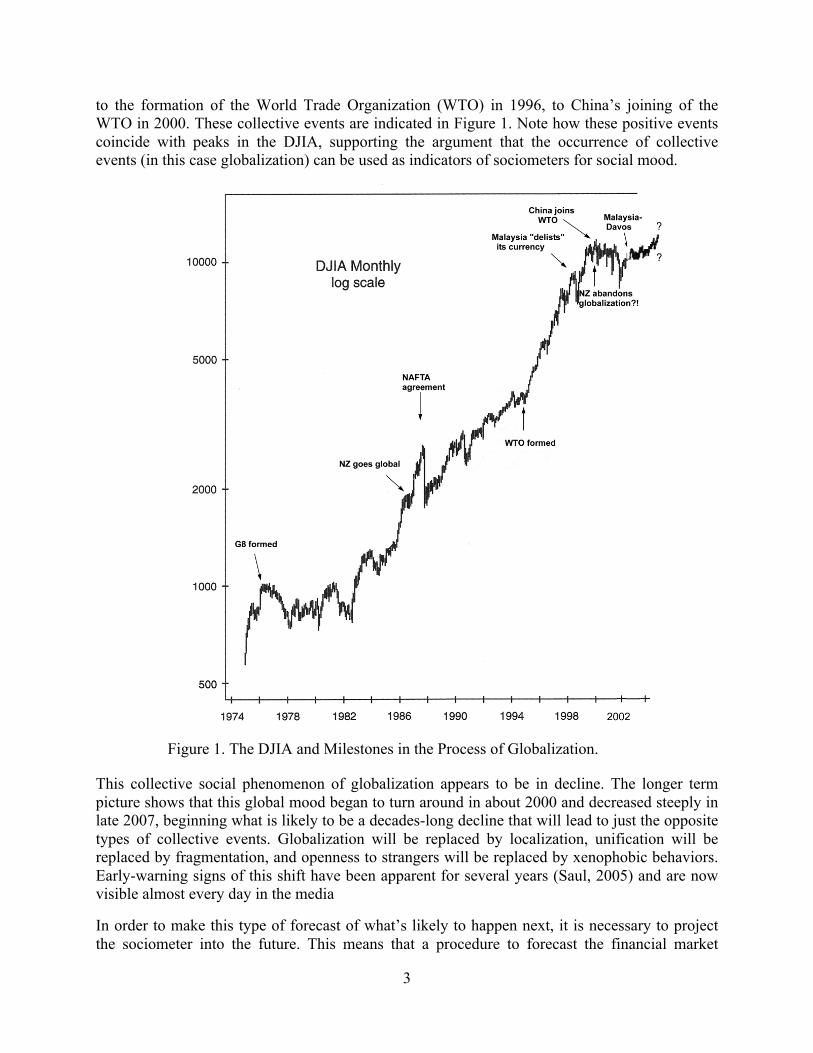
Since the driving force behind globalization is, to a substantial degree, American corporations, the DJIA can be considered an indicator of the overall global social mood since the New York Stock Exchange is the closest thing we have to a global financial market. The DJIA is shown in Figure 1 spanning the period 1975 to 2002. The observed background increase in the DJIA over this period serves as a sociometer of the rise in positive social mood. Similarly, variations on top of this background serve as indicators of local peaks and troughs in the social mood.
During this period of social optimism, a number of major milestones occurred on the path to globalization, from the launching of the basic idea itself at the World Economic Forum in 1975
3
to the formation of the World Trade Organization (WTO) in 1996, to China’s joining of the WTO in 2000. These collective events are indicated in Figure 1. Note how these positive events coincide with peaks in the DJIA, supporting the argument that the occurrence of collective events (in this case globalization) can be used as indicators of sociometers for social mood.
Figure 1. The DJIA and Milestones in the Process of Globalization.
This collective social phenomenon of globalization appears to be in decline. The longer term picture shows that this global mood began to turn around in about 2000 and decreased steeply in late 2007, beginning what is likely to be a decades-long decline that will lead to just the opposite types of collective events. Globalization will be replaced by localization, unification will be replaced by fragmentation, and openness to strangers will be replaced by xenophobic behaviors. Early-warning signs of this shift have been apparent for several years (Saul, 2005) and are now visible almost every day in the media
In order to make this type of forecast of what’s likely to happen next, it is necessary to project the sociometer into the future. This means that a procedure to forecast the financial market
4
averages is needed. In fact, there exist literally thousands of such procedures that have been developed over the years [ Eng, 1988]. For the purposes of this paper, one of the most useful procedures turns out to be Elliott Wave Theory, which will be described in the next section.
The Elliott Wave Principle
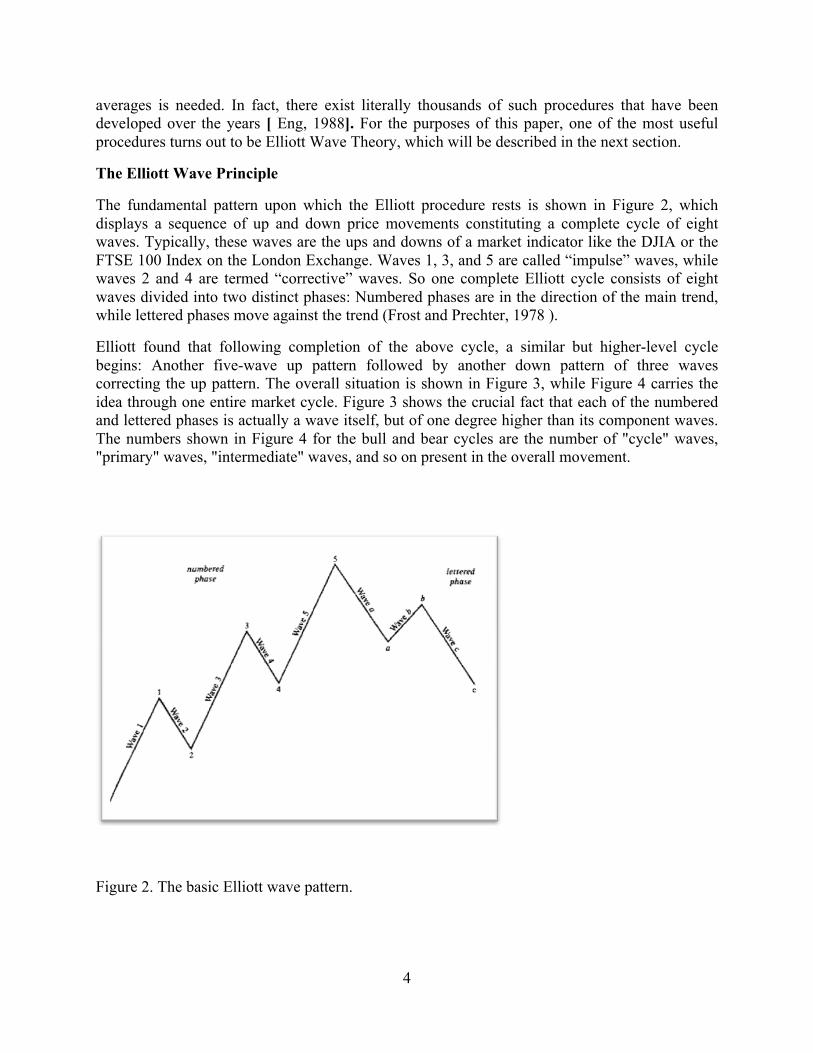
The fundamental pattern upon which the Elliott procedure rests is shown in Figure 2, which displays a sequence of up and down price movements constituting a complete cycle of eight waves. Typically, these waves are the ups and downs of a market indicator like the DJIA or the FTSE 100 Index on the London Exchange. Waves 1, 3, and 5 are called “impulse” waves, while waves 2 and 4 are termed “corrective” waves. So one complete Elliott cycle consists of eight waves divided into two distinct phases: Numbered phases are in the direction of the main trend, while lettered phases move against the trend (Frost and Prechter, 1978 ).
Elliott found that following completion of the above cycle, a similar but higher-level cycle begins: Another five-wave up pattern followed by another down pattern of three waves correcting the up pattern. The overall situation is shown in Figure 3, while Figure 4 carries the idea through one entire market cycle. Figure 3 shows the crucial fact that each of the numbered and lettered phases is actually a wave itself, but of one degree higher than its component waves. The numbers shown in Figure 4 for the bull and bear cycles are the number of "cycle" waves, "primary" waves, "intermediate" waves, and so on present in the overall movement.
Figure 2. The basic Elliott wave pattern.
5
Figure 3. A major Elliott wave pattern, taken from Frost and Prechter, 1978
Figure 4. A complete market cycle.
The distilled essence of Elliott-wave formation consists of the following four principles:
6
i. Action is followed by reaction. ii. Impulse waves subdivide into five waves of lower degree, while corrective waves subdivide
into three waves of lower degree. iii. A complete cycle consists of an eight-wave movement (five up and three down), which
then becomes two subdivisions of the wave of next higher degree. iv. The time frame does not enter into the pattern, so that the waves may be stretched or
compressed along either the horizontal or the vertical axis without losing the underlying pattern.
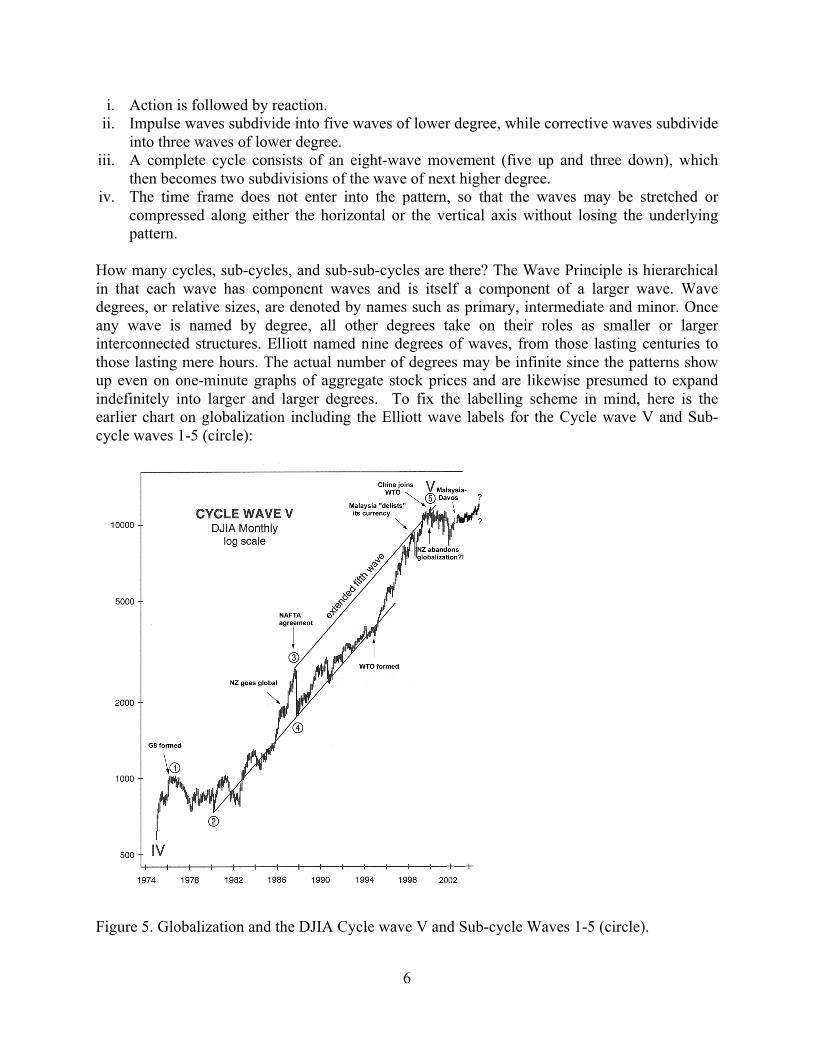
How many cycles, sub-cycles, and sub-sub-cycles are there? The Wave Principle is hierarchical in that each wave has component waves and is itself a component of a larger wave. Wave degrees, or relative sizes, are denoted by names such as primary, intermediate and minor. Once any wave is named by degree, all other degrees take on their roles as smaller or larger interconnected structures. Elliott named nine degrees of waves, from those lasting centuries to those lasting mere hours. The actual number of degrees may be infinite since the patterns show up even on one-minute graphs of aggregate stock prices and are likewise presumed to expand indefinitely into larger and larger degrees. To fix the labelling scheme in mind, here is the earlier chart on globalization including the Elliott wave labels for the Cycle wave V and Sub-cycle waves 1-5 (circle):
Figure 5. Globalization and the DJIA Cycle wave V and Sub-cycle Waves 1-5 (circle).
7
Historical Cycles
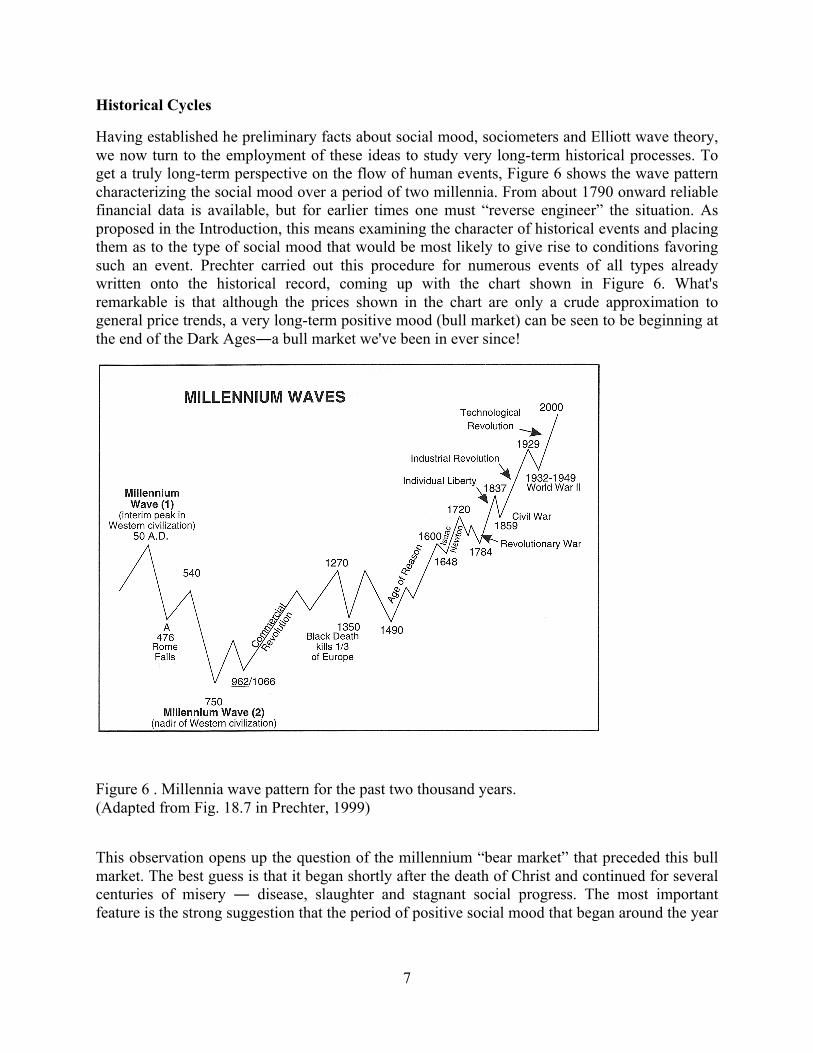
Having established he preliminary facts about social mood, sociometers and Elliott wave theory, we now turn to the employment of these ideas to study very long-term historical processes. To get a truly long-term perspective on the flow of human events, Figure 6 shows the wave pattern characterizing the social mood over a period of two millennia. From about 1790 onward reliable financial data is available, but for earlier times one must “reverse engineer” the situation. As proposed in the Introduction, this means examining the character of historical events and placing them as to the type of social mood that would be most likely to give rise to conditions favoring such an event. Prechter carried out this procedure for numerous events of all types already written onto the historical record, coming up with the chart shown in Figure 6. What's remarkable is that although the prices shown in the chart are only a crude approximation to general price trends, a very long-term positive mood (bull market) can be seen to be beginning at the end of the Dark Ages―a bull market we've been in ever since!
Figure 6 . Millennia wave pattern for the past two thousand years. (Adapted from Fig. 18.7 in Prechter, 1999)
This observation opens up the question of the millennium “bear market” that preceded this bull market. The best guess is that it began shortly after the death of Christ and continued for several centuries of misery ― disease, slaughter and stagnant social progress. The most important feature is the strong suggestion that the period of positive social mood that began around the year
8
1000AD is now coming to a close. The millennium wave is still in its infancy, so we can expect it to last at least another thousand years and probably considerably longer.
Figure 7(a). World Events from 3550BC to 2050BC.
Figures 7(a)-(d) display the Elliott wave pattern for the period 3550BC to 2450AD, a span of six millennia. The pattern shown in the figures is derived from a long term chart found on p. 122 of (Frost and Prechter, 1978), which covered the period from 950 to l978. The authors used parish records of commodity prices from the eighteenth back to the twelfth centuries and estimated a price increase from 950 to 1250. Since the decline from the end of the Roman Empire to 950 was about 500 years, we posit a total Elliott Wave of l500 years (l000 years up, 500 down.) Taking the period from 950 to 2450 as a basic unit, we repeat it back in time for three cycles to cover the period 3550BC to 2450AD. All of the waves are identical in form. Notice that although Wave IV is the same shape as Waves II and VI, it is 200 years longer. Waves 1 and 2 of VIII are also longer than usual and waves 3, 4 and 5 are shorter. A period of 1500 years appears to be the longest wave, unless we have finally achieved sufficient density to create a wave that is 4000 years up and 2000 years down. But we won't know that for at least a thousand years! The chart is not a mathematical function of any historical process, nor is it the result of a causal sequence. There is no cause and effect relationship between any historical event and the shape of the chart. The chart is an emergent property of distributed social processes acting over the course of time.
9
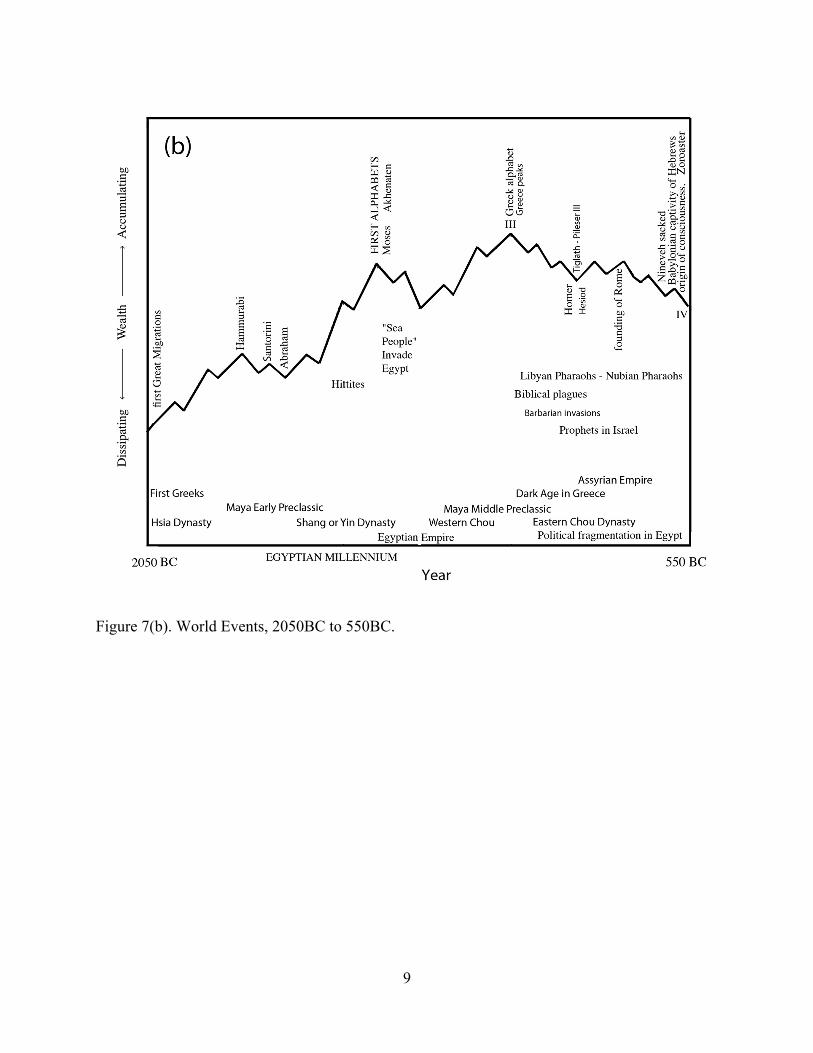
Figure 7(b). World Events, 2050BC to 550BC.
10
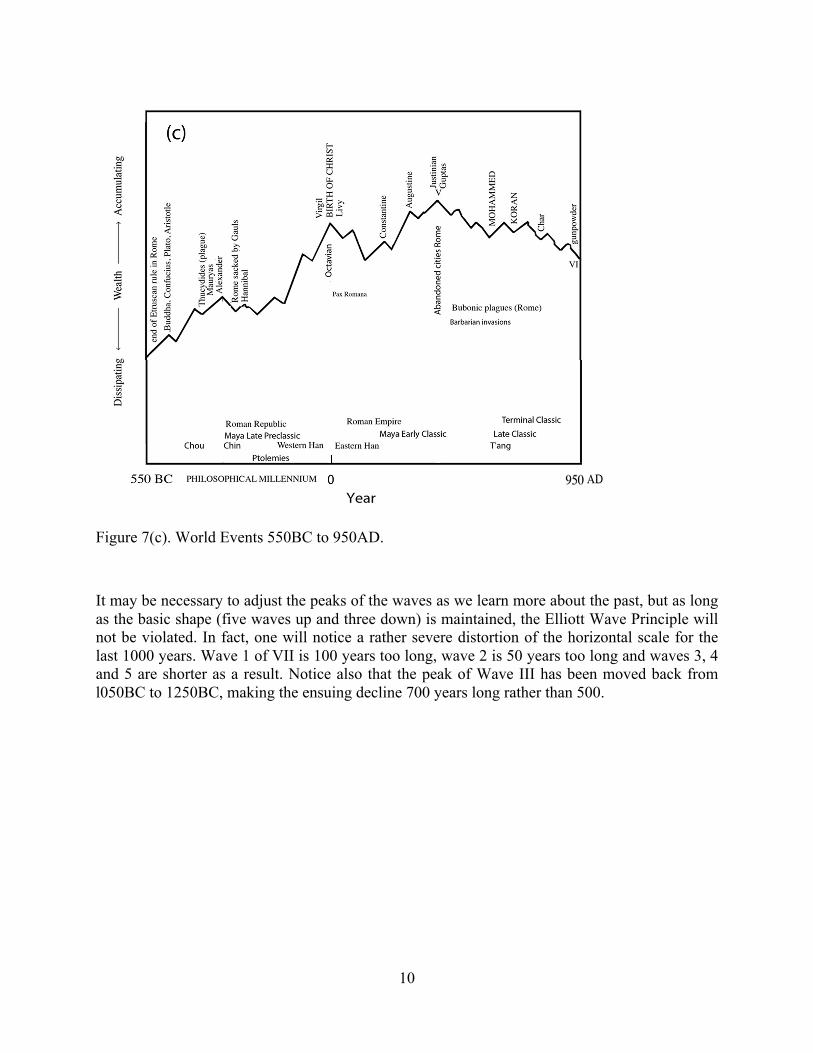
Figure 7(c). World Events 550BC to 950AD.
It may be necessary to adjust the peaks of the waves as we learn more about the past, but as long as the basic shape (five waves up and three down) is maintained, the Elliott Wave Principle will not be violated. In fact, one will notice a rather severe distortion of the horizontal scale for the last 1000 years. Wave 1 of VII is 100 years too long, wave 2 is 50 years too long and waves 3, 4 and 5 are shorter as a result. Notice also that the peak of Wave III has been moved back from l050BC to 1250BC, making the ensuing decline 700 years long rather than 500.
11
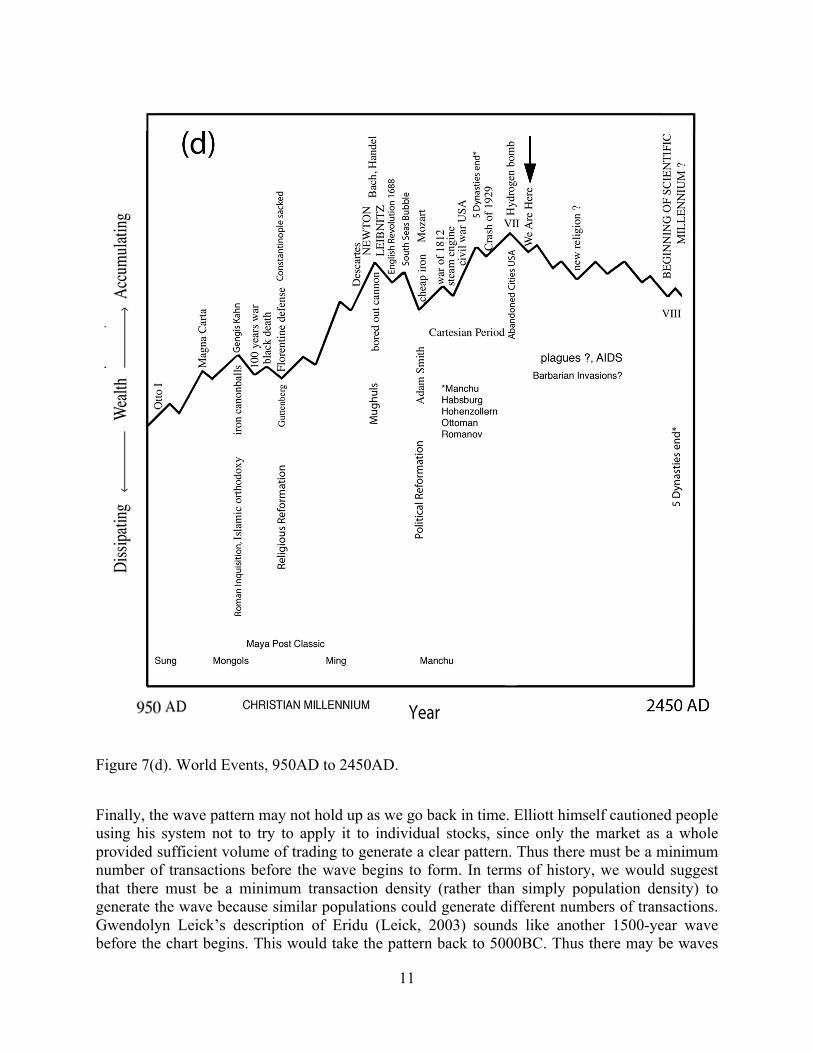
Figure 7(d). World Events, 950AD to 2450AD.
Finally, the wave pattern may not hold up as we go back in time. Elliott himself cautioned people using his system not to try to apply it to individual stocks, since only the market as a whole provided sufficient volume of trading to generate a clear pattern. Thus there must be a minimum number of transactions before the wave begins to form. In terms of history, we would suggest that there must be a minimum transaction density (rather than simply population density) to generate the wave because similar populations could generate different numbers of transactions. Gwendolyn Leick’s description of Eridu (Leick, 2003) sounds like another 1500-year wave before the chart begins. This would take the pattern back to 5000BC. Thus there may be waves
12
that continue well beyond the beginning of our chart, although there may only be waves of smaller and smaller degree as exemplified more recently by the patterns of empire in India, where allegiance to caste was stronger than allegiance to place or person. Except for the Mauryas, the Guptas and the Mughuls, there were only minor states that seem to correspond to the smallest subdivisions of the chart. The Mauryas peaked with wave 1 of V, the Guptas peaked with wave 5 of V and the Mughuls peaked with Wave 3 of VII. Discussion of the chart’s relation to the historical record. Among some initial observations, the chart seems to reveal a rather significant lag in the unfolding of events. Notice that although King Menes united upper and lower Egypt at the peak of Wave 3 of I, it was not until towards the end of wave III in what is labeled the Egyptian Millennium that Egypt became preeminent. Likewise, although the first alphabets were made at the peak of wave 3 of III and the Greek alphabet was complete at the peak of Wave III, it was not until the beginning of Wave V that the Greek philosophers began to explore the implications of the relationship between the written word and the real world. The rise of Chinese hegemony and philosophy may show a similar pattern. Finally, the impact of the birth of Christ seems to be delayed until what is labeled the Christian Millennium, from 950 to 1950. An interesting question concerns why the Babylonians abandon their cities at the end of wave III, Romans abandon their cities at the end of wave V and Americans abandon their cities at the end of wave VII? One possible explanation, a study published in The Lancet, (Lewis et al, 1992) found that a higher number of cases of schizophrenia among men living in cities than in the country was not the result of migration but was apparently caused by growing up in the city. Could high population density by itself cause emotional pathologies that result in the abandonment of cities? Notice that Biblical plagues occurred in wave A of IV, bubonic plagues and malaria in Rome in wave A of VI and AIDS in our own wave A of VIII. Could this be due to excess population in the cities? Could disease be a cause for abandoning cities, at least in Babylon and Rome? Recent research in the field of paleopathology (Roberts and Manchester, 1995) should provide interesting correlates to the chart. Even though the populations of these ancient cities were not significantly large nor significantly dense, the declines in population were severe, on the order of forty to fifty percent (McNeill, 1976). The climactic explosion of world population in the last century, fueled by the redistribution of foods from the New World, implies a corresponding collapse. A decline in population of ninety percent would not be out of the question. A disease such as AIDS would be the perfect mechanism for such a decline, partly because of its long latency and partly because of our consistent underestimation of its virulence. Malaria is rebounding in the third world, drug resistant tuberculosis is spreading in large cities and particularly in prisons, and is particularly hard to detect in patients with HIV/AIDS. Influenza is capable of mutating into deadly forms, and as the plague outbreak in India in l994 demonstrated, all of these diseases are easily and rapidly spread worldwide by jet travelers. This kind of decimation would also be appropriate for the end of a four thousand year trend. Almost as a forecast, recent articles have focused on how we have reached the end of evolution as homo sapiens, how we have subdued every selective mechanism (Ward, 1995).
13
Then there is the matter of the importance of the waves of degree 3, at least in more recent times. Elliott points out that the third wave tends to be the most powerful, either in the main trend, where it is in the middle, or in a correction, where it occurs at the end. It can be argued that the Roman Empire peaked in the first century BC, at the end of wave 3 of V, even though Rome did not fall for another 500 years. This was also the end of the Ptolemaic dynasty. At the end of wave 3 of VII, the Ming dynasty ended and the Maya suffered their final collapse at the hands of the Spanish. At the end of wave iii of 5 of VII, however, five dynasties ended: the Manchu in China, the Habsburg in Austria, the Hohenzollern in Germany, the Ottoman in Turkey and the Romanov in Russia. It was also about this time that Oswald Spengler conceived and wrote The Decline of the West. The decline that he sensed was only wave iv, but it was quite real. This omission suggests that it might be rewarding to look more closely at the periods around the time of King Menes (wave 3 of I) and of Abraham (wave 3 of III.) This is true also for waves of degree iii (particularly since Pericles lived at the end of wave iii of 1 of V.) The case of Charlemagne is especially interesting. He came to power at about the peak of wave ii of C of VI and attempted to rebuild the Roman Empire. But with all his talent and power, he could not create a lasting dynasty. An interesting sidelight: The castles that were built in Charlemagne’s time by local nobility were not defenses against roving bands of marauders but defense against Charlemagne’s own tax collectors. Charlemagne's heirs dissipated his work and it was not until after the end of wave VI, at 950 that Otto I was able to pull the Holy Roman Empire together. From 962, it lasted nine hundred and fifty years (almost the entire length of wave VII.). 950 was also the peak of infant abandonment in Europe and according to McNeil (McNeal 1976) a period of stabilization of epidemic diseases. Even numbered waves have their own appeal. The end of the decline during wave 2 of VII produced the religious reformation, which does not seem impressive until it is noticed that the end of the decline during wave 4 (l789) produced a political reformation. Perhaps there are other periods of reform during earlier waves of similar degree and during waves of smaller degree. The school of Stoicism was founded during wave 2 of V (235 to l50BC) and recurred during wave 4 of V (Domitian’s banishment of philosophers from the Roman capitol would certainly seem to encourage Stoicism.) Natural law, which grew out of Stoicism, became prominent during wave 2 of VII and again during wave 4 of VII. During the decline since the beginning of wave VIII (l950) there has been an explosion of interest in natural law. Preoccupation with all kinds of law during downtrends may be an attempt to restore cooperation. The theoretical aspects of law may be most interesting when its practice is being neglected. In terms of an innovation-exploitation axis, periods of decline may generate new theories of law, which are applied during upward trends. One of the most interesting aspects of the chart is the way in which every philosophical or religious flowering, with two exceptions, begins at the end of an even numbered wave. It may be difficult to trace this phenomenon beyond about 700BC, or if the Iliad counts at the end of wave A of IV, but beginning at the end of wave IV almost every major world philosophical system (Karl Jaspers’ “Axial Age”) (Jaspers, 1949) from the Buddha to the major Greek philosophers to Zoroaster, are all clustered around 550BC. Mohammed occurs at the end of wave A of VI; the Cluniac revival, or Catholic reformation, occurs at the end of wave VI; The Protestant
14
Reformation occurs at the end of wave 2 of VII; and political reformation with the French and American revolutions occurs at the end of wave 4 of VII. Two exceptions are the birth of Jesus at the peak of wave 3 of V, and the birth of Hinduism at the end of wave 3 of III. The birth of Jesus just happens to be the point of transition from the age of Aries, the ram to Pisces, the fish, perhaps the origin of the Christian fish. In fact, the Christian bible did not begin to be written until the end of wave a of 4 of V, another bottom.
The long waves seem to have an interesting connection with warfare. Beginning with the low at the end of wave II, each major uptrend is dominated by a single weapon system that does not become established until the end of wave l. Before the end of Wave II, about 2000BC, warfare was highly ritualized and relatively inefficient. Wave III is dominated by the chariot and the recurve bow, supplemented by knowledge of anatomy and cattle driving gained by nomadic herdsmen as described by John Keegan in The History of Warfare. (Keegan, 1994) Although foot soldiers were dominant during wave 1, Wave V is dominated by the oared warship, appropriate for empires built on Mediterranean sea trade (foot soldiers were again dominant in wave 1, probably because the Greeks did not have good terrain for chariots.) Wave VII was dominated by gunpowder, (although the crossbow was the weapon of choice for most of wave l) and peaked very appropriately with the hydrogen bomb. There would seem to be some kind of connection between the bottom of wave VI (950), the bottom of wave 2 of VII (1500) and the bottom of wave 4 of VII (1789). The first was the connection between the Roman Reformation (the Cluniac Revival) around 950, the Protestant Reformation around 1500 and a secular Reformation with the American and French Revolutions. These were followed in turn by the Roman Crusades, The Protestant (and Roman Catholic) evangelical Crusades to save the heathen of the whole world and finally a secular (sort of) Crusade to save the World from Fascism and then “godless” Communism. The flip side of the desire to save the world is the fear that someone else is going to do it first, leading ultimately to paranoia. There was also the Roman Inquisition (wave 1); the Spanish Inquisition (wave 3); and what might be called a Secular Inquisition, or Fascism, (wave 5). Finally, the waves seem to have a profound effect on the apparent quality of leadership: in odd numbered waves even mediocre leaders have some success, while brilliant leaders shine. Notice that all of the Queens of England ruled during up trends. In even numbered waves, even brilliant leaders are beset with trials, while mediocre leaders simply do not last. Again, leadership changes frequently during downtrends but more infrequently during up trends. There is enough data on dynasties both East and West that this should be a good test of the wave pattern.
Discussion and Conclusions
The arguments presented here certainly raise more questions than they answer. But the one question they do answer is whether history has a pattern. Of course, the idea of historical patterns is nothing at all new, since by definition, history either has a pattern or historical events are totally random. There is no in-between. What matters, then, is the type of pattern. The argument presented here strongly suggests that the Elliott wave patterns seen in financial market price movements serve as a strong candidate for the patterns of history, as well. But accepting this
15
claim as a working hypothesis opens up many questions standing in the way of transformation of the hypothesis into an actual theory. Let’s look at a couple of them:
• How do we effectively measure the social mood in times prior to the existence of financial markets?
• How do we best label the various waves, sub-waves, sub-sub-waves et al in the Elliott scheme to get the “right” wave count for an historical period?
• What is the time lag between a turning point in social mood and its consequent impact on historical events?
• Can we develop a dynamical system-theoretic model for the change of social mood?
• What other factors need to be integrated together with social mood, in order to serve as early-warning indicators for historical discontinuities?
• Some have argued that “social capital” also enters into the dynamics of historical events. Are social mood as defined in this paper and social capital correlated? And if so, in what way and to what degree? The work presented in (Turchin, 2006) is very relevant to this question.
A leading candidate for the most important question on the foregoing list is the mechanism for the change of social mood. How, exactly, does the mood of a population of heterogeneous agents, interacting in a continually-changing dynamical network of connections, give rise to changes in the ongoing social mood? And how do we characterize when we are nearing a “tipping point” of social mood? Finally, we have the biggest question of all: Does this work help us better understand historical processes? Our answer is that if you have a procedure that can reliably forecast future trends, and if that forecast is based upon principles that respect known behavioral patterns of human interaction, then you have a procedure that helps in understanding the dynamics of historical events. The ideas presented here rely upon the interaction of human beings to form a collective social mood, the view a group/society holds about the future. That is the foundation of our theory. We further argue that that mood changes in a recognizable pattern, the Elliott wave structure and that that pattern can be forecast, at least in broad outline. Of course, much work remains to refine and elucidate these factors into something that begins to look like a scientific theory. But the scaffolding is here. What remains is to build the superstructure. References Casti, J. (2010). Mood Matters. New York: Copernicus. Dreman, D. (1977). Psychology and the Stock Market. New York: AMACOM.
16
Eng, W. (1988). The Technical Analysis of Stocks, Options, and Futures. Chicago: Probis Frost, A. and R. Prechter. (1978). Elliott Wave Principle. Gainseville, GA: New Classics Library.
Jaspers, K. (1949). Vom Ursprung und Ziel der Geschichte (1st ed.). München: Piper Verlag.
Leick, G. (2003) Mesopotamia, London: Penguin.
Lewis, G., A. David , A., Andréassson, S.Allebeck, P. (1992), Schizophrenia and city life , The Lancet, Vol. 340, Pages 137 - 140
Keegan, J. (1994), A History of Warfare, Vintage, NY; edition 1
McNeill, W. (1976). Plagues and Peoples. Garden City, NY: Anchor Press/Doubleday
Prechter, R. (1999). The Wave Principle of Human Behavior and the New Science of Socionomics. Gainseville, GA: New Classics Library.
Roberts, C. and Manchester, K. (1995). The Archaeology of Disease. USA: Cornell University Press.
Saul, J. (2005). The Collapse of Globalism. New York: Penguin. Turchin, P. (2006). War and Peace and War. New York: Penguin.
Ward, P., (1995) The End of Evolution: A Journey in Search of Clues to the Third Mass Extinction Facing Planet Earth, Bantam Books, NY.