Economic Inequality & Poverty Context After 9/11, an email circulated stating the following: On September 11 2001, 36,000 children worldwide died of hunger Where: Poor countries New stories: none Newspaper articles: none Military alerts: none Presidential proclamations: none Papal messages: none Messages of solidarity: none Minutes of silence: none Homage to the innocent children: none Reactions? Comments? Questions? What does it mean about how people think about poverty? Equality vs. Inequality To talk about equality means that some people are unequal Is inequality desirable or undesirable? Depending on your answer (or members of society), society will be organized in different ways The economic, political and social organization of our society will therefore vary What type of inequality can be desirable and which one can be undesirable?
Transcript
Economic Inequality & Poverty
Context
After 9/11, an email circulated stating the following:
On September 11 2001, 36,000 children worldwide died of hungerWhere: Poor countriesNew stories: noneNewspaper articles: noneMilitary alerts: nonePresidential proclamations: nonePapal messages: noneMessages of solidarity: noneMinutes of silence: noneHomage to the innocent children: none
Reactions? Comments? Questions? What does it mean about how people think about poverty?
Equality vs. Inequality
To talk about equality means that some people are unequal
Is inequality desirable or undesirable? Depending on your answer (or members of society),
society will be organized in different ways The economic, political and social organization of
our society will therefore vary What type of inequality can be desirable and which
one can be undesirable?
Types of Equality
Equality that is based on the premise that human beings are all worth the same as persons
Equality of opportunity or the access to goods and resources is open to all
Equality of condition or everybody start from the same level
Equality of results where everybody has access to the same equal amount of rewards
Capitalism vs. Democracy (1)
Pure capitalist system requires free markets so individuals can achieve their economic goals and to reach their full potential
It requires equality of opportunity regardless of sex, race etc…
However, some individuals will get more than others and inequality will result▪ Therefore inequality is an integral part of capitalism
Capitalism vs. Democracy (2)
A political democracy requires one person - one vote This is equality of result▪ Power is equally shared among members of society regardless of
economic well-being
Can capitalism and political democracy really well together?▪ It seems that there is an obvious contradiction between this
economic system and political democracy▪ Some argue (conservatives) that the individual remains the most
important beneficiary of this system▪ Others (radical) see this link as extremely damaging and perceive
inequality as undesirable and as something that could be avoided
Defining Poverty (1)
Lack of resources necessary for material well-being (food, water but also housing, health care)
Absolute poverty Lack of resources that lead to hunger and physical
deprivation
Relative poverty Deficiency in material and economic resources compared to
the some of the population
Defining Poverty (2)
Measuring poverty by income
World Bank sets “poverty threshold” as $1.25/day in the developing world.
Measuring poverty by calorie intake You are considered poor if you have experiencing
hunger, which is defined as less than 1,960 calories a day
SOURCE: Federal Register, Vol. 74, No. 14, January 23, 2009, pp. 4199–4201
Defining Poverty (4)
U.S. poverty line based on idea that families with 3 or more members spend one-third of their income on food (1955 assumption) 2006: Families spend one-fifth of their income on food (high cost
of housing etc…), therefore food costs should be multiplied by 5 instead of 3.
Does not take into account tax burdens that affect disposable income
Poverty line varies by number of adults and children in family and by age of head of household U.S. poverty line disregards regional differences in cost of living It fails to reflect economic growth and changing standards of
relative poverty
Poverty in the U.S. (1)
Despite its recent expansion to78,000 households nationwide, theAnnual Demographic Supplement tothe Current Population Survey is notlarge enough to produce reliableannual estimates for AmericanIndians and Alaska Natives. How-ever, Table 2 displays 3-year aver-ages of the number of poor Amer-ican Indians and Alaska Natives andtheir 3-year-average poverty rateand provides 3-year-average povertystatistics for the other groups forcomparison.6 For 1999-2001, thepoverty rate for American Indiansand Alaska Natives was 24.5 per-cent, with 0.8 million poor. Thispoverty rate was higher than thepoverty rates for non-Hispanic
Whites, Asians and Pacific Islanders,and Hispanics, but not differentfrom the rate for Blacks. AmericanIndians and Alaska Natives were theonly group to show a decline whenthe 2000-2001 average was com-pared with 1999-2000.
Nativity
The foreign born experienced nochange in their poverty rate or num-ber of poor between 2000 and2001 (16.1 percent, or 5.2 million,were poor in 2001). Of the foreign-born population, three in eight (36.9percent) were naturalized citizens,and the rest were non-citizens.7
While the poverty rate for the for-eign-born population as a wholewas higher than the rate for thenative population (11.1 percent), therate for foreign-born naturalized citi-zens (9.9 percent) was lower thanthe rate for natives.
Among naturalized citizens, boththe poverty rate (9.9 percent) andnumber of poor in 2001 (1.2 mil-lion) were unchanged from 2000.Among noncitizens, 4.0 million, or19.7 percent, were poor in 2001,also unchanged from 2000. Thenative population, however, hadincreases from 2000 to 2001 inboth their poverty rate (from 10.8 percent to 11.1 percent) andnumber of poor (from 26.7 millionto 27.7 million).
Families and UnrelatedIndividuals
The poverty rate for familiesincreased to 9.2 percent in 2001,up from the 26-year-low measured
6 Poverty in the United States: 2001 U.S. Census Bureau
Figure 3.Poverty Rates by Race and Hispanic Origin: 1959 to 2001
Note: The data points represent the midpoints of the respective years. The latest recession began in March 2001. Data for Blacks are not available from 1960 to 1965. Data for the other race and Hispanic origin groups are shown from the first year available. Hispanics may be of any race. Source: U.S. Census Bureau, Current Population Survey, 1960-2002 Annual Demographic Supplements.
Percent
0
5
10
15
20
25
30
35
40
45
50
55
60
2001 19951990198519801975197019651959
Recession
10.2 percent9.9 percent7.8 percent
22.7 percent21.4 percent
Black
Hispanic
White
Asian and Pacific Islander
Non-Hispanic White
6 Data users should exercise caution wheninterpreting aggregate results American Indiansand Alaska Natives (AIAN) because the AIANpopulation consist of groups that differ in eco-nomic characteristics. The CPS does not useseparate population controls for weighting theAIAN sample to national totals. For furtherinformation, see www.bls.census.gov/cps/ads/adsmain.htm.
7 Natives are defined as people born in theUnited States, Puerto Rico, or an outlying areasof the United States, and those born in a foreigncountry but who had at least one parent whowas a U.S. citizen. All others are foreign-bornregardless of date of entry into the UnitedStates or citizenship status. The CurrentPopulation Survey, the source of these data,does not extend to Puerto Rico or to the outly-ing areas of the United States, and thus thoseliving there are excluded from the officialpoverty statistics.
Poverty in the U.S. (2)
Food Stamp Households, 2005
Participants Sex, race,
and Hispanic origin Number
(in thousands) Percent
Total 24,881 100.0%
Male 10,174 40.9
Female 14,701 59.1
White 10,727 43.1
African-American 8,299 33.4
Hispanic 4,786 19.2
Asian 594 2.4
Native American 367 1.5
Unknown race 108 0.4
Source: U.S. Dept. of Agriculture, Food and Nutrition Service, Characteristics of Food Stamp Households: Fiscal Year 2005, Sept. 2006
Poverty in the U.S. (3)
Race/ethnicity and poverty Nearly half (43.1%) of U.S. poor are non-Hispanic whites Poverty rates are higher among blacks and Hispanics
Causes of poverty among minorities Past and present discrimination Loss of manufacturing jobs from inner city Minorities more likely to live in female-headed households
with no spouse
Poverty in the U.S. (4)
POVERTY IN THE UNITED STATES22
Highlights
• The official poverty rate in 2007was 12.5 percent, not statisticallydifferent from 2006 (Table 3).
• In 2007, 37.3 million people werein poverty, up from 36.5 million in2006.
• Poverty rates in 2007 were statisti-cally unchanged for non-HispanicWhites (8.2 percent), Blacks (24.5percent), and Asians (10.2 percent)from 2006. The poverty rateincreased for Hispanics (21.5 per-cent in 2007, up from 20.6 percentin 2006).
• The poverty rate in 2007 waslower than in 1959, the first yearfor which poverty estimates are
available (Figure 3), while statisti-cally higher than the most recenttrough in 2000 (11.3 percent).
• The poverty rate increased for chil-dren under 18 years old (18.0 per-cent in 2007, up from 17.4 percentin 2006), while it remained statisti-cally unchanged for people 18 to64 years old (10.9 percent) andpeople 65 and over (9.7 percent).23
Race and Hispanic Origin
At 8.2 percent, the 2007 poverty ratefor non-Hispanic Whites was lowerthan the rate for Blacks and Asians—24.5 percent and 10.2 percent,respectively (Table 3). For all three ofthese groups, the number and thepercentage in poverty were statisti-cally unchanged between 2006 and2007. In 2007, non-Hispanic Whitesaccounted for 43.0 percent of people
in poverty while representing 65.8percent of the total population.Among Hispanics, 21.5 percent (9.9million) were in poverty in 2007,higher than the 20.6 percent (9.2 mil-lion) in 2006.
Age
Both the poverty rate and the numberin poverty for people aged 18 to 64were not statistically different in2007 than in 2006, at 10.9 percentand 20.4 million in 2007. The povertyrate for people 65 and older remainedstatistically unchanged at 9.7 percent,while the number in povertyincreased to 3.6 million in 2007 from3.4 million in 2006 (Table 3 andFigure 4).
In 2007, both the poverty rate andthe number in poverty increased forchildren under 18 years old (18.0 per-cent and 13.3 million in 2007, upfrom 17.4 percent and 12.8 million in2006). The poverty rate for childrenwas higher than the rates for people
12 Income, Poverty, and Health Insurance Coverage in the United States: 2007 U.S. Census Bureau
Figure 3.Number in Poverty and Poverty Rate: 1959 to 2007
Note: For information on recessions, see Appendix A.
Source: U.S. Census Bureau, Current Population Survey, 1960 to 2008 Annual Social and Economic Supplements.
Numbers in millions, rates in percent
0
5
10
15
20
25
30
35
40
45
50
20072000 19951990198519801975197019651959
Recession
37.3 million
12.5 percent
Number in poverty
Poverty rate
22 OMB determined the official definition ofpoverty in Statistical Policy Directive 14.Appendix B describes how the Census Bureaucalculates poverty.
23 Unrelated individuals under 15 areexcluded from the poverty universe; therefore,407,000 fewer children are in the poverty uni-verse than in the total population.
Poverty in the U.S. (5)
Federal minimum wage (2009): $7.25/hr ($15,080/yr) California minimum wage (2009): $8.00/hr ($16,640/yr)
Living wage laws require state or municipal contractors, recipients of public subsidies or tax breaks, or, in some cases, all businesses to pay employees wages significantly above minimum wage, enabling families to live above poverty line
Are those figures enough to live in L.A., Orange, San Bernardino or Riverside counties?
Why are those figures so low? Why can’t we raise the poverty levels to actual levels of subsistence?
http://www.usccb.org/cchd/povertyusa/tour.htm
Poverty in the U.S. (6)
Age and poverty The age group most affected by poverty: children
(18%) U.S. poverty rate for young children higher than
in any other Western industrialized country (usually 2 or 3 times higher)
The poverty rate among elderly was about 9.7% (65+)
Education and poverty The higher a person's level of education, the less
likely that person is to be poor
Poverty in the U.S. (7)
18 to 64 years old and those 65 andolder (Table 3). Children represented35.7 percent of the people in povertyand 24.8 percent of the totalpopulation.
Estimates for related children under 18include children related to the house-holder (or the reference person of anunrelated subfamily) who are notthemselves a householder or spouseof the householder (or the family refer-ence person). Both the poverty rateand the number in poverty increasedfor related children under 18 living infamilies (17.6 percent and 12.8 millionin 2007, up from 16.9 percent and12.3 million in 2006). For related chil-dren under 18 living in families with afemale householder with no husbandpresent, 43.0 percent were in poverty,compared with 8.5 percent for chil-dren in married-couple families.
The poverty rate for related childrenunder 6 was 20.8 percent in 2007,
statistically unchanged from 2006,while the number in povertyincreased to 5.1 million in 2007, upfrom 4.8 million in 2006. Of relatedchildren under 6 with female house-holders with no husband present,54.0 percent were in poverty, overfive times the rate of their counter-parts in married-couple families (9.5 percent).
Nativity
Of all people, 87.5 percent werenative born and 12.5 percent wereforeign born. The poverty rate andthe number in poverty for the native-born population, 11.9 percent and31.1 million in 2007, were not statis-tically different from any of the threeprevious years—2004 to 2006. Thepoverty rate and the number inpoverty for the foreign-born popula-tion increased to 16.5 percent and6.2 million in 2007 from 15.2 percentand 5.7 million in 2006 (Table 3).
Of the foreign-born population, 40.4percent were naturalized citizens; theremaining were noncitizens. Thepoverty rate in 2007 was 9.5 percentfor foreign-born naturalized citizens,statistically unchanged from 2006. Thepoverty rate in 2007 was 21.3 percentfor those who were not U.S. citizens,up from 19.0 percent in 2006.
Region
The number in poverty in the Southincreased to 15.5 million in 2007, upfrom 14.9 million in 2006, while thepoverty rate remained statisticallyunchanged at 14.2 percent in 2007.In 2007, the poverty rate for theNortheast (11.4 percent), the Midwest(11.1 percent), and the West (12.0percent) were all statisticallyunchanged from 2006.24
14 Income, Poverty, and Health Insurance Coverage in the United States: 2007 U.S. Census Bureau
Figure 4.Poverty Rates by Age: 1959 to 2007
Note: Data for people aged 18 to 64 and 65 and older are not available from 1960 to 1965. For information on recessions, see Appendix A.
Source: U.S. Census Bureau, Current Population Survey, 1960 to 2008 Annual Social and Economic Supplements.
Percent
0
5
10
15
20
25
30
35
40
45
50
20072000 19951990198519801975197019651959
Recession
10.9 percent9.7 percent
18.0 percent
65 years and older
Under 18 years
18 to 64 years
24 The poverty rate for the Northeast was notstatistically different from that of the Midwest orthe West.
Poverty in the U.S. (8) Sex and poverty
Women are more likely than men to live in poverty (“feminization of poverty”)
Women are less likely than men to attain higher educational degrees, are concentrated in low-paying jobs, and earn less than men with same education
Women who are minorities and/or single mothers have increased risk of poverty ▪ About one in eight (12.5%) adult women was poor in 2007; 14.4 million women lived in poverty. In
2007, the poverty rate for women (12.5%) was 42% higher than the poverty rate for men (8.8%).
NATIONALWOMEN’S LAWCENTER, SEPTEMBER 2008, p. 2
Chart 1: Poverty Rate of Adults, by Gender, Race and
Ethnicity, 2007
6.2%
9.0%
23.6%
20.8%
10.3%
25.1%
11.5%
4.4%
8.4%10.0%
3.7%2.6%
0.0%
5.0%
10.0%
15.0%
20.0%
25.0%
30.0%
White, non-
Hispanic
Men
White, non-
Hispanic
Women
Black
Women
Hispanic
Women
Asian
Women
Native
American
and
Alaskan
Native
Women
PovertyRate
Poverty Rate Extreme Poverty
Single Mothers and Children
! The poverty rate for female-headed families with children4was 37%, more than twice
the rate for male-headed families with children (17.4%) and all families with children
(15%).
! More than six in ten (62%) of all poor families with children were headed by women.
! Poverty rates were especially high for Hispanic female-headed families with children
(46.6%) and Black female-headed families with children (43.0%).5
Extreme poverty is 50% below poverty guideline
Poverty in the U.S. (9)
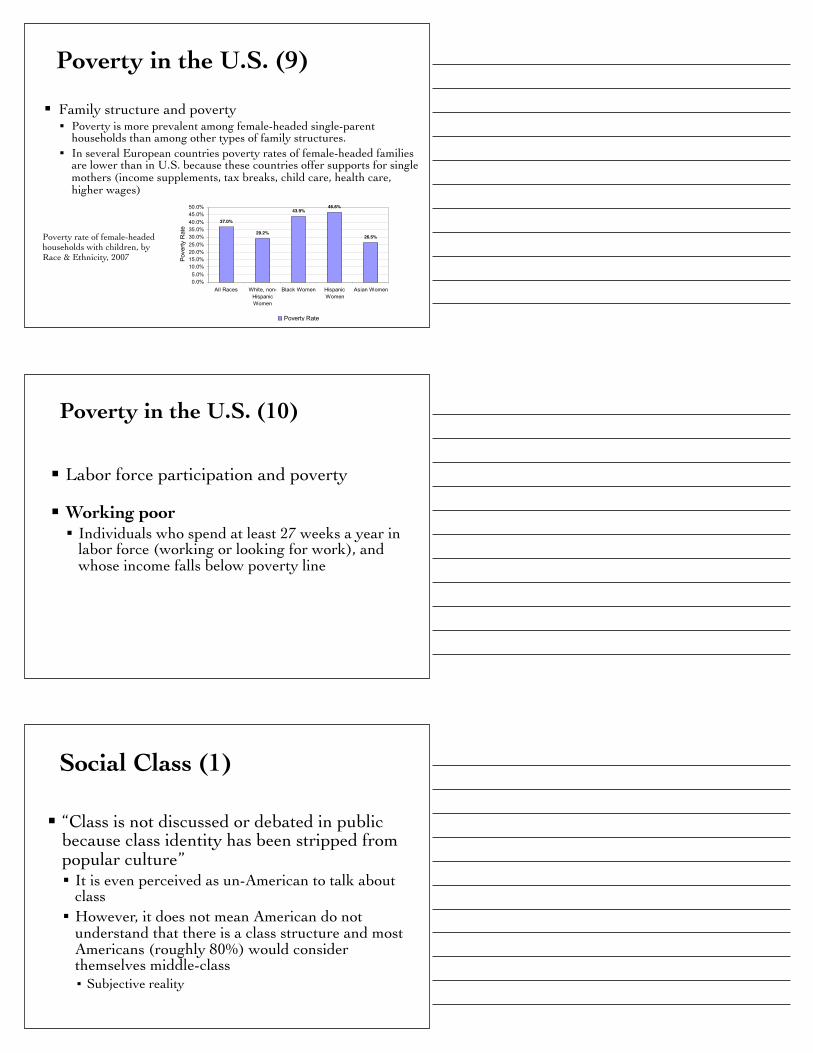
Family structure and poverty Poverty is more prevalent among female-headed single-parent
households than among other types of family structures. In several European countries poverty rates of female-headed families
are lower than in U.S. because these countries offer supports for single mothers (income supplements, tax breaks, child care, health care, higher wages)
NATIONALWOMEN’S LAWCENTER, SEPTEMBER 2008, p. 3
Chart 2: Poverty Rate of Female-Headed Families with
Children, by Race and Ethnicity, 2007
37.0%
29.2%
43.9%46.6%
26.5%
0.0%
5.0%
10.0%
15.0%
20.0%
25.0%
30.0%
35.0%
40.0%
45.0%
50.0%
All Races White, non-
Hispanic
Women
Black Women Hispanic
Women
Asian Women
PovertyRate
Poverty Rate
! Nearly one in five (18%) children was poor. Poverty rates were especially high for
Black children (34.5%) and Hispanic children (28.6%).
Women 65 and Older
! The poverty rate for women 65 and older was 12%, over 80% higher than the poverty
rate for men 65 and older (6.6%).
Chart 3: Poverty Rate for Adults byGender and Age,
2007
8.8% 9.1%6.6%
11.8%12.5% 12.6% 12.0%
19.9%
0%
5%
10%
15%
20%
25%
30%
18+ 18-64 65+ 65+ living alone
Age
PovertyRate
Men Women
Poverty rate of female-headed households with children, by Race & Ethnicity, 2007
Poverty in the U.S. (10)
Labor force participation and poverty
Working poor Individuals who spend at least 27 weeks a year in
labor force (working or looking for work), and whose income falls below poverty line
Social Class (1)
“Class is not discussed or debated in public because class identity has been stripped from popular culture” It is even perceived as un-American to talk about
class However, it does not mean American do not
understand that there is a class structure and most Americans (roughly 80%) would consider themselves middle-class▪ Subjective reality
Social Class (2)
So what is a social class? Individual and groups falling in the same categories such as
same income, occupation, status and education▪ Multidimensional
However, the boundaries between social classes are blurred▪ Continuum between classes
Social class can also be defined subjectively by individuals themselves and their perception of where they fit in the social stratified system▪ Subjective and objective conditions
All those factors determine your socio-economic status in a society▪ It assumes a non-conflictual relationship between classes
Social Class (3)
Proletarization of the white-collar jobs White-collar jobs are becoming more and more boring,
routine, demand less and less skills, and involve little worker control▪ Can be witnessed by the McDonalization of society▪ Every action is measured by time
Some argue that the proletarization is expanding to poor countries and that capitalism continually expand itself to maintain profits and control over workers White-collar jobs are being outsourced
Social Class (4)
Marxist theorists look at class as a pure economic relationship It does not involve income or occupation It is based on the relationship between those who
owns the means of production and those who sell their labor in exchange for wages
Therefore, social classes are discrete and not continuous since it is based on the exploitation of one social class by the other
Social Class (5)
Marxists see social classes as:
Distinct discrete groups (as opposed to continuous)
Real rather than statistical creations Economic in nature Conflictual in their relations
Income vs. Wealth Inequality (1)
Wealth = total assets of an individual or household, minus liabilities (debts)
Wealth includes value of a home, investment real estate, cars, life insurance, stocks/bonds/mutual funds/trusts, checking and savings accounts, individual retirement accounts, unincorporated businesses, and valuable collectibles
Wealthy households tend to have much of their wealth in stocks and bonds, whereas the less well to do typically hold most of their wealth in housing equity
Income vs. Wealth Inequality (2)
Income vs. Wealth Inequality (3)
Income vs. Wealth Inequality (4)
U.S. Census Bureau 13
savings plans) was significantlyhigher for non-Hispanic Whitehouseholds compared with Blackand Hispanic households.
NET WORTH BYHOUSEHOLD TYPE
Married-couple households had the largest median net worth in2000, $91,218 (Figure 7) amonghouseholders by type. Householdswith a male-householder had amedian net worth of $24,659, or
27.0 percent of the married-couplefigure, while female-householdershad $23,028, or 25.2 percent ofthe married-couple figure.
Table J expands the data shown inFigure 7, and reveals that married-couple households had the largestmedian net worth figures in both
Table G.Percent Distribution of Net Worth of Households by Age of Householder and Asset Type:1998 and 2000(Excludes residents of group quarters)
1 Includes mortgages held for sale of real esate, amount due from sale of business or property, and other financial assets.2 Because net worth is assets less liabilities, unsecured liabilities are subtracted from the distribution of net worth and are shown as negative.
Note: Individual outliers that highly influenced the mean value for asset categories were topcoded or excluded. The mean is used to calculate the percentdistribution. The outlier adjustments to the individual assets and not the totals led to columns not summing to 100 percent.
Source: U.S. Census Bureau, Survey of Income and Program Participation, 1996 panel.
Figure 6.
Median net worthMedian net worth, excluding home equity
All households
Non-Hispanic White Householders
Black householders
Hispanic householders
Median Net Worth and Median Net Worth Excluding Home Equity of Households by Race and Hispanic Origin of Householder: 2000(2000 dollars)
9,750
1,166
79,400
55,00013,473
22,566
1,850
7,500
Source: U.S. Census Bureau, Survey of Income and Program Participation, 1996 panel.
Income vs. Wealth Inequality (6)
Income, Earnings, and Poverty Data From the 2007 American Community Survey 3U.S. Census Bureau
HOUSEHOLD INCOME
Household income includes the income of the householder and all other people 15 years and older in the household, whether or not they are related to the householder. For comparisons of household income, this report focuses on the median—the point that divides the household income distribution into halves, one half with income above the median and the other with income below the median. The median is based on the income distribution of all households, including those with no income.
In the 2007 ACS, information on income was collected between January and December 2007. All income data were infl ation-adjusted to refl ect calendar year 2007 values and are referred to in this report as 2007 ACS income. See the text box “How Is Income Collected and Mea-sured in the 2007 ACS?” for more information on data collection and income adjustment.
Median Household Income for the United States by Race and Hispanic Origin5
The discussion of race groups in this report refers to people who indicated only one race among the six categories in the survey: White, Black or African American, American Indian or Alaska Native, Asian,
5 This report uses the characteristics of the householder to describe the household. The householder is the person (or one of the people) in whose name the home is owned or rented and the person to whom the relation-ship of other household members is recorded. If a married couple owns the home jointly, either the husband or the wife may be listed as the householder. Since only one person in each household is designated as the house-holder, the number of householders is equal to the number of households.
Native Hawaiian or Other Pacifi c Islander, and Some Other Race.6
In the 2007 ACS, median household income in the United States for all households was $50,740.7 Table 1 shows that Asian households had the highest median household income ($66,935). While not sta-tistically di! erent from each other, the median household incomes for Native Hawaiian and Other Pacifi c Islander households ($55,273) and
6 Because federal surveys, including the ACS, allow people to report one or more races, two ways of defi ning a group such as Asian are possible. The fi rst includes those who reported Asian and no other race (Asian alone); the second includes everyone who reported Asian regardless of whether they also reported another race (Asian alone or in com-bination with one or more other races). The use of the single-race population in this report does not imply that it is the preferred method of presenting or analyzing data. The Census Bureau uses a variety of approaches. Some Other Race was selected by respondents who did not identify with the fi ve O" ce of Manage-ment and Budget race categories.
7 The estimates in this report (which may be shown in text, fi gures, and tables) are based on responses from a sample of the population and may di! er from actual values because of sampling variability or other fac-tors. As a result, apparent di! erences between the estimates for two or more groups may not be statistically signifi cant. All comparative statements have undergone statistical testing and are signifi cant at the 90-percent confi -dence level unless otherwise noted.
non-Hispanic White households ($55,096) were less than that of Asian households and higher than that of Some Other Race households ($40,755). American Indian and Alaska Native households ($35,343) and Black households ($34,001) had lower median household income than the other race groups. Median income for Hispanic households was $40,766 in the 2007 ACS.8
Median Household Income for States
Table 2 shows the median house-hold incomes of states from the 2006 ACS and the 2007 ACS. The median household income estimates in the 2007 ACS varied from state to state, ranging from a median of $68,080 for Maryland to $36,338 for Mississippi.9
8 The median household income of Hispanic households was not statistically dif-ferent from the median household income of Some Other Race households. Because Hispanics may be any race, data for Hispanics overlap with data for racial groups.
9 The median household income for the state of Mississippi was not statistically dif-ferent from the median household income for West Virginia. The median household income for Puerto Rico was $17,741.
Table 1.Median Household Income in the Past 12 Months by Raceand Hispanic Origin: 2007(In 2007 inflation-adjusted dollars. Data are limited to the household population andexclude the population living in institutions, college dormitories, and other group quarters.For information on confidentiality protection, sampling error, nonsampling error, anddefinitions, see www.census.gov/acs/www/)
1 Data are based on a sample and are subject to sampling variability. A margin of error is ameasure of an estimate’s variability. The larger the margin of error in relation to the size of the estimate,the less reliable the estimate. When added to and subtracted from the estimate, the margin of error formsthe 90-percent confidence interval.
Source: U.S. Census Bureau, 2007 American Community Survey.
Income vs. Wealth Inequality (7)
Wealth is a more complete measure of a family’s economic power than income
Wealthy individuals have more tools to continually enhance their economic position
Wealth is passed on while income is not Wealth will therefore enable children to struggle less and
achieve more (is success based on meritocracy?)▪ No student loans when going to college▪ Cash or house equity can be used to pay for college
Wealth gives you political power, access to networks etc…
Cultural values of the American hero
Physically and psychologically independent
Individual achievement is sought despite obstacles
Achievement under difficult circumstances means everyone can succeed is one tries hard enough
Those who do not make it lack the ability or are lazy (and therefore immoral)
The possibility of material gain is needed to motivate people
The American Dream: Myth or Reality? (1)
The idea of the American Dream has been attached to everything from religious freedom to a home in the suburbs
Its meaning is closely related with success and hard work High income, prestigious job, economic security Power and money
The American Dream: Myth or Reality? (2)
Who may pursue success? Ideally everybody (is it really true?)
What does one pursue? “Go for it” ideology You can achieve anything (is it really true?)
How does one pursue success? “Work hark and stop complaining” ideology Meritocracy
Why is success worth pursuing? It is associated with virtue (a quality)
The American Dream: Myth or Reality? (3)
Who may pursue success? Racism and sexism have prevented people from achieving the American
Dream What does one pursue?
You cannot pursue anything you want because resources and opportunities are limited
Working towards success is seen as good as succeeding! How does one pursue success?
Failure is made more harsh because of the belief that success results from personal actions and traits
Individual endeavor; “I, I, I…” Why is success worth pursuing?
If success means virtue, failure means sin▪ Problematic when society does not offer endless and equal resources
and opportunities
The American Dream: Myth or Reality? (4)
It is THE Ideology of deception
Individual action The focus is on people’s behaviors and not on economic
processes, environmental constraints, political structures etc…
Capitalism requires failure to work and is deceitful The American Dream does nothing to help
Americans cope with the fact that the system is designed to fail some people and benefit others The American Dream is a MYTH
Health Problems and Poverty (1)
Poverty has been identified as the world's leading health problem Unsafe water and sanitation▪ Almost two in three people lacking access to clean water survive on less than
$2 a day, with one in three living on less than $1 a day.▪ More than 660 million people without sanitation live on less than $2 a day, and
more than 385 million on less than $1 a day.
Poverty is associated with high infant mortality and childhood deaths, and lower life expectancies among adults▪ 2.2 million children die each year because they are not immunized▪ 15 million children orphaned due to HIV/AIDS (similar to the total children
population in Germany or United Kingdom) Lack of access to healthcare Inferior health care
Health Problems and Poverty (2)
• The percentage of people coveredby government health insuranceprograms increased to 27.8 percentin 2007, from 27.0 percent in 2006.The percentage and number of peo-ple covered by Medicaid increasedto 13.2 percent and 39.6 million in2007, up from 12.9 percent and38.3 million in 2006.
• In 2007, the percentage and num-ber of children under 18 years oldwithout health insurance were 11.0percent and 8.1 million, lower thanthey were in 2006—11.7 percentand 8.7 million (Table 6). Althoughthe uninsured rate for children inpoverty decreased to 17.6 percentin 2007, from 19.3 percent in
2006, children in poverty weremore likely to be uninsured thanall children.28
• The uninsured rate and number ofuninsured for non-Hispanic Whitesdecreased in 2007 to 10.4 percentand 20.5 million (from 10.8 percentand 21.2 million in 2006). The unin-sured rate for Blacks decreased to19.5 percent in 2007 from 20.5 per-cent in 2006. The number of unin-sured Blacks in 2007 was not statis-tically different from 2006, at 7.4million. (Table 6).
• The percentage and number ofuninsured Hispanics were 32.1 per-cent and 14.8 million in 2007,lower than 34.1 percent and 15.3million in 2006 (Table 6).
Type of Coverage
Most people (59.3 percent) were cov-ered by a health insurance planrelated to employment for some or allof 2007, a proportion that was lowerthan that in 2006. The rate of privatecoverage decreased in 2007 to 67.5percent, from 67.9 percent in 2006,while the number of people coveredby private insurance was statisticallyunchanged at 202.0 million in 2007(Figure 7).
20 Income, Poverty, and Health Insurance Coverage in the United States: 2007 U.S. Census Bureau
Figure 6.Number Uninsured and Uninsured Rate: 1987 to 2007
1 Implementation of Census 2000-based population controls occurred for the 2000 ASEC, which collected data for 1999. These estimates also reflect the results of follow-up verification questions that were asked of people who responded “no” to all questions about specific types of health insurance coverage in order to verify whether they were actually uninsured. This change increased the number and percentage of people covered by health insurance, bringing the CPS more in line with estimates from other national surveys.
Note: Respondents were not asked detailed health insurance questions before the 1988 CPS. For information on recessions, see Appendix A.
Source: U.S. Census Bureau, Current Population Survey, 1988 to 2008 Annual Social and Economic Supplements.
Numbers in millions, rates in percent
0
5
10
15
20
25
30
35
40
45
50
20072002199911996199319901987
45.7 million
15.3 percent
Number uninsured
Uninsured rate
Recession
28 The number of uninsured children inpoverty in 2007 was not statistically differentfrom the number in 2006.
Health Problems and Poverty (3)uninsured rate fell for people inhouseholds in the highest incomegroup to 7.8 percent in 2007, from8.5 percent in 2006.
Among 18- to 64-year-olds in 2007,the percentage of workers (peoplewho worked at some time during theyear) with no health insurance cover-age was 18.1 percent, lower than the18.7 percent in 2006. The number ofworkers who were uninsureddecreased to 26.8 million in 2007from 27.6 million in 2006. In 2007,full-time workers were more likely tobe covered by health insurance (83.0percent) than part-time workers (76.6percent) or nonworkers (74.6 per-cent).32 The number and percentageof uninsured among full-time workersdecreased to 21.1 million and 17.0percent in 2007 from 22.0 millionand 17.9 percent in 2006. The num-ber and percentage uninsured amongpart-time workers (5.8 million and23.4 percent) were not statisticallydifferent from 2006.33
Children’s Health Insurance Coverage
In 2007, the percentage and numberof children under 18 years old with-out health insurance (11.0 percentand 8.1 million) were lower than in2006 (11.7 percent and 8.7 million)(Table 6).
The proportion of children not cov-ered by health insurance varied bypoverty status, age, race, andHispanic origin. Figure 8 shows thatchildren in poverty were more likelyto be uninsured than the populationof all children in 2007—17.6 percentcompared with 11.0 percent. Children12 to 17 years old had a higher unin-sured rate than those under 12 years
old—12.0 percent compared with10.4 percent.
In 2007, the uninsured rates were 7.3percent for non-Hispanic White chil-dren, 12.2 percent for Black children,11.7 percent for Asian children, and20.0 percent for Hispanic children.34
The uninsured rates for non-HispanicWhite children and Asian children in2007 were not statistically differentfrom their respective rates in 2006.The uninsured rates for Black childrenand Hispanic children in 2007decreased from their respective ratesin 2006.
Region
At 11.4 percent, the Northeast andthe Midwest had lower uninsuredrates in 2007 than the West (16.9 per-cent) and the South (18.4 percent)
(Table 6). These rates representeddecreases from the 2006 uninsuredrates in the Northeast (12.3 percent),the West (17.9 percent), and theSouth (19.0 percent). The uninsuredrate for the Midwest in 2007 was notstatistically different from 2006.
Metropolitan Status
The uninsured rate for people livinginside metropolitan statistical areasdecreased to 15.3 percent in 2007from 15.8 percent in 2006 (Table 6). In2007, the uninsured rate was higheramong people in principal cities (18.5percent) than among people not inprincipal cities (13.3 percent). Theuninsured rate for people living out-side metropolitan statistical areasdecreased from 16.0 percent to 15.0percent between 2006 and 2007.35
24 Income, Poverty, and Health Insurance Coverage in the United States: 2007 U.S. Census Bureau
Figure 8.Uninsured Children by Poverty Status, Age, and Race and Hispanic Origin: 2007 (Percent)
11.0
17.6
10.5
10.3
12.0
7.3
12.2
11.7
20.0Hispanic (any race)
Asian
Black
White, not Hispanic
12 to 17 years
6 to 11 years
Under 6 years
Children in poverty
All children
Race1 and Hispanic origin
Age
1 Federal surveys now give respondents the option of reporting more than one race. This figure shows data using the race-alone concept. For example, “Asian” refers to people who reported Asian and no other race.
Source: U.S. Census Bureau, Current Population Survey, 2008 Annual Social and Economic Supplement.
32 Workers are classified as part-time if theyworked fewer than 35 hours per week in themajority of the weeks they worked in 2007.
33 The number and percentage of uninsurednonworkers were statistically unchangedbetween 2006 and 2007 at 10.0 million and25.4 percent.
34 In 2007, the uninsured rate for Black chil-dren was not statistically different from theuninsured rate for Asian children.
35 In 2006 and 2007, the percentage of unin-sured living within metropolitan statistical areaswas not statistically different from the percent-age of uninsured living outside metropolitan sta-tistical areas.
Family Stress and Parenting Problems Associated with Poverty
Family problems (e.g. domestic violence) contribute to poverty (women leave home and live without economic support of husbands)
Stresses associated with poverty contribute to substance abuse, domestic violence, child abuse, divorce, child neglect (no supervision)
Housing Problems and Homelessness
Many poor people live without heating, air conditioning, sewer, phones
The poor are more likely to live in high-crime neighborhoods
Lack of affordable housing has produced a housing crisis that increasingly affects the middle-class, as well as the poor
Intergenerational Poverty
Problems associated with poverty (health and educational problems) create a cycle of poverty from one generation to the next (intergenerational poverty)
Intergenerational poverty creates persistently poor population called the “underclass” The “underclass” is a racially-charged term that has been used to
refer in particular to the poor black inner-cities that are supposed to represent everything that is wrong with poor people▪ Teen pregnancy, welfare dependency, lack of work ethic and so on
It also assumes that most poor people are people of color who lack good cultural values▪ The majority of welfare recipients are white
The underclass: race, class & culture?
Myths about the poor
Values and beliefs distort social reality by suggesting that most of the poor have characteristics that they, in fact, do not possess
Individual explanations of poverty are weak
Welfare in the United States:Myths and Realities (1)
Myth People receiving welfare are lazy and have no work ethic
Reality a) single parents do the work of parenting b) many adults on public assistance are either employed or
looking for work c) some welfare recipients are unable to work because of
mental or physical disabilities or other medical conditions Many food stamp recipients worked. Nearly 30 percent of food
stamp households had earnings in 2007, and 41 percent of all food stamp participants lived in a household with earnings. For these households, earnings were the primary source of income.
Welfare in the United States:Myths and Realities (2)
Myth Welfare benefits are granted to many people who are not really eligible to
receive them
Reality Some people obtain welfare through fraudulent means, but it is much
more common for people who are eligible to receive welfare to not receive benefits (e.g. at least 12 million people are not receiving food stamps even though they are eligible)
Reasons for not receiving benefits include: People don't know they are eligible. Pride; people do not want to be stigmatized as lazy or wanting a “free ride.” People want to avoid the administrative and transportation hassles involved in
obtaining welfare
Welfare in the United States:Myths and Realities (3)
Myth Most welfare parents are teenagers
Reality In 1999, the average age of adult welfare recipients was 31.8
years. Only 6.2% of adult recipients were teenagers Most food stamp recipients were children or elderly. Nearly half
(49 percent) were children and another 9 percent were age 60 or older. Working-age women represented 29 percent of the caseload, while working-age men represented 14 percent.
Welfare in the United States:Myths and Realities (4)
Myth Most welfare mothers have large families with many
children
Reality Mothers receiving welfare have no more children, on
average, than mothers in general population (1999: TANF families averaged 2 recipient children)
The average food stamp household size was 2.2 persons, but varied considerably by household composition. Households with children were relatively large, averaging 3.3 members. Households with elderly were smaller, with an average of 1.3 members.
Welfare in the United States:Myths and Realities (5)
Myth Unmarried women have children so they can receive benefits and single
mothers receiving welfare have additional children in order to receive increased benefits
Reality States with lowest AFDC benefits to single mothers had highest teenage
birthrates The additional of one child raises aid by only $100 a month (not really
an incentive!) The average food stamp household received a monthly benefit of $212.
Nearly one-third (32 percent) received the maximum food stamp benefit ($506 for a family of four).
Only 7 percent received the minimum benefit of $10 (which is available to households of one or two members); most (90 percent) of these households contained elderly or disabled members.
Welfare in the United States:Myths and Realities (6)
Myth Public assistance to the poor creates an enormous burden on taxpayers
Reality Public assistance to poor is relatively small part of government spending▪ The Food Security Program is an important, though smaller, entitlement. In 2004, it
served 24 million people, providing an average monthly benefit of $86 per person, with a total Federal cost of $27 billion (excluding the Nutrition Assistance Program in Puerto Rico).
▪ This represents about 2 percent of mandatory spending, 1 percent of total Federal spending, and about a third of USDA spending in 2004.
▪ Mandatory programs cost the Federal government more than $1.3 trillion in fiscal year2004. Mandatory spending accounted for 61 percent of total outlays, down from 64 percent in 1995. Social Security, Medicare, and Medicaid made up two-thirds of total mandatory outlays in 2004.
▪ The size of the FSP is diminishing relative to that of other entitlements. Food stamp spending fell from 2.5 percent of mandatory spending in 1995 to 2.0 percent in 2004, a result mainly of growth in Medicaid, Medicare, and Social Security.
Welfare in the United States:Myths and Realities (7)
Food and Nutrition Service/USDA Making America Stronger: A Profile of the Food Stamp Program ! 3
Mandatory programs cost the Federal government more
than $1.3 trillion in fiscal year 2004. Mandatory spending
accounted for 61 percent of total outlays, down from 64
percent in 1995. Social Security, Medicare, and Medicaid
made up two-thirds of total mandatory outlays in 2004.
The FSP is an important, though smaller, entitlement.
In 2004, it served 24 million people, providing an average
monthly benefit of $86 per person, with a total Federal
cost of $27 billion (excluding the Nutrition Assistance
Program in Puerto Rico). This represents about 2 percent
of mandatory spending, 1 percent of total Federal spending,
and about a third of USDA spending in 2004.
The size of the FSP is diminishing relative to that of
other entitlements. Food stamp spending fell from 2.5
percent of mandatory spending in 1995 to 2.0 percent in
2004, a result mainly of growth in Medicaid, Medicare,
and Social Security.
Source:
Office of Management and Budget. Fiscal Year 2006
President’s Budget, Historical Tables 8.1, 8.5, and 11.3.
Source: Office of Management and Budget. Fiscal Year 2006 President’s Budget, Historical Tables 8.1, 8.5, and 11.3. Available online at [www.whitehouse.gov/omb/budget/fy2006/pdf/hist.pdf].
Military Spending vs. Public Assistance
Wealthfare (1)
System by which “privilege is maintained for affluent and rich individuals as well as for large corporations” by means of government purchasing, price supports, subsidies, import-export policies, tax loopholes, and other strategies
Government tax breaks to people who deducted interest payments (housing aid) on their homes amounted to $51.03 billions in 1989 compared to $7 billion spent in federal subsidized housing
Wealthfare (2)
FY 2005 Federal Budget Exxon-Mobil which has been recording record profits
($36.13 billion) in 2005 was given a $1.7 billion tax breaks to make gas and oil development cheaper
August 2006 The house of Representatives debated a bill to increase
federal minimum wage by $2 because it was not passed because it was tied to the elimination of the estate tax for the wealthy
Wealthfare (3)
The Savings and loan bailout ($37 billion, every year for 30 years)
Agribusiness subsidies ($18 billion a year) Media subsidies ($8 billion a year; in 1997 the FCC gave
broadcast licenses for digital television to existing broadcasters at no cost; the FCC estimates the value of these licenses to be worth $20 billion to $70 billion)
Timber subsidies ($427 million a year, not counting tax breaks)
Aviation subsidies ($5.5 billion a year) Mining subsidies ($3.5 billion a year) Tax avoidance by transnational corporations ($12 billion
annually) Bank bailouts (2008-2009) ($ 700 billion)
Global Poverty (1)
More than 1.4 billion people (1 in 5) survive with less than $1.25/day
50% of the population in Sub-Saharan Africa live with less than $1/day (247 million people in 2015)
The GDP (Gross Domestic Product) of the poorest 48 nations (i.e. a quarter of the world’s countries) is less than the wealth of the world’s three richest people combined (Ignacio Ramonet, Le Monde Diplomatique, 1998) The world’s billionaires — just 497 people (approximately 0.000008% of the
world’s population) — were worth $3.5 trillion (over 7% of world GDP)
20% of the population in the developed nations, consume 77% of the world’s goods (2005)
The developing world now spends $13 on debt repayment for every $1 it receives in grants
Global Poverty (2)
Global Poverty (3)
In 2000, the average income of the richest 20 countries was 37 times that of the poorest 20 countries (It was 18 times in 1960)
Together, South Asia, East Asia and South-East Asia and the Pacific have more than 950 million of the 1.3 billion people who are income-poor
In 1997 the foreign debts of ‘developing’ countries were more than two trillion (million million) US dollars and still growing The result is a debt of $400 for every man, woman and child in
the developing world – where average income in the very poorest countries is less than a dollar a day
Global Poverty (4)
International Responses to Poverty (1)
Promoting economic growth tends to create new jobs, increases goods and services, and reduces poverty
However, economic growth resulting from technology may reduce demand for unskilled workers and increase poverty
Growth does not help when public spending is diverted away from meeting needs of the poor and used to pay international debt, finance military operations, or support corporations that do not pay workers fair wages
International Responses to Poverty (2)
Basicneeds
Psychologicalneeds
Self-fulfullmentneeds
Self-actualization:
achieving one’sfull potential,
including creativeactivities
Belongingness and love needs:intimate relationships, friends
Safety needs:security, safety
Physiological needs:food, water, warmth, rest
Esteem needs:prestige and feeling of accomplishment
FIGURE 1: MASLOW’S HIERARCHY PYRAMID
Maslow’s Hierarchy of Needs
International Responses to Poverty (3)
Investing in human capital Skills, knowledge, and capabilities of the individual
Investments in human capital include programs and policies to provide nutrition, sanitation, housing, health care, educational and job training.
Providing countries with debt relief can help them invest in human capital
Conflict Perspective (1)
Conflict theorists are interested in understanding how the structure of society reproduces inequality
Human beings are good by nature but the system in place benefits some over others The key is NOT to blame the individual but rather
to expand your sociological imagination to see the links between private lives and the system influencing those individuals
Conflict Perspective (2)
Economic inequality results from bourgeoisie (owners of means of production) exploiting proletariat (workers earning wages)
Wealthfare or corporate welfare Laws and policies that benefit corporations and the
wealthy (e.g. low interest government loans to businesses, subsidies and tax breaks to corporations, mortgage interest deductions)
Tax breaks for corporations
Conflict Perspective (3)
Corporations and wealthy persons buy political influence with financial contributions to politicians and political candidates Lobbies in Washington D.C.
Free-market reform policies benefit wealthy corporations and investors, but increase poverty NAFTA, CAFTA, WTO etc…
Conflict Perspective (4)
Accumulation of capital by individuals foster exploitation A struggle emerge as workers want to organize but
capitalists resist by passing legislation to mold those workers into a disciplined labor force
Capitalism is a system which will eventually dissolve itself because the few who hold the cards won’t be able to sustain the exploitation of workers The quest for constant profits lead to crises at the top and at
the bottom where resistance slowly organize
Functionalist Perspective (1)
Poverty and economic inequality serve positive functions for society
Davis and Moore (1945) Unequal economic reward system ensures that persons who
perform particular roles are most qualified Without motivation, a society would disappear
Low-paid, poor workers are willing to do dirty, dangerous, difficult work others refuse to do
Functionalist Perspective (2)
Poverty provides work for those in “poverty industry” (e.g. welfare workers, social workers)
Poor people provide market for inferior goods (older homes and cars)
Poverty serves as a reminder that if you do not work hard, this is what will happen to you Myth of the American Dream
Functionalist Perspective (3)
Inequality is to be expected in an organic society in which division of the labor will be based on specialization and individualism Can become of a threat to stability of society
Durkheim argued that corporate groups (between the state and individuals) would integrate individuals so society remain cohesive and stable
Differences (and inequality) would be based on the internal differences of individuals (sex for instance) while external differences (race, inheritance) would slowly disappear Until this happens, abnormal differences will remain
Functionalist Perspective (4)
Criticisms of the functionalist view of poverty: Many important roles (e.g. child care worker) are poorly
paid, whereas those in nonessential roles (sports stars) earn high incomes
Ignores the role of inheritance in the distribution of rewards (wealth vs. income)
Who is more important for society? A garbage collector or a Baseball (MLB) player?
▪ Who receives the highest reward?
Interactionist Perspective (1)
Interactionist theorists focus on everyday interactions and emphasize the importance of words, social categories and classifications to demonstrate how categories of people are created Social construction of gender and race, and poverty for
instance
Some of them focus on how roles, categories reproduce inequality Culture also is being used to instill the beliefs, practices,
ways of thinking and values of the dominant group to control behaviors of members of lower social classes
Interactionist Perspective (2)
Persons who are labeled “poor” and on welfare are stigmatized as lazy; irresponsible; lacking in motivation, ability, and morals People have negative stereotypes about poor people
Wealthy persons viewed as capable, hard working, motivated, deserving of wealth People assumed that they have all worked hard to be
where they are
Interactionist Perspective (3)
Definitions of wealth and poverty vary across societies and across time Dinka in sub-Saharan Africa view themselves as wealthy
and measure their wealth by how many cows they own
Definitions of wealth and poverty vary within societies Ghana men associate poverty with a lack of material
assets Ghana women define poverty as food insecurity
Interactionist Perspective (4)
The poor develop norms, values, beliefs, and self-concepts that contribute to their plight (culture of poverty)
The “culture of poverty” is characterized by female-
centered households; present gratification (rather than future gratification); lack of participation in social institutions; feelings of marginality, dependency, powerlessness, inferiority.
Critics of culture of poverty argue it blames the victim rather than the structure of society for poverty
Words of wisdom
“A nation that continues year after year to spend more money on military defense than on programs of social uplift is approaching spiritual death.”
“It really boils down to this: that all life is interrelated. We are all caught in an inescapable network of mutuality, tied into a single garment of destiny. Whatever affects one directly, affects all indirectly. We are made to live together because of the interrelated structure of reality.”