ECONOMIC SIGNIFICANCE OF RECREATION 1 SOCIAL SCIENCE RESEARCH REVIEW VOLUME 5, NUMBER 1 WINTER 2005 Economic Significance of Recreational Uses of National Parks and Other Public Lands Dr. Daniel J. Stynes, Michigan State University Introduction and Scope Federal agencies manage roughly 650 million acres of public land (Cordell 1999). These lands provide many economic benefits to the nation, including the production of marketed commodities like timber, minerals, and hydropower; and also services such as grazing, flood control, recreation, wildlife, heritage preservation, and environmental services. Public lands receive over a billion recreation visits each year. Recreational uses provide benefits to the visitor and also create economic impacts in nearby communities. Managing public lands involves a number of tradeoffs between recreation and other uses, among different recreational uses and user groups, and between social, environmental, and economic considerations. Tightening budgets and increasing accountability within federal agencies demand sound justifications for decisions. Federal agencies must take into account the public’s values and inputs, consider present and future generations, demonstrate that resources are allocated efficiently and equitably, and quantify the impacts of their programs. Economics provides a framework and set of tools for addressing these issues. In particular, economic analysis provides one common numeraire ($) for comparing benefits and costs across widely varying management alternatives, outputs, and publics. Measures of economic significance are used both internally in resource allocation decisions and externally to demonstrate the contributions of programs to social welfare and regional economic development. There are two primary notions of economic significance that underlie most applications to public land management programs: economic value and economic impact. Economic value is generally measured in terms of market value or what people are willing to pay for the goods and services produced on public lands. Non- market valuation methods (Sinden and Worrell 1979) were developed largely in response to requirements to evaluate the benefits and costs of federal actions. Valuation methods address economic efficiency and generally take a national perspective. Economic impacts are measured in terms of the sales, jobs, tax revenues, and income that result from Abstract This paper reviews concepts and methods for estimating the economic significance of recreational uses of public lands and reports estimates of recreation values and economic impacts from recent studies. Aimed primarily at non- economists, the review clarifies the distinction between valuation and impact studies, defines key concepts, summarizes the most accessible approaches, and discusses conceptual and practical issues related to choosing among available methods and interpreting and applying the results. Terms that may be unfamiliar to the reader are highlighted in bold face and defined in a glossary at the end of the paper.
Transcript
ECONOMIC SIGNIFICANCE OF RECREATION 1
SOCIAL SCIENCE RESEARCH REVIEW VOLUME 5, NUMBER 1 WINTER 2005
Economic Significance of Recreational Uses of National Parks and Other Public Lands
Dr. Daniel J. Stynes, Michigan State University
Abstract
Introduction and Scope Federal agencies manage roughly 650 million acres of public land (Cordell 1999). These lands provide many economic benefits to the nation, including the production of marketed commodities like timber, minerals, and hydropower; and also services such as grazing, flood control, recreation, wildlife, heritage preservation, and environmental services. Public lands receive over a billion recreation visits each year. Recreational uses provide benefits to the visitor and also create economic impacts in nearby communities.
Managing public lands involves a number of tradeoffs between recreation and other uses, among different
recreational uses and user groups, and between social, environmental, and economic considerations. Tightening budgets and increasing accountability within federal agencies demand sound justifications for decisions. Federal agencies must take into account the public’s values and inputs, consider present and future generations, demonstrate that resources are allocated efficiently and equitably, and quantify the impacts of their programs. Economics provides a framework and set of tools for addressing these issues. In particular, economic analysis provides one common numeraire ($) for comparing benefits and costs across widely varying management alternatives, outputs, and publics. Measures of economic significance are used both internally in resource allocation decisions and externally to demonstrate the contributions of programs to social welfare and regional economic development. There are two primary notions of economic significance that underlie most applications to public land management programs: economic value and economic impact. Economic value is generally measured in terms of market value or what people are willing to pay for the goods and services produced on public lands. Non- market valuation methods (Sinden and Worrell 1979) were developed largely in response to requirements to evaluate the benefits and costs of federal actions. Valuation methods address economic efficiency and generally take a national perspective.
Economic impacts are measured in terms of the sales, jobs, tax revenues, and income that result from
Abstract
This paper reviews concepts and methods for estimating the economic significance of recreational uses of public lands and reports estimates of recreation values and economic impacts from recent studies. Aimed primarily at non- economists, the review clarifies the distinction between valuation and impact studies, defines key concepts, summarizes the most accessible approaches, and discusses conceptual and practical issues related to choosing among available methods and interpreting and applying the results. Terms that may be unfamiliar to the reader are highlighted in bold face and defined in a glossary at the end of the paper.
2 NPS SOCIAL SCIENCE RESEARCH REVIEW WINTER 2005
activities on public lands. Economic impact analyses address requirements of the National Environmental Policy Act to assess economic as well as social and environmental consequences of management and policy alternatives. While economic impact analyses can be used to assess the overall significance of public land management activities to the national economy (e.g., Alward et al. 2003), the more common applications are to assess impacts on local regions. The most direct impacts of activities on public lands involve nearby businesses, households, and units of government. Economic impacts address distributional issues, identifying gains or losses in economic activity for particular regions or economic sectors.
These two concepts of economic significance involve very different methods and address different questions. Most public land management decisions involve both efficiency and distributional issues encompassing matters of both local and national interest. A complete analysis, therefore, usually requires consideration of both economic values and economic impacts. Economic considerations also play important roles in evaluating environmental regulations and damage assessments, as well as cost-sharing, concession, and partnership agreements.
Delimiting the Topic
Different uses of public lands involve outputs with very different product and market characteristics. The specific methods and tools in applied studies must be tailored to these characteristics. For example, while timber and minerals can be valued based on market prices, specialized methods are needed to value recreation and environmental services. The regional economic impacts of timber and recreation can both be addressed using input-output models, but the two goods must be handled very differently, as recreation is a final consumption good, while stumpage is an input to further production (Alward et al. 2003).
This review will focus primarily on recreational uses of public lands. For brevity, I will frequently use the
terms “recreation” and “park” to refer to the collective activities and resources of interest. “Recreation” encompasses traditional outdoor recreation activities, other related amenity uses of public lands, and tourism more generally. The term “park” will encompass national parks, forests, recreation areas, water projects, and other public lands, waters, and facilities that are used for recreation. The review is aimed primarily at public land manag-ers, planners, and policy analysts. I have tried to minimize the economic pre- requisites as much as possible and to focus on applied matters more so than theoretical and technical ones. Economic impact methods are easier to explain to non-economists than valuation techniques, as they involve tangible monetary exchanges and some-what more standard approaches. This review, therefore, provides greater detail on impact assess-ment methods, making use of the NPS Money Gen-eration Model (version 2) to illustrate. The review of valuation methods summarizes the basic concepts and methods and provides guidance to the literature. Proper use of economic tools requires four basic skills: 1) an understanding of the questions that economic analysis can help answer, 2) sufficient familiarity with the alternative methods to select an appropriate tool for a given situation, 3) an understanding of the data requirements and basic assumptions of the chosen approach, and 4) the ability to carry out the analysis or to properly interpret and apply the results.
General Economic Concepts and Analysis
A variety of economic analyses are carried out to support management, marketing, and policy deci-sions. While interrelated, each type of analysis in-volves somewhat distinct purposes and methods. Three categories of economic analysis constitute the bulk of economic applications 1 to recreational uses of national parks and other public lands and waters: 1) demand assessment and forecasts, 2) valuation, and 3) economic impacts (Table 1).
ECONOMIC SIGNIFICANCE OF RECREATION 3
Recreation Demand Models Demand analysis is the starting point for most eco-nomic analysis, as little can be said about visitor benefits or impacts without an understanding of the number and types of visitors. In the strict economic sense, demand is the relationship between quantity purchased (visits) and price. To accurately predict changes in visitors, demand models must also capture other factors that influence use, such as population characteristics, product quality, substitutes, and con-sumer tastes and preferences. Measuring or predict-ing the number of visitors or the changes in visitors is the most important, and often the most difficult part, of any valuation or impact analysis.
Recreation is different from many other goods in that the consumer plays a central role in producing the final recreation experience. Within a household pro-duction framework (Bockstael and McConnell 1991), visitors combine their inputs of time, skill, and equipment with resources that are provided on pub-lic lands or by private firms. Recreation “demand” can be conceptualized in terms of a derived de-mand for these inputs (leisure time, public land
resources, facilities, and programs), as demand for entry to public lands (site- specific demand), or as demand for participation in particular activities (National Academy of Sciences 1975). Each framing of the problem addresses slightly different questions and involves different approaches. Economists have generally favored site- specific de-mand models (Smith 1975), as these more explicitly incorporate prices and yield demand curves from which economic values may be derived. Econometric models have also been used to estimate demand for recreation activities, usually measured in terms of participation rates or frequencies of participation in specific activities (Cicchetti 1973). Activity- specific demand models are generally estimated from house-hold surveys, while site- specific demand models often use park visit data or on- site visitor surveys. Geographers frequently divide the problem of pre-dicting visits to individual sites into trip generation and trip distribution components (Ewing 1980). These models may focus on a particular activity, like downhill skiing or boating, or they may address a set of sites, such as a state park system. Capturing
Table 1. Types of Economic Analyses Demand analysis — How will the number or types of visitors change due to changes in prices, promo-
tion, competition, quality and quantity of facilities, or other demand shifters? A demand analysis esti-mates or predicts the number and/or types of park visitors. The number of visitors is generally predicted based on judgment (Delphi method), historic trends (time series methods), or structural models that capture how visits vary with key demand determinants such as population size, distance to markets, income levels, and measures of quality and competition.
Valuation —What is the (economic) value of recreation resources or experiences? Economists generally
measure the value of recreation experiences to visitors based on their willingness to pay. These values can be em-ployed in benefit-cost analyses or damage assessments. Methods commonly used to estimate recreation use values include travel cost, contingent valuation, and hedonic approaches. There are also methods for estimating “non-use” values of parks, such as option, existence, and bequest values.
Economic impact analysis —What is the contribution of a park or recreation area to the economy of the region? Economic impact analysis traces the flows of economic activity associated with the park to identify changes in sales, tax revenues, income, and jobs in the region that are due to park operations or visitor spending. The principal methods here are visitor spending surveys, analysis of secondary data from government economic statistics, economic base models, input-output models, and multipliers.
4 NPS SOCIAL SCIENCE RESEARCH REVIEW WINTER 2005
substitution effects and visitor responses to quality variations have been the most difficult parts of rec-reation demand modeling. An important use of demand models is to forecast future recreation use or to predict responses to changes in the variables included in the model (e.g., Bowker et al. 1999, Hof and Kaiser 1983, Cicchetti 1973). As most recreation demand models have been based on cross- sectional data (i.e., data collected at one point in time), their success in forecasting has not been very good (Brown and Hustin 1980). Fore-casts assume that the structural relationships embed-ded in the model do not change over time. Qualitative and time- series methods have also been used to fore-cast recreation participation, trips, and park visits (Stynes 1983, Sheldon and Var 1985). Recreation demand models have become more com-plex over time. Simple linear regression and zonal travel costs models have given way to systems of equations (Cicchetti, Fisher and Smith 1976, Burt and Brewer 1971), choice- based multinomial logit models (Adamowicz et al. 1994, Stynes and Peterson 1984), and many advanced statistical estimation techniques. While these advances overcome some unrealistic as-sumptions and technical flaws in the simpler models, they generally increase data requirements and make the models more difficult for non- economists to un-derstand or apply. The published literature, in par-ticular, tends to focus on theoretical, methodological, and statistical issues over practical ones. Recreation Valuation Efforts to estimate the economic value of public lands for recreation began with the development of the travel cost method by Marion Clawson in 1959.2 The travel cost method is an ingenious approach for esti-mating a demand curve for a park using the fact that visitors from varying distances from the park incur different costs. Economic values can be estimated from the demand curve either as a market value (price times quantity) or consumer surplus (willingness to pay over and above what is actually paid).
Market value is an exchange value capturing the revenue that could be obtained by selling the good or service at a fixed market price. Consumer surplus (CS) is the generally accepted measure of the contri-bution of recreation opportunities to social welfare, as it captures the net benefit to the user above his/her costs (Swanson and Loomis 1996). If a person is willing to pay $10 to enter a park and only has to pay $2, she derives a net benefit or consumer surplus of $8. Consumer Surplus can be measured by the area under the demand curve above the current price (Figure 1). This area represents an “all- or- none” value that captures the net loss if the park were closed. This value can be used in a benefit- cost analysis where the costs to the land management agency are compared with the social benefits pro-vided (Sugden and Williams 1978).
Figure 1. Demand Curve
ECONOMIC SIGNIFICANCE OF RECREATION 5
Gains or losses in consumer surpluses due to man-agement actions depend on assumptions about sub-stitutes (Knetsch 1977). For example, if a perfect substitute to the park exists with capacity to accom-modate additional use, visitors would simply switch to this substitute if the park were closed. If the sub-stitute adds an additional $1 in travel costs, the con-sumer now incurs $3 in overall cost ($2 fee plus $1 travel costs) and obtains a surplus of $7. In the pres-ence of the substitute, the loss from closing the first park is not the entire area under the curve, but now only the area between the existing price (P) and that of the closest available substitute (Ps), roughly $1 per visitor in this case.3
Gains or losses in consumer surplus from changes at a single site stem from changes in use levels, changes in willingness- to- pay associated with changes in quality or the nature of the product provided, or changes in the cost/prices to the consumer. The travel cost method directs attention to changes in travel costs, which represent a significant share of the price of a park visit to the consumer. Increasing fees for recreation on public lands also erode con-sumer surpluses unless they change the quality of the resulting product.
Some have argued for wider use of market values for recreation to be comparable with how most other goods and services are valued (e.g., Fedkiw 1987). For example, timber produced on national forests is usually valued based on market prices for sawlogs less harvesting costs (Loomis 1993). However, while one sawlog is a perfect substitute for another, this is not as clearly the case for recreation opportunities. Also, if timber production from a given national for-est represents a small percentage of the overall sup-ply, changes in production will not affect the price. Closing of a recreation site forces consumers to shift to the next closest substitute, usually raising travel costs and affecting the price to the consumer. Dif-ferences in the nature of the good or service being valued and the assumed market structures explain why consumer surplus may be appropriate in some cases and market prices in another (Swanson and Loomis 1996).
When there are many substitutes and when manage-ment actions do not affect the costs to the consumer, market values may be preferred to consumer surplus. Market values for recreation on public lands can be estimated by determining a surrogate market price that reflects what a private firm in a competitive market might charge. Alternatively, a subsidy can be added to the current fee to reflect per- unit costs. Valuation Methods Recreation valuation methods have focused primarily on measuring consumer surplus. Early applications derived consumer surpluses from demand models usually estimated with the travel cost approach. By 1980 three methods for valuing parks had been formally approved by the U.S. Water Resources Council (1983) for use in benefit- cost analyses: travel cost (TCM), contingent valuation (CVM), and the unit day value approach (UDV). Hedonic, benefit transfer, and cost- based methods have received some attention since then (see Table 1 for a summary of valuation methods).
The travel cost method derives an economic value for a park based on visitors’ willingness to travel to visit the park. Originally formulated as an aggregate zonal analysis, it was later adapted to estimate de-mand functions from individual observations (Loomis and Walsh 1997, Ward and Loomis 1986). The method assumes that visitors will react to park fees the same as they do to travel costs.
The CVM approach derives values through surveys designed to elicit what consumers are willing to pay. A significant advantage of CVM over TCM is the abil-ity of CVM to simulate markets that do not exist and estimate willingness to pay for changes in environ-mental quality, as well as values of parks that do not involve direct use (e.g., option, existence, and bequest values). While many economists were reluctant at first to accept the CVM approach, as experience with the method grew and improved guidelines were de-veloped, CVM gradually became an accepted and
6 NPS SOCIAL SCIENCE RESEARCH REVIEW WINTER 2005
widely used valuation approach (Mitchell and Car-son 1989). Many economists still prefer “revealed preference” approaches, like TCM, that are based on actual choices by consumers in a market setting; however, “stated preference” approaches like CVM became indispensable in measuring preferences for environmental qualities and alternatives not directly observable in market behaviors. The unit day value approach is a simple method that is justified when the more detailed TCM and CVM procedures are prohibited by time, cost, or data con-straints, or when “ballpark” estimates may suffice. The UDV approach simply multiplies a value per day of recreation use times the quantity of use provided.4
Suggested unit day values for recreation activities were originally published by the Water Resources Council (1979), along with procedures for adjusting the values within a given range to reflect differences in site quality and substitute opportunities. The unit day values have been updated to FY 2004 by applying price indices. Current recommended unit day values are $3- $12 per day for general recreation activities and $12- $35 for specialized activities (U.S. Army Corps of Engineers 2003).
Average per- day values can be based on empirical estimates from TCM or CVM studies. Based on a review of 163 empirical recreation valuation studies conducted between 1967 and 1998, Rosenberger and Loomis (2001) report average consumer surplus values for 21 recreation activities (see Table 2). In an update for the NPS, Kaval and Loomis (2003) report an average surplus of $43 per day from 49 separate estimates involving national parks.5 Values for particular activities or parks will vary widely depending on the valuation method, the en-vironmental setting, and the recreation experi-ences being valued. For example, per- day average surplus values from camping studies range from $1.69 to $187 dollars. Averages from empirical studies should therefore not be used without careful evaluation of the original studies and their relevance to an intended application. Benefit transfer approaches attempt to generalize values estimated in previous studies to new situa-tions. Benefit transfers can involve the simple appli-cation of an average value from one study to a simi-lar situation (not unlike the UDV approach), or they may involve more complex transfer functions or meta- analyses drawing from many studies (Rosen-berger and Loomis 2001).
The “hedonic” approach (HED), derives values using statistical models to determine the contribution of various product or environmental attributes to value. Hedonic methods have been used to value environ-mental attributes based on variations in property values. In this case, consumer preferences for envi-ronmental attributes are revealed through property markets by statistically isolating the contribution to value of the given environmental amenity (Freeman 1979, 1993).
In situations where measuring benefits is not feasi-ble, costs are sometimes used as a surrogate. For ex-ample, environmental damage assessments (DARP, 1997) have measured values based on the costs of repairing environmental damages (e.g., from oil
Table 2. Average Per Day Consumer Surplus Values for Selected Activities Activity Consumer Surplus Hunt (big game) $37 Boat (non-motorized) $36 Hunt (small game) $28 XC Ski $27 Picnic $24 Camp $24 Hike $23 Sightsee $21 Downhill ski $21 Fish $20 Swim $18 Boat (motorized) $18 General recreation $10 SOURCE: Rosenberger and Loomis (2001). Figures are the medians of reported average surplus values from empirical studies.
ECONOMIC SIGNIFICANCE OF RECREATION 7
Table 3. Comparison of Valuation Methods
Method Strengths Weaknesses Applications
Travel cost (TCM)
Based on observed behavior. Simple zonal models can be estimated with existing visit data.
Assumes consumers react to travel costs the same as to admission fees. Doesn’t work well for urban parks or environmental quality changes that may not affect use patterns. Results can be sensitive to model specifications, handling of substitutes, multi-purpose trips, and costs of time.
Best suited for estimating demand and value for recreation at day use recreation areas within 30-90 miles of primary markets.
Contingent Valuation (CVM)
Adaptable to a wide range of valuation questions.
Based on stated rather than revealed preferences. Results can be sensitive to survey design issues – payment vehicle, information provided, simulated market characteristics.
Applicable to environmental quality changes, existence, and other non-use values.
Unit Day Value (UDV)
Simple, inexpensive.
May not capture differences in values across sites. Unit day values often subjective.
Provides value estimates when time and resources do not permit more elaborate approaches.
Hedonic (HED)
Able to sort out contributions to value of specific product and environmental attributes.
Statistical models must capture and properly control for a host of determinants of value. Results are sensitive to model specifications.
Applied extensively to property and housing values to isolate the contribution to value of environmental attributes. Conjoint analysis is a version of hedonic analysis that can be used with CVM.
Alternative Costs
Costs usually more easily measured than benefits.
Surrogate measure – replacement or repair costs are not the same as benefits. Does not consider social preferences or willingness to pay.
Damage and risk assessments. Measuring benefits of environmental regulations.
Benefit Transfer
Cost effective. Makes use of existing empirical studies.
Difficult to capture all variables that explain differences in value over time and space.
Adapting values from previous studies to new sites/situations.
See King and Mazzotta, “Ecosystem valuation website” (http://www.ecosystemvaluation.org/) for an on-line summary of valuation approaches.
8 NPS SOCIAL SCIENCE RESEARCH REVIEW WINTER 2005
spills) or providing substitutes (e.g. replacing wet-lands lost by development). Cost avoidance ap-proaches measure benefits of flood control or air quality improvements based on savings in potential property damage and health care costs (U.S. EPA, 2000). Costs, however, are not always a reasonable proxy for benefits. For example, the costs of public provision of recreation opportunities will overstate benefits if programs are very inefficient and under-state them when there are significant consumer sur-pluses.
It should be noted that not all values associated with public lands are readily captured via economic measures. There are disagreements among econo-mists about the merits of different approaches and also how far economic valuation methods may be extended (see for example, Rutherford et al. 2000). Economic valuation of recreation visitor experiences on public lands is more straightforward than captur-ing broader amenity and environmental values. Rec-reational trips involve overt behaviors and explicit consumer choices that are not unlike other market behaviors. Consumers, therefore, have some experi-ence with these kinds of markets and, in many cases, there are private- sector alternatives that are at least roughly comparable to what is provided on public lands.
The difficulties in using economic valuation meas-ures grow as we move beyond use values of public lands to values of the resources themselves, often independent of explicit uses. For example, Walsh, Loomis, and Gillman (1984) have measured option,6 existence, and bequest values for wilderness areas based on stated willingness to pay to maintain an option of possible future use, to pass on these op-portunities to future generations, or simply to know they exist. These “non- use” values can be substan-tial, but involve more complex measurement issues.
Broader environmental values have been measured for the purpose of evaluating environmental regula-tions (U.S. EPA, 2000) or in support of damage as-sessment claims (DARP, 1997). There are a host of unique methods for environmental valuation that are beyond the scope of this review. These range from CVM and hedonic approaches that measure WTP for
environmental alternatives, to measures based on cost savings (e.g., flood prevention, health) or func-tional contributions of given environmental attrib-utes within ecosystems (See U.S. EPA 2000 or King and Mazotta 2004). Valuation of recreation and other uses of public lands has required the development of new methods and considerable rethinking of standard market-based economic analyses within household production (Becker 1963, Bockstael and McConnell 1981), political referenda (Mitchell and Carson 1989), psychological choice (Peterson et al. 1988), and other frameworks. While economists generally prefer to stay within the accepted economic paradigms, applications often take the analysis into social, legal, and political arenas where the traditional economic assumptions may not fully hold or be accepted.
Economic Impact Analysis
The application of regional economic tools to assess impacts of recreation on public land has been more straightforward than valuation. Existing theories of regional economic development and models of regional economic structure have been generally accepted as applicable to recreation, tourism, and other goods and services stemming from public lands. The primary task for public land applications has been to measure the actual outputs or monetary exchanges associated with recreation and other uses. These can then be entered into regional economic models as final demand changes or as inputs to further production (Alward et al. 2003).
Economic impact studies estimate the changes in economic activity within a region resulting from some action. Like evaluation studies more generally, economic impacts should be assessed with versus without the program/action being considered (Gericke and Sullivan 1996, Sullivan et al. 1993). A causal linkage should be established between the economic effects (e.g., jobs, income) and the program or action being evaluated. The usual process for assessing economic impacts of recreation is illustrated in Figure 2.
ECONOMIC SIGNIFICANCE OF RECREATION 9
part- time jobs from full- time jobs. There are at least two distinct measures of income. Personal income includes wages and salaries, payroll benefits, and income of sole proprietors. Total income adds in profits and rents of businesses. Tax receipts may include any combination of local, state, and federal taxes. Value added is the measure of economic significance preferred by most economists, as it captures the contribution of the activity or industry to gross regional or national product. Value added includes the personal income to households (wages, salaries, and payroll benefits), profits and rents of private firms, and indirect business taxes accruing to government units in the region. Because value added is not as widely understood as the other measures, personal or total income are often reported instead. Income or value added are the preferred measures when comparing impacts across economic sectors or regions, as employment estimates do not reflect variations in part- time and seasonal jobs or wage rates.
Regional economic models translate sales into the associated jobs and income and, more importantly, trace the flows of economic activity within a region, for example from timber stumpage to sawmills to manufacturing, construction, and final consumption of wood products. Recreation and tourism impact local economies primarily through visitor spending on trips.
Regional Economic Theory and Methods
Regional economic methods have evolved over time from economic base approaches (Pfouts 1960) to input- output models (Miernyk 1965, Richardson 1972), and more recently to social accounting matrices (SAM) and computable general equilibrium (CGE) models (Vargas et al. 1999).
In its simplest form, economic base theory divides industries into export and service industries. Export industries, like manufacturing, sell goods and ser-vices outside the region, generating income for households, businesses, and local governments in the area. Service industries, while necessary for
Action Changes in Recreation Activity
Figure 2. Tracing Economic Impacts of Recreation Activity
First one must translate the action or decision being evaluated into changes in the levels and types of recreation activity. This can be carried out using demand or forecasting models in an ex- ante analysis or by careful measurements of changes in use for an ex- post analysis. Changes in recreation activity are then translated into changes in spending in the area. The usual approach is to multiply the changes in visits by visitor spending averages that have been estimated in a visitor survey. Finally, the estimates of spending changes become inputs to a regional economic model (or a set of multipliers) to determine changes in economic activity resulting from this spending. The model can further trace impacts through direct and secondary effects. Depending on the purpose of the study, the analysis may stop at estimating changes in recreation use, changes in spending, or just the direct effects.
Impact Measures Economic impacts are measured in terms of sales, income, jobs, tax receipts, and value added. Economic measures in impact studies are generally consistent with how these terms are defined in our national economic accounts (USDC BEA, 1992). Visitor spending becomes sales by firms in the region. Jobs are usually reported consistent with Bureau of Labor Statistics data that usually do not differentiate
Changes in Spending
Direct Economic Impacts
Secondary Economic Impacts
10 NPS SOCIAL SCIENCE RESEARCH REVIEW WINTER 2005
the local economy, do not generally bring additional money into the region. They circulate the income that is earned from export activities. Local and regional economic growth strategies have therefore focused on attracting export industries and especially manufacturing jobs. Federal government activity and tourism can also be considered basic or export industries in that they generate income that comes from outside the region. Similar to a military base or major federal construction project, the federal payroll and operational expenses of public land management agencies can have significant local economic impacts. Recreation activity can be seen as either a local service function or an export activity, depending on the origin of the visitor. Attracting retirees (Deller 1995) or seasonal residents (Marcoullier et al. 1996) are other service- based economic development strategies that have become popular alternatives to manufacturing for some regions.
Input- output (I- O) models are the principal tools for economic impact analysis. I- O models capture the structure of the local economy through inter-industry transactions and exchanges between businesses, households, and government units in a region. An input- output model includes a production function for each sector, identifying the goods and services it buys from other sectors, as well as value-added components, such as wages and salaries paid to employees, profits and rents, and indirect business taxes. To capture the circulation of money within the local economy, an I- O model must also identify the percentage of goods and services that are purchased from local firms versus imported from outside the region. Imports constitute a “leakage” of income from the region, while local purchases yield additional jobs and income in so- called “backward-linked industries” (Schaffer 1999) .
Wassily Leontief (1986) was awarded the Nobel Prize in economics in 1973 for the development of I- O methods and their application. While I- O models can be used to examine inter- industry relationships in
considerable detail, most applications are to estimate regional impacts of changes in production or final demand, for example, the impact of a new automo-bile plant, a government installation, or the impacts from additional tourist spending or park visitors. Input- output models can also estimate losses due to the closing of a plant or park or reduced tourist activity. Estimating an input- output model for a given region was historically an expensive and time- consuming task, requiring surveys of businesses within each sec-tor in the region. With the advent of micro-computer based systems and improved economic databases, “non- survey” methods have now become the accepted approach. Non- survey approaches, like IMPLAN and RIMS II, adapt national I- O tables to local regions (Brucker, Hastings, and Latham 1987).
While the basic I- O model assumptions do not always hold completely,7 the models are quite robust and provide a powerful framework for analyzing the economic structure of a region or the economic impacts of changes in supply or demand. Most economic impact studies of recreation and other uses of public lands employ I- O models or multipliers derived from I- O models. These methods are well- suited to the kinds of questions being asked and, in most cases, are at the appropriate level of complexity for the intended use.8 The development of microcomputer- based I-O modeling systems such as IMPLAN has made the methods quite accessible. Methods based on multipliers extracted from such models, such as the NPS MGM2 model, simplify the analysis even further.
Multipliers
The economic impacts of visitor spending are estimated by applying spending changes to a model of the local economy. This basically involves putting the dollars that visitors spend into each sector that receives them and tracing the impact as the money flows through the economy. Impacts are usually divided into three types:
ECONOMIC SIGNIFICANCE OF RECREATION 11
Multipliers provide a simple and convenient way to estimate secondary or total impacts in a region from direct sales or spending. Armed with a multiplier or set of multipliers for a region, impacts can be calculated by straightforward multiplication. Multipliers are, however, often misunderstood and sometimes applied incorrectly (Archer 1984). Widespread use of published statewide multipliers or simply using a multiplier from another study has given some the mistaken impression that there is a single recreation or tourism multiplier that can be used for any area or application.
Multipliers represent the economic structure of a particular set of industries in a particular region in a given year. They depend on:
• The geographic extent and level of economic development of the region. Multipliers are low in rural regions, higher for metropolitan or multi- state regions, and even higher for national analyses.
• The particular industries in question. Multipliers vary between different sectors of the economy depending on the production function of each industry and the propensity to purchase goods and services from local firms.
• Time. Multipliers may change over time, either due to price changes or changes in industry structure or trade flows within the region. Some published multipliers are based on models that are ten or 20 years old.
• The economic measure. Multipliers may be expressed in terms of sales, income, employ- ment, or value added.
• Scope of secondary effects. Type I multipliers only capture indirect effects, while Type II multipliers capture both indirect and induced effects.
• Direct effects are the sales, income, and jobs in those businesses selling directly to visitors, i.e., hotels, campgrounds, restaurants, amusements, gas stations, grocery stores, and retail shops. • Indirect effects result when hotels and other directly impacted businesses buy goods and services from other businesses within the region, so- called “backward- linked” industries. Input- output models estimate these effects by using a production function for each sector and estimates of the propensity of businesses to buy goods and services from local suppliers. • Induced effects stem from household spending of income earned directly or indirectly from the visitor spending. For example, hotel and restaurant employees live in the area and spend their income on housing, groceries, etc. This spending supports jobs in a variety of local businesses. Note that the primary impacts of park operations themselves are the induced effects of the park payroll.
Collectively, the indirect and induced effects are termed secondary effects. The total impact of visitor spending is the sum of direct, indirect, and induced effects.
Multipliers express the size of the secondary effects relative to the direct effects. A Type I multiplier only captures indirect effects, while a Type II multiplier captures both indirect and induced effects. That is,
• Type I sales multiplier = (direct sales + indirect sales)/ direct sales
• Type II sales multiplier = (direct sales + indirect sales + induced sales)/ direct sales
There are many variations on these multipliers. Multipliers may be expressed in terms of jobs, income, or value added rather than sales. 9 There are also variations across models and multipliers relative to which components of income are re-circulated in computing induced effects. 10
12 NPS SOCIAL SCIENCE RESEARCH REVIEW WINTER 2005
Multipliers (or regional economic models more generally) are one of the three primary inputs to a recreation economic impact analysis. They are not, however, the most important part. In fact, multipliers can be completely avoided if one stops with estimates of spending or just the direct effects. 11 The most important inputs to a recreation impact analysis are the number of visitors and their spending patterns.
Recreation Visits
While many park and recreation agencies gather some kind of recreation use data, the purpose of these data is usually not to estimate spending or economic impacts. Existing visit data is therefore not always useful for economic analysis. 12 Agencies generally measure recreation visits in terms of entries to public lands and, in some cases, the amount of time spent there. Keep in mind that most recreation spending does not occur on the public land itself, but instead in nearby communities. Time spent on the public lands may therefore be inversely related to spending. 13
For regional economic analysis, one must usually think in terms of trips to the region or days spent in the area rather than visits to a particular park or recreation facility. The MGM2 model (Stynes et al. 2000) requires that park visits be translated into the number of person or party days/nights spent in the region. The conversion takes into account party sizes, length of stay in the region (not just inside the park), and also possible multiple counting of visitors who enter and leave a park more than once during a stay in the area. Different kinds of visitors have quite distinct spending patterns. Visitors should therefore be divided into distinct segments that help explain spending. Local residents should be distinguished from visitors from outside the region and day trips from overnight stays. As expenses depend considerably on lodging types, visitors staying in motels should be distinguished from campers and from those staying with friends and
relatives or in private homes in the area. Finally, some information about trip purposes is often needed to assess which trips and spending can be attributed to the park visit or the specific action being evaluated.
By itself, visitor count data is therefore of limited use for economic analyses. Visitor surveys are usually needed to estimate the mix of different types of visitors (local, day trips, overnight visitors), to adjust visit/vehicle count data for re- entries, lengths of stay, and party sizes, and also to measure spending. When evaluating specific management actions, estimating changes in the number and kinds of visitors is usually the most difficult part of an economic impact assessment. Visitor Spending
Visitor spending is the primary link between recrea-tion activity and the local economy. Obtaining reli-able spending data is therefore an important part of economic impact studies. Most studies to date have gathered primary spending data via visitor surveys, usually for very specific applications. Some national studies have measured spending patterns via house-hold surveys or multi- site studies, with the intent of generating spending profiles that can be more widely applied. Examples include studies by the U.S. Army Corps of Engineers (Propst et al. 1996), the Travel Industry Association (TIA 2002), USDA Forest Ser-vice NVUM study (Stynes, White, and Leefers 2003), and the Fish and Wildlife Service survey of hunting fishing and wildlife- associated recreation (USDC and USDI, FWS 2001). The NPS Visitor Services Pro-ject (VSP) has also begun to accumulate a database of spending information by using consistent meth-ods across parks. These efforts are leading to in-creasing availability of secondary sources of spending data and methods for adapting existing spending profiles to particular applications.14 Directly measuring spending by visitors in surveys can be both difficult and expensive. Gathering spending data is often the largest cost in recreation economic impact studies. A variety of measurement,
ECONOMIC SIGNIFICANCE OF RECREATION 13
sampling, and analysis issues must be addressed in spending surveys (Stynes 2001). Difficulties in obtaining accurate self- reports of spending from representative samples of visitors (or trips) and producing reliable spending averages can introduce considerable errors in empirical estimates. Spending data are usually characterized by highly skewed distributions with high variances. 15 Spending averages can be very sensitive to how reports of zero spending, missing observations, and outliers are handled. The MGM2 default recreation visitor spending profiles illustrate typical patterns of spending by park visitors (Table 4). These averages are based on recent visitor spending studies at several national parks. Spending is expressed on a party/day basis for day trips and a party/night basis for overnight stays. A party consists of all people in the same vehicle or, in some cases, all people staying in the same room or campsite. These spending profiles illustrate important differences in per- day spending across segments.
Visitors from the local area spend the least money per trip, followed by visitors on day trips from outside the local area, campers, and then visitors staying overnight in motels. There are also differences between campers staying inside the park
versus outside. The allocation of expenses across lodging, meals, groceries, transportation, and other categories varies between these segments.
Averages like these must be adjusted for areas that may have fewer or greater spending opportunities and higher or lower prices. Differences in spending averages for visitors to different parks are often due to the mix of visitors attracted and lengths of stay. 16 Table 5 shows the range of trip spending averages by segment, as measured in several recent national park visitor surveys.
Surveys of visitors to national forests (NF) and Corps of Engineers (CE) projects have yielded similar spending averages. For example, NF visitor spending averages measured recently in the NVUM survey were $32 per party for local day trips and $47 for non- locals (Stynes, White, and Leefers 2003). CE surveys estimated day trip spending at $33 per party for non- boaters and $54 for boaters (Propst et al. 1998). For visitors camping at CE projects, per-night spending was $50 for non- boaters and $66 for boaters. Spending averages estimated for individual forests or CE projects show the same kinds of variation as seen for national parks in Table 5.
Table 4. MGM2 Spending Averages, Median Spending Profiles, 2002 ($ per party per day/night) Segment Day trips Overnight trips Spending category Local Non-local Camp-in Camp-out Motel Motel, hotel, cabin or B&B $ 0.00 $0.00 $ 0.00 $ 0.00 $79.68
Camping fees 0.00 0.00 15.94 21.91 0.00
Restaurants & bars 12.66 16.88 10.55 12.66 40.09
Groceries 6.30 6.30 13.65 9.45 10.50
Gas & oil 4.51 9.01 9.92 9.92 8.11
Other transportation 0.53 1.05 1.05 1.05 2.10
Admissions & fees 4.36 7.63 6.54 14.17 13.08
Souvenirs and other expenses 8.72 12.29 10.12 19.25 19.25
Total 37.08 53.17 67.75 88.41 172.81
14 NPS SOCIAL SCIENCE RESEARCH REVIEW WINTER 2005
Total visitor spending is estimated by multiplying a spending average by the volume of activity. This is best carried out by disaggregating visitors into a set of visitor segments that capture the mix of visitor types and the associated differences in their spending. If spending is itemized within categories such as those in Table 4, spending can be bridged into the associated economic sectors and applied to a model of the region’s economy.
Applying Multipliers to Spending Data Multipliers convert spending to the associated income and jobs and capture secondary effects as spending circulates within a regional economy. The simplest approaches use a single overall aggregate sales multiplier, which implicitly assume a given distribution of visitor spending across economic sectors. A value of 2.0 was recommended in the original MGM model and has been widely used in tourism studies. 17 However, very few local regions have tourism sales multipliers as high as 2.0. The aggregate Type II sales multipliers recommended in the MGM2 model range from 1.3 for rural areas to 1.6 for larger metropolitan areas. Multipliers for statewide regions generally range from 1.5 to 1.8.18
The tourism sales multiplier for a national model is around 2.5.19 Impacts can be estimated more precisely using sector- specific multipliers (USDC BEA 1992). Multipliers in Table 6 illustrate the approach in the MGM2 model.20 The “direct effect ratios” convert sales or spending into the associated income and jobs in the key tourism sectors. The calculations may be illustrated with the hotel sector multipliers. Using the direct effect ratios for hotels, a million dollars of visitor spending in hotels supports 19 hotel jobs, a hotel payroll of $333,333, and yields a half million dollars in value added in the hotel sector. The “total effects multipliers” in Table 6 capture the secondary effects. For the hotel sector, a Type I sales multiplier of 1.32 and Type II sales multiplier of 1.5221 means that hotels generate $.32 in indirect sales and $.20 in induced sales for every dollar of direct sales. Hence, if visitors spend $10 million in hotels in this region, the total sales effect is $10 * 1.52 = $15.2 million in sales. The additional $5.2 million in secondary sales can be broken down into $3.2 million in indirect effects and $2.0 million in induced effects.
Table 5. Spending Averages from Selected National Park Studies ($ per party per day/night) Segment Day trips Overnight trips Park Local Non-local Camp-in Camp-out Motel Sequoia/Kings Canyon NP $57 $62 $72 $67 $220 Pictured Rocks NL $26 $37 $47 $64 $169
Crater Lake NP $50 $51 $62 $64 $216
Valley Forge NHP $25 $38 NA $88 $193 Gettysburg NMP $33 $57 NA $76 $225
Multipliers for jobs, personal income, and value added in Table 6 are expressed relative to direct sales. For example, sales in the hotel sector support an additional seven jobs in other sectors through secondary effects, for a total of 26 jobs per million dollars in direct hotel sales. Alternative Methods for Estimating Economic Impacts of Visitor Spending Important prerequisites to the choice of methods for an impact analysis are a clear understanding of the intended uses of the results, the accuracy needed, and a realistic assessment of the available resources and expertise for the analysis. The vast majority of recreation and tourism economic impact studies have been used primarily for public relations purposes. The client wants to demonstrate the economic significance of a given activity, usually in order to garner public or community support that may translate into budget increases, enhanced partnerships, or favorable treatment in local policy or planning decisions. These uses do not demand the same level of detail or accuracy as studies to evaluate specific management alternatives.
The choices for estimating economic impacts of rec-reation visitor spending differ primarily in the sources of the input data and especially the level of aggregation and detail. Costs in terms of time, data needs, and required skills increase with the level of detail and use of primary versus secondary sources. The precision and accuracy of results also increase with the greater ability to tailor the inputs to the particular situation. The alternatives range from highly aggregated approaches relying solely on judg-ment or secondary data to quite detailed approaches that gather extensive primary data and make use of formal regional economic models. As impact estimates rest on three distinct inputs (visits, spending, and multipliers), the choice of methods goes beyond the selection of a regional economic model or a set of multipliers. Choices also involve the measurement of visits and spending and how the three components are combined to estimate economic impacts. Method choices also include de-cisions about the units of analysis and levels of ag-gregation for each piece. Four levels of analysis and detail capture the different approaches used in rec-reation and tourism impact studies (Table 7):
Table 6. MGM2 Generic Multipliers for Selected Tourism- related Sectors, 2001 Smaller Metro Regions a
Direct effects Total effects multipliers Jobs/ Personal Value Jobs/ Personal Value Value $MM income/ added/ Sales Sales $MM income/ added/ Economic sector sales sales sales Type I Type II sales sales sales Hotels/lodging places 19 0.33 0.50 1.32 1.52 26 0.52 0.83 Eating & drinking 25 0.34 0.47 1.24 1.44 30 0.49 0.74 Amusements/recreation 26 0.35 0.57 1.25 1.45 32 0.51 0.85 Auto repair and service 101 0.31 0.48 1.23 1.41 15 0.45 0.72 Food processing 4 0.12 0.23 1.23 1.33 9 0.25 0.45 Petroleum refining 0.4 0.04 0.11 1.01 1.05 2 0.10 0.24 Sporting goods manf. 10 0.21 0.39 1.27 1.42 14 0.36 0.64 Manufacturing (general) 8 0.21 0.36 1.19 1.33 12 0.35 0.58 Retail trade 24 0.51 0.80 1.13 1.38 29 0.65 1.04 Wholesale trade 10 0.40 0.69 1.17 1.38 15 0.55 0.92 a Multipliers estimated from 1996 IMPLAN models for regions around national parks. Jobs/sales ratios are updated to 2001 by dividing by an overall price index of 1.13. Type II multipliers are IMPLAN Type SAM multipliers.
16 NPS SOCIAL SCIENCE RESEARCH REVIEW WINTER 2005
1. Subjective estimates that rely mostly on ex-pert judgment to choose spending averages and multipliers and apply these to guessti-mates of visitors.
2. Secondary data in aggregate form, adapted to
fit the problem. 3. Secondary data in disaggregate form, permit-
ting finer adjustment of the input data and providing more detailed results.
4. Primary data, usually involving visitor sur-
veys and a custom economic model for the region in question.
The separation/distribution of visitors into distinct segments, spending into different categories, and multipliers to individual sectors allows the analyst to fine- tune the input data and impact model to a particular application. This also provides much
greater specificity and detail in the results. An overall visitor spending average is difficult to interpret or generalize to situations involving different mixes of visitors, lengths of stay, or local prices. Aggregate multipliers do not capture the different effects of spending in retail shops relative to restaurants or lodging establishments.
Recreation applications within federal agencies have generally progressed from the simpler to the more advanced methods. For more routine applications by non- economists, the input- output modeling component is usually simplified through the use of multipliers and spreadsheet tools. As the three inputs typically come from very different sources, a study that uses a custom input- output model may rely on judgment for the visit estimates and secondary sources for spending data. MGM2 is a flexible model that can be operationalized at any of the levels of detail suggested in Table 7. Inputs to the model can be based on judgment, secondary data, or primary data collection.
Level Recreation use (visits) Spending Multipliers
1-Judgment
Expert judgment to estimate recreation activity.
Expert judgment or an “engineering approach.” 22
Expert judgment to estimate multipliers.
2 - MGM
Existing visit counts for a particular facility or area.
Spending averages from studies of a similar area/market.
Aggregate tourism spending multipliers from a similar region/study.
3 - MGM2
Break visitors into distinct seg-ments based on trip types or activities.
Adjust spending averages that are disaggregated by spending categories and segments.
Use sector-specific multipliers from published sources.
4 - Primary Data + I-O model
Visitor survey or demand model to estimate number of visitors by segment.
Survey a random sample of visi-tors to estimate average spend-ing by segment within spending categories.
Use an input-output model of the region’s economy.
Table 7. Approaches to Recreation Economic Impact Assessment
ECONOMIC SIGNIFICANCE OF RECREATION 17
dictates the appropriate multipliers. Enlarging the region of interest captures a greater portion of the visitors’ spending and also generates larger secondary effects; however, the larger the region, the smaller the relative share of overall economic activity in the region that it will represent. Also, the farther that spending, income, and jobs are removed from the park, the more difficult it is to argue that the park is the reason for these. Many recreation and tourism economic impact stud-ies do not evaluate a specific action,24 but instead measure the amount of economic activity associated with current levels of use. The implied “alternative” is closing the park and losing all of the spending of existing park visitors. However, if some visitors did not make the trip primarily to visit the park and oth-ers would substitute other nearby attractions, all of the spending would not necessarily be lost to the region. A clear definition of the program or action being evaluated helps to identify which trips or types of spending should be included in the analysis. For example, types of spending could include:
• Spending by visitors from outside the area within the destination region; • Spending by visitors at home or en route to the destination; • Spending by local residents on trips to the park; • Purchases of durable goods and equipment by locals or non- locals; • Park operations (employees and local purchases of supplies and services); • Construction.
Many studies exclude spending by nearby residents, arguing that their spending does not represent “new” money to the region. If the action being evaluated is to close a park, would local residents then travel outside the region or substitute some other local activity? Crompton et al. (2001) identify local residents, “time switchers,” and “casuals” as three subgroups of visitors to special events that may not represent a net increase in spending.
Economists are frequently asked to put confidence limits on economic impact estimates. This is difficult as impact analysis does not directly employ statistical models. Errors in the overall impact estimates rest largely on the accuracy of the input data. While confidence intervals can be estimated for spending averages (when estimated via surveys),23 error estimates for visitor counts and multipliers are usually not available. However, spreadsheet models make it quite easy to estimate the sensitivity of results to errors or variations in the input data and model parameters. Analysts should attempt to balance errors across the estimates of visits, spending, and multipliers by directing the greatest attention to the weakest pieces. This is usually the estimate of the number and types of visitors. Conceptual Issues: Clarifying the Problem There are a host of conceptual issues underlying economic impact studies. Specific method choices and the interpretation of study results depend considerably on how the problem is defined. Planners and managers play very important roles in defining the problem and in interpreting, communicating, and applying the results. Misunderstandings and misuses of economic analyses often arise from a lack of clarity in the question being asked or a mismatch between methods and intended uses. Four decisions are particularly important in defining an economic impact study: 1) defining the study region, 2) clarifying the program or action being evaluated, 3) identifying the sources and kinds of spending to be included, and 4) choosing appropriate impact measures. The region defines what spending will be included and the geographic scope of impacts. For assessing local impacts, the region should include major gateway communities around the park, generally within a 30- 60 mile radius, where visitors might stay overnight or purchase supplies and souvenirs related to the park visit. The definition of the region also determines the scope of businesses, government units, and households covered by the impacts and
18 NPS SOCIAL SCIENCE RESEARCH REVIEW WINTER 2005
Trips involving multiple purposes and multiple activities pose particular difficulties in isolating what spending may be “caused” by the park or would be lost in its absence. For example, a great deal of spending by visitors to Grand Canyon National Park, including airfares and car rentals, occurs more than 100 miles away (Leones and Frisvold 2000). Attributing spending to an individual park or attraction is particularly difficult in urban settings and major tourist destinations where visitors often come for a variety of activities. For example, visitors to Great Smoky Mountains National Park spent $618 million in the local region in 2000, but, due to the other attractions outside the park (Stynes 2002), as much as half of this spending might still occur if the park were closed.
Visitors to public lands use a variety of equipment and durable goods that support major industries, including sporting goods, recreational vehicles, and boats. Of the $108 billion in wildlife- related expenditures reported in the most recent national survey (USDI FWS 2001), $65 billion was for equipment and durable goods and only $28 billion was trip- related. Of the $15 billion in spending reported by the U.S. Army Corps of Engineers in 1999 (USACE 2003), $5 billion was for equipment and $6 billion was trip spending within 30 miles of the CE project.
As equipment is often used in many places over an extended period of time, the associated economic impacts are not readily traced to a particular provider or region or associated with individual trips. Equipment and durable goods tend to be bought near home rather than on trips. The largest economic impacts often occur where the equipment is manufactured. For example, the majority of recreational vehicles are made in Indiana, a state with very limited federally managed recreation lands.
Impacts of construction or park operational expenses can also be estimated.25 The presence of federal programs and employees in an area has significant local economic effects, irrespective of any recreational use or visitor spending. Impacts from park employees and operations may exceed those
from visitor spending, as many resource management responsibilities are independent of the number of visitors. For example, the park payroll accounted for over a third of the total local income effects at Carlsbad Caverns National Park (Stynes and Sun 2004) and over three- fourths at Women's Rights National Historical Park (Stynes 2000). Some studies have also attempted to capture the impacts of induced private development surrounding public lands, pro- rated shares of durable goods purchases, and even volunteer jobs. The Travel Industry Association (TIA 2001) includes a pro-rated share of motor vehicle operating costs and imputed rents on seasonal homes in its statewide tourism impact estimates.
Choices over which spending and multiplier effects to include and the size of the impact region can increase (or decrease) impact estimates up to tenfold. These details rarely accompany impact results that are reported in the media, and only some of these delimitations may be explicitly addressed in formal impact reports. Lack of consistency in these choices makes it difficult to compare results across studies or over time.
National Park Visitor Spending Impacts
The earliest formal national park economic impact figures are the national estimates by Swanson (1969). Swanson estimated total national park visitor spending at $6.4 billion in 1967, generating $4.76 billion in personal income (Table 8). Inputs to the calculation were: 1) 140 million park visits in 1967, reduced to 105 million after omitting local visitors, day trips, and some double counting of visitors; 2) an average visitor spending of $60.48 per visit based on $15.12 per person per day and an average stay of four days; 3) an income- to- sales ratio of 30 percent; and 4) an income multiplier of 2.5, reflecting indirect and induced effects on the national economy. Swanson’s estimates were admittedly very rough, but the report received considerable attention and demonstrated the basic information and calculations needed to estimate economic impacts of national park visitor spending.
ECONOMIC SIGNIFICANCE OF RECREATION 19
The Money Generation Model (MGM), developed by the NPS in 1990, applied this same basic aggregate approach to individual parks (USDI NPS 1990). The Money Generation Model was easy to use, but pro-vided limited guidance for selecting the key inputs for a particular application, i.e., spending averages and multipliers.26 The highly aggregate nature of the model limited its use primarily to public relations, as most management, marketing, and policy decisions require greater detail.
With advances in input- output modeling databases and software during the 1990s, economists preferred more direct use of input- output models to assess im-pacts of park visitors (e.g., Johnson and Sullivan 1993, Moore and Barthlow 1998). The USDA Forest Service developed IMPLAN as its primary tool for impact analysis during the 1980s, and has since used it exten-sively in forest planning. The IMPLAN system became the method of choice within federal land manage-ment agencies (Propst 2001). However, the estimation of I- O models and the application of recreation spending data to IMPLAN’s impact routines requires some knowledge of regional economic models and proficiency with the IMPLAN software. These skills are relatively scarce within the National Park Service and other public land management agencies.
The Corps of Engineers developed spreadsheet- based tools to work with IMPLAN for recreation analysis in the early 1990s (MI- REC). Following a review of the MGM model by Duffield et al. (1997), an updated version (MGM2) was developed at Michigan State University in 2000 (Stynes et al. 2001). The MGM2
is a disaggregate spreadsheet model for combining recreation visit, spending, and multiplier data to es-timate economic impacts. The model does not re-quire knowledge of I- O modeling or direct access to IMPLAN software and data. Samples of the MGM2 spending and multiplier databases were shown in Tables 4 and 6. The model can be used to evaluate specific management alternatives or mar-keting strategies. The primary use, however, contin-ues to be to generate overall impacts of current use in order to demonstrate contributions of individual parks to local economies.27 National estimates of the economic impacts of NPS recreation visitor spending have been made using the MGM2 model (Stynes and Sun 2003). These esti-mates are based on 280 million national park recrea-tion visits in 2001, the spending profiles in Table 4, and multipliers in Table 6. Park visitors in 2001 spent $10.6 billion in local regions around na-tional parks.28 To the extent possible, spending not directly related to the park visit is excluded.29 Visitor spending is distributed (Figure 3) to lodging (28%), restaurants (25%), gas and oil (12%), admissions and fees (10%), groceries (9%), and other retail purchases (16%). National park visitors staying overnight in hotels, motels, B&Bs, and cabins (in most cases outside the park) account for 18 percent of visitors and 56 per-cent of spending. Local residents represent 20 per-cent of visits, but only seven percent of spending.
Table 8. Swanson’s Calculations 1. Total visits 140 million 2. Percent non-local 75% 3. Non-local visits (1*2) 105 million 4. Average spending $60.48 5. Total spending (3*4) $6.4 billion 6. Income/sales ratio 30% 7. Direct income (5*6) $1.9 billion 8. Income multiplier 2.5 9. Total income (7*8) $4.76 billion
Figure 3. National Park Visitor Spending in 2001 ($10.6 billion)
20 NPS SOCIAL SCIENCE RESEARCH REVIEW WINTER 2005
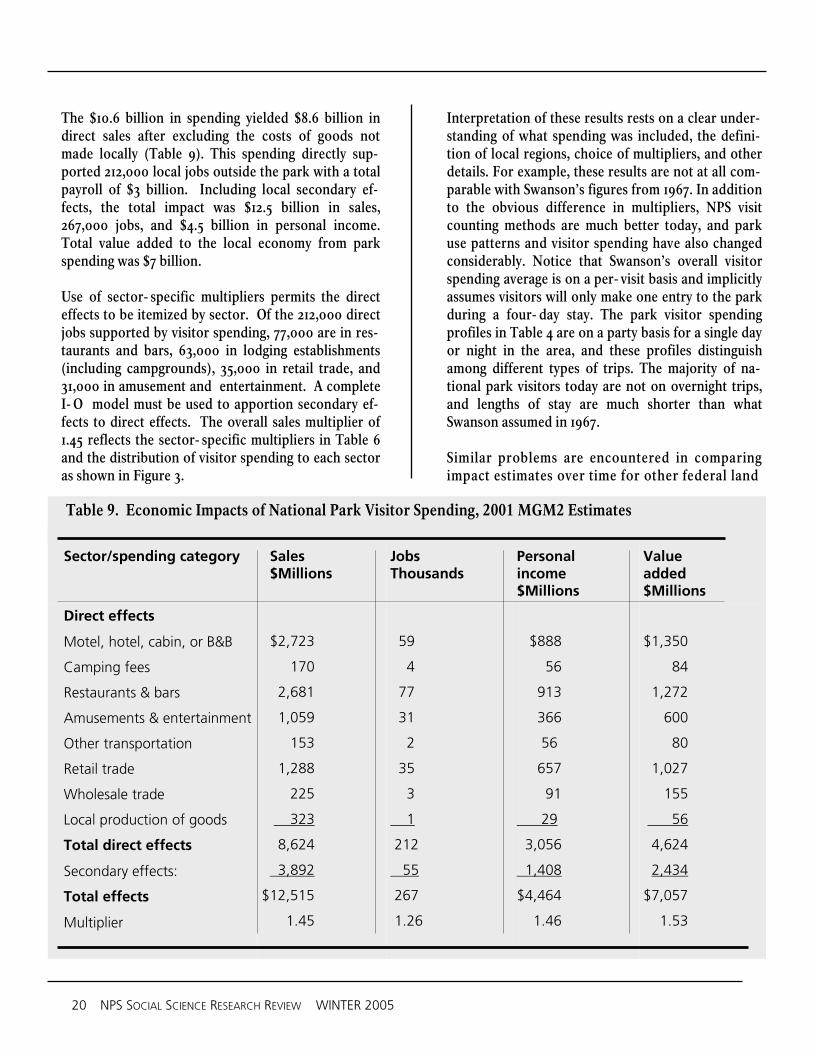
The $10.6 billion in spending yielded $8.6 billion in direct sales after excluding the costs of goods not made locally (Table 9). This spending directly sup-ported 212,000 local jobs outside the park with a total payroll of $3 billion. Including local secondary ef-fects, the total impact was $12.5 billion in sales, 267,000 jobs, and $4.5 billion in personal income. Total value added to the local economy from park spending was $7 billion. Use of sector- specific multipliers permits the direct effects to be itemized by sector. Of the 212,000 direct jobs supported by visitor spending, 77,000 are in res-taurants and bars, 63,000 in lodging establishments (including campgrounds), 35,000 in retail trade, and 31,000 in amusement and entertainment. A complete I- O model must be used to apportion secondary ef-fects to direct effects. The overall sales multiplier of 1.45 reflects the sector- specific multipliers in Table 6 and the distribution of visitor spending to each sector as shown in Figure 3.
Sector/spending category
Sales $Millions
Jobs Thousands
Personal income $Millions
Value added $Millions
Direct effects
Motel, hotel, cabin, or B&B
Camping fees
Restaurants & bars
Amusements & entertainment
Other transportation
Retail trade
Wholesale trade
Local production of goods
Total direct effects
Secondary effects:
Total effects
Multiplier
$2,723
170
2,681
1,059
153
1,288
225
323
8,624
3,892
$12,515
1.45
59
4
77
31
2
35
3
1
212
55
267
1.26
$888
56
913
366
56
657
91
29
3,056
1,408
$4,464
1.46
$1,350
84
1,272
600
80
1,027
155
56
4,624
2,434
$7,057
1.53
Interpretation of these results rests on a clear under-standing of what spending was included, the defini-tion of local regions, choice of multipliers, and other details. For example, these results are not at all com-parable with Swanson’s figures from 1967. In addition to the obvious difference in multipliers, NPS visit counting methods are much better today, and park use patterns and visitor spending have also changed considerably. Notice that Swanson’s overall visitor spending average is on a per- visit basis and implicitly assumes visitors will only make one entry to the park during a four- day stay. The park visitor spending profiles in Table 4 are on a party basis for a single day or night in the area, and these profiles distinguish among different types of trips. The majority of na-tional park visitors today are not on overnight trips, and lengths of stay are much shorter than what Swanson assumed in 1967. Similar problems are encountered in comparing impact estimates over time for other federal land
Table 9. Economic Impacts of National Park Visitor Spending, 2001 MGM2 Estimates
ECONOMIC SIGNIFICANCE OF RECREATION 21
management agencies or making comparisons across agencies. For example, a national forest recreation impact estimate of $30 billion in value added for 1999 (Alward et al. 2003) is based on 467 million days of recreation and national multipliers. Based on more recent and more reliable recreation visit and spending data from the National Visitor Use Moni-toring study (English et al. 2003; Stynes, White, and Leefers 2003), and applying local rather than na-tional multipliers, value added for NF recreation visi-tors in 2001 is closer to $5 billion.30 This is consistent with the $7 billion estimate for the NPS, taking into account similar spending patterns and lower NF use estimates. Economic impact estimates nationwide and for indi-vidual U.S. Army Corps of Engineers (2004) projects are posted at their Value to the Nation Web site. The 1999 national estimate of $3.4 billion in total income is based on 386 million CE visitors spending $6 bil-lion in the local area. The Corps of Engineers treats most visitors not camping at CE sites as day visitors and may not therefore fully account for spending of visitors who stay overnight off- project. These different estimates illustrate the pitfalls of making comparisons between different economic impact estimates without careful examination of the questions being addressed, assumptions, input data, and approaches.
Conclusions
Economic analysis is an important part of public land management. Agencies must understand public values and preferences, balance benefits and costs, and weigh the distributional consequences of resource allocation and management decisions. The fields of resource and regional economics offer a wide array of tools to help inform these decisions and evaluate programs. Economic analysis is, of course, only one input that must be balanced with environmental, social, political, and other dimensions.
Economists are relatively scarce within public land management agencies. Valuation and impact studies
are therefore conducted primarily by outside con-sultants. As we have seen, economic analyses rest on a variety of technical assumptions and method choices that are often difficult for non- economists to fully understand. These characteristics pose sig-nificant challenges for communicating economic information within public agencies and to various publics. Economists are needed within public land management agencies to help guide economic re-search and analysis, translate economic studies into managerially useful information, and communicate the economic significance of public land manage-ment programs to various constituencies.
The vast majority of recreation valuation and impact studies are case- specific, with methods tailored to the unique situation. This has made it difficult to generalize from one study to another, as results are frequently sensitive to the methods chosen and the characteristics of a given problem or setting. Yet time and costs limit the number of instances where detailed valuation or impact studies may be justified. The trend in both recreation valuation and impact assessment has been toward ways to generalize from what has been learned in previous studies, to reduce data collection costs and, where possible, to simplify methods to facilitate wider application.
When time and costs rule out extensive primary data collection, agencies must rely on judgment or turn to secondary sources. Averages, like the spending figures and generic multipliers embedded in the MGM2 model or the recommended recreation unit day values, provide starting points and standards when primary data are lacking. Better methods are needed for predicting variations from these averages across distinct sites and situations over time. Econometric and benefit transfer methods attempt to formally model these variations, while interim unit day value procedures and the MGM2 model rely on more subjective and ad- hoc adjustments. Until we have more consistent data and a greater understanding of these variations, sound judgment and experience may perform as well as statistical models.
22 NPS SOCIAL SCIENCE RESEARCH REVIEW WINTER 2005
The weakest link in both recreation valuation and im-pact assessment is often the lack of reliable informa-tion about visitors. Visitor counts are frequently un-available or unreliable, and many parks lack basic in-formation about visitor behavior (Manning and Wang 1998). Forecasting changes in use over time or in re-sponse to management actions is particularly difficult in the absence of good longitudinal data. Surveys of visitors to public lands have tended to emphasize on-site behaviors, usually gathering limited information about activities in gateway communities or conditions at visitor origins. These external factors strongly influ-ence visitor demand for recreation on public lands, as well as the associated values and spending. Spending opportunities, potential substitutes, and complemen-tary services are largely provided off of public lands. Cooperation between public land management agen-cies and community development and regional tour-ism marketing organizations can improve information about visitors, better serve the visitor, and increase benefits all around (Machlis and Field 2000).
Local residents and tourists to the region represent two fairly distinct markets with different patterns of use and distinct contributions to values and economic impacts associated with public lands. A local perspective on public land management emphasizes providing value to local residents in the form of recreation uses and other environmental amenities by attracting businesses, residents, and tourists to the region while also supporting local economic development. Economic impacts represent transfers of income from one region, industry, or group to another, rather than a net gain to the nation. Regional impacts have therefore been viewed as somewhat less significant than welfare measures, at least from a national perspective. On the other hand, economic analyses based on efficiency and overall contributions to welfare are relatively blind to distributional issues, which often dominate national policy debates.
Given the importance of economic considerations in public policy at the national, state, and local levels, measures of economic significance will continue to play prominent roles in public land management decisions. It is particularly important for public land
managers to measure both the economic value provided to recreation users and the benefits to local economies. The relative importance of these two measures of economic significance in a given situation will depend on the decision under consideration, management objectives, and the priorities assigned to different stake- holder groups.
Additional Resources
Valuation. There are a number of guidebooks that explain valuation methods for managers. King and Mazzotta’s (http://www.ecosystemvaluation.org/) on-line ecosystem valuation Web site, Lipton and Wellman (1995), Sorg and Loomis (1984), and U.S. Water Resources Council (1980, 1983) are at an elementary level. U.S. EPA (2000) is somewhat more advanced. DARP (1997) covers applications to damage assessments. Loomis and Walsh (1997) provide a comprehensive treatment of recreation economics. Resource and environmental economics texts provide broader coverage of theory and advanced methods, e.g., Freeman (1993), Tietenberg (2000). Ward and Loomis (1986) review travel cost models, while Carson and Mitchell (1989) review contingent valuation approaches. Rosenberger and Loomis (2001) include an extensive bibliography of recreation valuation studies.
Economic Impacts. Introductory treatments of economic impact methods include Sullivan et al. (1993), Chapter 14 of Loomis and Walsh (1997), Chapter 9 of U.S. EPA (2000), Frechtling (1994), and Bull (1995). The MGM2 models, manuals, and various reports are available at the MGM2 Web site (http://www.prr.msu.edu/mgm2). Cortright and Reamer (1998) is an excellent guide to regional economic data from government sources. The Bureau of Economic Analysis Web site (www.bea.gov) has documentation about its RIMS II model, regional economic data, and national accounts (NIPA), including tourism satellite accounts. Information about the IMPLAN system can be found at the MIG, Inc. Web site (http://www.implan.com). The Web Book of Regional Science (http://www.rri.wvu.edu/regscweb.htm) is an out- standing set of on- line texts for those seeking a systematic treatment of I- O models (Schaffer), CGE models (Vargas), and other regional economic topics (Hoover).
ECONOMIC SIGNIFICANCE OF RECREATION 23
Notes 1 Other areas of economic analysis I will not address here include the internal financial analysis of costs and revenues of public land management agencies and assessment of fiscal impacts on state and local governments (Burchell and Listokin 1978). 2 The original idea for the approach is generally attributed to Harold Hotelling, who sketched the idea in a letter to the National Park Service Director in 1947 (Krutilla and Fisher, 1975). 3 If the demand curve was estimated considering the substitute, it would be truncated at the $3 price line and yield the correct surplus. The issue comes down to whether substitutes have been properly specified when estimating the demand curve. 4 Unit day values are usually interpreted as representing average consumer surpluses. The adjustments over time, however, have not taken into account increasing fees at many recreation areas. If simulated market prices are used as unit day values, the method yields market values. 5 These studies measure values for participation in particular activities in the park, rather than willingness to pay to visit the park. 6 See Bishop (1982) for a more complete theoretical treatment of option value, including the distinction between option value and option price. 7 The basic assumptions of input- output models are that sectors have homogeneous, fixed, and linear production functions, that prices are constant, and there are no supply constraints. 8 Regional economists increasingly recommend computable general equilibrium models (CGE) and social accounting matrices (SAM). CGE models relax the I- O model assumptions of static prices and no supply constraints to estimate impacts within a general equilibrium framework. The significant increases in model complexity and data requirements do not make CGE approaches very practical for recreation impact analysis at this time. Social accounting matrices (SAM) trace institutional transfers between businesses, households, and government units to better assess distributional consequences. These SAM models can be estimated within the IMPLAN system. 9 One must be particularly careful when using job (or income) multipliers, as these may be expressed as total jobs relative to direct jobs or as total jobs relative to direct sales. The denominator in these ratios dictates what the multiplier should be multiplied by. 10 For example, IMPLAN’s Type SAM multipliers do not re- circulate retirement benefits when computing induced effects, as these are not immediately re- spent in the local area. The handling of government revenues and taxes also can vary across models. These details are often not reported in applied studies. 11 For example, the National Survey of Hunting, Fishing and Wildlife- Associated Recreation does not go beyond spending measures. Tourism Satellite Accounting (TSA) methods (Frechtling 2000, Okubo and Planting 1998, WTO 1999) generally stop at measuring the direct effects of tourism. 12 Federal agencies have historically measured use in recreation visitor day (RVD) units. One visitor day could be one person for 12 hours, two for six hours, or 12 for an hour each. As these examples clearly have very different implications for spending, the RVD is not a very useful unit for economic analysis. 13 This is a good reason why economic analyses should consider both the value of the recreation experience to the visitor, as well as economic impacts of visitor spending. Economic impact analysis does not measure the values that most park managers and visitors attribute to recreation on public lands. 14 Appendices C and D of the MGM2 manual (Stynes et al. 2000) discuss methods for adapting spending averages to individual applications. 15 Segmenting visitors into subgroups with similar spending patterns can reduce variances.
24 NPS SOCIAL SCIENCE RESEARCH REVIEW WINTER 2005
16 In our analysis of national forest visitor spending data, trip segments like those in Table 3 explained 18 percent of the variation in individual trip spending, while the primary recreation activity and individual forest each explained less than three percent (Stynes, White, and Leefers 2003). 17 The source of a multiplier of 2.0 is not clear, but likely comes from statewide multipliers that are more widely avail-able in published reports. Multipliers have been declining slowly over time, so one should always check the date of the model/multiplier. Recreation impact studies based on IMPLAN models prior to version 2.0 have inflated multipliers due to a flaw in how IMPLAN computed induced effects. The algorithm more than doubles the estimate of induced effects for tourism spending. 18 The MGM2 is able to create “generic” multipliers for tourism- related sectors, as these sectors are labor- intensive and purchase mostly other services that tend to exist in local regions in direct proportion to population size. See Chang (2000) for the derivation of generic multipliers and comparisons of multipliers for different regions. 19 This national multiplier is from an IMPLAN model using 2000 data and a typical visitor spending profile. A national model allows spending to circulate across the entire U.S. economy. 20 Sector- specific multipliers in Table 5 are to be used for regions with populations of 500,000 to one million. The MGM2 has other “generic” multipliers for rural areas and larger metropolitan regions. Custom multipliers for individual regions may also be imported into the MGM2 model from IMPLAN models. 21 For rural areas, the MGM2 sales multipliers for hotels are 1.25 (Type I) and 1.37 (Type II), and the direct job- to- sales ratio is 26 jobs per million dollars in sales. See the MGM2 manual or model for complete sets of multipliers for rural, small metro, and larger metro regions. 22 In an engineering approach, one estimates the costs of producing a “trip” by itemizing typical costs for each input, e.g., a typical overnight visitor party of three people staying two nights will incur $70 per night for a motel room, $20 per person per day for meals, $10 for a half- tank of gas, and $50 for souvenirs = $320 per party per trip, or $160 per night. 23 It should be noted that statistical confidence intervals could be very misleading if errors due to measurement, non-response bias, and other sources outweigh the sampling errors. 24 Examples of more specific evaluation studies include Johnson and Sullvan’s (1993) analysis of civil war battlefield preservation and Neher and Duffield’s (2000) assessment of the impacts of the 1997 floods in Yosemite National park. 25 The MGM2Operate spreadsheet is a simple model for estimating impacts of NPS operations and construction. The Forest Service’s FEAST model includes very detailed operating and construction spending categories linked to Forest Service budget data. 26 Many applications of the original MGM model used state level multipliers from RIMS II and per diem spending averages for lodging and meals from Runzheimer, neither of which likely represented NPS visitors or local settings very well. 27 The MGM2 model and reports are available at the MGM2 Web site: http://www.prr.msu.edu. Versions of the model have also been developed for the U.S. Army Corps of Engineers (REAS), USDA Forest Service (SNACK), and tourism clients (MITEIM). 28 NPS visits were allocated to segments as follows: 20 percent local, 57 percent day trips, 23 percent overnight trips, 18 percent in motels, and five percent camping. Visitors staying with friends and relatives or in owned seasonal homes were treated as day trips. 29 Only one day of spending is included for extended stays in an area to visit relatives, stay at a seasonal home, or visit many attractions. 30 Reduction of national forest visits from 467 million to 215 million cuts the value- added estimate to $14 billion, and use of local rather than national multipliers reduces it further to $8 billion. Differences in spending averages and what spending is included puts the final estimate at about $5 billion.
ECONOMIC SIGNIFICANCE OF RECREATION 25
REFERENCES
Adamowicz, W., J. Louviere, and M. Williams. 1994. Combining revealed and stated preference methods for valuing environmental amenities. Journal of Environmental Economics and Management 26:271- 292.
Alward, G.S. and E.M. Lofting. 1985. Opportunities for analyzing the economic impacts of recreation and tourism impacts using IMPLAN. In Proceedings of the Annual Meetings of the Regional Science Association. Philadelphia, PA.
Alward, G. S., R. Arnold, M.J. Niccolucci, and S.A. Winter. 2003. Evaluating the economic significance of the USDA Forest Service strategic plan (2000 Revision). USDA Forest Service Inventory and Monitoring Report No. 6. Fort Collins, CO.
Archer, B. H. 1982. The value of multipliers and their policy implications. Tourism Management December:236- 241.
Archer, B. H. 1984. Economic impact: Misleading multiplier. Annals of Tourism Research 11(3): 517- 518.
Bergstrom, J.C. and H.K. Cordell. 1991. An analysis of the demand for and value of outdoor recreation in the United States. Journal of Leisure Research 23(1): 67- 86.
Bishop, R.C. 1982. Option value: An exposition and extension. Land Economics 58(1): 1- 15.
Bockstael, N. and K. McConnell. 1981. Theory and estimation of the household production function for wildlife recreation. Journal of Environmental Economics and Management 8(3): 199- 214.
Bowker, J.M., D.B.K. English, and H.K. Cordell. 1999. Projections of outdoor recreation participation to 2050. In Outdoor recreation
in American life; A national assessment of supply and demand, ed. H.K. Cordell. Champaign, IL: Sagamore.
Brown, T.L. and D.L. Hustin. 1980. Evaluation of the 1976 ORRRC projections. In 1980 national outdoor recreation trends symposium, Vol. 3. Extension/Research Paper RPA 1980- 5. Clemson, SC: Clemson University.
Brucker, S. M., S.W. Hastings, and W.R. Latham III.1987. Regional input- output analysis: A comparison of five ready- made model systems. Review of Regional Studies 17:2.
Bull, A. 1995. The economics of travel and tourism.2nd ed. Melbourne, Australia: Longman.
Burchell, R.W. and D. Listokin. 1978. The fiscal impact handbook. New Brunswick, NJ: Center for Urban Policy Research.
Burt, O. and D. Brewer. 1971. Evaluation of net social benefits from outdoor recreation. Economet-rica 39:813- 27.
Champ, P.A., K.J. Boyle, and T.L. Brown. 2003. A primer on non- market valuation. Kluwer Academic.
Chang, W. 2001. Variations in multipliers and related economic ratios for recreation and tourism impact analysis. PhD diss., Michigan State University.
Cicchetti, C.J., A. Fisher, and V.K. Smith. 1976. An eco-nomic evaluation of a generalized consumer surplus measure: The Mineral King contro-versy. Econometrica 44:1259- 76.
Cicchetti, C.J. 1973. Forecasting recreation in the United States. Lexington, MA: D.C. Heath.
Clawson, M. and J.L. Knetsch. 1966. Economics of out-door recreation. Baltimore, MD: Johns Hopkins Press.
Cordell, H.K. 1999. Outdoor recreation in American life; A national assessment of supply and demand. Champaign, IL: Sagamore.
Cordell, H.K., J.C. Bergstrom, and A.E. Watson. 1992. Economic growth and interdependence effects of state park visitation in local and state econ- omies. Journal of Leisure Research 24:253- 268.
26 NPS SOCIAL SCIENCE RESEARCH REVIEW WINTER 2005
Cortright, J. and A. Reamer. 1998. Socioeconomic data for understanding your regional economy; A user’s guide. U.S. Dept of Commerce, Eco-nomic Development Administration. http://www.econdata.net/content_usersguide.html
Crandall, L. 1994. The social impact of tourism on developing regions and its measurement. In Travel, tourism and hospitality research, ed. J.R. Brent Ritchie and Charles R. Goeldner. 2nd ed. New York: John Wiley and Sons.
Crompton, J.L., S. Lee, and T.J. Shuster. 2001. A guide for undertaking economic impact studies: The Spring Fest example. Journal of Travel Research 40:79- 87.
Damage Assessment and Restoration Program (DARP). 1997. Natural resource damage as-sessment guidance document: scaling com-pensatory restoration actions (Oil pollution Act of 1990). Silver Springs, MD: National Oceanic and Atmospheric Administration. http://www.darp.noaa.gov/pdf/scaling.pdf
Deller, S. 1995. Economic impact of retirement mi-gration. Economic Development Quarterly 9:25- 38.
Duffield, J., T. Power, C. Neher, and B. Morgan. 1997. Review of the National Park Service Money Generation Model. Report for the National Park Service.
English, D.B.K. and J. Bergstrom.1994. The concep-tual links between recreation site develop-ment and regional economic impacts. Jour-nal of Regional Science 34(4): 599- 611.
English, D.B.K., S.M. Kocis, S.J. Zarnoch, and J.R. Arnold. 2002. Forest Service national visitor use monitoring process: Research method documentation. USDA Forest Service Gen. Tech. Rep. SRS- 57.
Ewing, G.O. 1980. Progress and problems in the de-velopment of recreation trip generation and
distribution models. Leisure Sciences 3(1): 1-24.
Fedkiw, J. 1987. Coming back to market value and valuation for the Great Lakes fisheries. Trans Am Fisheries Soc 116(3): 346- 351.
Fisher, A.C. 1981 Resource and environmental eco-nomics. Cambridge: Cambridge University Press.
Frechtling, D.C. 1994. Assessing the economic impacts of travel and tourism – Introduction to travel economic impact estimation. In Travel, tour-ism and hospitality research, ed. J.R.B. Ritchie and C.R.Goeldner. 2nd ed. New York: John Wiley and Sons.
Frechtling, D.C. 1994. Assessing the economic impacts of travel and tourism – Measuring economic benefits. In Travel, tourism and hospitality research, ed. J.R.B. Ritchie and C.R. Goeldner. 2nd ed. New York: John Wiley and Sons.
Frechtling, D.C. 2000. The tourism satellite account: Foundations, progress and issues. Tourism Management 20:163- 170.
Freeman, A.M. 1979. Hedonic prices, property values and measuring environmental benefits: A survey of the issues. Scan. J Econ 81:154- 173.
Freeman, A.M. 1985. Methods for assessing the bene-fits of environmental programs. In Vol. 1. of Handbook of natural resource and energy economics, ed. A.V. Kneese and J.L. Sweeney. Oxford: Elsevier.
Freeman, A. M. III. 1993. The measurement of environmental and resource values: Theory and methods . Washington, DC: Resources for the Future.
Gericke, K.L. and J. Sullivan. 1996. Assessing regional economic contributions from National Park System units. Park Science (Spring): 24- 26.
Getz, D.1994. Event tourism: Evaluating the impacts. In Travel, tourism and hospitality research, ed. J.R.B. Ritchie and C.R. Goeldner.2nd ed. New York: John Wiley and Sons.
ECONOMIC SIGNIFICANCE OF RECREATION 27
Hanemann, W.M. 1994. Valuing the environment through contingent valuation. Journal of Eco-nomic Perspectives 8(4): 19- 43.
Hof, J.G. and H.F. Kaiser. 1983. Long- term outdoor recreation participation projections for public land management agencies. Journal of Leisure Research 15(1): 1- 14.
Hoover, E.M. and F. Giarratani. 1999. An introduc-tion to regional economics. In The web book of regional science (http://www.rri.wvu.edu/regscweb.htm), ed. Scott Loveridge. Morgan-town: Regional Research Institute, West Vir-ginia University.
Jackson, R.,ed. 1999. The web book of regional science. Morgantown: Regional Research Institute, West Virginia University. (http://www.rri.wvu.edu/regscweb.htm)
Jackson, R.S., D.J. Stynes, D.B. Propst, and E. Siverts. 1992. Economic impact analysis as a tool in recreation program evaluation. Instructional Report R- 92- 1. Vicksburg, MS: U.S. Army Engineer Waterways Experiment Station.
Jackson, R.S., D.J. Stynes, D.B. Propst. 1994. An assessment of the national economic effects of the U.S. Army Corps of Engineers recreation program. Misc. Paper R- 94- 2. Vicksburg, MS: Environmental Lab, Waterways Experiment Station, Department of the Army, Corp of Engineers.
Jackson, R.S., D.J. Stynes, D.B. Propst, and B.D. Carl-son. 1996. A summary of the national and state economic effects of the 1994 U.S. Army Corps of Engineers recreation program. Tech-nical Report R- 96- 1. Vicksburg, MS: U.S. Army Engineer Waterways Experiment Sta-tion.
Johnson, P. and T. Barry,eds. 1992. Choice and
demand in tourism. London: Mansell. Johnson, D.G. and J. Sullivan. 1993. Economic im-
pacts of Civil War battlefield preservation: An ex- ante evaluation. Journal of Travel Re-search (Summer): 21- 29.
Kass, D.I. and S. Okubu. 2000. U.S. travel and tour-ism satellite accounts for 1996 and 1997. Survey of Current Business 80 (July 2000): 8-24.
Kaval, P. and J.B. Loomis. 2003. Updated outdoor recreation use values with emphasis on national park recreation. Final report to National Park Service. Fort Collins: Dept of Agriculture and Resource Economics, Colorado State University.
King, D.M., and M. Mazzotta. 2004. Ecosystem Valuation website. http://www.ecosystemvaluation.org/
Knetsch, J.L. 1977. Displaced facilities and benefit calculations. Land Economics 53:123- 129.
Kopp, R.J. and V.K. Smith. 1993. Valuing natural assets: The economics of natural resource damage assessment. Washington, DC: Resources for the Future. http://www.srs.fs.usda.gov/trends/blm96.pdf
Kriesel, W., H.K. Cordell, J.C. Bergstrom, and M. Brown. 1996. Local employment and income from outdoor recreation at selected Bureau of Land Management sites. Athens,GA: USDA Forest Service, Southern Research Station.
Krutilla, J.V. and A.C. Fisher. 1975. The economics of natural environments. Washington DC:
Resources for the Future.
Leistritz, F.L. and S.H. Murdock. 1981. The socioeconomic impact of resource development: Methods for assessment. Boulder, CO: Westview.
Leones, J. and G.B. Frisvold. 2000. Park planning beyond park boundaries: A Grand Canyon case study. In National parks and rural development: Practice and policy in the United States, ed. G.E. Machlis, and D.R. Field. Washington, DC: Island Press.
Leontief,W. 1986. Input- output economics. New York: Oxford University Press.
ECONOMIC SIGNIFICANCE OF RECREATION 29
Propst, D. B., comp. 1985. Assessing the economic impacts of recreation and tourism: Conference and workshop. Asheville, NC: USDA, Forest Service, Southeastern Forest Experiment Station.
Propst, D.B., D.J. Stynes, J.H. Lee, and R.S. Jackson.
1992. Development of spending profiles for recreation visitors to Corps of Engineers projects. Technical Report R- 92- 4. Executive summary Technical Report R- 92- 1. Vicksburg, MS: U.S. Army Engineer, Waterways Experiment Station.
Propst, D.B., D.J. Stynes, W. Chang, and R.S. Jackson.
1998. Estimating the local economic impacts of recreation at Corps of Engineers Projects – 1996. Technical Report R- 98- 1. Vicksburg, MS: U.S. Army Engineer, Waterways Experiment Station.
Propst, D.B. 2001. Use of IMPLAN to assess economic impacts of recreation and tourism: Chronology and trends. In Trends 2000: Shaping the future. East Lansing: Department of Park, Recreation and Tourism Resources, Michigan State University.
Randall, A., and J. Stoll.1983. Existence value in a total
valuation framework. In Managing air quality and scenic resources at national parks and wilderness areas, ed. R. Rowe and L. Chest-nut. Boulder, CO: Westview Press.
Richardson, H.W. 1979. Regional economics. Urbana: University of Illinois Press.
Richardson, H.W. 1972. Input- output and regional
economics. New York: John Wiley.
Rosenberger, R.S. and J.B. Loomis. 2001. Benefit transfer of outdoor recreation use values: A technical document supporting the Forest Service strategic plan (2000 revision). Gen. Tech. Report RMRS- GTR- 72. Fort Collins, CO: U.S. Dept. of Agriculture, Forest Service, Rocky Mt. Research Station.
Rutherford, M. B., J.L. Knetsch, and T.C. Brown. 2000. Assessing environmental losses: Judgments of importance and damage schedules. Harvard Environmental Law Review 22:51- 101.
Schaffer, W. 1999. Regional impact models. Morgan-town: Regional Research Institute, West Vir-ginia University.
Sheldon, P.J. 1990. A review of tourism expenditure research. In Progress in tourism, recreation and hospitality management, ed. C.P. Cooper. New York: Belhaven Press.
Sheldon, P.J. and T. Var. 1985. Tourism forecasting: A review of empirical research. Journal of Forecasting 4:183- 195.
Sinden, J.A. and A.C. Worrell. 1979. Unpriced values; decisions without market prices. New York: John Wiley and Sons.
Smith, V.K. 1975. The estimation and use of models of the demand for outdoor recreation. In Assessing demand for outdoor recreation, app B.
Smith, V.K. 1992. On separating defensible benefit transfers from “smoke and mirrors.” Water Resources Research 28(3): 685- 694.
Sorg, C.F., and J.B. Loomis. 1984. Empirical estimates
of amenity forest values: A comparative re-view. General Technical Report RM- 107, March. Fort Collins, CO: USDA, Forest Ser-vice, Rocky Mountain Forest and Range Ex-periment Station.
Stynes, D.J. 1983. Time series and structural
recreation forecasting models. In Recreation planning and management, ed. S. Lieber and D. Fesenmaier. State College, PA: Venture Press.
Stynes, D.J. and G.L. Peterson. 1984. A review of logit
models with implications for modeling rec-reation choices. Journal of Leisure Research 16(4): 295- 310.
30 NPS SOCIAL SCIENCE RESEARCH REVIEW WINTER 2005
Stynes, D.J. and D.B. Propst. 1992. A system for estimating local economic impacts of recreation and tourism. In Measuring tourism impacts at the community level, ed. S. Reiling. Maine Agricultural Experiment Sta. Misc. Report #374.
Stynes, D.J., D.B. Propst, W.H. Chang and Y. Sun. 2000. Estimating regional economic impacts of park visitor spending: money generation model version 2 (MGM2). East Lansing: De-partment of Park, Recreation and Tourism Resources, Michigan State University. http://www.prr.msu.edu/mgm2/.
Stynes, D.J. 2000. Economic impacts of Women's Rights NHP on Seneca County. East Lans ing: Department of Park, Recreation and Tourism Resources, Michigan State University.
Stynes, D.J. 2001. Estimating economic impacts of tourist spending on local regions; A comparison of satellite and survey/I- O Approaches. In Proceedings of the Censtates Travel and Tourism Research Association.
Stynes, D.J. 2001. Guidelines for measuring visitor spending. East Lansing: Department of Park, Recreation and Tourism Resources, Michigan State University.
Stynes, Daniel J. 2002. Economic impacts of Great Smoky Mt. National Park visitors on the local region. East Lansing: Department of Park, Recreation and Tourism Resources. Michigan State University. http://www.prr.msu.edu/mgm2/GreatSmokyMts.pdf
Stynes, D.J., E.M. White and L.A. Leefers. 2003. Spending profiles of national forest visitors: Years 2000 and 2001. Report for USDA Forest Service. East Lansing: Department of Park, Recreation and Tourism Resources, Michi-gan State University. http://www.prr.msu.edu/mgm2/NPSSystem2001.pdf
Stynes, D.J. and Y. Sun. 2003. Economic impacts of national park visitor spending on gateway communities; Systemwide estimates for 2001. East Lansing: Department of Park, Recreation and Tourism Resources, Michigan State University.
Sugden, R. and A. Williams. 1978. The principles of practical cost- benefit analysis. Oxford: Oxford University Press.
Sullivan, J., K.L. Gericke, M.P. Hite, and Y. Grow.1993. A handbook for assessing the eco-nomic contributions of National Park Service units. Blacksburg: College of Forestry and Wildlife Resources, Virginia Polytechnic In-stitute and State University.
Swanson, E.W. 1969. Travel and the national parks: An economic study. Washington, DC: National Park Service.
Swanson, C. S. and J.B. Loomis. 1996. Role of non-market economic values in benefit- cost analysis of public forest management options. Gen. Tech. Rep. PNW- GTR- 361. Portland, OR: USDA Forest Service, Pacific NW Re-search Station.
Switzer, R.R. 1996. Why assess the economic impacts of national parks? Park Science (Spring): 26-27.
Taylor, J.G, N.Burkardt, L.Caughlin and B.L. Lamb. 2000. Thinking outside the lines: Parks and the quality of life in area communities. Park Science 20(1): 14- 17.
Taylor, C., S. Winter, G. Alward and E. Siverts. 1993 Micro- IMPLAN users guide. USDA Forest Service, Land Management Planning Group.
Tietenberg, T. 2000. Environmental and natural
resource economics. Reading, MA: Addison-Wesley.
Travel Industry Assoc. of America. 2002. Expenditure patterns of travelers in the U.S. Washington, DC.
32 NPS SOCIAL SCIENCE RESEARCH REVIEW WINTER 2005
Wear, D.N. and J.G. Greis, eds. 2002. Southern forest resource assessment. Gen. Tech. Rep. SRS- 53. Asheville, NC: USDA, Forest Service, South-ern Research Station.
Willig, R.D. 1976. Consumer surplus without apology.
American Economic Review 66(4): 589- 597. World Tourism Organization. 1999. Tourism satellite
account (TSA): The conceptual framework. Madrid, Spain: World Tourism Organization.
Glossary
Consumer surplus. Amount that consumers are willing to pay for a good or service over and above their actual costs. It is the generally accepted measure of contribution to social welfare as it captures the net benefit to each consumer from the consumption of a good or service.
Demand. Quantity of a good that will be purchased
at different prices. Direct effects. In terms of visitor spending, the
changes in economic activity in firms selling directly to visitors, i.e., lodging, restaurant, amusement, transportation, and retail trade sectors.
Final demand. Sales to final consumers (households
or government), which are distinguished from intermediate sales which take place between industries. Visitor spending and government purchases are examples of final demand.
IMPLAN. A microcomputer- based input- output
modeling system originally developed by the USDA Forest Service and now managed by MIG, Inc.
Indirect effects. Changes in sales, income, or em-ployment within a region in backward- linked industries supplying goods and services to directly affected businesses. The increased sales in linen supply firms resulting from more motel sales are an indirect effect of visitor spending.
Induced effects. Increased sales within the region
from household spending of the income earned through direct or indirect effects. Em-ployees in tourism and supporting industries spend their income on housing, utilities, gro-ceries, and other consumer goods and services, generating sales, income, and employment throughout the region’s economy.
tation of the flows of economic activity be-tween sectors within a region. The model cap-tures what each business or sector must pur-chase from every other sector in order to pro-duce a dollar’s worth of goods or services. Using such a model, flows of economic activity associated with any change in spending may be traced either forward (spending generating income which induces further spending) or backward (visitors’ purchases of meals leads restaurants to purchase additional in-puts, such as groceries and utilities). Multi-pliers may be derived from an input- output model.
Market value. Price of a good or service times its
quantity. Multiplier. Number used to calculate the size of
secondary effects in a region, generally as a ratio of the total change in economic activity in the region relative to the direct change. Multipliers express the degree of interde-pendence between sectors in a region’s econ-omy and are usually derived from I- O models. A sector- specific multiplier gives the total change throughout the economy asso-ciated with a unit change in sales in a given sector.
ECONOMIC SIGNIFICANCE OF RECREATION 33
Non- use or passive- use value. Values associated with parks or natural resources that do not entail direct use. The most common non- use values for parks are option value, or willingness to pay for the option to visit a park in the future; bequest value, or willingness to pay to pass on these opportunities to future generations; and existence value, or willingness to pay to know that a park or resource exists, independent of any intent to visit.
Secondary effects. Changes in economic activity
from subsequent rounds of spending stimu-lated by the direct sales. There are two types of secondary effects: indirect and induced.
Sector. Grouping of firms that produce similar prod-
ucts or services. Most economic reporting and models in the U.S. are based on the Standard Industrial Classification system (SIC) or the newer North American Industrial Classification System (NAICS).
Supply. The quantity of a good that will be produced
or offered for sale at different prices. Total effects. The sum of direct, indirect, and in-
duced effects. Use value. Value associated with direct use or
consumption of a good or service, e.g., the value to the consumer of a day of recreation activity or a park visit.
Value added. Sum of personal income (wages and
salaries), profits and rents, and indirect business taxes. Value added is the most commonly used measure of the contribution of a region or industry to gross national product, as it avoids double counting of intermediate sales and captures only the “value added” by the region or industry to final products.
About the Author Daniel J. Stynes is professor emeritus from the Department of Park, Recreation and Tourism Resources at Michigan State University. He holds B.A. and M.A. degrees in mathematics from the State University of New York at Buffalo and the University of Illinois. His Ph.D. is in Resource Development from Michigan State University. He is the principal developer of MGM2 and related spreadsheet models for estimating economic impacts of recreation and tourism. Over the past 15 years, Dr. Stynes has helped the National Park Service, USDA Forest Service, U.S. Army Corps of Engineers, and a variety of other recreation and tourism organizations to estimate visitor spending and economic impacts. Earlier in his career he conducted research on recreation and travel demand, valuation, forecasting, carrying capacity, and market segmentation.
34 NPS SOCIAL SCIENCE RESEARCH REVIEW WINTER 2005
Notes
ECONOMIC SIGNIFICANCE OF RECREATION 35
Notes
36 NPS SOCIAL SCIENCE RESEARCH REVIEW WINTER 2005
About the Series
The purpose of the Social Science Research Review is to provide a basis for scientific understanding of specific issues critical to the management of the National Park System. Each paper pre-sents a conceptual framework for understanding the issue, re-views methodologies used in relevant studies, and presents key findings from published scientific literature, technical reports, and other documents. Each paper is peer- reviewed. The papers are not intended to provide specific policy guidelines or man-agement recommendations.
The Social Science Research Review series is part of the Na-tional Park Service Social Science Program under the direc-tion of Dr. Jim Gramann, Visiting Chief Social Scientist, and Dr. Michael Soukup, Associate Director for Natural Resource Stewardship and Science.
About the Program
The role and functions of the NPS Social Science Program are to provide leadership and direction to the social science activities of the NPS, coordinate social science activities with other programs of the NPS, act as liaison with the USGS Biological Resources Division and other federal agencies on social science activities, provide technical support to parks, park clusters, support offices and regional offices, and support a program of applied social science research related to national research needs of the NPS.
For more information, contact: Dr. Jim Gramann
Visiting Chief Social Scientist National Park Service 1849 C Street, NW (2300) Washington, DC 20240 Telephone: (202) 513- 7189
Email: [email protected] Web site- http://www.nature.nps.gov/socialscience