Social Security and Private Saving: New Time-Series Evidence Dean R. Leimer; Selig D. Lesnoy The Journal of Political Economy, Vol. 90, No. 3. (Jun., 1982), pp. 606-629. Stable URL: http://links.jstor.org/sici?sici=0022-3808%28198206%2990%3A3%3C606%3ASSAPSN%3E2.0.CO%3B2-7 The Journal of Political Economy is currently published by The University of Chicago Press. Your use of the JSTOR archive indicates your acceptance of JSTOR's Terms and Conditions of Use, available at http://www.jstor.org/about/terms.html. JSTOR's Terms and Conditions of Use provides, in part, that unless you have obtained prior permission, you may not download an entire issue of a journal or multiple copies of articles, and you may use content in the JSTOR archive only for your personal, non-commercial use. Please contact the publisher regarding any further use of this work. Publisher contact information may be obtained at http://www.jstor.org/journals/ucpress.html. Each copy of any part of a JSTOR transmission must contain the same copyright notice that appears on the screen or printed page of such transmission. The JSTOR Archive is a trusted digital repository providing for long-term preservation and access to leading academic journals and scholarly literature from around the world. The Archive is supported by libraries, scholarly societies, publishers, and foundations. It is an initiative of JSTOR, a not-for-profit organization with a mission to help the scholarly community take advantage of advances in technology. For more information regarding JSTOR, please contact [email protected]. http://www.jstor.org Mon Dec 3 14:31:14 2007
Transcript
Social Security and Private Saving New Time-Series Evidence
Dean R Leimer Selig D Lesnoy
The Journal of Political Economy Vol 90 No 3 (Jun 1982) pp 606-629
The Journal of Political Economy is currently published by The University of Chicago Press
Your use of the JSTOR archive indicates your acceptance of JSTORs Terms and Conditions of Use available athttpwwwjstororgabouttermshtml JSTORs Terms and Conditions of Use provides in part that unless you have obtainedprior permission you may not download an entire issue of a journal or multiple copies of articles and you may use content inthe JSTOR archive only for your personal non-commercial use
Please contact the publisher regarding any further use of this work Publisher contact information may be obtained athttpwwwjstororgjournalsucpresshtml
Each copy of any part of a JSTOR transmission must contain the same copyright notice that appears on the screen or printedpage of such transmission
The JSTOR Archive is a trusted digital repository providing for long-term preservation and access to leading academicjournals and scholarly literature from around the world The Archive is supported by libraries scholarly societies publishersand foundations It is an initiative of JSTOR a not-for-profit organization with a mission to help the scholarly community takeadvantage of advances in technology For more information regarding JSTOR please contact supportjstororg
httpwwwjstororgMon Dec 3 143114 2007
Confirmations and Contradictions
Social Security and Private Saving New Time-Series Evidence Dean R Leimer and Selig D Lesnoy
Social Security Administration
Introduction
In an important article in the Journal of Political Economy Martin Feldstein (1974)estimated that the introduction of the social security system had reduced personal saving by 50 percent with serious con- sequences for capital formation and output His conclusion was based on a consumer-expenditure function estimated with US time-series data and incorporating a social security wealth variable of his con- struction
This paper presents new evidence that casts considerable doubt on Feldsteins conclusion First the social security wealth variable used by Feldstein was seriously flawed as a result of a computer-programming error Simply correcting this error substantially changes the estimated effect of social security on saving Second the statistical evidence depends upon assumptions which are embedded in the construction of the social security wealth variable-assumptions that are not de- monstrably preferable and are in some cases inferior to alternative assumptions These assumptions relate first to how individuals form their expectations about the social security benefits they expect to receive and the social security taxes they expect to pay and second to estimates of the number of workers dependent wives and surviving
We thank an anonymous referee for helpful comments and Suzanne Worth and Anne Richard for their assistance The Social Security Administrations Office of the Actuary was helpful in providing unpublished data The views expressed are ours and do not necessarily reflect the position of the Office of Research and Statistics or the Social Security Administration
uoutrml ofPoiificai Ecorionty 1982 vol 90 no 31 1982 by The University of Chicago All rights resewed 0022-380818219003-0009$0150
vidovs rvho ill receive benefits Adopting reasonable alternative issurnptions leads to generall) veaker estimates of the I-elationship lgt r t~ r ensocial security and saing Finall) the estimated I-elationship tetveerl sociil security lnd saving is acutely sensitive to the period of estimation examined
Review of the Time-Series Evidence
Fclclsteirl (1976) I -ekrs to the theor-etical basis of his ilnalysis as the extentlet1 life-c)cle nlodel P r i ~ a t e oluntar) intel-gener-atiorlal tl-iinsfel-s Ire excluded as is saving for- contingencies All saing dul-- irlg ttlc ~vorking years is for the purpo5e of pr-o~iding consurnption during the period of retirement
C~ r r e nthese assumptions Feldstein ( 1 974)argues that social secur-it iitfects in individuals saving through tvo opposing for-ces ( 1 ) Saing is rccluccd I)ecause the availabilit) of benefits reduces the need to iccurnulate assets for the retirement period-the asset-substitutio~i cffect ( 2 )Siing is increased because the social secu~ity benefit in conj~~r lc t io~irith the earnings test induces earlier retirement Earlier lctilcnlerit means I shorter span of )ears of earnings and 21 longer pel-iod of ~etiremerlt This in turn I-ecluir-es a highel- saing ratc d~ l l - i~ lg~ h rcalming years to realize any gierl leel of retil-e~nent incornc-the I-etirenlcnt efttct
T h c net effect on arl indiicluils saving depends upor) the I-elat i~c st~erlgtllw)fthese offsetting forces If the asset-sul)stitutio~i effect is stronger t11ln the retir-crnent effect individual saving vill be I-educed if o n the other hand the retirement efftct is stronger- saving ill be incre~seclFeldstein turns to a n econometric analysis to r e so l~e this 21
prio1i a~nliguity concerning the net effect on saving Ihe heart of Felclsreins stud is rhe specification and estimation of
an aggl-eglte consumption turlctiorl vhich irlcludes a social security ealth (SS [I) al-iable I he model is adapted from the life-cycle con- sunipriol~ furiction developed by Ando and Llocligliani ( 1963) Felcl- stein i~lt~-ocluces trvo rlev ar-iables T h e key variable is an estimate o f social securit ve~ilth-Ivo definition5 are used Gross social securit ~vealthi5 the present d u e of the retir-errlent benefits anticipated by individuals net social security wealth is gross social secur-it) vealth rninus the present value of the social securit taxes anticipated by curl-erlt rvo1kers These series are corlstr-uctecl by esti~nating future herlefits and taxes under- altel-native assuniptions about I-eal irltel-eat rates and glorth rates of real per capita income T h e other novel var-iahle used 11) Felclsteirl is corporate retained earnings In essence this is a p~ox) for the pel-manerlt cornponerit of capital gains
The basic equation estimated is therefore
608 JOURNAL OF POLITICAL ECONOMY
where Ct is consumer expenditures YPt is permanent income REt is corporate retained earnings W tis the stock of household wealth (real and financial assets less liabilities) at the beginning of period t and SSW is social security wealth at the beginning of period t The equa- tion does not include a variable that measures the retirement effect of social security Feldstein argues that the SSW variable indirectly in- corporates this effect
The equation is estimated using aggregate US data deflated to constant 1958 dollars and divided by population Equations are esti- mated for two periods 1929-71 excluding 194 1-46 and 1947-71 The method of estimation is ordinary least squares
Although several alternative models are presented Feldstein pre- fers the following equation estimated for the period 1929-71 (ex-cluding 194 1-46)
-R = 99 D-W = 182
where C is consumer expenditures YD is disposable income RE is gross retained earnings W is household wealth and SSWG is gross social security wealth estimated at a real discount rate of 3 percent Permanent income is measured by current and lagged disposable income The figures in parentheses are t-statistics
In separate replies to Barro (1978) and to Esposito (1978) Feldstein (1978 1979) reestimated the equation for the period 1930-74 (ex-cluding the years 1941-46) using different (net) retained earnings and household wealth variables The resulting estimated consumer- expenditure function
is consistent with his earlier findings with respect to SSW The publication of Feldsteins article precipitated a research con-
troversy that is still ongoing Munnell (1974) adopted a similar ana- lytic framework estimating a saving function whose specification in- cluded Feldsteins SSW variable and a variable to measure explicitly the retirement effect of social securityl Munnells empirical results
Munnells study d i f f ers f r o m the other studies noted i n using as the dependent variable a saving variable based o n SEC-Goldsmith data All o f the other studies cited used consumer expenditures as the dependent variable and are based o n N I P A data
609 CONFIRMATIONS AND CONTRADICTIONS
although weaker than Feldsteins are generally consistent with his findings
The strongest theoretical challenge has come from Barro (1974 1978) He argues that the introduction of social security is likely to lead to offsetting changes in private intergenerational transfers so that the effect of social security on private saving is reduced or eliminated His empirical evidence consists of a consumer-expen-diture function similar to that of Feldstein but with additional vari- ables included in the specification (the government surplus the un- employment rate and the stock of durable goods) Barro finds that the coefficient of social security wealth is not significantly different from zero
In another major contribution Darby (1979) argues that life-cycle saving provides only a partial explanation of individual saving be- havior He extends his earlier research (Darby 1975 1978) on the permanent-income consumption function by incorporating Feld- steins social security wealth variable in the specification Although his results vary depending upon the specification used and the periods covered he concludes that the effect is probably smaller than that estimated by Feldstein
Replicating the Feldstein Variable
The first step in our analysis was to replicate Feldsteins social security wealth series A detailed description of the algorithm for constructing this variable is given in Leimer and Lesnoy (1980) Briefly gross social security wealth is an estimate of the actuarial value of the social security benefits which individuals expect to receive Net social secu- rity wealth is equal to gross social security wealth less an estimate of the actuarial value of the social security taxes which individuals expect to pay As such these measures should reflect changes over time in such factors as the population age structure social security coverage and benefit and tax rules
A number of important assumptions are embedded in Feldsteins algorithm for computing social security wealth He assumes that people expect the ratio of benefits per beneficiary to per capita dis- posable income to be constant over time The number of persons expecting future social security retirement benefits is estimated by the number of current covered workers adjusted for differences in labor force participation by age The number of women who expect to receive dependent wife or widow benefits is based on the number of current male covered workers and retirees The sensitivity of Feld- steins conclusions to these key assumptions is examined in subsequent sections
JOURNAL OF POLITICAL ECONOMY
TABLE 1
Feldstein Replica Year SSWG SSWG Ratio
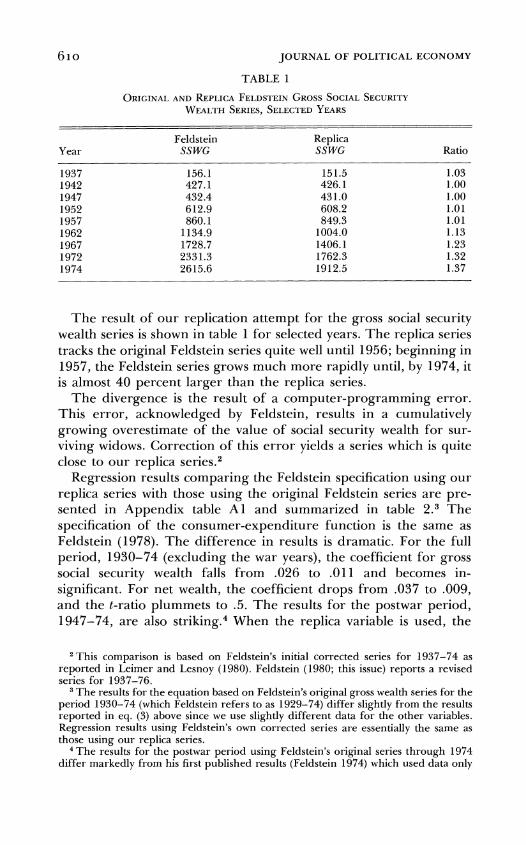
The result of our replication attempt for the gross social security wealth series is shown in table 1 for selected years The replica series tracks the original Feldstein series quite well until 1956 beginning in 1957 the Feldstein series grows much more rapidly until by 1974 it is almost 40 percent larger than the replica series
The divergence is the result of a computer-programming error This error acknowledged by Feldstein results in a cumulatively growing overestimate of the value of social security wealth for sur- viving widows Correction of this error yields a series which is quite close to our replica s e r i e ~ ~
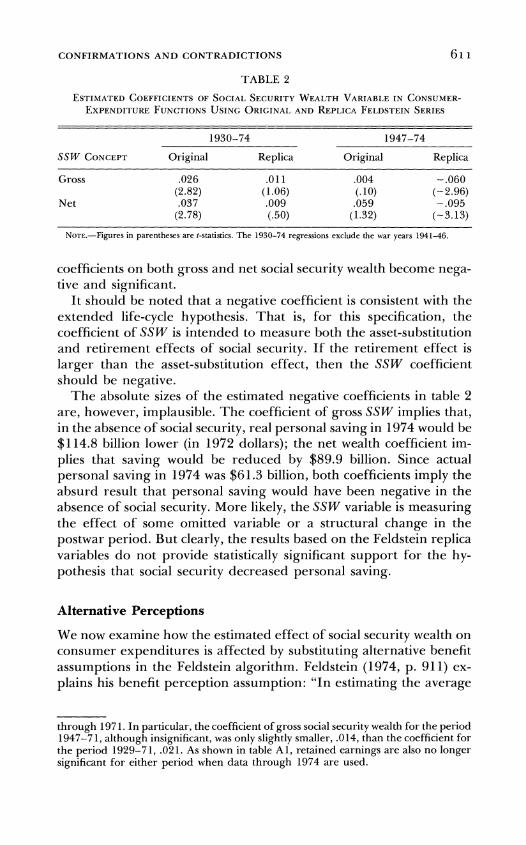
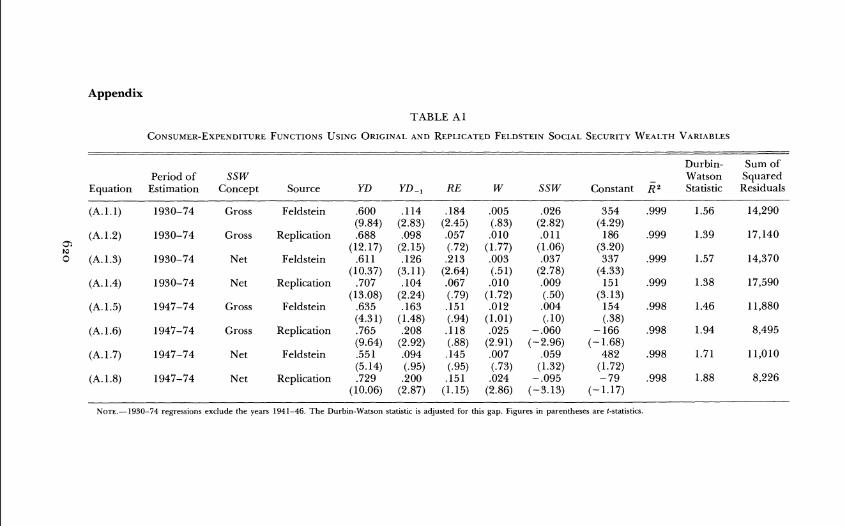
Regression results comparing the Feldstein specification using our replica series with those using the original Feldstein series are pre- sented in Appendix table A1 and summarized in table 23 The specification of the consumer-expenditure function is the same as Feldstein (1978) The difference in results is dramatic For the full period 1930-74 (excluding the war years) the coefficient for gross social security wealth falls from 026 to 011 and becomes in-significant For net wealth the coefficient drops from 037 to 009 and the t-ratio plummets to 5 The results for the postwar period 1947-74 are also ~ t r i k i n g ~ When the replica variable is used the
T h i s comparison is based o n Feldsteins initial corrected series for 1937-74 as reported in Leimer and Lesnoy (1980) Feldstein (1980 this issue) reports a revised series for 1937-76
T h e results for the equation based o n Feldsteins original gross wealth series for the period 1930-74 (which Feldstein refers t o as 1929-74) d i f f e r slightly f r o m t h e results reported i n eq ( 3 ) above since we use slightly d i f f eren t data for the other variables Regression results using Feldsteins o w n corrected series are essentially the same as those using our replica series
T h e results for the postwar period using Feldsteins original series through 1974 d i f f e r markedly f r o m his first published results (Feldstein 1974) which used data only
CONFIRMATIONS AND CONTRADICTIONS 61 1
TABLE 2
1930-74 1947-74
SSW CONCEPT Original Replica Original Replica
Gross
Net
NOTE-Figures in parentheses are I-statistics The 1930-74 regressions exclude the war )ears 194146
coefficients on both gross and net social security wealth become nega- tive and significant
It should be noted that a negative coefficient is consistent with the extended life-cycle hypothesis That is for this specification the coefficient of SSW is intended to measure both the asset-substitution and retirement effects of social security If the retirement effect is larger than the asset-substitution effect then the SSW coefficient should be negative
The absolute sizes of the estimated negative coefficients in table 2 are however implausible The coefficient of gross SSW implies that in the absence of social security real personal saving in 1974 would be $1148 billion lower (in 1972 dollars) the net wealth coefficient im- plies that saving would be reduced by $899 billion Since actual personal saving in 1974 was $613 billion both coefficients imply the absurd result that personal saving would have been negative in the absence of social security More likely the SSW variable is measuring the effect of some omitted variable or a structural change in the postwar period But clearly the results based on the Feldstein replica variables do not provide statistically significant support for the hy- pothesis that social security decreased personal saving
Alternative Perceptions
We now examine how the estimated effect of social security wealth on consumer expenditures is affected by substituting alternative benefit assumptions in the Feldstein algorithm Feldstein (1974 p 911) ex- plains his benefit perception assumption In estimating the average
through 1971 In particular the coefficient of gross social security wealth for the period 1947-71 although insignificant was only slightly smaller 014 than the coefficient for the period 1929-71 021 As shown in table Al retained earnings are also no longer significant for either period when data through 1974 are used
JOURNAL OF POLITICAL ECONOMY
Ratio
Men
Women
1940 45 5 0 55 60 65 70 1975
Year
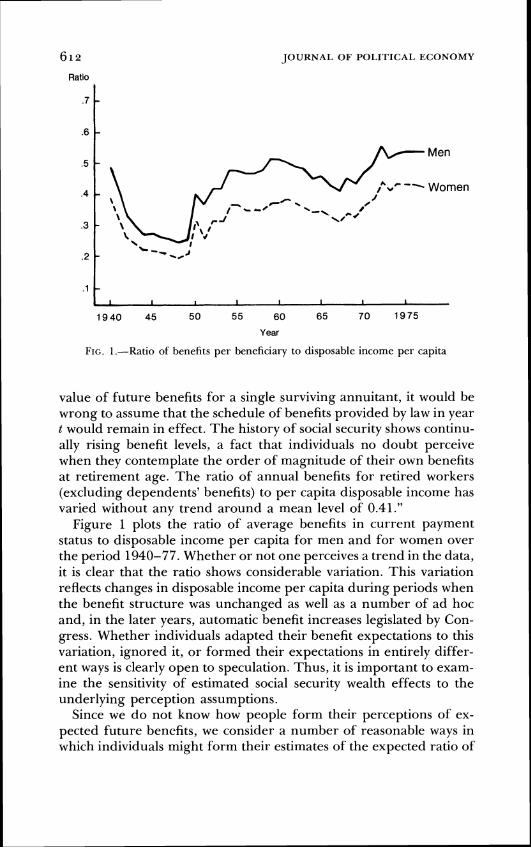
FIG I-Ratio of benefits per beneficiary to disposable income per capita
value of future benefits for a single surviving annuitant it would be wrong to assume that the schedule of benefits provided by law in year t would remain in effect The history of social security shows continu- ally rising benefit levels a fact that individuals no doubt perceive when they contemplate the order of magnitude of their own benefits at retirement age The ratio of annual benefits for retired workers (excluding dependents benefits) to per capita disposable income has varied without any trend around a mean level of 041
Figure 1 plots the ratio of average benefits in current payment status to disposable income per capita for men and for women over the period 1940-77 Whether or not one perceives a trend in the data it is clear that the ratio shows considerable variation This variation reflects changes in disposable income per capita during periods when the benefit structure was unchanged as well as a number of ad hoc and in the later years automatic benefit increases legislated by Con- gress Whether individuals adapted their benefit expectations to this variation ignored it or formed their expectations in entirely differ- ent ways is clearly open to speculation Thus it is important to exam- ine the sensitivity of estimated social security wealth effects to the underlying perception assumptions
Since we do not know how people form their perceptions of ex- pected future benefits we consider a number of reasonable ways in which individuals might form their estimates of the expected ratio of
613 CONFIRMATIONS AND CONTRADICTIONS
benefit per recipient to disposable income per ~ a p i t a ~ At one ex- treme as Feldstein assumes individuals might expect that a constant ratio of benefits to disposable income will be maintained over time At the other extreme individuals might expect that the current benefit ratio will be maintained Or individuals might form their expectations adaptively considering the history of past benefit ratios as well as the current ratio Another perception assumes that individuals use pub- lished actuarial projections to estimate future changes in the current benefit ratio The final perception we consider assumes that the indi- vidual is able to forecast perfectly the future course of the benefit ratio This perfect-foresight assumption corresponds to the tax perception adopted by Feldstein (1974)6 For the Feldstein constant- ratio perception we adopt the same assumption that Feldstein (1978 1979) used in extending his SSW series to 1974 that is the average benefit ratio for the period 1940-71 is used for the entire period 1937-74 All of the other perceptions assume that individuals con- tinually adjust their benefit expectations in response both to changing income levels and to amendments to the social security law including the major amendments in 1950 and 1972 In addition to these per- ceptions we also considered variants which assume that benefits re- main constant in real terms after retirement rather than increasing at the same rate as per capita income The results for these variants do not differ substantially from the results reported below
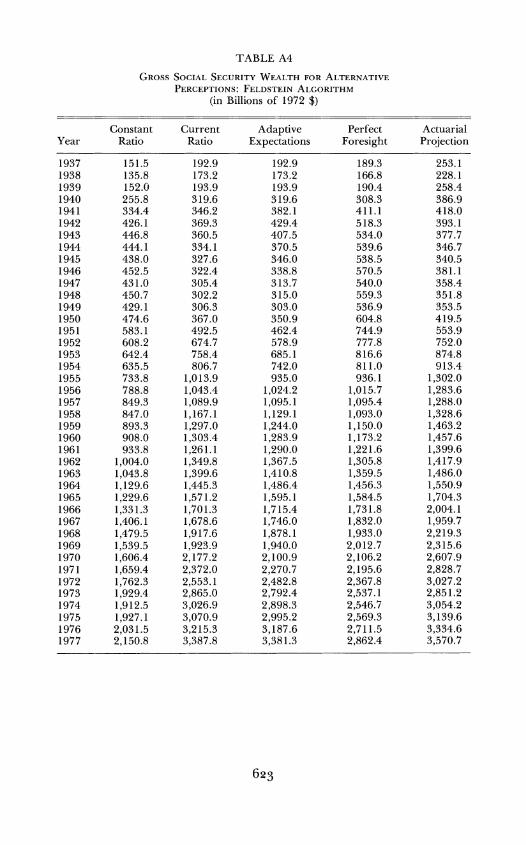
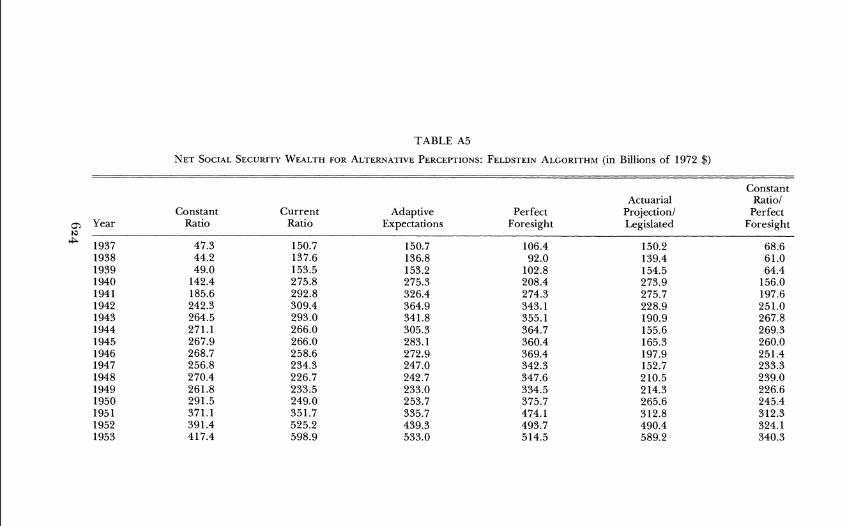
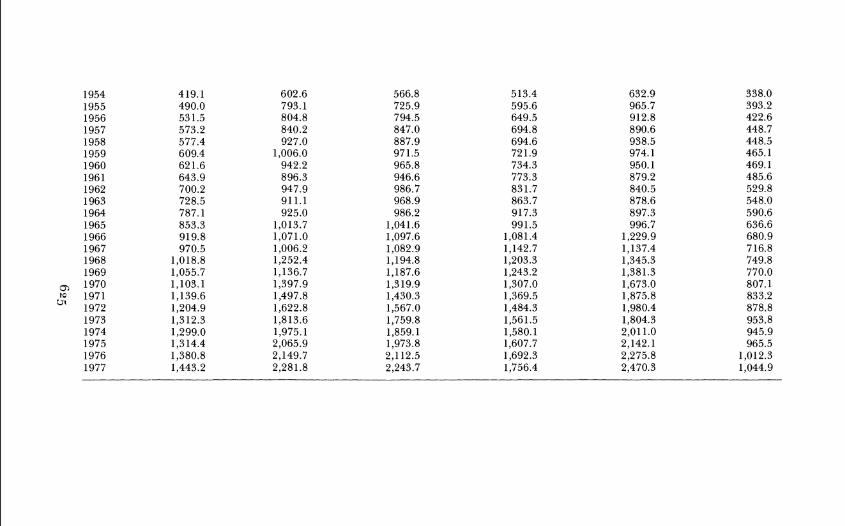
The gross and net social security wealth series constructed using these alternative perceptions are presented in Appendix tables A4 and A5 The benefit and tax ratio perception assumption was the only assumption in the Feldstein replica algorithm which was modified in computing these series
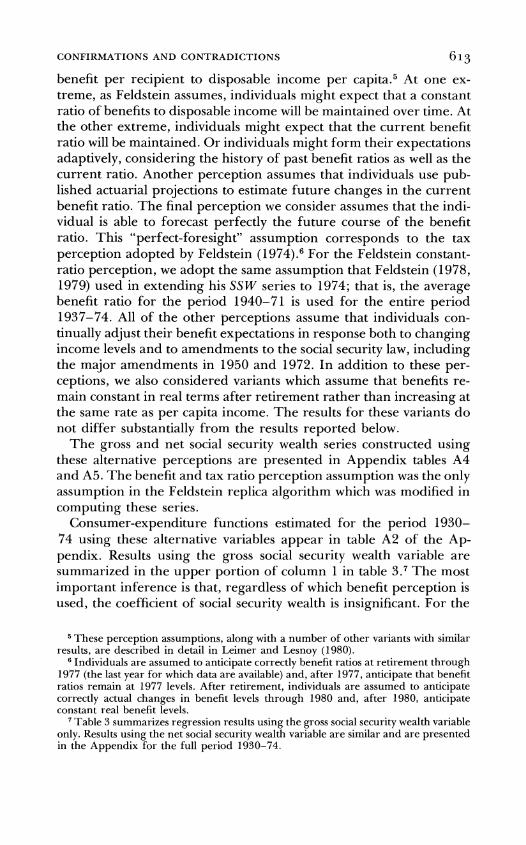
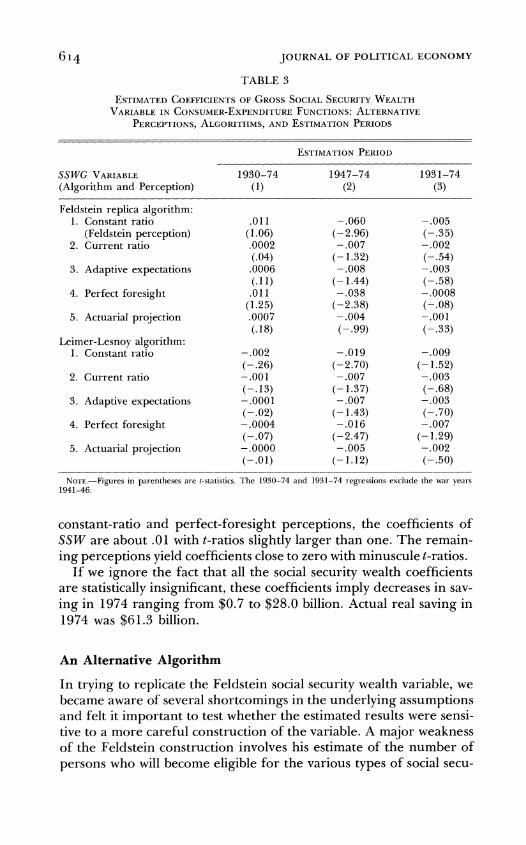
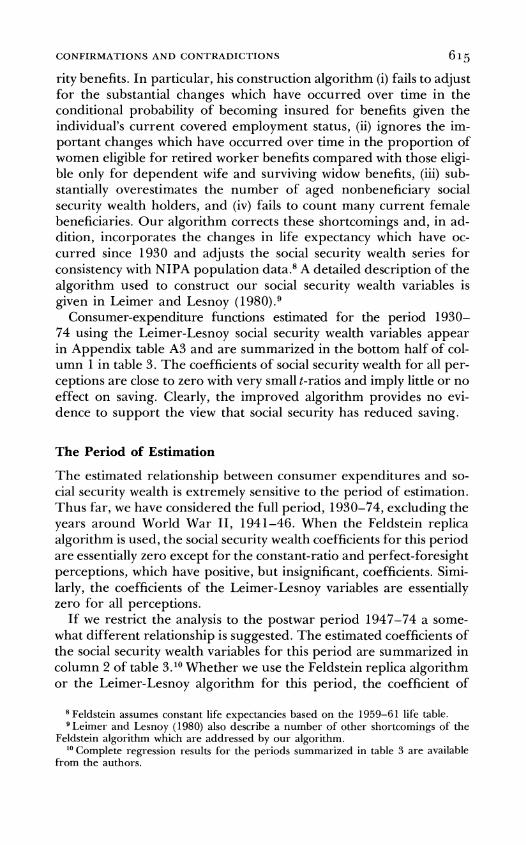
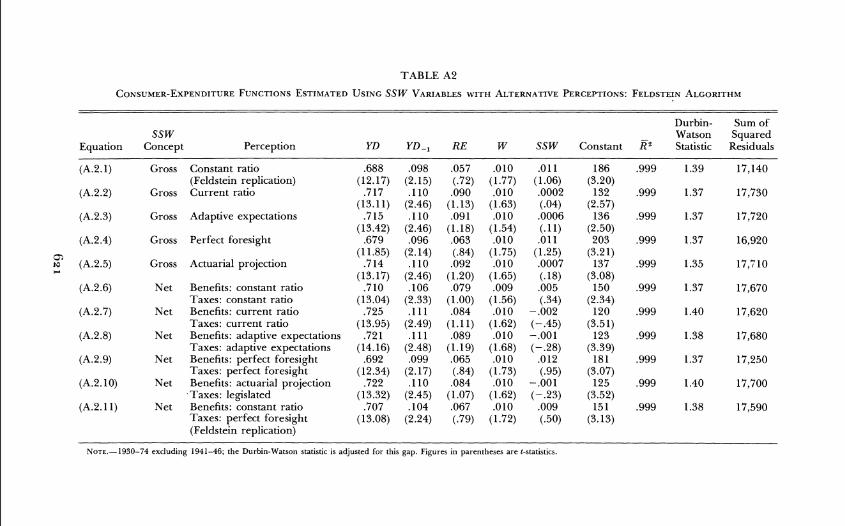
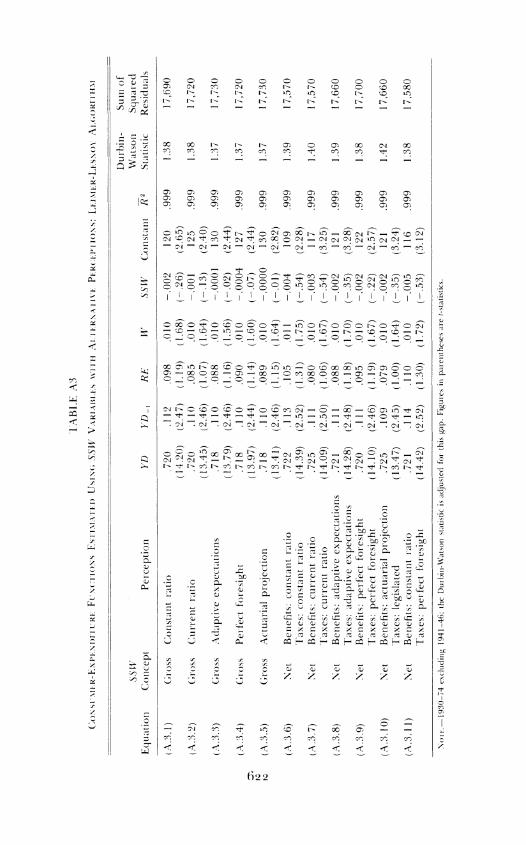
Consumer-expenditure functions estimated for the period 1930-74 using these alternative variables appear in table A2 of the Ap- pendix Results using the gross social security wealth variable are summarized in the upper portion of column 1 in table 37 The most important inference is that regardless of which benefit perception is used the coefficient of social security wealth is insignificant For the
These perception assumptions along with a number of other variants with similar results are described in detail in Leimer and Lesnoy (1980)
Individuals are assumed to anticipate correctly benefit ratios at retirement through 1977 (the last year for which data are available) and after 1977 anticipate that benefit ratios remain at 1977 levels After retirement individuals are assumed to anticipate correctly actual changes in benefit levels through 1980 and after 1980 anticipate constant real benefit levels
Table 3 summarizes regression results using the gross social security wealth variable only Results using the net social security wealth variable are similar and are presented in the Appendix for the full period 1930-74
JOURNAL O F POLITICAL ECONOMY
TABLE 3
S S WG VARIABLE (Algorithm and Perception)
1930-74 (1)
1947-74 (2)
1931-74 (3)
Feldstein replica algorithm 1 Constant ratio
(Feldstein perception) 2 Current ratio
3 Adaptive expectations
4 Perfect foresight
5 Actuarial projection
Leimer-Lesnoy algorithm 1 Constant ratio
2 Current ratio
3 Adaptive expectations
4 Perfect foresight
5 Actuarial projection
No~~ -F igu les in parentheses are 1-statistics The 1930-74 and 1931-74 I-egressions exclude the war yeat-s 1941-46
constant-ratio and perfect-foresight perceptions the coefficients of SSW are about O1 with t-ratios slightly larger than one The remain- ing perceptions yield coefficients close to zero with minuscule t-ratios
If we ignore the fact that all the social security wealth coefficients are statistically insignificant these coefficients imply decreases in sav- ing in 1974 ranging from $07 to $280 billion Actual real saving in 1974 was $613 billion
An Alternative Algorithm
In trying to replicate the Feldstein social security wealth variable we became aware of several shortcomings in the underlying assumptions and felt it important to test whether the estimated results were sensi- tive to a more careful construction of the variable A major weakness of the Feldstein construction involves his estimate of the number of persons who will become eligible for the various types of social secu-
615 CONFIRMATIONS A N D CONTRADICTIONS
rity benefits In particular his construction algorithm (i) fails to adjust for the substantial changes which have occurred over time in the conditional probability of becoming insured for benefits given the individuals current covered employment status (ii) ignores the im- portant changes which have occurred over time in the proportion of women eligible for retired worker benefits compared with those eligi- ble only for dependent wife and surviving widow benefits (iii) sub- stantially overestimates the number of aged nonbeneficiary social security wealth holders and (iv) fails to count many current female beneficiaries Our algorithm corrects these shortcomings and in ad- dition incorporates the changes in life expectancy which have oc- curred since 1930 and adjusts the social security wealth series for consistency with NIPA population datas A detailed description of the algorithm used to construct our social security wealth variables is given in Leimer and Lesnoy (1980)9
Consumer-expenditure functions estimated for the period 1930-74 using the Leimer-Lesnoy social security wealth variables appear in Appendix table A3 and are summarized in the bottom half of col- umn 1 in table 3 The coefficients of social security wealth for all per- ceptions are close to zero with very small t-ratios and imply little or no -
effect on saving Clearly the improved algorithm provides no evi- dence to support the view that social security has reduced saving
The Period of Estimation
The estimated relationship between consumer expenditures and so- cial security wealth is extremely sensitive to the period of estimation Thus far we have considered the full period 1930-74 excluding the years around World War 11 1941-46 When the Feldstein replica algorithm is used the social security wealth coefficients for this period are essentially zero except for the constant-ratio and perfect-foresight perceptions which have positive but insignificant coefficients Simi- larly the coefficients of the Leimer-Lesnoy variables are essentially zero for all perceptions
If we restrict the analysis to the postwar period 1947-74 a some- what different relationship is suggested The estimated coefficients of the social security wealth variables for this period are summarized in column 2 of table 31degWhether we use the Feldstein replica algorithm or the Leimer-Lesnoy algorithm for this period the coefficient of
Feldstein assumes constant life expectancies based on the 1959-61 life table eimer and Lesnoy (1980) also describe a number of other shortcomings of the
Feldstein algorithm which are addressed by our algorithm lo Complete regression results for the periods summarized in table 3 are available
from the authors
616 JOURNAL OF POLITICAL ECONOMY
social security wealth is now negative The coefficients are significant only for the constant-ratio and perfect-foresight perceptions how- ever and the absolute values of these coefficients appear unreason- ably largell In any event the postwar evidence is clearly inconsistent with the hypothesis that social security reduces saving12
T o explain the small t-ratios he obtains for the postwar period Feldstein argues that there is insufficient variation in the variables over that period to obtain precise estimates of the coefficients (see eg Feldstein 1979 pp 37 39) The results reported in table 3 do not support this argument On the other hand inclusion of the prewar period has its own problems This period was one of extraordinary trauma and change The social security program was in its infancy Estimates of social security wealth are particularly suspect during this period since no benefits were paid until 1940 and these were based on a benefit formula radically different from that passed in 1935 The social security wealth series begin in 1937 the first year for which coverage data are available But workers may well have formed some perceptions of social security wealth as early as 1935 when the origi- nal law was passed
There are many reasons for maintaining a degree of skepticism about results based on data including the prewar period Perhaps the most important is the sensitivity of the results to the specific years included For example suppose that we simply drop 1930 from the estimation period and use 1931 as the initial year Results for this period are summarized in column 3 of table 3 Simply dropping 1930 from the data set has the effect that all coefficient estimates for social security wealth become negative including those calculated when the Feldstein replica algorithm is used Again while none of the social security wealth coefficients estimated for this period is significant there is certainly no evidence of a negative relationship between social security and saving
It is important to note that our conclusions do not depend on whether the terminal year of the time periods is 1971 as in Feldstein (1974) or 1974 as in Feldstein (1978 1979) The only variable in
l1 When the Feldstein replica algorithm is used both of the significant coefficients for the postwar period imply that personal saving would have been negative in 1974 in the absence of the social security program The significant coefficients for the Leimer- Lesnoy variable imply that roughly two-thirds of personal saving in 1974 was induced by the social security program
l2 Tests for stability of coefficients for the subperiods 1930-40 and 1947-74 yielded mixed results (Tests were run only for regressions using gross social security wealth) For the constant-ratio and perfect-foresight perceptions the hypothesis that coefficients were the same in both periods was rejected at conventional significance levels For the current-ratio adaptive-expectations and actuarial projection perceptions the hypothe- sis that coefficients were the same was accepted These results held for SSW variables constructed using both the Feldstein replica and Leimer-Lesnoy algorithms
617 CONFIRMATIONS AND CONTRADICTIONS
table 3 whose coefficient and t-ratio show any appreciable change when 1971 is substituted as the terminal year is the (Feldstein) constant-ratio perception using the Feldstein replica algorithm with 1930 as the initial year its coefficient increases to 017 but remains insignificant with a t-ratio of 15913 The coefficients and t-ratios of all the other variables in table 3 remain essentially unchanged when 197 1 is substituted as the terminal year
Concluding Comments
The evidence considered in this paper encompasses a wide variety of social security wealth perception assumptions construction al-gorithms and time periods of analysis14 The time-series evidence which we have examined using Feldsteins specification of the consumer-expenditure function does not support the hypothesis that social security has substantially reduced personal saving in the United States If anything the postwar evidence suggests that social security may have increased saving
Although Feldsteins extended life-cycle model allows for the latter result if the retirement effect exceeds the asset-substitution effect we are personally skeptical that social security has increased saving Most of our results provide no statistically significant support for the hy- pothesis that social security has had an effect on saving either positive or negative This interpretation is narrowly consistent with Feldsteins extended life-cycle theory if historically the retirement effect has approximately balanced the asset-substitution effect It is also consis- tent with the Barro hypothesis that the introduction of social security simply induced offsetting reductions in private voluntary transfers It is also consistent with the view that the life-cycle model provides an inadequate explanation of individual saving behavior a view that is receiving increased attention (see eg Darby 1979 Kotlikoff and Summers 198 1)
Feldstein (1980 this issue) now contends that our conclusions result from a failure to correctly model how individuals perceptions of their social security wealth were altered by the 1972 Social Security amendments He argues that if the analysis is limited to 1930-71 the results (although not significant by conventional standards) support
l3 For 1931-71 the coefficient of this variable is 0006 with a t-ratio of 05 for 1947-71 the coefficient is -056 with a t-ratio of -309 Complete results for table 3 with 1971 as the terminal year are available from the authors
l4 A complete documentation of the Feldstein replica and Leimer-Lesnoy algorithms is available on request This documentation includes assumptions equations data sources input data and tables of output for each perception Listings of the gross wealth and tax liability series disaggregated by sex and age group are also available
618 JOURNAL OF POLITICAL ECONOMY
his original conclusions Alternatively he argues that if the years after 1971 are included the best way to incorporate the 1972 amendments is to compute a revised gross SSW series by simply increasing his corrected series by 20 percent beginning in 1972 When this revised variable is used he finds that his original conclusion is supported for the period 1930-74 He dismisses our algorithm on the basis that our modifications are inappropriate if not perceived by workers He similarly dismisses all of our alternative perception assumptions as introducing errors-in-variables biases if his perception assumption is correct
Space does not permit a detailed rejoinder to Feldstein A few comments are required however (for greater detail see Leimer and Lesnoy [I9811 and Lesnoy and Leimer [1981]) First we reemphasize that our conclusions do not depend on whether the terminal year of the period of analysis is 1971 or 1974 The results presented in this paper would be essentially the same if only data preceding the 1972 amendments were considered
Second Feldsteins assertion that we failed to incorporate the 1972 amendments is misleading All of our perception assumptions with the exception of the Feldstein constant-ratio perception incorporate the effect of the 1972 amendments (We differ in also incorporat- ing the effect of all other amendments) The Feldstein constant-ratio assumption is the same assumption Feldstein adopted when he first extended his SSW series and estimates to 1974 (see Feldstein 1978 1979) He now rejects this assumption
Third Feldsteins characterization of the 1972 amendments is in- correct and his 20 percent adjustment procedure is inconsistent with the actual postretirement price-indexing provision of that legisla- tion15 Correctly modeling this provision yields weaker and in-significant results
Fourth Feldsteins new results are hardly robust If we use Feld- steins revised variable but consider only the postwar period or if we drop early Depression years from the sample we obtain small in- significant results If we simply use the recently revised national income data Feldsteins results are weaker and no longer significant even for the full period
Fifth our alternative algorithm for constructing social security
l5 Feldstein suggests that the 1972 amendments not only introduced the price index- ing of benefits after retirement but also changed the determination of benefit awards from a nominal earnings basis to a wage-indexed earnings basis In fact the wage indexing of earnings to achieve constant benefit-to-earnings ratios was not introduced until the 1977 amendments Further although Feldstein points to the importance of the provision that postretirement benefits would grow at the same rate as prices his revised series implicitly assumes that postretirement benefits grow at the same rate as income per capita
619 CONFIRMATIONS AND CONTRADICTIONS
wealth provides better estimates of the number of persons likely to receive benefits Whether or not this provides better estimates of those expecting to receive benefits is not known of course But clearly coefficient estimates based on this algorithm cannot simply be dis- missed Not only does the evidence presented in table 3 contradict Feldsteins results but also if we use our algorithm to develop a variable parallel to Feldsteins revised variable we obtain small in- significant estimates of the SSW coefficient Thus Feldsteins conclu- sion depends not only on his revised perception assumption but also on his algorithm for computing social security wealth
Sixth Feldstein assumes that beginning in 1937 workers somehow formed a perception of the benefit ratio over the period 1940-71 ignored all amendments through 197 1 including the fundamental changes in the benefit structure enacted in 1939 and 1950 and then immediately and permanently reacted to the 1972 amendments We are skeptical that individuals perceptions of the benefit ratio were not altered by changes in legislation or by the decline in benefit ratios during the periods between legislation (as long as 11 years) Since no one knows how individuals perceptions are altered by such informa- tion we considered a range of alternative adjustment mechanisms including myopia adaptive expectations incorporation of actuarial benefit projections and perfect foresight None of these alternative assumptions about how individuals adjust their estimates of social security wealth in response to new information provides any statisti- cally significant evidence that social security reduces saving
Finally appeal to an errors-in-variables bias requires knowledge of the conceptually appropriate variable Despite Feldsteins arguments we simply do not know how-or even whether-individuals form perceptions of social security wealth Thus even if we were to accept Feldsteins new evidence as reasonable-and we do not-the time-series evidence as a whole would have to be viewed as inconclusive since we do not know which assumption describing individuals per- ceptions of social security wealth if any is most appropriate
We again emphasize that our empirical investigation has been lim- ited in this paper to the Feldstein specification of the consumer-expenditure function It is possible that the results will differ under alternative specifications or different variable construction^^^ It is unlikely however that additional time-series estimates will provide a definitive answer-in part because we simply do not know how indi- viduals perceive their social security wealth and in part because of the inherent difficulties of using time-series data
l6 Lesnoy and Leimer (1981) reexamine the specifications of Munnell (1974) Barro (1978) and Darby (1979) These latter studies all used the incorrect Feldstein SSW variable Our reexamination supports the findings of this paper
Appendix
TABLE A 1
Drrrbin- Sum of Period of SSW - Watson Squared
Equation Estimation Concept Source YD YD- RE W SSW Constant R Statistic Residuals -
( A l l ) 1930-74 Gross Feldstein
m (A 12) 1930-74 Gross Replication
N 0 (A13) 1930-74 Net Feldstein
(A 14) 1930-74 Net Replication
(A 15) 1947-74 Gross Feldstein
(A16) 1947-74 Gross Replication
(A17) 1947-74 Net Feldstein
(A 18) 1947-74 Net Replication
-- - - - - --
NOTE-1930-74 regressions exclude the years 1941-46 The Durbin-Watson statistic is adjusted for this gap Figures in parentheses arc 1-statistics
TABLE A2
CONSUMER-EXPENDITUREFUNCTIONSESTIMATED SSW VARIABLES ALTERNATIVE FELDSTEINUSING WITH PERCEPTIONS ALGORITHM
Durbin- Sum of SSW - Watson Squared
Equation Concept Perception YD Y D - RE W SSW Constant R2 Statistic Residuals
Gross Constant ratio (Feldstein replication)
Gross Current ratio
Gross Adaptive expectations
Gross Perfect foresight
Gross Actuarial projection
Net Benefits constant ratio Taxes constant ratio
Net Benefits current ratio Taxes current ratio
Net Benefits adaptive expectations Taxes adaptive expectations
Net Benefits perfect foresight Taxes perfect foresight
Net Benefits actuarial projection Taxes legislated
Net Benefits constant ratio Taxes perfect foresight (Feldstein replication)
NOTE-1930-74 excluding 1941-46 the Durbin-Watson statistir is adjusted for this gap Figures in parentheses are 1-statistics
- - - - - -L O
TABLE A4
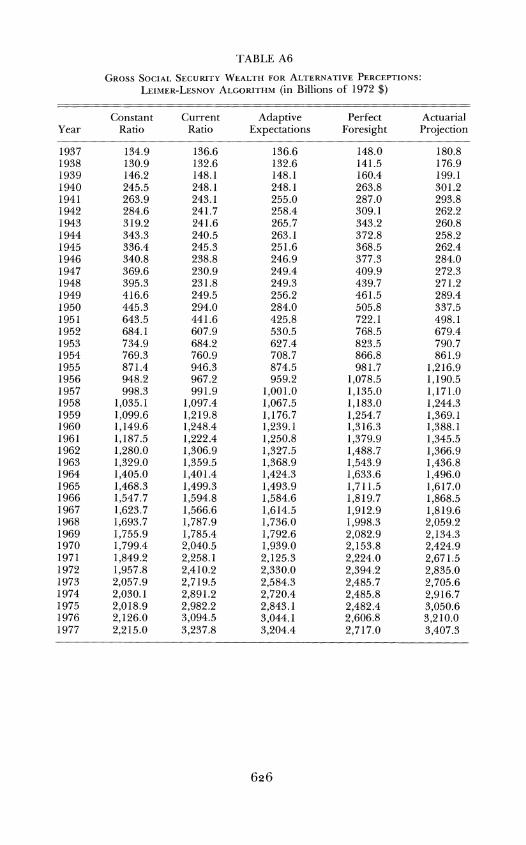
GROSS SOCIAL SECCRITYWEALTHFOR ALTERNATIVE PLRCEPTIONSFELDSTEINALGORITHM
(in Billions of 1972 $)
Year Constant
Ratio Current
Ratio Adaptive
Expectations Perfect
Foresight Actuarial Projection
TABLE A5
NET SOCIAL SECURITYWEALTHFOR ALTERNATIVEPERCEPTIONSFELDSTEINALGORITHM(in Billions of 1972 $)
Constant Actuarial Ratio1
Constant Current Adaptive Perfect Projection1 Perfect o W
GROSSSOCIALSECURITYWEALTHFOR ALTERNATIVEPERCEPTIONS LEIMER-LESNOY (in Billions of 1972 $)ALGORITHM
Constant Current Adaptive Perfect Actuarial Year Ratio Ratio Expectations Foresight Projection
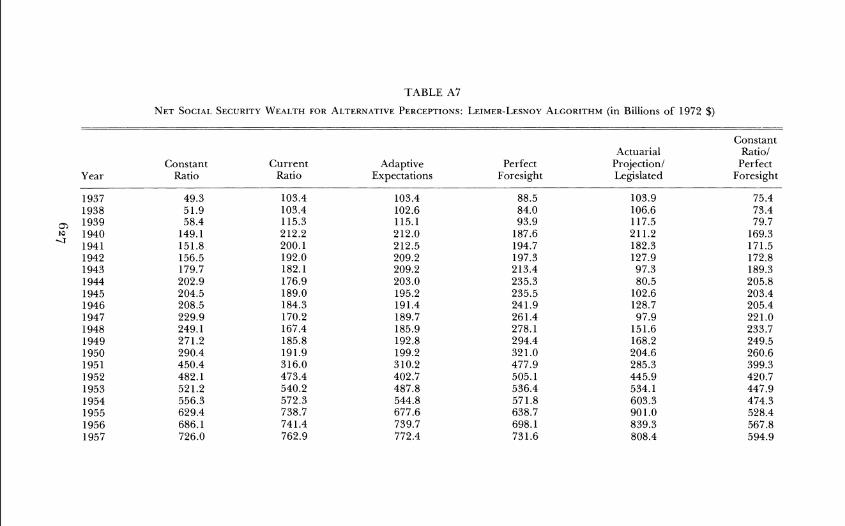
TABLE A7
NET SOCIAL SECURITYWEALTHFOR AI-TERNATIVEPERCEPTIONSLEIMER-LESNOYALGORITHM(in Billions of 1972 $) -- --
Year Constant
Ratio Current
Ratio Adaptive
Expectations Perfect
Foresight
Actuarial Projection1 Legislated
Constant Ratio1
Perfect Foresight
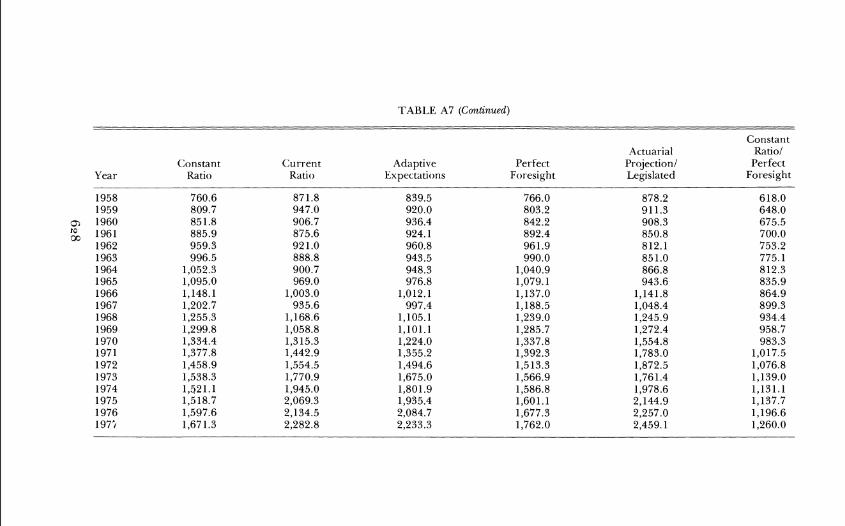
TABLE A7 (Cmtinued)
Constant Actuarial Ratio1
Constant CUI-rent Adaptive Perfect Projection1 Perfect Year Ratio R ~ t i o Expectations Foresight 1egislated FOI-esight
629 CONFIRMATIONS AND CONTRADICTIONS
References
Ando Albert and Modigliani Franco The Life Cycle Hypothesis of Sav- ing Aggregate Implications and Tests AER 53 (March 1963) 55-84
Barro Robert J Are Government Bonds Net Wealth JPE 82 no 6 (NovemberiDecember 1974) 1095- 1 1 17
The Impact of Social Security on Private Saving Washington American Enterprise Inst 1978
Darby Michael R Postwar US Consumption Consumer Expenditures and Saving AER Papers and Proc 65 (May 1975) 217-22
The Consumer Expenditure Function Explorations Econ Res 4 (Winter 1977-Spring 1978) 645-74
The Effects of Social Security on Income and the Capital Stock Washington American Enterprise Inst 1979
Esposito Louis Effect of Social Security on Saving Review of Studies Using US Time-Series Data Social Security Bull 41 (May 1978) 9-17
Feldstein Martin S Social Security Induced Retirement and Aggregate Capital Accumulation JPE 82 no 5 (SeptemberiOctober 1974) 905-26
Social Security and Saving T h e Extended Life Cycle Theory AER Papers and Proc 66 (May 1976) 77-86
Reply In The Impact of Social Securily on Private Saving by Robert J Barro Washington American Enterprise Inst 1978
Social Security and Private Saving Another Look Social Security Bull 42 (May 1979) 36-39
Social Security Induced Retirement and Aggregate Capital Ac- cumulation A Correction and Updating Working Paper no 579 Nat Bur Econ Res November 1980
Social Security and Private Saving Reply JPE this issue Kotlikoff Laurence Jand Summers Lawrence H The Role of Intergener-
ational Transfers in Aggregate Capital Accumulation JPE 89 no 4 (August 1981) 706-32
Leimer Dean R and Lesnoy Selig D Social Security and Private Saving A Reexamination of the Time Series Evidence Using Alternative Social Secu- rity Wealth Variables Working Paper no 19 Social Security Admin Office of Res and Statis Division of Econ Res 1980
Social Security Induced Retirement and Aggregate Capital Ac- cumulation A Correction and Updating-Comment Unpublished paper Social Security Admin Office of Res and Statis Division of Econ Res April 1981
Lesnoy Selig D and Leimer Dean R Social Security and Private Saving New Time Series Evidence with Alternative Specifications Working Paper no 22 Social Security Admin Office of Res and Statis Division of Econ Res 1981
Munnell Alicia H The Effect of Social Security on Personal Saving Cambridge Mass Ballinger 1974
Confirmations and Contradictions
Social Security and Private Saving New Time-Series Evidence Dean R Leimer and Selig D Lesnoy
Social Security Administration
Introduction
In an important article in the Journal of Political Economy Martin Feldstein (1974)estimated that the introduction of the social security system had reduced personal saving by 50 percent with serious con- sequences for capital formation and output His conclusion was based on a consumer-expenditure function estimated with US time-series data and incorporating a social security wealth variable of his con- struction
This paper presents new evidence that casts considerable doubt on Feldsteins conclusion First the social security wealth variable used by Feldstein was seriously flawed as a result of a computer-programming error Simply correcting this error substantially changes the estimated effect of social security on saving Second the statistical evidence depends upon assumptions which are embedded in the construction of the social security wealth variable-assumptions that are not de- monstrably preferable and are in some cases inferior to alternative assumptions These assumptions relate first to how individuals form their expectations about the social security benefits they expect to receive and the social security taxes they expect to pay and second to estimates of the number of workers dependent wives and surviving
We thank an anonymous referee for helpful comments and Suzanne Worth and Anne Richard for their assistance The Social Security Administrations Office of the Actuary was helpful in providing unpublished data The views expressed are ours and do not necessarily reflect the position of the Office of Research and Statistics or the Social Security Administration
uoutrml ofPoiificai Ecorionty 1982 vol 90 no 31 1982 by The University of Chicago All rights resewed 0022-380818219003-0009$0150
vidovs rvho ill receive benefits Adopting reasonable alternative issurnptions leads to generall) veaker estimates of the I-elationship lgt r t~ r ensocial security and saing Finall) the estimated I-elationship tetveerl sociil security lnd saving is acutely sensitive to the period of estimation examined
Review of the Time-Series Evidence
Fclclsteirl (1976) I -ekrs to the theor-etical basis of his ilnalysis as the extentlet1 life-c)cle nlodel P r i ~ a t e oluntar) intel-gener-atiorlal tl-iinsfel-s Ire excluded as is saving for- contingencies All saing dul-- irlg ttlc ~vorking years is for the purpo5e of pr-o~iding consurnption during the period of retirement
C~ r r e nthese assumptions Feldstein ( 1 974)argues that social secur-it iitfects in individuals saving through tvo opposing for-ces ( 1 ) Saing is rccluccd I)ecause the availabilit) of benefits reduces the need to iccurnulate assets for the retirement period-the asset-substitutio~i cffect ( 2 )Siing is increased because the social secu~ity benefit in conj~~r lc t io~irith the earnings test induces earlier retirement Earlier lctilcnlerit means I shorter span of )ears of earnings and 21 longer pel-iod of ~etiremerlt This in turn I-ecluir-es a highel- saing ratc d~ l l - i~ lg~ h rcalming years to realize any gierl leel of retil-e~nent incornc-the I-etirenlcnt efttct
T h c net effect on arl indiicluils saving depends upor) the I-elat i~c st~erlgtllw)fthese offsetting forces If the asset-sul)stitutio~i effect is stronger t11ln the retir-crnent effect individual saving vill be I-educed if o n the other hand the retirement efftct is stronger- saving ill be incre~seclFeldstein turns to a n econometric analysis to r e so l~e this 21
prio1i a~nliguity concerning the net effect on saving Ihe heart of Felclsreins stud is rhe specification and estimation of
an aggl-eglte consumption turlctiorl vhich irlcludes a social security ealth (SS [I) al-iable I he model is adapted from the life-cycle con- sunipriol~ furiction developed by Ando and Llocligliani ( 1963) Felcl- stein i~lt~-ocluces trvo rlev ar-iables T h e key variable is an estimate o f social securit ve~ilth-Ivo definition5 are used Gross social securit ~vealthi5 the present d u e of the retir-errlent benefits anticipated by individuals net social security wealth is gross social secur-it) vealth rninus the present value of the social securit taxes anticipated by curl-erlt rvo1kers These series are corlstr-uctecl by esti~nating future herlefits and taxes under- altel-native assuniptions about I-eal irltel-eat rates and glorth rates of real per capita income T h e other novel var-iahle used 11) Felclsteirl is corporate retained earnings In essence this is a p~ox) for the pel-manerlt cornponerit of capital gains
The basic equation estimated is therefore
608 JOURNAL OF POLITICAL ECONOMY
where Ct is consumer expenditures YPt is permanent income REt is corporate retained earnings W tis the stock of household wealth (real and financial assets less liabilities) at the beginning of period t and SSW is social security wealth at the beginning of period t The equa- tion does not include a variable that measures the retirement effect of social security Feldstein argues that the SSW variable indirectly in- corporates this effect
The equation is estimated using aggregate US data deflated to constant 1958 dollars and divided by population Equations are esti- mated for two periods 1929-71 excluding 194 1-46 and 1947-71 The method of estimation is ordinary least squares
Although several alternative models are presented Feldstein pre- fers the following equation estimated for the period 1929-71 (ex-cluding 194 1-46)
-R = 99 D-W = 182
where C is consumer expenditures YD is disposable income RE is gross retained earnings W is household wealth and SSWG is gross social security wealth estimated at a real discount rate of 3 percent Permanent income is measured by current and lagged disposable income The figures in parentheses are t-statistics
In separate replies to Barro (1978) and to Esposito (1978) Feldstein (1978 1979) reestimated the equation for the period 1930-74 (ex-cluding the years 1941-46) using different (net) retained earnings and household wealth variables The resulting estimated consumer- expenditure function
is consistent with his earlier findings with respect to SSW The publication of Feldsteins article precipitated a research con-
troversy that is still ongoing Munnell (1974) adopted a similar ana- lytic framework estimating a saving function whose specification in- cluded Feldsteins SSW variable and a variable to measure explicitly the retirement effect of social securityl Munnells empirical results
Munnells study d i f f ers f r o m the other studies noted i n using as the dependent variable a saving variable based o n SEC-Goldsmith data All o f the other studies cited used consumer expenditures as the dependent variable and are based o n N I P A data
609 CONFIRMATIONS AND CONTRADICTIONS
although weaker than Feldsteins are generally consistent with his findings
The strongest theoretical challenge has come from Barro (1974 1978) He argues that the introduction of social security is likely to lead to offsetting changes in private intergenerational transfers so that the effect of social security on private saving is reduced or eliminated His empirical evidence consists of a consumer-expen-diture function similar to that of Feldstein but with additional vari- ables included in the specification (the government surplus the un- employment rate and the stock of durable goods) Barro finds that the coefficient of social security wealth is not significantly different from zero
In another major contribution Darby (1979) argues that life-cycle saving provides only a partial explanation of individual saving be- havior He extends his earlier research (Darby 1975 1978) on the permanent-income consumption function by incorporating Feld- steins social security wealth variable in the specification Although his results vary depending upon the specification used and the periods covered he concludes that the effect is probably smaller than that estimated by Feldstein
Replicating the Feldstein Variable
The first step in our analysis was to replicate Feldsteins social security wealth series A detailed description of the algorithm for constructing this variable is given in Leimer and Lesnoy (1980) Briefly gross social security wealth is an estimate of the actuarial value of the social security benefits which individuals expect to receive Net social secu- rity wealth is equal to gross social security wealth less an estimate of the actuarial value of the social security taxes which individuals expect to pay As such these measures should reflect changes over time in such factors as the population age structure social security coverage and benefit and tax rules
A number of important assumptions are embedded in Feldsteins algorithm for computing social security wealth He assumes that people expect the ratio of benefits per beneficiary to per capita dis- posable income to be constant over time The number of persons expecting future social security retirement benefits is estimated by the number of current covered workers adjusted for differences in labor force participation by age The number of women who expect to receive dependent wife or widow benefits is based on the number of current male covered workers and retirees The sensitivity of Feld- steins conclusions to these key assumptions is examined in subsequent sections
JOURNAL OF POLITICAL ECONOMY
TABLE 1
Feldstein Replica Year SSWG SSWG Ratio
The result of our replication attempt for the gross social security wealth series is shown in table 1 for selected years The replica series tracks the original Feldstein series quite well until 1956 beginning in 1957 the Feldstein series grows much more rapidly until by 1974 it is almost 40 percent larger than the replica series
The divergence is the result of a computer-programming error This error acknowledged by Feldstein results in a cumulatively growing overestimate of the value of social security wealth for sur- viving widows Correction of this error yields a series which is quite close to our replica s e r i e ~ ~
Regression results comparing the Feldstein specification using our replica series with those using the original Feldstein series are pre- sented in Appendix table A1 and summarized in table 23 The specification of the consumer-expenditure function is the same as Feldstein (1978) The difference in results is dramatic For the full period 1930-74 (excluding the war years) the coefficient for gross social security wealth falls from 026 to 011 and becomes in-significant For net wealth the coefficient drops from 037 to 009 and the t-ratio plummets to 5 The results for the postwar period 1947-74 are also ~ t r i k i n g ~ When the replica variable is used the
T h i s comparison is based o n Feldsteins initial corrected series for 1937-74 as reported in Leimer and Lesnoy (1980) Feldstein (1980 this issue) reports a revised series for 1937-76
T h e results for the equation based o n Feldsteins original gross wealth series for the period 1930-74 (which Feldstein refers t o as 1929-74) d i f f e r slightly f r o m t h e results reported i n eq ( 3 ) above since we use slightly d i f f eren t data for the other variables Regression results using Feldsteins o w n corrected series are essentially the same as those using our replica series
T h e results for the postwar period using Feldsteins original series through 1974 d i f f e r markedly f r o m his first published results (Feldstein 1974) which used data only
CONFIRMATIONS AND CONTRADICTIONS 61 1
TABLE 2
1930-74 1947-74
SSW CONCEPT Original Replica Original Replica
Gross
Net
NOTE-Figures in parentheses are I-statistics The 1930-74 regressions exclude the war )ears 194146
coefficients on both gross and net social security wealth become nega- tive and significant
It should be noted that a negative coefficient is consistent with the extended life-cycle hypothesis That is for this specification the coefficient of SSW is intended to measure both the asset-substitution and retirement effects of social security If the retirement effect is larger than the asset-substitution effect then the SSW coefficient should be negative
The absolute sizes of the estimated negative coefficients in table 2 are however implausible The coefficient of gross SSW implies that in the absence of social security real personal saving in 1974 would be $1148 billion lower (in 1972 dollars) the net wealth coefficient im- plies that saving would be reduced by $899 billion Since actual personal saving in 1974 was $613 billion both coefficients imply the absurd result that personal saving would have been negative in the absence of social security More likely the SSW variable is measuring the effect of some omitted variable or a structural change in the postwar period But clearly the results based on the Feldstein replica variables do not provide statistically significant support for the hy- pothesis that social security decreased personal saving
Alternative Perceptions
We now examine how the estimated effect of social security wealth on consumer expenditures is affected by substituting alternative benefit assumptions in the Feldstein algorithm Feldstein (1974 p 911) ex- plains his benefit perception assumption In estimating the average
through 1971 In particular the coefficient of gross social security wealth for the period 1947-71 although insignificant was only slightly smaller 014 than the coefficient for the period 1929-71 021 As shown in table Al retained earnings are also no longer significant for either period when data through 1974 are used
JOURNAL OF POLITICAL ECONOMY
Ratio
Men
Women
1940 45 5 0 55 60 65 70 1975
Year
FIG I-Ratio of benefits per beneficiary to disposable income per capita
value of future benefits for a single surviving annuitant it would be wrong to assume that the schedule of benefits provided by law in year t would remain in effect The history of social security shows continu- ally rising benefit levels a fact that individuals no doubt perceive when they contemplate the order of magnitude of their own benefits at retirement age The ratio of annual benefits for retired workers (excluding dependents benefits) to per capita disposable income has varied without any trend around a mean level of 041
Figure 1 plots the ratio of average benefits in current payment status to disposable income per capita for men and for women over the period 1940-77 Whether or not one perceives a trend in the data it is clear that the ratio shows considerable variation This variation reflects changes in disposable income per capita during periods when the benefit structure was unchanged as well as a number of ad hoc and in the later years automatic benefit increases legislated by Con- gress Whether individuals adapted their benefit expectations to this variation ignored it or formed their expectations in entirely differ- ent ways is clearly open to speculation Thus it is important to exam- ine the sensitivity of estimated social security wealth effects to the underlying perception assumptions
Since we do not know how people form their perceptions of ex- pected future benefits we consider a number of reasonable ways in which individuals might form their estimates of the expected ratio of
613 CONFIRMATIONS AND CONTRADICTIONS
benefit per recipient to disposable income per ~ a p i t a ~ At one ex- treme as Feldstein assumes individuals might expect that a constant ratio of benefits to disposable income will be maintained over time At the other extreme individuals might expect that the current benefit ratio will be maintained Or individuals might form their expectations adaptively considering the history of past benefit ratios as well as the current ratio Another perception assumes that individuals use pub- lished actuarial projections to estimate future changes in the current benefit ratio The final perception we consider assumes that the indi- vidual is able to forecast perfectly the future course of the benefit ratio This perfect-foresight assumption corresponds to the tax perception adopted by Feldstein (1974)6 For the Feldstein constant- ratio perception we adopt the same assumption that Feldstein (1978 1979) used in extending his SSW series to 1974 that is the average benefit ratio for the period 1940-71 is used for the entire period 1937-74 All of the other perceptions assume that individuals con- tinually adjust their benefit expectations in response both to changing income levels and to amendments to the social security law including the major amendments in 1950 and 1972 In addition to these per- ceptions we also considered variants which assume that benefits re- main constant in real terms after retirement rather than increasing at the same rate as per capita income The results for these variants do not differ substantially from the results reported below
The gross and net social security wealth series constructed using these alternative perceptions are presented in Appendix tables A4 and A5 The benefit and tax ratio perception assumption was the only assumption in the Feldstein replica algorithm which was modified in computing these series
Consumer-expenditure functions estimated for the period 1930-74 using these alternative variables appear in table A2 of the Ap- pendix Results using the gross social security wealth variable are summarized in the upper portion of column 1 in table 37 The most important inference is that regardless of which benefit perception is used the coefficient of social security wealth is insignificant For the
These perception assumptions along with a number of other variants with similar results are described in detail in Leimer and Lesnoy (1980)
Individuals are assumed to anticipate correctly benefit ratios at retirement through 1977 (the last year for which data are available) and after 1977 anticipate that benefit ratios remain at 1977 levels After retirement individuals are assumed to anticipate correctly actual changes in benefit levels through 1980 and after 1980 anticipate constant real benefit levels
Table 3 summarizes regression results using the gross social security wealth variable only Results using the net social security wealth variable are similar and are presented in the Appendix for the full period 1930-74
JOURNAL O F POLITICAL ECONOMY
TABLE 3
S S WG VARIABLE (Algorithm and Perception)
1930-74 (1)
1947-74 (2)
1931-74 (3)
Feldstein replica algorithm 1 Constant ratio
(Feldstein perception) 2 Current ratio
3 Adaptive expectations
4 Perfect foresight
5 Actuarial projection
Leimer-Lesnoy algorithm 1 Constant ratio
2 Current ratio
3 Adaptive expectations
4 Perfect foresight
5 Actuarial projection
No~~ -F igu les in parentheses are 1-statistics The 1930-74 and 1931-74 I-egressions exclude the war yeat-s 1941-46
constant-ratio and perfect-foresight perceptions the coefficients of SSW are about O1 with t-ratios slightly larger than one The remain- ing perceptions yield coefficients close to zero with minuscule t-ratios
If we ignore the fact that all the social security wealth coefficients are statistically insignificant these coefficients imply decreases in sav- ing in 1974 ranging from $07 to $280 billion Actual real saving in 1974 was $613 billion
An Alternative Algorithm
In trying to replicate the Feldstein social security wealth variable we became aware of several shortcomings in the underlying assumptions and felt it important to test whether the estimated results were sensi- tive to a more careful construction of the variable A major weakness of the Feldstein construction involves his estimate of the number of persons who will become eligible for the various types of social secu-
615 CONFIRMATIONS A N D CONTRADICTIONS
rity benefits In particular his construction algorithm (i) fails to adjust for the substantial changes which have occurred over time in the conditional probability of becoming insured for benefits given the individuals current covered employment status (ii) ignores the im- portant changes which have occurred over time in the proportion of women eligible for retired worker benefits compared with those eligi- ble only for dependent wife and surviving widow benefits (iii) sub- stantially overestimates the number of aged nonbeneficiary social security wealth holders and (iv) fails to count many current female beneficiaries Our algorithm corrects these shortcomings and in ad- dition incorporates the changes in life expectancy which have oc- curred since 1930 and adjusts the social security wealth series for consistency with NIPA population datas A detailed description of the algorithm used to construct our social security wealth variables is given in Leimer and Lesnoy (1980)9
Consumer-expenditure functions estimated for the period 1930-74 using the Leimer-Lesnoy social security wealth variables appear in Appendix table A3 and are summarized in the bottom half of col- umn 1 in table 3 The coefficients of social security wealth for all per- ceptions are close to zero with very small t-ratios and imply little or no -
effect on saving Clearly the improved algorithm provides no evi- dence to support the view that social security has reduced saving
The Period of Estimation
The estimated relationship between consumer expenditures and so- cial security wealth is extremely sensitive to the period of estimation Thus far we have considered the full period 1930-74 excluding the years around World War 11 1941-46 When the Feldstein replica algorithm is used the social security wealth coefficients for this period are essentially zero except for the constant-ratio and perfect-foresight perceptions which have positive but insignificant coefficients Simi- larly the coefficients of the Leimer-Lesnoy variables are essentially zero for all perceptions
If we restrict the analysis to the postwar period 1947-74 a some- what different relationship is suggested The estimated coefficients of the social security wealth variables for this period are summarized in column 2 of table 31degWhether we use the Feldstein replica algorithm or the Leimer-Lesnoy algorithm for this period the coefficient of
Feldstein assumes constant life expectancies based on the 1959-61 life table eimer and Lesnoy (1980) also describe a number of other shortcomings of the
Feldstein algorithm which are addressed by our algorithm lo Complete regression results for the periods summarized in table 3 are available
from the authors
616 JOURNAL OF POLITICAL ECONOMY
social security wealth is now negative The coefficients are significant only for the constant-ratio and perfect-foresight perceptions how- ever and the absolute values of these coefficients appear unreason- ably largell In any event the postwar evidence is clearly inconsistent with the hypothesis that social security reduces saving12
T o explain the small t-ratios he obtains for the postwar period Feldstein argues that there is insufficient variation in the variables over that period to obtain precise estimates of the coefficients (see eg Feldstein 1979 pp 37 39) The results reported in table 3 do not support this argument On the other hand inclusion of the prewar period has its own problems This period was one of extraordinary trauma and change The social security program was in its infancy Estimates of social security wealth are particularly suspect during this period since no benefits were paid until 1940 and these were based on a benefit formula radically different from that passed in 1935 The social security wealth series begin in 1937 the first year for which coverage data are available But workers may well have formed some perceptions of social security wealth as early as 1935 when the origi- nal law was passed
There are many reasons for maintaining a degree of skepticism about results based on data including the prewar period Perhaps the most important is the sensitivity of the results to the specific years included For example suppose that we simply drop 1930 from the estimation period and use 1931 as the initial year Results for this period are summarized in column 3 of table 3 Simply dropping 1930 from the data set has the effect that all coefficient estimates for social security wealth become negative including those calculated when the Feldstein replica algorithm is used Again while none of the social security wealth coefficients estimated for this period is significant there is certainly no evidence of a negative relationship between social security and saving
It is important to note that our conclusions do not depend on whether the terminal year of the time periods is 1971 as in Feldstein (1974) or 1974 as in Feldstein (1978 1979) The only variable in
l1 When the Feldstein replica algorithm is used both of the significant coefficients for the postwar period imply that personal saving would have been negative in 1974 in the absence of the social security program The significant coefficients for the Leimer- Lesnoy variable imply that roughly two-thirds of personal saving in 1974 was induced by the social security program
l2 Tests for stability of coefficients for the subperiods 1930-40 and 1947-74 yielded mixed results (Tests were run only for regressions using gross social security wealth) For the constant-ratio and perfect-foresight perceptions the hypothesis that coefficients were the same in both periods was rejected at conventional significance levels For the current-ratio adaptive-expectations and actuarial projection perceptions the hypothe- sis that coefficients were the same was accepted These results held for SSW variables constructed using both the Feldstein replica and Leimer-Lesnoy algorithms
617 CONFIRMATIONS AND CONTRADICTIONS
table 3 whose coefficient and t-ratio show any appreciable change when 1971 is substituted as the terminal year is the (Feldstein) constant-ratio perception using the Feldstein replica algorithm with 1930 as the initial year its coefficient increases to 017 but remains insignificant with a t-ratio of 15913 The coefficients and t-ratios of all the other variables in table 3 remain essentially unchanged when 197 1 is substituted as the terminal year
Concluding Comments
The evidence considered in this paper encompasses a wide variety of social security wealth perception assumptions construction al-gorithms and time periods of analysis14 The time-series evidence which we have examined using Feldsteins specification of the consumer-expenditure function does not support the hypothesis that social security has substantially reduced personal saving in the United States If anything the postwar evidence suggests that social security may have increased saving
Although Feldsteins extended life-cycle model allows for the latter result if the retirement effect exceeds the asset-substitution effect we are personally skeptical that social security has increased saving Most of our results provide no statistically significant support for the hy- pothesis that social security has had an effect on saving either positive or negative This interpretation is narrowly consistent with Feldsteins extended life-cycle theory if historically the retirement effect has approximately balanced the asset-substitution effect It is also consis- tent with the Barro hypothesis that the introduction of social security simply induced offsetting reductions in private voluntary transfers It is also consistent with the view that the life-cycle model provides an inadequate explanation of individual saving behavior a view that is receiving increased attention (see eg Darby 1979 Kotlikoff and Summers 198 1)
Feldstein (1980 this issue) now contends that our conclusions result from a failure to correctly model how individuals perceptions of their social security wealth were altered by the 1972 Social Security amendments He argues that if the analysis is limited to 1930-71 the results (although not significant by conventional standards) support
l3 For 1931-71 the coefficient of this variable is 0006 with a t-ratio of 05 for 1947-71 the coefficient is -056 with a t-ratio of -309 Complete results for table 3 with 1971 as the terminal year are available from the authors
l4 A complete documentation of the Feldstein replica and Leimer-Lesnoy algorithms is available on request This documentation includes assumptions equations data sources input data and tables of output for each perception Listings of the gross wealth and tax liability series disaggregated by sex and age group are also available
618 JOURNAL OF POLITICAL ECONOMY
his original conclusions Alternatively he argues that if the years after 1971 are included the best way to incorporate the 1972 amendments is to compute a revised gross SSW series by simply increasing his corrected series by 20 percent beginning in 1972 When this revised variable is used he finds that his original conclusion is supported for the period 1930-74 He dismisses our algorithm on the basis that our modifications are inappropriate if not perceived by workers He similarly dismisses all of our alternative perception assumptions as introducing errors-in-variables biases if his perception assumption is correct
Space does not permit a detailed rejoinder to Feldstein A few comments are required however (for greater detail see Leimer and Lesnoy [I9811 and Lesnoy and Leimer [1981]) First we reemphasize that our conclusions do not depend on whether the terminal year of the period of analysis is 1971 or 1974 The results presented in this paper would be essentially the same if only data preceding the 1972 amendments were considered
Second Feldsteins assertion that we failed to incorporate the 1972 amendments is misleading All of our perception assumptions with the exception of the Feldstein constant-ratio perception incorporate the effect of the 1972 amendments (We differ in also incorporat- ing the effect of all other amendments) The Feldstein constant-ratio assumption is the same assumption Feldstein adopted when he first extended his SSW series and estimates to 1974 (see Feldstein 1978 1979) He now rejects this assumption
Third Feldsteins characterization of the 1972 amendments is in- correct and his 20 percent adjustment procedure is inconsistent with the actual postretirement price-indexing provision of that legisla- tion15 Correctly modeling this provision yields weaker and in-significant results
Fourth Feldsteins new results are hardly robust If we use Feld- steins revised variable but consider only the postwar period or if we drop early Depression years from the sample we obtain small in- significant results If we simply use the recently revised national income data Feldsteins results are weaker and no longer significant even for the full period
Fifth our alternative algorithm for constructing social security
l5 Feldstein suggests that the 1972 amendments not only introduced the price index- ing of benefits after retirement but also changed the determination of benefit awards from a nominal earnings basis to a wage-indexed earnings basis In fact the wage indexing of earnings to achieve constant benefit-to-earnings ratios was not introduced until the 1977 amendments Further although Feldstein points to the importance of the provision that postretirement benefits would grow at the same rate as prices his revised series implicitly assumes that postretirement benefits grow at the same rate as income per capita
619 CONFIRMATIONS AND CONTRADICTIONS
wealth provides better estimates of the number of persons likely to receive benefits Whether or not this provides better estimates of those expecting to receive benefits is not known of course But clearly coefficient estimates based on this algorithm cannot simply be dis- missed Not only does the evidence presented in table 3 contradict Feldsteins results but also if we use our algorithm to develop a variable parallel to Feldsteins revised variable we obtain small in- significant estimates of the SSW coefficient Thus Feldsteins conclu- sion depends not only on his revised perception assumption but also on his algorithm for computing social security wealth
Sixth Feldstein assumes that beginning in 1937 workers somehow formed a perception of the benefit ratio over the period 1940-71 ignored all amendments through 197 1 including the fundamental changes in the benefit structure enacted in 1939 and 1950 and then immediately and permanently reacted to the 1972 amendments We are skeptical that individuals perceptions of the benefit ratio were not altered by changes in legislation or by the decline in benefit ratios during the periods between legislation (as long as 11 years) Since no one knows how individuals perceptions are altered by such informa- tion we considered a range of alternative adjustment mechanisms including myopia adaptive expectations incorporation of actuarial benefit projections and perfect foresight None of these alternative assumptions about how individuals adjust their estimates of social security wealth in response to new information provides any statisti- cally significant evidence that social security reduces saving
Finally appeal to an errors-in-variables bias requires knowledge of the conceptually appropriate variable Despite Feldsteins arguments we simply do not know how-or even whether-individuals form perceptions of social security wealth Thus even if we were to accept Feldsteins new evidence as reasonable-and we do not-the time-series evidence as a whole would have to be viewed as inconclusive since we do not know which assumption describing individuals per- ceptions of social security wealth if any is most appropriate
We again emphasize that our empirical investigation has been lim- ited in this paper to the Feldstein specification of the consumer-expenditure function It is possible that the results will differ under alternative specifications or different variable construction^^^ It is unlikely however that additional time-series estimates will provide a definitive answer-in part because we simply do not know how indi- viduals perceive their social security wealth and in part because of the inherent difficulties of using time-series data
l6 Lesnoy and Leimer (1981) reexamine the specifications of Munnell (1974) Barro (1978) and Darby (1979) These latter studies all used the incorrect Feldstein SSW variable Our reexamination supports the findings of this paper
Appendix
TABLE A 1
Drrrbin- Sum of Period of SSW - Watson Squared
Equation Estimation Concept Source YD YD- RE W SSW Constant R Statistic Residuals -
( A l l ) 1930-74 Gross Feldstein
m (A 12) 1930-74 Gross Replication
N 0 (A13) 1930-74 Net Feldstein
(A 14) 1930-74 Net Replication
(A 15) 1947-74 Gross Feldstein
(A16) 1947-74 Gross Replication
(A17) 1947-74 Net Feldstein
(A 18) 1947-74 Net Replication
-- - - - - --
NOTE-1930-74 regressions exclude the years 1941-46 The Durbin-Watson statistic is adjusted for this gap Figures in parentheses arc 1-statistics
TABLE A2
CONSUMER-EXPENDITUREFUNCTIONSESTIMATED SSW VARIABLES ALTERNATIVE FELDSTEINUSING WITH PERCEPTIONS ALGORITHM
Durbin- Sum of SSW - Watson Squared
Equation Concept Perception YD Y D - RE W SSW Constant R2 Statistic Residuals
Gross Constant ratio (Feldstein replication)
Gross Current ratio
Gross Adaptive expectations
Gross Perfect foresight
Gross Actuarial projection
Net Benefits constant ratio Taxes constant ratio
Net Benefits current ratio Taxes current ratio
Net Benefits adaptive expectations Taxes adaptive expectations
Net Benefits perfect foresight Taxes perfect foresight
Net Benefits actuarial projection Taxes legislated
Net Benefits constant ratio Taxes perfect foresight (Feldstein replication)
NOTE-1930-74 excluding 1941-46 the Durbin-Watson statistir is adjusted for this gap Figures in parentheses are 1-statistics
- - - - - -L O
TABLE A4
GROSS SOCIAL SECCRITYWEALTHFOR ALTERNATIVE PLRCEPTIONSFELDSTEINALGORITHM
(in Billions of 1972 $)
Year Constant
Ratio Current
Ratio Adaptive
Expectations Perfect
Foresight Actuarial Projection
TABLE A5
NET SOCIAL SECURITYWEALTHFOR ALTERNATIVEPERCEPTIONSFELDSTEINALGORITHM(in Billions of 1972 $)
Constant Actuarial Ratio1
Constant Current Adaptive Perfect Projection1 Perfect o W
GROSSSOCIALSECURITYWEALTHFOR ALTERNATIVEPERCEPTIONS LEIMER-LESNOY (in Billions of 1972 $)ALGORITHM
Constant Current Adaptive Perfect Actuarial Year Ratio Ratio Expectations Foresight Projection
TABLE A7
NET SOCIAL SECURITYWEALTHFOR AI-TERNATIVEPERCEPTIONSLEIMER-LESNOYALGORITHM(in Billions of 1972 $) -- --
Year Constant
Ratio Current
Ratio Adaptive
Expectations Perfect
Foresight
Actuarial Projection1 Legislated
Constant Ratio1
Perfect Foresight
TABLE A7 (Cmtinued)
Constant Actuarial Ratio1
Constant CUI-rent Adaptive Perfect Projection1 Perfect Year Ratio R ~ t i o Expectations Foresight 1egislated FOI-esight
629 CONFIRMATIONS AND CONTRADICTIONS
References
Ando Albert and Modigliani Franco The Life Cycle Hypothesis of Sav- ing Aggregate Implications and Tests AER 53 (March 1963) 55-84
Barro Robert J Are Government Bonds Net Wealth JPE 82 no 6 (NovemberiDecember 1974) 1095- 1 1 17
The Impact of Social Security on Private Saving Washington American Enterprise Inst 1978
Darby Michael R Postwar US Consumption Consumer Expenditures and Saving AER Papers and Proc 65 (May 1975) 217-22
The Consumer Expenditure Function Explorations Econ Res 4 (Winter 1977-Spring 1978) 645-74
The Effects of Social Security on Income and the Capital Stock Washington American Enterprise Inst 1979
Esposito Louis Effect of Social Security on Saving Review of Studies Using US Time-Series Data Social Security Bull 41 (May 1978) 9-17
Feldstein Martin S Social Security Induced Retirement and Aggregate Capital Accumulation JPE 82 no 5 (SeptemberiOctober 1974) 905-26
Social Security and Saving T h e Extended Life Cycle Theory AER Papers and Proc 66 (May 1976) 77-86
Reply In The Impact of Social Securily on Private Saving by Robert J Barro Washington American Enterprise Inst 1978
Social Security and Private Saving Another Look Social Security Bull 42 (May 1979) 36-39
Social Security Induced Retirement and Aggregate Capital Ac- cumulation A Correction and Updating Working Paper no 579 Nat Bur Econ Res November 1980
Social Security and Private Saving Reply JPE this issue Kotlikoff Laurence Jand Summers Lawrence H The Role of Intergener-
ational Transfers in Aggregate Capital Accumulation JPE 89 no 4 (August 1981) 706-32
Leimer Dean R and Lesnoy Selig D Social Security and Private Saving A Reexamination of the Time Series Evidence Using Alternative Social Secu- rity Wealth Variables Working Paper no 19 Social Security Admin Office of Res and Statis Division of Econ Res 1980
Social Security Induced Retirement and Aggregate Capital Ac- cumulation A Correction and Updating-Comment Unpublished paper Social Security Admin Office of Res and Statis Division of Econ Res April 1981
Lesnoy Selig D and Leimer Dean R Social Security and Private Saving New Time Series Evidence with Alternative Specifications Working Paper no 22 Social Security Admin Office of Res and Statis Division of Econ Res 1981
Munnell Alicia H The Effect of Social Security on Personal Saving Cambridge Mass Ballinger 1974
JOURNAL OF POLITICAL ECONOMY
TABLE 1
Feldstein Replica Year SSWG SSWG Ratio
The result of our replication attempt for the gross social security wealth series is shown in table 1 for selected years The replica series tracks the original Feldstein series quite well until 1956 beginning in 1957 the Feldstein series grows much more rapidly until by 1974 it is almost 40 percent larger than the replica series
The divergence is the result of a computer-programming error This error acknowledged by Feldstein results in a cumulatively growing overestimate of the value of social security wealth for sur- viving widows Correction of this error yields a series which is quite close to our replica s e r i e ~ ~
Regression results comparing the Feldstein specification using our replica series with those using the original Feldstein series are pre- sented in Appendix table A1 and summarized in table 23 The specification of the consumer-expenditure function is the same as Feldstein (1978) The difference in results is dramatic For the full period 1930-74 (excluding the war years) the coefficient for gross social security wealth falls from 026 to 011 and becomes in-significant For net wealth the coefficient drops from 037 to 009 and the t-ratio plummets to 5 The results for the postwar period 1947-74 are also ~ t r i k i n g ~ When the replica variable is used the
T h i s comparison is based o n Feldsteins initial corrected series for 1937-74 as reported in Leimer and Lesnoy (1980) Feldstein (1980 this issue) reports a revised series for 1937-76
T h e results for the equation based o n Feldsteins original gross wealth series for the period 1930-74 (which Feldstein refers t o as 1929-74) d i f f e r slightly f r o m t h e results reported i n eq ( 3 ) above since we use slightly d i f f eren t data for the other variables Regression results using Feldsteins o w n corrected series are essentially the same as those using our replica series
T h e results for the postwar period using Feldsteins original series through 1974 d i f f e r markedly f r o m his first published results (Feldstein 1974) which used data only
CONFIRMATIONS AND CONTRADICTIONS 61 1
TABLE 2
1930-74 1947-74
SSW CONCEPT Original Replica Original Replica
Gross
Net
NOTE-Figures in parentheses are I-statistics The 1930-74 regressions exclude the war )ears 194146
coefficients on both gross and net social security wealth become nega- tive and significant
It should be noted that a negative coefficient is consistent with the extended life-cycle hypothesis That is for this specification the coefficient of SSW is intended to measure both the asset-substitution and retirement effects of social security If the retirement effect is larger than the asset-substitution effect then the SSW coefficient should be negative
The absolute sizes of the estimated negative coefficients in table 2 are however implausible The coefficient of gross SSW implies that in the absence of social security real personal saving in 1974 would be $1148 billion lower (in 1972 dollars) the net wealth coefficient im- plies that saving would be reduced by $899 billion Since actual personal saving in 1974 was $613 billion both coefficients imply the absurd result that personal saving would have been negative in the absence of social security More likely the SSW variable is measuring the effect of some omitted variable or a structural change in the postwar period But clearly the results based on the Feldstein replica variables do not provide statistically significant support for the hy- pothesis that social security decreased personal saving
Alternative Perceptions
We now examine how the estimated effect of social security wealth on consumer expenditures is affected by substituting alternative benefit assumptions in the Feldstein algorithm Feldstein (1974 p 911) ex- plains his benefit perception assumption In estimating the average
through 1971 In particular the coefficient of gross social security wealth for the period 1947-71 although insignificant was only slightly smaller 014 than the coefficient for the period 1929-71 021 As shown in table Al retained earnings are also no longer significant for either period when data through 1974 are used
JOURNAL OF POLITICAL ECONOMY
Ratio
Men
Women
1940 45 5 0 55 60 65 70 1975
Year
FIG I-Ratio of benefits per beneficiary to disposable income per capita
value of future benefits for a single surviving annuitant it would be wrong to assume that the schedule of benefits provided by law in year t would remain in effect The history of social security shows continu- ally rising benefit levels a fact that individuals no doubt perceive when they contemplate the order of magnitude of their own benefits at retirement age The ratio of annual benefits for retired workers (excluding dependents benefits) to per capita disposable income has varied without any trend around a mean level of 041
Figure 1 plots the ratio of average benefits in current payment status to disposable income per capita for men and for women over the period 1940-77 Whether or not one perceives a trend in the data it is clear that the ratio shows considerable variation This variation reflects changes in disposable income per capita during periods when the benefit structure was unchanged as well as a number of ad hoc and in the later years automatic benefit increases legislated by Con- gress Whether individuals adapted their benefit expectations to this variation ignored it or formed their expectations in entirely differ- ent ways is clearly open to speculation Thus it is important to exam- ine the sensitivity of estimated social security wealth effects to the underlying perception assumptions
Since we do not know how people form their perceptions of ex- pected future benefits we consider a number of reasonable ways in which individuals might form their estimates of the expected ratio of
613 CONFIRMATIONS AND CONTRADICTIONS
benefit per recipient to disposable income per ~ a p i t a ~ At one ex- treme as Feldstein assumes individuals might expect that a constant ratio of benefits to disposable income will be maintained over time At the other extreme individuals might expect that the current benefit ratio will be maintained Or individuals might form their expectations adaptively considering the history of past benefit ratios as well as the current ratio Another perception assumes that individuals use pub- lished actuarial projections to estimate future changes in the current benefit ratio The final perception we consider assumes that the indi- vidual is able to forecast perfectly the future course of the benefit ratio This perfect-foresight assumption corresponds to the tax perception adopted by Feldstein (1974)6 For the Feldstein constant- ratio perception we adopt the same assumption that Feldstein (1978 1979) used in extending his SSW series to 1974 that is the average benefit ratio for the period 1940-71 is used for the entire period 1937-74 All of the other perceptions assume that individuals con- tinually adjust their benefit expectations in response both to changing income levels and to amendments to the social security law including the major amendments in 1950 and 1972 In addition to these per- ceptions we also considered variants which assume that benefits re- main constant in real terms after retirement rather than increasing at the same rate as per capita income The results for these variants do not differ substantially from the results reported below
The gross and net social security wealth series constructed using these alternative perceptions are presented in Appendix tables A4 and A5 The benefit and tax ratio perception assumption was the only assumption in the Feldstein replica algorithm which was modified in computing these series
Consumer-expenditure functions estimated for the period 1930-74 using these alternative variables appear in table A2 of the Ap- pendix Results using the gross social security wealth variable are summarized in the upper portion of column 1 in table 37 The most important inference is that regardless of which benefit perception is used the coefficient of social security wealth is insignificant For the
These perception assumptions along with a number of other variants with similar results are described in detail in Leimer and Lesnoy (1980)
Individuals are assumed to anticipate correctly benefit ratios at retirement through 1977 (the last year for which data are available) and after 1977 anticipate that benefit ratios remain at 1977 levels After retirement individuals are assumed to anticipate correctly actual changes in benefit levels through 1980 and after 1980 anticipate constant real benefit levels
Table 3 summarizes regression results using the gross social security wealth variable only Results using the net social security wealth variable are similar and are presented in the Appendix for the full period 1930-74
JOURNAL O F POLITICAL ECONOMY
TABLE 3
S S WG VARIABLE (Algorithm and Perception)
1930-74 (1)
1947-74 (2)
1931-74 (3)
Feldstein replica algorithm 1 Constant ratio
(Feldstein perception) 2 Current ratio
3 Adaptive expectations
4 Perfect foresight
5 Actuarial projection
Leimer-Lesnoy algorithm 1 Constant ratio
2 Current ratio
3 Adaptive expectations
4 Perfect foresight
5 Actuarial projection
No~~ -F igu les in parentheses are 1-statistics The 1930-74 and 1931-74 I-egressions exclude the war yeat-s 1941-46
constant-ratio and perfect-foresight perceptions the coefficients of SSW are about O1 with t-ratios slightly larger than one The remain- ing perceptions yield coefficients close to zero with minuscule t-ratios
If we ignore the fact that all the social security wealth coefficients are statistically insignificant these coefficients imply decreases in sav- ing in 1974 ranging from $07 to $280 billion Actual real saving in 1974 was $613 billion
An Alternative Algorithm
In trying to replicate the Feldstein social security wealth variable we became aware of several shortcomings in the underlying assumptions and felt it important to test whether the estimated results were sensi- tive to a more careful construction of the variable A major weakness of the Feldstein construction involves his estimate of the number of persons who will become eligible for the various types of social secu-
615 CONFIRMATIONS A N D CONTRADICTIONS
rity benefits In particular his construction algorithm (i) fails to adjust for the substantial changes which have occurred over time in the conditional probability of becoming insured for benefits given the individuals current covered employment status (ii) ignores the im- portant changes which have occurred over time in the proportion of women eligible for retired worker benefits compared with those eligi- ble only for dependent wife and surviving widow benefits (iii) sub- stantially overestimates the number of aged nonbeneficiary social security wealth holders and (iv) fails to count many current female beneficiaries Our algorithm corrects these shortcomings and in ad- dition incorporates the changes in life expectancy which have oc- curred since 1930 and adjusts the social security wealth series for consistency with NIPA population datas A detailed description of the algorithm used to construct our social security wealth variables is given in Leimer and Lesnoy (1980)9
Consumer-expenditure functions estimated for the period 1930-74 using the Leimer-Lesnoy social security wealth variables appear in Appendix table A3 and are summarized in the bottom half of col- umn 1 in table 3 The coefficients of social security wealth for all per- ceptions are close to zero with very small t-ratios and imply little or no -
effect on saving Clearly the improved algorithm provides no evi- dence to support the view that social security has reduced saving
The Period of Estimation
The estimated relationship between consumer expenditures and so- cial security wealth is extremely sensitive to the period of estimation Thus far we have considered the full period 1930-74 excluding the years around World War 11 1941-46 When the Feldstein replica algorithm is used the social security wealth coefficients for this period are essentially zero except for the constant-ratio and perfect-foresight perceptions which have positive but insignificant coefficients Simi- larly the coefficients of the Leimer-Lesnoy variables are essentially zero for all perceptions
If we restrict the analysis to the postwar period 1947-74 a some- what different relationship is suggested The estimated coefficients of the social security wealth variables for this period are summarized in column 2 of table 31degWhether we use the Feldstein replica algorithm or the Leimer-Lesnoy algorithm for this period the coefficient of
Feldstein assumes constant life expectancies based on the 1959-61 life table eimer and Lesnoy (1980) also describe a number of other shortcomings of the
Feldstein algorithm which are addressed by our algorithm lo Complete regression results for the periods summarized in table 3 are available
from the authors
616 JOURNAL OF POLITICAL ECONOMY
social security wealth is now negative The coefficients are significant only for the constant-ratio and perfect-foresight perceptions how- ever and the absolute values of these coefficients appear unreason- ably largell In any event the postwar evidence is clearly inconsistent with the hypothesis that social security reduces saving12
T o explain the small t-ratios he obtains for the postwar period Feldstein argues that there is insufficient variation in the variables over that period to obtain precise estimates of the coefficients (see eg Feldstein 1979 pp 37 39) The results reported in table 3 do not support this argument On the other hand inclusion of the prewar period has its own problems This period was one of extraordinary trauma and change The social security program was in its infancy Estimates of social security wealth are particularly suspect during this period since no benefits were paid until 1940 and these were based on a benefit formula radically different from that passed in 1935 The social security wealth series begin in 1937 the first year for which coverage data are available But workers may well have formed some perceptions of social security wealth as early as 1935 when the origi- nal law was passed
There are many reasons for maintaining a degree of skepticism about results based on data including the prewar period Perhaps the most important is the sensitivity of the results to the specific years included For example suppose that we simply drop 1930 from the estimation period and use 1931 as the initial year Results for this period are summarized in column 3 of table 3 Simply dropping 1930 from the data set has the effect that all coefficient estimates for social security wealth become negative including those calculated when the Feldstein replica algorithm is used Again while none of the social security wealth coefficients estimated for this period is significant there is certainly no evidence of a negative relationship between social security and saving
It is important to note that our conclusions do not depend on whether the terminal year of the time periods is 1971 as in Feldstein (1974) or 1974 as in Feldstein (1978 1979) The only variable in
l1 When the Feldstein replica algorithm is used both of the significant coefficients for the postwar period imply that personal saving would have been negative in 1974 in the absence of the social security program The significant coefficients for the Leimer- Lesnoy variable imply that roughly two-thirds of personal saving in 1974 was induced by the social security program
l2 Tests for stability of coefficients for the subperiods 1930-40 and 1947-74 yielded mixed results (Tests were run only for regressions using gross social security wealth) For the constant-ratio and perfect-foresight perceptions the hypothesis that coefficients were the same in both periods was rejected at conventional significance levels For the current-ratio adaptive-expectations and actuarial projection perceptions the hypothe- sis that coefficients were the same was accepted These results held for SSW variables constructed using both the Feldstein replica and Leimer-Lesnoy algorithms
617 CONFIRMATIONS AND CONTRADICTIONS
table 3 whose coefficient and t-ratio show any appreciable change when 1971 is substituted as the terminal year is the (Feldstein) constant-ratio perception using the Feldstein replica algorithm with 1930 as the initial year its coefficient increases to 017 but remains insignificant with a t-ratio of 15913 The coefficients and t-ratios of all the other variables in table 3 remain essentially unchanged when 197 1 is substituted as the terminal year
Concluding Comments
The evidence considered in this paper encompasses a wide variety of social security wealth perception assumptions construction al-gorithms and time periods of analysis14 The time-series evidence which we have examined using Feldsteins specification of the consumer-expenditure function does not support the hypothesis that social security has substantially reduced personal saving in the United States If anything the postwar evidence suggests that social security may have increased saving
Although Feldsteins extended life-cycle model allows for the latter result if the retirement effect exceeds the asset-substitution effect we are personally skeptical that social security has increased saving Most of our results provide no statistically significant support for the hy- pothesis that social security has had an effect on saving either positive or negative This interpretation is narrowly consistent with Feldsteins extended life-cycle theory if historically the retirement effect has approximately balanced the asset-substitution effect It is also consis- tent with the Barro hypothesis that the introduction of social security simply induced offsetting reductions in private voluntary transfers It is also consistent with the view that the life-cycle model provides an inadequate explanation of individual saving behavior a view that is receiving increased attention (see eg Darby 1979 Kotlikoff and Summers 198 1)
Feldstein (1980 this issue) now contends that our conclusions result from a failure to correctly model how individuals perceptions of their social security wealth were altered by the 1972 Social Security amendments He argues that if the analysis is limited to 1930-71 the results (although not significant by conventional standards) support
l3 For 1931-71 the coefficient of this variable is 0006 with a t-ratio of 05 for 1947-71 the coefficient is -056 with a t-ratio of -309 Complete results for table 3 with 1971 as the terminal year are available from the authors
l4 A complete documentation of the Feldstein replica and Leimer-Lesnoy algorithms is available on request This documentation includes assumptions equations data sources input data and tables of output for each perception Listings of the gross wealth and tax liability series disaggregated by sex and age group are also available
618 JOURNAL OF POLITICAL ECONOMY
his original conclusions Alternatively he argues that if the years after 1971 are included the best way to incorporate the 1972 amendments is to compute a revised gross SSW series by simply increasing his corrected series by 20 percent beginning in 1972 When this revised variable is used he finds that his original conclusion is supported for the period 1930-74 He dismisses our algorithm on the basis that our modifications are inappropriate if not perceived by workers He similarly dismisses all of our alternative perception assumptions as introducing errors-in-variables biases if his perception assumption is correct
Space does not permit a detailed rejoinder to Feldstein A few comments are required however (for greater detail see Leimer and Lesnoy [I9811 and Lesnoy and Leimer [1981]) First we reemphasize that our conclusions do not depend on whether the terminal year of the period of analysis is 1971 or 1974 The results presented in this paper would be essentially the same if only data preceding the 1972 amendments were considered
Second Feldsteins assertion that we failed to incorporate the 1972 amendments is misleading All of our perception assumptions with the exception of the Feldstein constant-ratio perception incorporate the effect of the 1972 amendments (We differ in also incorporat- ing the effect of all other amendments) The Feldstein constant-ratio assumption is the same assumption Feldstein adopted when he first extended his SSW series and estimates to 1974 (see Feldstein 1978 1979) He now rejects this assumption
Third Feldsteins characterization of the 1972 amendments is in- correct and his 20 percent adjustment procedure is inconsistent with the actual postretirement price-indexing provision of that legisla- tion15 Correctly modeling this provision yields weaker and in-significant results
Fourth Feldsteins new results are hardly robust If we use Feld- steins revised variable but consider only the postwar period or if we drop early Depression years from the sample we obtain small in- significant results If we simply use the recently revised national income data Feldsteins results are weaker and no longer significant even for the full period
Fifth our alternative algorithm for constructing social security
l5 Feldstein suggests that the 1972 amendments not only introduced the price index- ing of benefits after retirement but also changed the determination of benefit awards from a nominal earnings basis to a wage-indexed earnings basis In fact the wage indexing of earnings to achieve constant benefit-to-earnings ratios was not introduced until the 1977 amendments Further although Feldstein points to the importance of the provision that postretirement benefits would grow at the same rate as prices his revised series implicitly assumes that postretirement benefits grow at the same rate as income per capita
619 CONFIRMATIONS AND CONTRADICTIONS
wealth provides better estimates of the number of persons likely to receive benefits Whether or not this provides better estimates of those expecting to receive benefits is not known of course But clearly coefficient estimates based on this algorithm cannot simply be dis- missed Not only does the evidence presented in table 3 contradict Feldsteins results but also if we use our algorithm to develop a variable parallel to Feldsteins revised variable we obtain small in- significant estimates of the SSW coefficient Thus Feldsteins conclu- sion depends not only on his revised perception assumption but also on his algorithm for computing social security wealth
Sixth Feldstein assumes that beginning in 1937 workers somehow formed a perception of the benefit ratio over the period 1940-71 ignored all amendments through 197 1 including the fundamental changes in the benefit structure enacted in 1939 and 1950 and then immediately and permanently reacted to the 1972 amendments We are skeptical that individuals perceptions of the benefit ratio were not altered by changes in legislation or by the decline in benefit ratios during the periods between legislation (as long as 11 years) Since no one knows how individuals perceptions are altered by such informa- tion we considered a range of alternative adjustment mechanisms including myopia adaptive expectations incorporation of actuarial benefit projections and perfect foresight None of these alternative assumptions about how individuals adjust their estimates of social security wealth in response to new information provides any statisti- cally significant evidence that social security reduces saving
Finally appeal to an errors-in-variables bias requires knowledge of the conceptually appropriate variable Despite Feldsteins arguments we simply do not know how-or even whether-individuals form perceptions of social security wealth Thus even if we were to accept Feldsteins new evidence as reasonable-and we do not-the time-series evidence as a whole would have to be viewed as inconclusive since we do not know which assumption describing individuals per- ceptions of social security wealth if any is most appropriate
We again emphasize that our empirical investigation has been lim- ited in this paper to the Feldstein specification of the consumer-expenditure function It is possible that the results will differ under alternative specifications or different variable construction^^^ It is unlikely however that additional time-series estimates will provide a definitive answer-in part because we simply do not know how indi- viduals perceive their social security wealth and in part because of the inherent difficulties of using time-series data
l6 Lesnoy and Leimer (1981) reexamine the specifications of Munnell (1974) Barro (1978) and Darby (1979) These latter studies all used the incorrect Feldstein SSW variable Our reexamination supports the findings of this paper
Appendix
TABLE A 1
Drrrbin- Sum of Period of SSW - Watson Squared
Equation Estimation Concept Source YD YD- RE W SSW Constant R Statistic Residuals -
( A l l ) 1930-74 Gross Feldstein
m (A 12) 1930-74 Gross Replication
N 0 (A13) 1930-74 Net Feldstein
(A 14) 1930-74 Net Replication
(A 15) 1947-74 Gross Feldstein
(A16) 1947-74 Gross Replication
(A17) 1947-74 Net Feldstein
(A 18) 1947-74 Net Replication
-- - - - - --
NOTE-1930-74 regressions exclude the years 1941-46 The Durbin-Watson statistic is adjusted for this gap Figures in parentheses arc 1-statistics
TABLE A2
CONSUMER-EXPENDITUREFUNCTIONSESTIMATED SSW VARIABLES ALTERNATIVE FELDSTEINUSING WITH PERCEPTIONS ALGORITHM
Durbin- Sum of SSW - Watson Squared
Equation Concept Perception YD Y D - RE W SSW Constant R2 Statistic Residuals
Gross Constant ratio (Feldstein replication)
Gross Current ratio
Gross Adaptive expectations
Gross Perfect foresight
Gross Actuarial projection
Net Benefits constant ratio Taxes constant ratio
Net Benefits current ratio Taxes current ratio
Net Benefits adaptive expectations Taxes adaptive expectations
Net Benefits perfect foresight Taxes perfect foresight
Net Benefits actuarial projection Taxes legislated
Net Benefits constant ratio Taxes perfect foresight (Feldstein replication)
NOTE-1930-74 excluding 1941-46 the Durbin-Watson statistir is adjusted for this gap Figures in parentheses are 1-statistics
- - - - - -L O
TABLE A4
GROSS SOCIAL SECCRITYWEALTHFOR ALTERNATIVE PLRCEPTIONSFELDSTEINALGORITHM
(in Billions of 1972 $)
Year Constant
Ratio Current
Ratio Adaptive
Expectations Perfect
Foresight Actuarial Projection
TABLE A5
NET SOCIAL SECURITYWEALTHFOR ALTERNATIVEPERCEPTIONSFELDSTEINALGORITHM(in Billions of 1972 $)
Constant Actuarial Ratio1
Constant Current Adaptive Perfect Projection1 Perfect o W
GROSSSOCIALSECURITYWEALTHFOR ALTERNATIVEPERCEPTIONS LEIMER-LESNOY (in Billions of 1972 $)ALGORITHM
Constant Current Adaptive Perfect Actuarial Year Ratio Ratio Expectations Foresight Projection
TABLE A7
NET SOCIAL SECURITYWEALTHFOR AI-TERNATIVEPERCEPTIONSLEIMER-LESNOYALGORITHM(in Billions of 1972 $) -- --
Year Constant
Ratio Current
Ratio Adaptive
Expectations Perfect
Foresight
Actuarial Projection1 Legislated
Constant Ratio1
Perfect Foresight
TABLE A7 (Cmtinued)
Constant Actuarial Ratio1
Constant CUI-rent Adaptive Perfect Projection1 Perfect Year Ratio R ~ t i o Expectations Foresight 1egislated FOI-esight
629 CONFIRMATIONS AND CONTRADICTIONS
References
Ando Albert and Modigliani Franco The Life Cycle Hypothesis of Sav- ing Aggregate Implications and Tests AER 53 (March 1963) 55-84
Barro Robert J Are Government Bonds Net Wealth JPE 82 no 6 (NovemberiDecember 1974) 1095- 1 1 17
The Impact of Social Security on Private Saving Washington American Enterprise Inst 1978
Darby Michael R Postwar US Consumption Consumer Expenditures and Saving AER Papers and Proc 65 (May 1975) 217-22
The Consumer Expenditure Function Explorations Econ Res 4 (Winter 1977-Spring 1978) 645-74
The Effects of Social Security on Income and the Capital Stock Washington American Enterprise Inst 1979
Esposito Louis Effect of Social Security on Saving Review of Studies Using US Time-Series Data Social Security Bull 41 (May 1978) 9-17
Feldstein Martin S Social Security Induced Retirement and Aggregate Capital Accumulation JPE 82 no 5 (SeptemberiOctober 1974) 905-26
Social Security and Saving T h e Extended Life Cycle Theory AER Papers and Proc 66 (May 1976) 77-86
Reply In The Impact of Social Securily on Private Saving by Robert J Barro Washington American Enterprise Inst 1978
Social Security and Private Saving Another Look Social Security Bull 42 (May 1979) 36-39
Social Security Induced Retirement and Aggregate Capital Ac- cumulation A Correction and Updating Working Paper no 579 Nat Bur Econ Res November 1980
Social Security and Private Saving Reply JPE this issue Kotlikoff Laurence Jand Summers Lawrence H The Role of Intergener-
ational Transfers in Aggregate Capital Accumulation JPE 89 no 4 (August 1981) 706-32
Leimer Dean R and Lesnoy Selig D Social Security and Private Saving A Reexamination of the Time Series Evidence Using Alternative Social Secu- rity Wealth Variables Working Paper no 19 Social Security Admin Office of Res and Statis Division of Econ Res 1980
Social Security Induced Retirement and Aggregate Capital Ac- cumulation A Correction and Updating-Comment Unpublished paper Social Security Admin Office of Res and Statis Division of Econ Res April 1981
Lesnoy Selig D and Leimer Dean R Social Security and Private Saving New Time Series Evidence with Alternative Specifications Working Paper no 22 Social Security Admin Office of Res and Statis Division of Econ Res 1981
Munnell Alicia H The Effect of Social Security on Personal Saving Cambridge Mass Ballinger 1974
TABLE A6
GROSSSOCIALSECURITYWEALTHFOR ALTERNATIVEPERCEPTIONS LEIMER-LESNOY (in Billions of 1972 $)ALGORITHM
Constant Current Adaptive Perfect Actuarial Year Ratio Ratio Expectations Foresight Projection
TABLE A7
NET SOCIAL SECURITYWEALTHFOR AI-TERNATIVEPERCEPTIONSLEIMER-LESNOYALGORITHM(in Billions of 1972 $) -- --
Year Constant
Ratio Current
Ratio Adaptive
Expectations Perfect
Foresight
Actuarial Projection1 Legislated
Constant Ratio1
Perfect Foresight
TABLE A7 (Cmtinued)
Constant Actuarial Ratio1
Constant CUI-rent Adaptive Perfect Projection1 Perfect Year Ratio R ~ t i o Expectations Foresight 1egislated FOI-esight
629 CONFIRMATIONS AND CONTRADICTIONS
References
Ando Albert and Modigliani Franco The Life Cycle Hypothesis of Sav- ing Aggregate Implications and Tests AER 53 (March 1963) 55-84
Barro Robert J Are Government Bonds Net Wealth JPE 82 no 6 (NovemberiDecember 1974) 1095- 1 1 17
The Impact of Social Security on Private Saving Washington American Enterprise Inst 1978
Darby Michael R Postwar US Consumption Consumer Expenditures and Saving AER Papers and Proc 65 (May 1975) 217-22
The Consumer Expenditure Function Explorations Econ Res 4 (Winter 1977-Spring 1978) 645-74
The Effects of Social Security on Income and the Capital Stock Washington American Enterprise Inst 1979
Esposito Louis Effect of Social Security on Saving Review of Studies Using US Time-Series Data Social Security Bull 41 (May 1978) 9-17
Feldstein Martin S Social Security Induced Retirement and Aggregate Capital Accumulation JPE 82 no 5 (SeptemberiOctober 1974) 905-26
Social Security and Saving T h e Extended Life Cycle Theory AER Papers and Proc 66 (May 1976) 77-86
Reply In The Impact of Social Securily on Private Saving by Robert J Barro Washington American Enterprise Inst 1978
Social Security and Private Saving Another Look Social Security Bull 42 (May 1979) 36-39
Social Security Induced Retirement and Aggregate Capital Ac- cumulation A Correction and Updating Working Paper no 579 Nat Bur Econ Res November 1980
Social Security and Private Saving Reply JPE this issue Kotlikoff Laurence Jand Summers Lawrence H The Role of Intergener-
ational Transfers in Aggregate Capital Accumulation JPE 89 no 4 (August 1981) 706-32
Leimer Dean R and Lesnoy Selig D Social Security and Private Saving A Reexamination of the Time Series Evidence Using Alternative Social Secu- rity Wealth Variables Working Paper no 19 Social Security Admin Office of Res and Statis Division of Econ Res 1980
Social Security Induced Retirement and Aggregate Capital Ac- cumulation A Correction and Updating-Comment Unpublished paper Social Security Admin Office of Res and Statis Division of Econ Res April 1981
Lesnoy Selig D and Leimer Dean R Social Security and Private Saving New Time Series Evidence with Alternative Specifications Working Paper no 22 Social Security Admin Office of Res and Statis Division of Econ Res 1981
Munnell Alicia H The Effect of Social Security on Personal Saving Cambridge Mass Ballinger 1974