This PDF is a selection from an out-of-print volume from the National Bureau of Economic Research Volume Title: Social Security and Retirement around the World Volume Author/Editor: Jonathan Gruber and David A. Wise, editors Volume Publisher: University of Chicago Press Volume ISBN: 0-226-31011-6 Volume URL: http://www.nber.org/books/grub99-1 Publication Date: January 1999 Chapter Title: Social Security and Retirement in Spain Chapter Author: Michele Boldrin, Sergi Jimenez-Martin, Franco Peracchi Chapter URL: http://www.nber.org/chapters/c7255 Chapter pages in book: (p. 305 - 353)
Transcript
This PDF is a selection from an out-of-print volume from the National Bureauof Economic Research
Volume Title: Social Security and Retirement around the World
Volume Author/Editor: Jonathan Gruber and David A. Wise, editors
Volume Publisher: University of Chicago Press
Volume ISBN: 0-226-31011-6
Volume URL: http://www.nber.org/books/grub99-1
Publication Date: January 1999
Chapter Title: Social Security and Retirement in Spain
Social Security and Retirement in Spain Michele Boldrin, Sergi Jimenez-Martin, and Franco Peracchi
Public pensions represent the most important welfare program in Spain, ab- sorbing almost 70 percent of the total expenditure for social protection pro- grams, and representing about 11.5 percent of GDP in 1994. The average an- nual growth rate of public pension expenditures over the period 1980-95 has been 13.1 percent, about 1.5 times higher than the GDP growth rate.
All available studies indicate a progressive worsening of the financial situa- tion of the social security system (sisternu de la seguridud social), the most important public pension program in Spain. While we concentrate here on the retirement incentives provided by the current system without addressing the system’s long-run viability, a brief overview of its aggregate evolution is useful to place the subsequent analysis in the proper perspective.
The fraction of annual social security expenditures that is covered through direct contributions, from either workers or employers, has decreased steadily from 89.4 percent in 1980 to 66 percent in 1995, the difference being made up by increasingly large transfers from the government. Even the most optimistic projections forecast a continuous increase in the current account deficit of the Spanish social security system. Normalizing to zero the deficit of the pension system in 1995, the deficit in 2010 is expected to range between 0.8 and 3.5 percent of GDP (Herce 1997). The worsening of the deficit reflects the expec- tation that the growth of social security revenues will not be able to keep up
Michele Boldrin is the Marc Rich hofessor of Economics at Universidad Carlos I11 de Madrid and a research associate of the Center for Economic Policy Research. Sergi Jimenez-Martin is assistant professor of economics at Universidad Carlos 111 de Madrid. Franco Peracchi is professor of econometrics at the Universiti di Pescara.
The authors thank Jon Gruber and David Wise for their comments, Almudena Duran and Vincenzo Galasso for helpful discussions, and Luis Martin for research assistance. Financial sup- port from the Direccion General de Investigacion Cientifica y Tecnica (project PB94-0378). the Comision Interministerial de Ciencia y Technologia (project SEC96-0738), the Fundaci6n Banco de Bilbao Vizcaya, and the Fnndaci6n Marc Rich is gratefully acknowledged.
305
306 Michele Boldrin, Sergi Jimenez-Martin, and Franco Peracchi
Table 8.1 Annual Growth Rates of Real Pension Expenditures, Number of Pensions, and Real Average Pension (1994 prices), 1980-95
Type of Pension ~~ ~
Old Other Age Disability Widows Orphans Relatives Total
Pension expenditures: 1980-85 1985-90 1990-95
1980-85 1985-90 1990-95
1980-85 1985-90 1990-95
Number of pensions:
Average pension:
5.5 5.9 5.8
2.4 2.9 3.2
1.8 2.7 2.4
9.3 3.5 3.9
7.3 I .6 1.3
I .3 2.3 2.2
4.6 7.8 6.3
4.7 4.0 3.5
- .9 3.7 2.1
3.2 2.2 1.4
2.5 I .0 .7
.3 1.4 .3
4.9 6.4 3.5 5.5 6.3 5.3
3.7 4.2 3.0 2.8
12.1 2.8
-1 .1 1 . 1 .9 2.6
-4.1 2.3
Source: Ministerio de Trabajo (1995)
with the strong increase in social security expenditures, which should grow in real terms between 2.5 and 3.2 percent annually over the next two decades.
As we explain in more detail below (sec. 8.2), the current social security system provides five types of contributory pensions: old age, disability, survi- vor, orphan, and other relatives. Over the three subperiods 1980-85, 1985-90, and 1990-95, total expenditure on each type of contribution-based pension has grown in real terms at annual rates given in table 8.1. The most important source of pension expenditure growth has been demographic change, followed by the widening of coverage and the increase in real average pensions. We now provide some aggregate indices of the more recent evolution of these three factors.
Life expectancy at birth has increased by seven years over the last three decades, from 69.9 years in 1960 to 76.9 in 1991. This, together with the con- current sharp decline in birth rates and the effect of the aging baby boomers, is reflected in figure 8.1, which presents the basic trends in the structure of the population of working age (sixteen and over) over the last twenty years. We distinguish between three broad age groups: sixteen to twenty-four, twenty- five to fifty-four, and fifty-five and over. The fraction of the age group sixteen to twenty-four reached a peak between 1982 and 1987 and has been falling ever since. The fraction of the age group twenty-five to fifty-four declined until 1988 and is now rising as the baby boomers get older. On the other hand, the fraction aged fifty-five and over has been increasing steadily, although at a de- creasing rate.
Over the three intervals 1980-85, 1985-90, and 1990-95, the annual growth
307 Social Security and Retirement in Spain
0 aged 16-24 0 aged 551
a aged 25-54 1 I I l I l l l 1 1 1 1 l 1 1 1 1 1 1 1 1 1
i i l I I I I I , I I , l I I I , I l l l l l t 7 5 80 85 90 95
year
Fig. 8.1 Age structure of the population of working age (16 and over) by year
rate of the total number of public pensions has been equal to 4.2, 2.8, and 2.8, percent, respectively (table 8.1 above). As of 1994, the total number of contributory pensions outstanding was equal to 6.9 million, according to offi- cial social security records, of which 3.2 million are old age, 1.7 million dis- ability, 1.8 million survivor, 168,000 orphan, and 42,000 other relatives.
The third factor, namely, the increase in the real value of average pensions, is also captured in table 8.1, which reports the annual growth rate of real average pensions for each group and time interval. Notice that Spanish pensions are not particularly generous, at least with respect to the European average. For example, the average pension in 1994 was equivalent to only 47 percent of per capita GDP, against a European average of 62 percent. In the same year, the average pension was equal to 63 percent of the average wage, and 70 percent of the pensions were below the minimum wage.
This fact suggests, as a tentative hypothesis, that the financial imbalance of the Spanish system may come not from its particular generosity but, instead, from other factors. The aggregate data reported above illustrate two of these other factors: the dramatic shift in the demographic structure and the rapid growth of the public pension system. As illustrated in section 8.2 below, the
308 Michele Boldrin, Sergi Jimenez-Martin, and Franco Peracchi
latter has come about since 1972 through the extension of coverage to various groups with either very short contribution histories or a very low contribution- to-pension ratio.
A third determinant of the system’s financial imbalance is the loss of contri- butions and the increase in pension payments induced by the shortening of professional lives and the parallel growth of early retirement. In this study, we try to document the extent to which this third factor may be “endogenous” to the social security system. We show that Spanish social security legislation generates strong incentives to retire early and that Spanish workers tend to do so.
The rest of this paper is organized as follows. Section 8.1 presents some basic facts about labor market behavior and the social insurance use of older workers in Spain. Section 8.2 describes the evolution of the Spanish system since its inception and illustrates in relative detail its current institutional fea- tures. Section 8.3 presents a set of simulations that illustrate the incentive ef- fects of the current system on labor market participation and retirement deci- sions. Section 8.4 offers some conclusions. Finally, appendix A describes the main data sets used and other sources of information about retirement behavior in Spain, and appendix B briefly reviews the recent literature about retirement in Spain.
8.1 The Labor Market Behavior and Social Insurance Use of the Elderly
8.1.1 Historical Trends
Figures 8.2 and 8.3 show the historical trends in labor force participation rates of older men and women for four age groups: forty-five to fifty-four, fifty- five to fifty-nine, sixty to sixty-four, and sixty-five and over. The data are taken from Ferndndez Cord6n (1996) and consist of tabulations based on the Spanish labor force survey (Encuesta de Poblaci6n Activa, or EPA) for the period
Male labor force participation rates have been falling for all age groups con- sidered. The sharpest decline is for those aged sixty-five and over and sixty to sixty-four. While 40 percent of men aged sixty-five and over were labor force participants in 1965, by 1994 this percentage was down to about only 5 per- cent. The fall for those aged sixty to sixty-four starts a little later but is equally impressive, from about 85 percent in 1970 to a little over 40 percent in 1994. The decline for the other two age groups is less dramatic, although it is worth noticing that, by 1994, the labor force participation rate of men aged fifty-five to fifty-nine was down to about 70 percent and that the negative trend seems to be continuing.
Female labor force participation rates present a mixed picture, with a clear downward trend only for women aged sixty-five and over. For the other age
1965-94.
0 age 45-54 0, age 60-64
A age 55-59 age 6%
100
90
80
10
! 60 .-
E 8 50
4 0
30
20
10
0
c
1 I I I I I I 65 70 1 5 80 85 90 94
year
Fig. 8.2 Historical trends in the labor force participation of older men
0 aqe 45-54 0 age 60-64 age 65t
A age 55-59
J I I I I I I
100
90
80
t: 7 0 .- g
!2 e: 50
3 60
40
I 1 I I I I I
65 7 0 75 8 0 85 90 94 year
Fig. 8.3 Historical trends in the labor force participation of older women
310 Michele Boldrin, Sergi Jimenez-Martin, and Franco Peracchi
year
Fig. 8.4 Fraction of workers covered by the social security system
groups considered, we observe a small decline in the second half of the 1960s, followed by a rise in the first half of the 1970s and a subsequent slow decline lasting until the mid-l980s, when female labor force participation rates start increasing again, at least for women younger than age sixty.
Figure 8.4 shows the fraction of workers covered by the social security sys- tem. The denominator of the ratio is obtained by projecting to the population level the employment rate resulting from the EPA. The numerator is the num- ber of workers contributing to the old age and disability insurance program (SOVI) for the period 1964-75 and the number of workers affiliated with the social security system (en ultu luborul) after 1979. The data for the period 1976-79 are not reported because they are considered to be of poor quality and fundamentally unreliable.
In 1964, only half the workers were covered by mandatory insurance. Since then, the proportion covered has grown steadily. This is due mainly to the pro- gressive integration into the social security system of a number of professional pensions schemes (rnutualidudes), to the legislation of mandatory public pen- sion for many categories of self-employed workers, and to the widening of the coverage offered under the disability insurance plan. Historical details are provided in the next section.
Notice that the number of workers covered by social security has surpassed,
311 Social Security and Retirement in Spain
0 oAS/DI, Hen OAS, Hen 0 OASIDI, women OM, Women
I I I I I I I
I I I I I I I 65 1 0 15 80 85 90 95
year
Fig. 8.5 Old age and survivor (OAS) and disability (DI) pension receipt among people aged 55 and over
in the most recent years, the official employment level. This provides strong support for the view that the EPA grossly underestimates the actual level of employment (and overestimates, consequently, the level of unemployment). For more details on this issue, see, for example, Villagarcia (1995).
Figure 8.5 shows the share of the population aged fifty-five and over receiv- ing old age, disability, or some other type of pension. Data are again from the EPA, which asks respondents to report their status in the week before the sur- vey, distinguishing between being retired, being permanently disabled, and re- ceiving another pension different from old age or disability. The latter category is particularly important for women since it includes survivor pensions. The upper profile indicates the fraction of older men receiving public pensions. The profile immediately below indicates the fraction of older men receiving old age or survivor pensions. The lower profiles correspond to females.
The figure shows clearly the steady increase in pension receipt rates. The nature and the dynamics of the benefits, however, are quite different between the two sexes. Most men aged fifty-five and over receive old age or disability pensions, whereas survivor pensions are by far the most common type of bene- fit among women. In particular, for the years after 1986, for which a reliable comparison can be made, the growth rate of survivor pensions among females
312 Michele Boldrin, Sergi Jimenez-Martin, and Franco Peracchi
: retirement men 0 disability men
a retirement. women dlsablllty. women
1.2 1 t
- i
__ J I ~- ~- 6 i
I -~~~~ 72 75 80 85 90 91
year pension was awarded
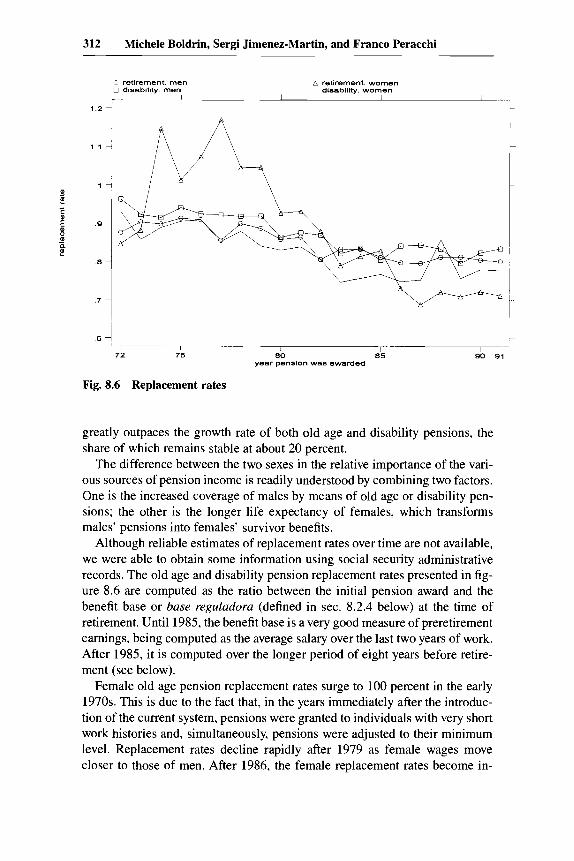
Fig. 8.6 Replacement rates
greatly outpaces the growth rate of both old age and disability pensions, the share of which remains stable at about 20 percent.
The difference between the two sexes in the relative importance of the vari- ous sources of pension income is readily understood by combining two factors. One is the increased coverage of males by means of old age or disability pen- sions; the other is the longer life expectancy of females, which transforms males’ pensions into females’ survivor benefits.
Although reliable estimates of replacement rates over time are not available, we were able to obtain some information using social security administrative records. The old age and disability pension replacement rates presented in fig- ure 8.6 are computed as the ratio between the initial pension award and the benefit base or base reguladora (defined in sec. 8.2.4 below) at the time of retirement. Until 1985, the benefit base is a very good measure of preretirement earnings, being computed as the average salary over the last two years of work. After 1985, it is computed over the longer period of eight years before retire- ment (see below).
Female old age pension replacement rates surge to 100 percent in the early 1970s. This is due to the fact that, in the years immediately after the introduc- tion of the current system, pensions were granted to individuals with very short work histories and, simultaneously, pensions were adjusted to their minimum level. Replacement rates decline rapidly after 1979 as female wages move closer to those of men. After 1986, the female replacement rates become in-
313 Social Security and Retirement in Spain
deed lower than the male replacement rates. In all other cases, the figure shows a steady decline of replacement rates over the period considered, which be- comes more pronounced after the 1985 reform (see the next section). Because of the way in which the initial pension is computed (see sec. 8.2.3 below), this phenomenon suggests a continuous reduction in either the number of contribu- tory years or the age of retirement or both. The existence of strong incentives to early retirement is, in our view, a critical feature of the Spanish social secu- rity system. We return to a detailed analysis of this issue in the last two sections of the paper, where we argue that the main incentive to early retirement comes from the generous mechanism determining the minimum pension.
8.1.2 Contemporaneous Age Patterns This section focuses on the age range from forty-five to seventy-five. Unless
indicated otherwise, the data are tabulations based on the pooled EPAs for the second quarters of the years 1993-95.
These results are consistent with the ones obtained using the 1990-91 Household Budget Survey (Encuesta de Presupuestos Familiares, or EPF), which we do not report.
Figure 8.7 compares cross-sectional labor force participation rates by age for men and women. At age forty-five, female labor force participation rates
0 men A women J 1 I I I I I
1
.9
. a
.1 *- ! B -
E . 5
c . 6 ._
5
. 4
.3
. 2
.1
0
1 I I I I I I 4 5 75 70 5 0 5 5 6 0 6 5
age
Fig. 8.7 Participation rates by age and sex
314 Michele Boldrin, Sergi Jimenez-Martin, and Franco Peracchi
83 employed unemployed 0 disabled retired
I I I I 1 1 I
1
I I I I I I I I
4 5 50 5 5 60 65 I 0 15 aye
Fig. 8.8 Distribution of activities of men by age
are less than 50 percent, about half those of men. After that age, labor force participation rates decline steadily, with noticeable differences between the two sexes. For women, labor force participation rates decline linearly, with a sizable jump only at age sixty-five. For men, the decline tends instead to accel- erate with age, at least until age sixty-five, and shows two noticeable jumps at ages sixty and sixty-five.
Figures 8.8 and 8.9 show, for each age, the distribution by main activity (employed, unemployed, disabled, and retired) separately by sex. Overall, the patterns of labor force participation rates are confirmed, but two interesting features appear, common to both men and women. First, the fraction of the population classified as unemployed declines rapidly with age. Second, the residual fraction of individuals not belonging to any of the previous four cate- gories (not reported in the figures) increases steadily until age sixty-five, when it suddenly falls. This downward jump is due to the award of noncontributory old age pensions to people aged sixty-five who were previously out of the labor force or covered by other welfare programs (see below). After age sixty-five, there are almost no men left in the residual category, whereas the fraction of women classified in this category declines owing the increase in the fraction receiving survivor pensions.
The next set of figures is based on the Spanish Household Budget Survey
315 Social Security and Retirement in Spain
1
.9
.8
. 7
.6 5 r B ,5
4
.3
. 2
. I
0
8:) employed 0 disabled
unemployed retired
1 I I I I I 45 50
5 5 age 60 65 i a 1 5
Fig. 8.9 Distribution of activities of women by age
(EPF) for 1990. These figures are meant to assess the extent to which transfers from the social security system affect the income of older men and women.
Figure 8.10 shows the fraction of men who receive some form of public income at each age. Public income, identified in the EPF with welfare pay- ments (prestuciones sociales), is broken down into three categories: old age and survivor pensions, disability pensions, and other welfare payments.
The fraction of men receiving disability pensions increases sharply right before age sixty-five, suggesting a strategic use of this kind of pension to antic- ipate retirement and avoid the cuts that the legislation would otherwise impose on old age pensions. In fact, those who are declared disabled can stop working, collect a disability pension immediately, and still receive their old age pension in full once they reach age sixty-five. For individuals who have already cumu- lated thirty-five years of work, are younger than age sixty-five, belong to social security regimes that do not allow for early retirement, and do not expect any substantial real wage increase, the “disabled first, retired later” strategy is clearly a dominant one.
A precise assessment of the number of those who participate in or receive income from private pension schemes is very hard to come by, owing to the lack of data. Figure 8.11 reports data from the EPF and gives a breakdown of the sources of family income (earnings, assets, private pensions, and public
0 OAS pension 0 DI pension
a unemployment benef i t s other public assistance
1
.9
.8
5 .l
E * .6 c t . 5
4
. 3
. 2
.1
I
i /
0 4 I
I I I I I I 45 50 55 60 65 70 1 5
age
Fig. 8.10 Public income receipt by age for men
0 earnings 0, private pensions
capi ta l income public programs
1
. 9
. 8
. 7
.6
fi . 5
4
.3
. 2
. l
70 75
0 65
4 5 50 55 60 age of head
Fig. 8.11 Distribution of family income by source
317 Social Security and Retirement in Spain
transfers) by the age of the (male) family head. The graph suggests the irrele- vance of private pensions. Notice that the fraction receiving such transfers, besides being almost negligible (less than 3 percent) for both men and women, remains practically constant at all ages.
8.2 Institutional Features of Social Security
8.2.1 Historical Evolution
Mandatory insurance for job-related accidents was introduced in 1900, through a bill that also authorized the creation of some funds, for public em- ployees only, paying disability and retirement pensions.
In 1919, mandatory retirement insurance (retiro obrero obligatorio) was in- troduced for private-sector employees aged sixteen to sixty-five whose total annual salary was below a certain threshold. Contributions to the fund came from both the employer and the employee in a three-to-one ratio.
In 1926, a universal pension system for public employees (R6gimen de Clases Pasivas, or RCP) was established, providing a minimum pension and the option of contributing, out of the salary and up to a maximum amount, toward a complementary pension. By the late 1930s, most Spanish employees were covered, in one form or another, by some minimal, government-mandated retirement insurance program.
With the end of the Republic and the advent of Franco’s regime, a number of more or less connected changes were implemented. In 1939, workers’ retire- ment (retiro obrero) was replaced by old age insurance (seguro de vejez). While the former was based on a capitalization system, the latter was from the beginning a completely unfunded, pay-as-you-go scheme. At the same time, the regime promoted the creation of complementary pension funds, called mu- tualidudes y montepios laborales, which were jointly managed by the Ministry of Labor and the regime-sponsored trade unions.
By 1950, the system had acquired its basic organization in two pillars, which remained essentially unchanged until the mid- 1970s, when the collapse of the dictatorial regime brought about major changes. Public servants were all cov- ered by the RCP, while private-sector employees with annual earnings below a certain ceiling were covered by old age insurance. Both public and private employees could also enroll in complementary pension plans (the mutuali- dudes), which, despite their apparently private nature, were under complete government control.
Variability in benefit and tax rates across different professional groups and sectors of activity was not negligible. A ceiling on covered earnings was legis- lated in 1950 and updated more or less regularly after that. For most mutuali- dudes, covered earnings were computed as the average annual salary over a period of twenty-four consecutive months chosen by the retiree within the last seven years of work.
318 Michele Boldrin, Sergi Jimenez-Martin, and Franco Peracchi
8.2.2 Major Reforms since 1960 The 1963 Social Security Act (Ley de Bases de la Seguridad Social) elimi-
nated the income ceiling for enrollment in old age insurance, unified the vari- ous contributions for retirement, disability, etc. in a general social security con- tribution, and modified the percentages contributed by the employer and the employee.
Another consequence of the 1963 reform was the creation of a very large number of special funds (regimenes especiales) next to the general scheme (rkgimen general), generating a jungle of special treatments and privileges for sectors and categories that either were politically close to the regime or enjoyed the support of a particularly strong trade union.
The 1963 act also defined, for each professional group and sector of activity, the tax base (bases de cotizacidn) on which social security taxes were levied. This tax base, however, had little to do with actual earnings. The difference between the two increased sharply over time until the 1972 reform, which ef- fectively linked the tax base to wages (overtime pay excluded).
Besides linking the tax bases to actual wages, the 1972 bill also loosened significantly the eligibility criteria and began undoing the system of mutuali- dudes by establishing common replacement rates in place of the previous sys- tem, under which each category had its own. Finally, it established the prin- ciple that pensions should be indexed to both the cost of living and real wage growth.
In 1977, a reform bill made a first attempt at harmonizing the many existing funds by reducing the differences in the treatment they offered and by putting (in 1979) the administration of the whole system under the newly created Na- tional Social Security Institute (Instituto Nacional de la Seguridad Social, or INSS). Overall, this process increased the percentage of workers covered by the public social security system, as it is clearly reflected by the aggregate data reported in the previous section.
The last major reform process, which came to shape the current regime, began in 1985. Three important changes were introduced. First, eligibility cri- teria for disability pensions were tightened. Second, the minimum number of years of contributions required to obtain an old age pension was increased from eight to fifteen. Third, the number of years entering the computation of the benefit base was increased from two to eight. The reform also provided for a reduction in the number of existing special funds, either through their integra- tion in the general scheme or by merging them together. This process, which began in 1986, is not yet completed as various small groups of public employ- ees retain their privileges. Overall, the 1985 reform had a greater effect on the replacement rates than on the percentage of covered workers as the latter had already reached a very high level.
In 1986, the Spanish government established a public health insurance sys- tem (INSALUD) covering the whole population, which was largely financed
319 Social Security and Retirement in Spain
by contributions to the social security system. This arrangement ended with the budget year 1989, when the whole cost of INSALUD was attributed to the general government budget. A set of regulations for complementary private pension plans was introduced in 1987 and further modified in 1995.
Another important change was the introduction, in 1990, of noncontributory pensions for elderly people aged sixty-five and over and for disabled people aged eighteen and over who live in households with incomes below a certain minimum and satisfy a residency requirement. The financing of these noncon- tributory pensions is attributed to the general government budget.
Finally, on 26 June 1997, after this paper had been completed, Parliament introduced a number of changes in the parameters to be used for the computa- tion of benefit bases and pensions. The number of contributive years over which the benefit base is computed will progressively increase from the current eight to fifteen between now and 2001. The formula for the computation of the replacement rate cx (see below) has also been made less generous, whereas the 8 percent per year penalty applied to early retirees between the ages of sixty and sixty-five is reduced to 7 percent for those individuals with forty or more years of contributions at the time of retirement.
8.2.3 The Current Situation Under the current legislation, public contributory pensions are provided by
the following programs: a) The General Social Security Scheme (RCgimen General de la Seguridad
Social, or RGSS) and Special Social Security Schemes (Regimenes Especiales de la Seguridad Social, or RESS) cover all private-sector employees, self- employed workers, professionals, members of cooperative firms, employees of most public administrations other than the central government (e.g., municipal- ities, local corporations), the clergy, convicted individuals working while in jail, professional athletes, members of Parliament, and unemployed individuals who comply with the minimum number of contributory years when reaching age sixty-five. The general and the special schemes together covered 12.4 mil- lion workers in 1996, of which 8.7 million (70 percent) were covered by RGSS and the remaining 3.7 million (30 percent) by RESS.
The latter include five special schemes set up for particular classes of work- ers: (1) the self-employed (RCgimen Especial de Trabajadores Aut6nomos, or RETA), covering 2.3 million workers on average during 1996; ( 2 ) agricultural workers and small farmers (RCgimen Especial Agrario, or REA), covering about I .2 million workers in 1996, of which 65 percent are employees and the remaining 35 percent self-employed; (3) domestic workers (RCgimen Especial de Empleados de Hogar, or REEH), covering 144,000 individuals in 1996; (4) sailors (RCgimen Especial de Trabajadores del Mar, or RETM), covering 82,000 workers in 1996, of which 84 percent are employees and the remaining 16 percent are self-employed; and (5) coal miners (RCgimen Especial de la Mineria del Carbbn, or REMC), covering 28,000 workers in 1996.
320 Michele Boldrin, Sergi Jimenez-Martin, and Franco Peracchi
b) The government employees scheme (Rkgimen de Clases Pasivas or RCP) includes public servants (both military and civil) currently employed by the central government and its local branches. It also covers, through a number of small special funds, all civil war veterans and survivors, a variety of semipublic employees, the victims of terrorist attacks, etc. The number of workers covered by RCP was 806,000 in 1994.
c) The Special Funds are the remnants of the old mutuulidudes y montepios, paying small supplementary pensions and providing basic health insurance to certain groups of civil servants (MUFACE), military personnel (ISFAS), and members of the judiciary system (MUCEJU). These pensions complement the basic ones paid by RCP or RGSS.
d ) The Insurance Systems of Regional Governments and Local Administra- tions are small programs, covering employees of certain regional governments or local administrations, and are financed through transfers from the central government.
e ) Finally, there exists a long array of small pension plans, covering employ- ees of other institutions (e.g., the Bank of Spain, a number of formerly public banks, many local corporations, special branches of some regional govern- ments, etc.), that managed to maintain their special treatments despite the pro- cess of homogenization started in the 1980s.
The legislation approved by Parliament on 26 June 1997 establishes the pro- gressive elimination of all the special regimes by the year 2001. Aside from the pension scheme for public employees (RCP), the Spanish social security system will then be structured around only two “schemes” for the private sec- tor: one for employees and one for the self-employed.
The number of workers affiliated with the general scheme increased from 6.7 million in 1982 to 8.7 million in 1996. As we have argued already, a large part of this growth simply reflects the progressive incorporation of a variety of previously autonomous funds. At the same time, the number of people affili- ated with the special schemes decreased from 3.9 to 3.7 million. Overall, the number of people affiliated with social security (excluding RCP and the smaller funds) increased from 10.6 million in 1982 to the current 12.4 million.
Figure 8.12 shows the distribution of those affiliated with social security (excluding RCP) by program. The fraction affiliated with the general scheme grew from about 63 percent in 1982 to about 70 percent in 1996, with a corre- sponding decline in the fraction affiliated with the special schemes. It is inter- esting to note that all special schemes except that for the self-employed have lost affiliates. The decline has often been dramatic, as in the case of domestic workers and small farmers.
8.2.4 The General Scheme This section describes the rules governing old age and survivor pensions
under the general scheme (RGSS), the main social security program in Spain and the benchmark for our simulations. Many of these rules also apply to the
321 Social Security and Retirement in Spain
0 RGSS A RGSS+REA RGSSIREAtRETA RGSStREAtRETAIREEH
J I I I I I I L
1 I I I I I I I 82 84 8 6 88 90 92 91 96
year
Fig. 8.12 Distribution of affiliation to social security by program (general scheme [RGSS], self-employed [RETA], agricultural workers and small farmers [REA], domestic workers [REEH]), annual averages, 1982-96
special schemes (RESS) and the scheme for government employees (RCP). The main differences will be noted below when we discuss these other pro- grams.
Financing
RGSS is a pure pay-as-you-go scheme financed partly by contributions from earnings (about two-thirds in 1996) and partly by transfers from the govern- ment budget (about one-third in 1996).
Contributions are a fixed proportion of covered earnings, defined as total earnings, excluding payments for overtime work, between a floor and a ceiling that vary by broadly defined professional category Currently, eleven categories are distinguished. For the first seven, floors and ceilings apply to monthly earn- ings. These floors and ceilings are shown in table 8.2 for the years 1990 and 1996. They are approximately equal to, respectively, the professional mini- mum wage and three times the professional minimum wage. For the last four categories, floors and ceilings apply to daily earnings and are not reported in the table.
As the table shows, a process of slow convergence between floors and ceil-
322 Michele Boldrin, Sergi Jimenez-Martin, and Franco Peracchi
Table 8.2 Floors and Ceilings on Monthly Earnings (PTA 1,000 at current prices)
I990 I996
Professional Category Floor C e i 1 in g Floor Ceiling
Engineers and college graduates 87. 150 29 1.540 I 13.070 374.880
ings and across categories is in place. This process is generated by asymmetri- cal inflation adjustments and an intentional effort to control total expenditures on pensions by slowing down the growth of the higher ones. Over time, these modifications have substantially weakened the link between covered earnings and lifetime wage and work effort, especially for workers earning relatively high wages and salaries.
Social security tax rates have fluctuated over time, being lowered in the early 1980s and increased afterward. The current tax rate is 28.3 percent (it was 29.3 percent until January 1995), of which 23.6 percent is formally attributed to the employer and the remaining 4.7 percent to the employee. A tax rate of only 14 percent is levied on most earnings from overtime work, of which 12 percent is paid by the employer and the remaining 2 percent by the employee.
Eligibility
Entitlement to an old age pension requires the number of years of contribu- tions to be at least fifteen (only eight were required until 1985), of which at least two must be within the last eight years immediately before retirement.
As a general rule, recipiency is conditional on having reached age sixty-five and is incompatible with income from any employment that requires affiliation to social security.
Benejit Computation
sixty-five or over who retires in month t after n His initial monthly pension P, is computed as
Suppose that the eligibility conditions are met, and consider a person aged 15 years of contributions.
where the benefit base (base reguladora) BR, is a weighted average of covered monthly earnings W , , over a reference period that consists of the last eight years before retirement,
323 Social Security and Retirement in Spain
and I , , is the consumer price index for the jth month before retirement.
and is equal to The replacement rate a,, depends on the number of years of contributions
if n < 15, if 15 I n < 35, 6 if 35 I n .
an = .6 + .02(n - 15)
It may be further adjusted in the case of early retirement, as described in the next section.
A few remarks are in order. First, after fifteen years of contributions, the pension is already equal to 60 percent of the benefit base. After thirty-five years of contributions, the pension is equal to the benefit base, and there is no direct advantage from contributing further, although contributions are mandatory un- til retirement.
Second, if there were no inflation and no wage growth in the reference pe- riod, that is, if w,-, was constant over the last eight years, then the benefit base would be equal to 6/7 = 257 of the last monthly social security wage. This is because pensions (and, usually, salaries) are paid in fourteen monthly install- ments, whereas monthly social security contributions are levied on yearly sala- ries divided by twelve. For a person with thirty-five years of contributions, the annual benefit base would then be equal to the last annual wage.
Third, earnings in the last two years before retirement are not adjusted for inflation. For earlier months, they are adjusted and converted to money equiva- lents of the twenty-fifth month before retirement. In periods of high inflation, these aspects of the benefit formula imply that the benefit base may be well below the average real wage in the last eight years.
Fourth, beginning 15 July 1997, the number of reference years will be in- creased by one every year until 2001 and could then be increased further up to fifteen years. Moreover, the formula for computing an has also been changed to
if n < 15, if 15 I n < 25,
if 35 I n .
.5 + .03(n - 15) a n = [ .8 + .02(n - 25) if 25 I n < 3 5 ,
In all our simulations, we obviously used the old formula, which was in place over the relevant sample period.
Early Retirement
The normal retirement age is sixty-five, but early retirement at age sixty is permitted for those who became affiliated with social security before 1967.
324 Michele Boldrin, Sergi Jimenez-Martin, and Franco Peracchi
Table 8.3 Replacement Rates by Age and Number of Years of Contributions
Age Years of Contributions 60 61 62 63 64 65 i
15 20 25 30 31 32 33 34 35 +
,360 ,420 ,480 .540 ,552 ,564 ,576 ,588 ,600
,408 ,476 ,544 ,612 ,626 ,639 ,653 ,666 .680
,456 ,532 .608 ,684 ,699 ,714 ,730 ,745 ,760
,504 .588 ,672 .756 .773 ,790 .SO6 223 .840
,552 ,644 ,736 ,828 346 ,865 ,883 ,902 .920
,600 ,700 ,800 ,900 .920 ,940 ,960 .980
1 .om
Currently, more than one-third of those who retire under the general scheme take advantage of this possibility.
The current legislation distinguishes between two cases. The first one, repre- senting the vast majority of those currently retiring between the ages of sixty and sixty-five (Durin 1995,472), is the case of workers who started contribut- ing as dependent employees to some mutualidad laboral before 1967. In this case, the replacement rate is reduced by 8 percentage points for each year un- der age sixty-five. Table 8.3 shows how replacement rates vary with age and the number of years of contribution. Notice the different incentive to work an extra year for a person aged sixty and one aged sixty-five, both with thirty-four years of contributions. In the former case, the pension increases from 58.8 to 68 percent of the benefit base, while, in the latter, it increases only from 98 to 100 percent. As of 15 July 1997, workers who retire after age sixty with forty or more years of contributions will be charged a penalty of only 7 percent for each year under age sixty-five.
The second case, representing about 10 percent of early retirees, is the case of workers with dangerous or unhealthy jobs (e.g., bullfighters; employees of railroads, public transportation companies, and airlines; etc.) or workers who were laid off for industrial restructuring regulated by special legislation. In this case, no reduction applies. Notice that these exemption rights are “portable” as the minimum retirement age without penalty, for an individual who was previously employed in one of the sectors deemed dangerous or unhealthy, is reduced in proportion to the number of years of work spent in such sectors.
Unless there are collective agreements that prescribe mandatory retirement, individuals may continue working after age sixty-five. There is no direct incen- tive for delaying retirement, however, at least for those individuals who have already reached thirty-five years of contributions at age sixty-five. The only indirect form of incentive would be the prospect of particularly high wage growth in the forthcoming years, as this would proportionally increase the ben-
325 Social Security and Retirement in Spain
Table 8.4 Annualized Minimum Wage (SMI) and Minimum and Maximum Annual Pensions (F'TA 1,000 at current prices)
Minimum Pension
With Dep. Spouse Without Dep. Spouse Annualized Maximum
efit base (recall that only the last eight years of wages are taken into account in this computation). For those with fewer than thirty-five years of contribu- tions, a small direct incentive to postpone retirement is provided by the fact that the ratio of the pension to the benefit base grows 2 percentage points per year of contribution until reaching 100 percent.
Maximum and Minimum Pension
Pensions are subject to a ceiling legislated annually and roughly equal to the ceiling on covered earnings. The 1996 ceiling corresponds to about 4.3 times the minimum wage (salario minimo interprofesional, or SMI) and about 1.6 times the average monthly earnings in the manufacturing and service sectors. If the computed old age pension is below a minimum, then a person is paid a minimum pension legislated annually. Minimum and maximum pensions, as well as the annualized SMI, are reported in table 8.4. Other things being equal, minimum pensions are higher for those who are older than age sixty-five or have a dependent spouse.
In the last decade, minimum pensions grew at about the same rate as nomi- nal wages, whereas maximum pensions grew at a lower rate that is about equal to the inflation rate. The ratio between the minimum old age pension and the minimum wage has been increasing steadily from the late 1970s (it was 75 percent in 1975) until reaching almost 100 percent in the early 1990s. On the other hand, the percentage of pensioners of the general scheme receiving the minimum pension has been declining steadily, from over 75 percent in the late 1970s to 27 percent in 1995.
326 Michele Boldrin, Sergi Jimenez-Martin, and Franco Peracchi
CJ share of pension - men 0 male recipiency rate . female recipiency rate
A share of pension - women I I I I I I I I
I I I I I I I I 10 1 5 20 25 30 35 40 45
number of years of contribution
Fig. 8.13 Fraction of pensioners receiving complements to the minimum and share of the pension due to complements by number of years of contribution, 1993
In figure 8.13, we analyze the relative importance of complements to the minimum, that is, the difference between the actual pension amount and the “virtual” pension in the absence of minimum pension rules. The sample, from administrative social security records as of January 1993, includes people who retired before 1985 with only eight years of contributions.
The fraction of the total pension that comes from complements varies with the pension type. It is 10.1 percent for men and 12.5 percent for women in the case of old age pensions, 5.8 and 6.2 percent, respectively, in the case of dis- ability pensions, and 19.4 percent in the case of survivor pensions. Not surpris- ingly, the fraction of pensioners who receive complements to the minimum and the share of the pension due to complements both decrease with the number of years of contributions. For example, people who retire with ten years of contributions get 40 percent of their pension from complements, whereas people who retire with thirty-five years get less than 10 percent from comple- ments.
It is interesting to note that both indices are higher for men than for women for longer contributory lives. This result has to be interpreted with care, how- ever, since there are very few women (fewer than 10 percent) among pension-
327 Social Security and Retirement in Spain
ers who contributed for thirty-five years or more, whereas women represent the majority among pensioners who have contributed for fifteen or fewer years.
Pension Indexation
Pensions are fully indexed to inflation, as measured by the consumer price index (indice de precios de consumo, or IPC). Until 1986, pensions were also indexed to real-wage growth.
It should be noted that indexation is to expected inflation, as defined annu- ally by the central bank and the Treasury. If actual inflation is above expected inflation, then the difference is paid only to the pensions that are below the minimum wage. No adjustment is made, however, if actual inflation falls below expected inflation, as occurred during the last two years. Pensions that have already reached the legislated ceiling are not indexed but are automatically adjusted with the ceiling.
While this indexation mechanism could, at least theoretically, induce large reductions in the real value of higher pensions and a strong tendency to pen- sion equalization, in practice this has occurred only to a limited extent.
Family Considerations
A pensioner receives a fixed annual allowance for each dependent child who is younger than age eighteen or disabled. In 1996, this allowance was equal to PTA 408,840, corresponding to about 45 percent of the annualized minimum wage. In addition, the minimum pension is increased by a fixed amount if a pensioner has a dependent spouse (table 8.4 above).
Survivors (spouse, children, other relatives) may receive a fraction of the benefit base of the deceased if the latter was a pensioner or died before retire- ment after contributing for at least five hundred days in the last five years. The benefit base is computed differently in the two cases. If the deceased was a pensioner, the benefit base coincides with the pension. If the deceased was a worker, it is computed as an average of covered earnings over an uninterrupted period of two years chosen by the beneficiary among the last seven years im- mediately before death. If death occurred because of a work accident or an illness contracted at work or because of working conditions, then the benefit base coincides with last earnings.
The surviving spouse gets 45 percent of the benefit base of the deceased. In the case of divorce, the pension is divided between the various spouses ac- cording to the length of their marriage with the deceased. Such a pension can be received in combination with labor income and any other old age or disabil- ity pension, but it is lost if the spouse remarries. As a point of interest, we point out here that the remarriage rate among Spanish widows is particularly low compared to the remarriage rate in other countries.
Surviving children get 20 percent each of the benefit base of the principal as long as they are younger than age eighteen or unable to work and stay un- married. An orphan who is a sole beneficiary may receive up to 65 percent of
328 Michele Boldrin, Sergi Jimenez-Martin, and Franco Peracchi
the benefit base. If there are several surviving children, the sum of the pensions to the surviving spouse (if any) and children cannot exceed 100 percent of the benefit base.
A peculiarity of the Spanish system is the “pension in favor of family mem- bers.” This pension entitles other surviving relatives (e.g., parents, grandpar- ents, siblings, nephews, etc.) to 20 percent of the benefit base of the principal if they satisfy certain eligibility conditions (they are older than age forty-five, do not have a spouse, do not have other means of subsistence, have been living with and depending economically on the deceased for the last two years). To this pension one may add the 45 percent survivor pension if there is no surviv- ing spouse or eligible surviving children.
There are specific minimum pensions for the different types of survivorship. In particular, the minimum pension to a surviving spouse was raised in 1992 and is now equal to the minimum old age pension for a person without a depen- dent spouse.
8.2.5 Special Schemes In this section, we sketch the main differences between the general and the
special schemes. Whereas rules and regulations for sailors and coal miners are very similar to the ones for the general scheme, special rules apply to the self- employed, farmers, agricultural workers, domestic servants, and a few other categories not discussed here, such as part-time workers, artists, traveling salespeople, and bullfighters. Besides differences in the social security tax rate and the definition of covered earnings, an important difference is the fact that those affiliated with the special schemes have no early retirement option (an exception is made for miners and sailors).
The rest of this section focuses on the special schemes for self-employed workers (RETA) and for farmers (REA), which together represent 93 percent of those affiliated with the special schemes and 86 percent of the pensions that they pay out.
The Self-EmpEoyed
While the social security tax rate is the same for RETA and the general scheme (28.3 percent in 1996), covered earnings are computed differently as the self-employed are essentially free to choose their covered earnings between a floor and a ceiling legislated annually. Not surprisingly in the light of ‘the strong progressivity of Spanish personal income taxes, a suspiciously large proportion of self-employed workers report earnings equal to the legislated floor.
In 1996, the floor and the ceiling were equal to PTA 101,940 and PTA 374,880 per month, respectively, corresponding to 1.6 and 5.8 times the mini- mum wage and 0.5 and 1.9 times average earnings in manufacturing and ser- vices. For a self-employed individual aged fifty or over, the ceiling was only
329 Social Security and Retirement in Spain
about half, namely, PTA 195,000 per month, which was about equal to average monthly earnings.
A crucial difference with respect to the general scheme is that, under RETA, receipt of an old age pension is compatible with maintaining self-employed status. This provision effectively configures RETA pensions as pure old age pensions, completely independent from labor market participation decisions.
Some other important provisions are the following. RETA requires only at least five years of contributions in the ten years immediately before the death of the principal in order to qualify for survivor pensions. Under RETA, the latter is 50 percent of the benefit base. If the principal was not a pensioner at the time of death, the benefit base is computed as the average of covered earn- ings over an uninterrupted period of five years chosen by the beneficiary among the last ten years before the death of the principal.
Farmers
In this case, both the social security tax rate and covered earnings differ with respect to the general scheme. Self-employed farmers pay 18.75 percent of a tax base that is legislated annually and is unrelated to actual earnings. In 1996, this was equal to PTA 80,490 per month, corresponding to 1.24 times the mini- mum wage and about 40 percent of average monthly earnings in the manufac- turing and service sectors.
Farm employees, instead, pay 11.5 percent of a monthly base that depends on their professional category and is legislated yearly. In addition, for each day of work, their employer must pay 15.5 percent of a daily base that also varies by professional category and is legislated annually.
8.2.6 Government Employees We now describe briefly the main differences between the general scheme
and RCP, the pension fund for the employees of the central government. Public servants are divided into five categories, A-E, corresponding loosely
to decreasing schooling levels: A is college graduates (docto6 licenciado, ar- quitecto o equivalente), B people holding certain kinds of college diplomas (ingeniero tbcnico, diplomado, etc.), C high school graduates (bachiller o equi- vulente), D junior high school diplomas (graduado escolar o equivulente), and E individuals with lower education levels (cert$cado de escolaridad ). There were many more categories before the 1985 reform. For each of these catego- ries, the budget law defines every year a theoretical social security wage (haber regulador) that is used to compute social security contributions and pensions. The implied wage scale has remained relatively constant since 1985. So, for example, the ratio of level A to level E wages was equal to 2.39 between 1985 and 1989, dropped to 2.33 in 1990, and rebounced and remained constant at 2.45 afterward.
Social security contributions are the sum of three parts, each proportional
330 Michele Boldrin, Sergi Jimenez-Martin, and Franco Peracchi
to the legislated covered wage, according to proportionality factors legislated annually: (e l ) clerechos pnsi im (3.86 percent in 1995); ( b ) c m t a n~erislrnl cle rizzrtiralick&-s (1.89 percent in 1995); and (c) aportaciciri del esttrclo (paid by the government, it varies between 6 and 10 percent depending on the sector of the administration).
To parallel this three-part contribution structure, actual pensions are com- puted by adding up three sources of benefits: (a ) the basic pension (deruchos yashm); (b) a portion directed to the pensioner’s family (n!.ircltrftrniiliar.): and ( c ) a complementary portion coming from the various riiirrrraliclncles (ISFAS. MUFACE, MUCEJU).
The basic monthly pension of a public servant who retires in month t after contributing for r i years to RCP is computed as P, = a,,BR,, where the depen- dence of a,, on number of years worked has been changed quite frequently during the last ten years. For I I 2 15, the last table of proportionality factors. legislated in 1990, can be reasonably (but not exactly) approximated by
a,, = min[l, 1 - .0366(35 - n ) ] .
The differences with respect to the general scheme are various. First, while entitlement to a pension still requires at least fifteen years of contributions, the replacement rate (the ratio of the pension to the benefit base) increases some- what irregularly with seniority, up to 100 percent after thirty-five years. So, for example, fifteen years of service give the right to a pension equal to only 26.92 percent of the benefit base, against 60 percent of the general scheme. After thirty years, the same ratio has increased to 8 1.73 percent, against 90 percent for the general scheme. Historically, this replacement ratio has been unstable as it can be modified year by year through the budget law.
Second, the benefit base is computed as a weighted average of covered earn- ings, on which the worker paid the contributions, with weights equal to the percentage of the career spent at each level, that is,
where p , is the fraction of the career spent on level i , and H,, are the covered earnings corresponding to level i, as determined by the current law at time t.
Third, unlike the general scheme, RCP imposes mandatory retirement at age sixty-five. Exceptions are made for a few special categories, such as university professors and judges. On the other hand, RCP allows for early retirement at age sixty, without any penalty for public servants with at least thirty years of service (twenty for military personnel).
A fourth important difference with respect to the general scheme is compati- bility between RCP pension receipt and income from continuing to work. In a number of special cases, RCP pensioners are allowed to keep a public-sector occupation as long as this does not provide them with a “regular flow of in-
331 Social Security and Retirement in Spain
come” (e.g., this is the case of members of legislative bodies). More important, the legislation allows RCP pensions to be cumulated with earnings from em- ployment in the private sector.
It should be noted that those who leave public administration after contribut- ing the minimum number of years, but before reaching the retirement age, can claim an RCP pension once they reach age sixty-five. The benefit base used to compute such a pension does not refer to the time when the individual left public administration but is instead the one legislated for the year the individ- ual turns sixty-five. Furthermore, any future modification in the law will have no effect on the pensions that are already being paid. The latter will be forever regulated by the legislation of the time when the individual earned the right to the RCP pension.
When a public servant is dismissed because of disability (and therefore starts drawing a disability pension) or dies (and the survivors are therefore entitled to a pension), the missing years between the person’s age at the time of disability or death and sixty-five are counted as actual years of service in the computation of either the disability or the survivor pension. Should the disability be caused by an accident while on duty, the disability pension is doubled.
8.2.7 Disability Pensions
permanent illness or disability.
Temporary lllness or Disability
The subsidy for temporary illness or disability (incapacidad laboral tran- sitoria) was not regulated by the 1985 reform, and its provisions have under- gone frequent changes.
Eligibility requires affiliation with the social security system for a minimum period that depends on the nature of the covered risk. Common illness requires only 180 days of contributions during the last five years, paid maternity/pater- nity leave requires at least nine months before the date of delivery and 180 days during the last twelve months, and no minimum eligibility criterion is imposed for work-related accidents or illnesses.
The benefit base depends on actual earnings during the last twelve months. In the case of common illness or an accident unrelated to work, the subsidy is equal to 60 percent of the benefit base for each day of absence between the fourth and the twentieth and to 75 percent of the benefit base afterward until the maximum period is reached. It is always equal to 75 percent in case of work-related accident or illness and maternity/paternity (only one of the part- ners being allowed to use the subsidy per each child). The maximum period for which the subsidy can be received is eighteen months, after which the worker must either return to work or be classified as permanently disabled.
The social security system provides insurance against both temporary and
332 Michele Boldrin, Sergi Jimenez-Martin, and Franco Peracchi
Contributory Disability Pensions
Permanent disability pensions have played an important role in allowing Spanish workers to retire at ages younger than sixty. In particular, they were used extensively during the late 1970s and early 1980s as an early retirement mechanism for workers in restructuring industries (shipbuilding, steel, mining, etc.) or as substitutes for long-term unemployment subsidies in depressed re- gions. The total disability rate (as a percentage of the workforce) doubled in less than ten years, from about 0.7 percent in 1975 to 1.5 percent in 1983. By tightening the requirements, the 1985 reform managed to bring the phenome- non under partial control. Disability rates have since decreased, stabilizing at around 0.6 percent.
Disability pensions are divided into contributory and noncontributory. This section deals with contributory pensions. Noncontributory pensions are dealt with in the next section.
Eligibility and pension amounts depend on the level of disability. The 1985 reform distinguished four levels of permanent disability characterized by in- creasing severity. Since then, the legislation has formally reduced these levels to three but has also created a special subcase of the first level with the explicit purpose of using the disability funds to subsidize the dismissal of old workers from certain sectors or geographic areas.
The first level (incapacidad permanente total para la profesidn habitual, or IPT) corresponds to inability to do the usual job. A special subcase (incapaci- dad permanente total cual$cada para la profesidn habitual, or IPTC) applies only to employees older than age fifty-five who are in particular socioeconomic situations. The second level (incapacidad permanente absoluta, or IPA) corre- sponds to inability to do any kind of job. The third level (gran invalidez, or GI) requires, in addition, continued attendance by other persons in order to carry out basic vital functions.
When disability is caused by an ordinary illness, eligibility for a pension requires from five to fifteen years of contributions, depending on the age at which the person fell ill and the seriousness of the disability. There is no contri- bution requirement when the disability is caused by an accident, regardless of whether it is work related, or by an illness contracted at work.
Eligibility requirements are fairly complicated. We try here to streamline their presentation. In the cases of IPA or GI, fifteen years of contributions are required, of which at least three must be during the last ten years. For the other two cases (IPT and IF'TC), eligibility depends on age. For persons aged twenty-six or younger, the requirement is half the number of years between age sixteen and the age when disability began. For persons older than age twenty-six, the requirement is either five years or a fourth of the number of years between age twenty and the age when disability began, whichever is largest. Furthermore, at least a fifth of the required years of contributions must have occurred during the last ten years.
333 Social Security and Retirement in Spain
0 Men aged 50- 0 Men aged 54-59
Men aged 50-54 Men aged 60-64
I I I I I
13 75 80 85 90 retirement year
Fig. 8.14 Distribution of male disability pensions outstanding in 1993 by age group and year of award
The benefit base depends on the source of disability. In the case of ordinary illness, it is computed as for old age pensions. For accidents unrelated to work, it is the average annual wage over a period of twenty-four consecutive months chosen by the person within the last seven years of work. For work-related accidents or illnesses, it is the average wage in the last year of work.
The pension equals 55 percent of the benefit base under IPT and increases to 75 percent under IPTC. In the case of IPA, it is equal to 100 percent of the benefit base, whereas for GI it is equal to 100 percent of the benefit base plus another 50 percent covering the person taking care of the disabled individual.
Disability pensions are indexed to inflation like the other RGSS pensions. Unlike the latter, however, disability pensions may be kept while earning in- come from a job different from the one under which the disability (even a complete one) was contracted.
We mentioned earlier that disability pensions were awarded very generously until 1985. This is illustrated in figure 8.14, which reports the distribution of male disability pensions outstanding in 1993, by age and year of award, on the basis of social security administrative records. For all age groups, awards peak between 1980 and 1982, when the growth rate of the number of outstanding disability pensions reached 6 percent per year. Between 20 and 25 percent
334 Michele Boldrin, Sergi Jimenez-Martin, and Franco Peracchi
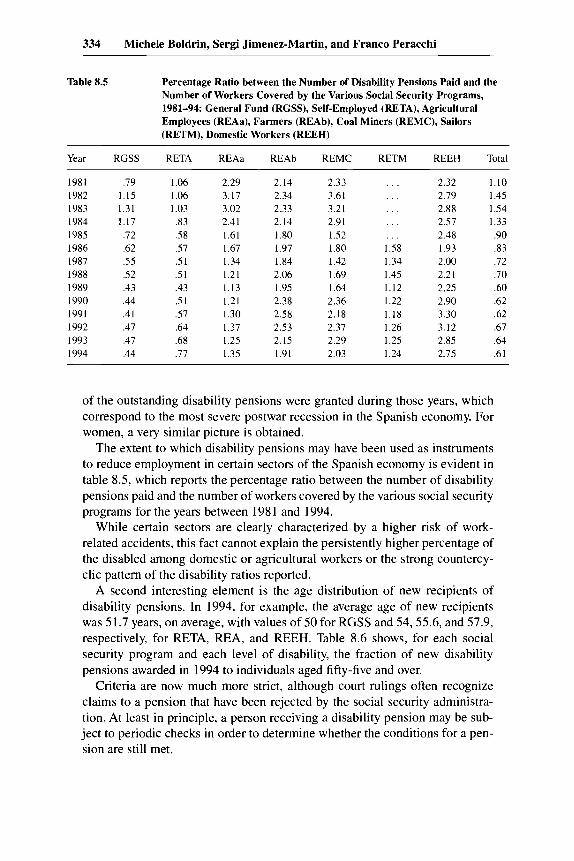
Table 8.5 Percentage Ratio between the Number of Disability Pensions Paid and the Number of Workers Covered by the Various Social Security Programs, 1981-94: General Fund (RGSS), Self-Employed (RETA), Agricultural Employees (REAa), Farmers (REAb), Coal Miners (REMC), Sailors (RETM), Domestic Workers (REEH)
of the outstanding disability pensions were granted during those years, which correspond to the most severe postwar recession in the Spanish economy. For women, a very similar picture is obtained.
The extent to which disability pensions may have been used as instruments to reduce employment in certain sectors of the Spanish economy is evident in table 8.5, which reports the percentage ratio between the number of disability pensions paid and the number of workers covered by the various social security programs for the years between 198 1 and 1994.
While certain sectors are clearly characterized by a higher risk of work- related accidents, this fact cannot explain the persistently higher percentage of the disabled among domestic or agricultural workers or the strong countercy- clic pattern of the disability ratios reported.
A second interesting element is the age distribution of new recipients of disability pensions. In 1994, for example, the average age of new recipients was 51.7 years, on average, with values of 50 for RGSS and 54,55.6, and 57.9, respectively, for RETA, REA, and REEH. Table 8.6 shows, for each social security program and each level of disability, the fraction of new disability pensions awarded in 1994 to individuals aged fifty-five and over.
Criteria are now much more strict, although court rulings often recognize claims to a pension that have been rejected by the social security administra- tion. At least in principle, a person receiving a disability pension may be sub- ject to periodic checks in order to determine whether the conditions for a pen- sion are still met.
335 Social Security and Retirement in Spain
Table 8.6 Fraction of New Disability Pensions Awarded (year 1994) to Individuals Aged 55 and over by Social Security Program and Level of Disability: Inability to Do the Usual Job (IPT), Inability to Do Any Kind of Job (IPA), Complete Inability (GI)
Noncontributory disability pensions are granted, through a special branch of the social security system called Instituto Nacional de Servicios Sociales (INSERSO), to disabled people aged eighteen to sixty-five who are ineligible for contributory pensions, have been legal residents of Spain for at least five years (of which at least two are immediately before applying for such a pen- sion), and whose annual income is below a certain threshold. INSERSO also provides its beneficiaries with basic health insurance, free medicine, and other complementary social services.
In 1990, a number of preexisting noncontributory programs were ration- alized and unified under INSERSO. As of 1995, the total annual budget of INSERSO was PTA 418 billion, of which 64 percent was direct government transfers, while the rest was financed through social security contributions. Just to give an idea of the relative magnitude of this program, which represents about 0.7 percent of Spanish GDP, notice that total expenditures for the public uni- versity system in 1995 were only slightly higher, at about 0.9 percent of GDP.
Of the total annual budget of INSERSO in 1995, about 39 percent was spent in either direct monetary transfers or services to disabled individuals, about the same amount went to noncontributory old age pensions (see the next sec- tion), 20 percent was transferred to the regional governments (comunidudes autdnomas) providing similar services, and 2 percent covered INSERSO ad- ministrative costs.
The basic annual disability pension paid by INSERSO in 1996 was PTA 498,120, corresponding to 55 percent of the minimum wage (SMI) and 19 percent of average monthly earnings during the same year. Such amounts may vary according to the economic and physical conditions of the individual and may be increased up to 50 percent.
At the end of 1995, there were about 163,000 recipients of noncontributory disability pensions residing in Spain, of which 36 percent were males and 64 percent females. Another 198,000 people (22 percent males and 78 percent
336 Michele Boldrin, Sergi Jimenez-Martin, and Franco Peracchi
females) received one of three other monetary subsidies also administered by INSERSO.
8.2.8 Other Transfer Programs We now describe a few other transfer programs that are conditioned on age
or for which the elderly can qualify solely on the basis of having a low income.
Unemployment Bene$ts
There exists a special subsidy for unemployed people who are older than age fifty-two, lack income sources, have contributed to unemployment insur- ance for at least six years in their life, and, except for age, satisfy all the re- quirements for an old age pension. This subsidy pays up to 75 percent of the minimum wage and may be received until the person reaches the age at which he or she can access an old age pension. Years spent unemployed count as years contributing toward an old age pension.
The Noncontributory Old Age Pension
A person aged sixty-five or over who does not qualify for an old age pension is entitled to a noncontributory pension (pension de jubilacio'n no contributiva) if he or she has been a legal resident of Spain for the last ten years and his or her annual income is below a certain threshold. This program is also adminis- tered by INSERSO. Receipt of such a pension guarantees receipt of public health care assistance and other benefits available to social security pensioners.
The annual pension amount is equal to the minimum income threshold, and both depend on whether the person lives with others. If the person does not live with others, then the pension is equal to the basic amount paid out by INSERSO to disabled individuals. If the person lives with others, then the pen- sion amount varies with the number of household members.
At the end of 1995, 186,000 people received a noncontributory old age pen- sion from INSERSO. Of these, 14 percent were males and 86 percent females.
Other Programs Run by INSERSO
In addition to its duties in the field of disability and old age pensions, IN- SERSO runs a variety of other programs aimed at the elderly population. These programs include creating and maintaining residential and day-care centers open to retirees aged sixty and over and their spouses and managing the Social Thermal Program (Programa de Termalismo Social) and the Program for El- derly People's Holidays (Programa de Vacaciones Tercera Edad). The latter two programs offer paid or subsidized vacations to pensioners or people aged sixty-five or over as well as paid or subsidized stays at spas and thermal resorts within the country. The spouse of an eligible person is also covered by the program.
Recently, most regional governments have also begun to provide a number
337 Social Security and Retirement in Spain
of services for retired people, ranging from subsidized holidays to a reduction in the cost of public transportation, special medical and psychological care, special houses for the elderly, etc.
8.2.9 Private Pensions Private pension coverage is voluntary but not very widespread. Yet the num-
ber of participants in private pension plans has more than doubled in the last few years, from 628,000 in 1990 to 1,525,000 in 1994 (de las Fuentes and Gonzalo 1996, 255). The assets of private pension funds still represent only a small, but a growing, fraction of GDP, estimated to be 4.7 percent in 1997 (de las Fuentes and Gonzalo 1996, 251).
The main incentive to participate is tax deferral. Contributions can be en- tirely deducted from taxable income up to a maximum (equal to PTA 1 million in 1996, corresponding to 1.1 times the annualized minimum wage), provided that they do not exceed 15 percent of total annual income. On receipt, pension benefits are treated as regular components of labor income and taxed accord- ingly.
There are three forms of organization of a private pension plan. The first (sistema asociado), open to all members of the association that promotes the plan (e.g., a trade union), is rare. The second (sistema de empleo), open to all employees of the firm that promotes the plan, is confined to a few large firms, mainly publicly owned, in the banking and electricity sectors. The third (sis- tema individual) is open to everybody and is the predominant one, covering about 85 percent of the participants in private pension plans.
8.2.10 The Rights of Older Workers Only public-sector employees are subject to mandatory retirement. The
mandatory retirement age is normally sixty-five, but it can be earlier for certain categories (military, police, etc.). There is no mandatory retirement in the pri- vate sector unless it is specifically covered in collective agreements, a situation that occurs rarely.
In principle, age discrimination is prohibited by law. Indeed, a government attempt to introduce mandatory retirement at age sixty-nine was rejected by the Spanish Supreme Court on the ground that it would represent a form of age discrimination that violates constitutional principles.
8.3 Retirement Incentives under the Social Security System
We now present the results of calculations carried out to evaluate the retire- ment incentives provided by the Spanish social security system. These calcula- tions refer only to the general scheme. We exclude disability insurance for two reasons. First, it is now more severely screened than it was during the 1980s. Second, the extent to which it is used as an early retirement device follows
338 Michele Boldrin, Sergi Jimenez-Martin, and Franco Peracchi
political criteria that vary greatly between regions and sectors and cannot be properly formalized. Private pensions are also excluded since they are volun- tary and cover only a very small fraction of the workforce.
Replacement rates are net of social security contributions and personal in- come taxes. Although there is no difference in the tax treatment of labor earn- ings and pensions, our simulations take into account the effects of the highly progressive nature of the Spanish tax system. This does not affect the qualita- tive picture, but it has a sizable effect on the final magnitudes. In order to provide the reader with a clearer picture of the powerful role that, over and above the pension system, a very progressive income tax schedule may play in determining labor supply decisions, we also report simulation results gross of income taxes for some of the most significant cases.
Exact calculations of after-tax wealth and replacement rates are complicated by the fact that the number of bend points in the Spanish marginal tax schedule is high (thirty-four in 1985 and still seventeen in 1995). As an approximation, we proceeded as follows. We first used the 1995 tax schedule to trace out the relation between the average tax rate (net of standard deductions) and income (net of social security contributions paid by a worker). We then fitted by least squares a fourth-order polynomial to this relation. Finally, the estimated coef- ficients were used to determine after-tax income for all previous and subse- quent years.
8.3.1 The Base Case Our base case is a male employee, born on 1 January 1930, who has been
contributing to social security without interruption since he turned twenty, on 1 January 1950. He reaches the early retirement age of sixty in 1990 and the normal retirement age of sixty-five in 1995. He is married to a woman who is three year younger than he is and has never worked. They have no dependent children, and their conditional survival probabilities at each age are equal to the ones obtained by the latest mortality tables published by the National Sta- tistical Institute (INE) with reference to the year 1990. We assume that the survival probabilities of the husband and the wife are independent.
Our base-case worker has a real discount rate of 3 percent, and his age- earnings profile has been constructed as follows. First, using the EPF for 1980- 8 1, we computed median annual earnings in 1980 for a full-time, nonagricul- tural male employee born in 1930. We then predicted annual earnings in all other years using the annual growth rate of nominal earnings, as computed by INSS. After 1995, we assumed an annual growth rate of nominal wages of 4.5 percent and an annual inflation rate of 3 percent. These assumptions are in line with the main macroeconomic scenarios summarized in Herce (1997).
Simulations start in year 1985, when our base-case worker turns age fifty- five and completes thirty-five years of contributions, and run for each year until he turns age seventy, in the year 2000. At age fifty-five, his benefit base is already equal to 100 percent of the average wage during the last eight years of
339 Social Security and Retirement in Spain
work. For the period between 1985 and 1996, we use historical data for all the relevant social security parameters. For the subsequent years, social security tax rates are assumed to remain constant at their 1996 level, the pension is assumed to be perfectly indexed to price inflation, and the floors and ceilings on earnings, as well as the minimum and maximum pensions, are assumed to grow at the same rate as nominal wages.
Our basic hypotheses are the following. First, if the worker stops working before age sixty, then he elects to begin receiving his old age pension at age sixty, the earliest possible moment, whereas, if he stops working past age sixty, then he starts receiving his old age pension immediately. Second, if he stops working before age sixty, then he receives no benefits or unemployment com- pensation in the interim years until he starts drawing a pension. Third, the wealth calculations are all net present values as of 1 January 1995.
It may be worth summarizing the main qualitative effects of working one more year beyond age sixty in the simulations that we are about to present: (1) It may increase social security benefits by increasing the benefit base BR, or the replacement rate a,, (see sec. 8.2.4 above). The benefit base increases if earnings from the extra year of work exceed average earnings during the last eight years. The replacement rate increases if the worker has contributed for fewer than thirty-five years, in which case an extra year of work buys an extra 2 percent of the benefit base. If the worker has already contributed for thirty- five years, as in the base case, only the effect on the benefit base is relevant. (2) It reduces the penalty for early retirement by 8 percentage points. (3) It reduces by one year the expected period over which the worker will receive a pension. (4) It implies paying additional social security contributions. (5) The marginal tax rate on labor income may turn out to be higher than the marginal tax rate on pension income, owing to the high progressivity of the Spanish income tax schedule. This effect is likely to be important for workers who are in the higher portion of the earnings distribution.
Table 8.7 presents our calculations of replacement rates, social security wealth, social security wealth accrual (the change in social security wealth with respect to one year earlier), social security wealth accrual rates (the rates of change in social security wealth), projected earnings, and the implicit tax/ subsidy rates on continuing to work (minus the ratio between social security wealth accrual and projected earnings) at each age between fifty-four and sixty-nine. Both earnings and social security wealth are net of personal income taxes and are expressed in PTA thousands at 1995 prices.
Social security wealth starts up at PTA 11.3 million (about $87,000), but it loses about 15 percent of its value between age fifty-four and age fifty-nine because the growth of median wages during the period 1986-90 was not enough to compensate for the additional contributions paid. Social security wealth rises again between age fifty-nine and age sixty-three, mainly because of the progressive reduction in the penalty for earlier retirement (effect 2), but falls very rapidly after age sixty-four, when additional years of work add noth-
340 Michele Boldrin, Sergi Jimenez-Martin, and Franco Peracchi
Table 8.7 Incentive Calculations for the Base Case (after-tax values in PTA 1,OOO at 1995 prices)
Age at Last Year Replacement Accrual Projected Tax/ of Work Rate ssw Accrual Rate Earnings Subsidy
ing to the expected pension amount, while effects 3 and 4 become very strong. As a result of this, the implicit tax rate on continuing work increases rapidly between age fifty-four and age fifty-eight, when it reaches 36 percent. It turns negative (subsidy) between the ages of sixty and sixty-two as the penalty asso- ciated with early retirement is progressively reduced. The net tax or subsidy is almost zero at age sixty-three but becomes positive (tax) again and rapidly increasing afterward.
Notice that the net replacement rate increases from about 60 percent at age fifty-nine to about 100 percent at age sixty-five and declines slightly afterward. Also notice that social security wealth reaches its maximum value at age fifty- four, long before the worker is allowed to retire.
8.3.2 Other Cases Table 8.8 presents the incentive calculations for the case of a single worker.
The main difference with respect to the base case is that the household he represents (missing a female spouse) has smaller effective survival probabili- ties at each age, resulting in lower social security wealth. The age profile of taxhbsidy rates is not very different from the base case, except for the fact that there is hardly any subsidy for continuing work between age sixty and age sixty-three. In other words, the reduction in the expected length of time over which pension benefits will be received (effect 3) and the higher marginal tax rates on earnings completely wash out with the increase in the benefit base brought about by effects 1 and 2 . Also in this case, social security wealth is maximized at age fifty-four.
341 Social Security and Retirement in Spain
Table 8.8 Incentive Calculations for the Case of a Single Worker (after-tax values in PTA 1,OOO at 1995 prices)
Age at Last Year Replacement Accrual Projected Tax/ of Work Rate SSW Accrual Rate Earnings Subsidy
Table 8.9 presents the incentive calculations for the case of a median wage profile with an “incomplete” earnings history. This worker started working at age thirty and does not therefore fully qualify for a pension until he reaches age sixty-five in 1995. The high tax rate on continuing work at all ages between fifty-five and fifty-nine is counterintuitive, but it helps illustrate the dramatic importance of a sixth effect embedded in the Spanish social security system, the “minimum pension effect.”
If the worker stops working at age fifty-five, with only twenty-five years of contributions, the pension that he will receive after turning sixty will be low and hit the lower bound on pensions when he reaches age sixty-four. Since minimum pensions grow at the same rate as nominal wages, there is no advan- tage in working one extra year in order to raise the initial pension, as the latter is in any case low and going to be equal to the minimum pension after just a few years. Notice that the situation is completely different if the worker consid- ers retiring when he turns sixty. In this case, as shown in table 8.3 above, work- ing one extra year until age sixty-one would increase his pension from 54 to 62.6 percent of the benefit base.
Table 8.10 differs from the base case because we used the tenth percentile of annual earnings as our 1980 anchor. Given the 1980 anchor, annual earnings for all other years are predicted as in the base case. Table 8.11 presents a paral- lel set of calculations using the ninetieth percentile of annual earnings as our 1980 anchor. Taxhubsidy rates for these two cases are also presented in figure 8.15 along with the base case.
We have already seen that the incentives to retire at the earliest possible date
Table 8.9 Incentive Calculations for the Case of an Incomplete Earnings History (after-tax values in PTA 1,OOO at 1995 prices)
Age at Last Year Replacement Accrual Projected Tax/ of Work Rate ssw Accrual Rate Earnings Subsidy
are much stronger for individuals with an incomplete earnings history. The bias of the system toward “forcing out” low-wage earners is confirmed by the different patterns of the taxhbsidy rate faced by individuals at the ninetieth and tenth percentiles of the wage distribution. Whereas for the former there is an incentive, stronger than for the base case, to keep working past age sixty and until about the age of sixty-three or sixty-four, for the latter the disincentive to do so peaks at age sixty, in terms of both accrual and tadsubsidy rates.
Figure 8.15 also shows that the tax rate for low-wage earners increases sharply in the age range sixty to sixty-four, contrary to what happens to high- wage earners. In other words, should a low-earnings individual be working at the age of, say, sixty-one, he would still find it advantageous to quit immedi- ately, whereas this is not true for the base case or a high-earnings person.
Table 8.12 provides the reader with a further appraisal of the extent to which the minimum pension mechanism creates incentives to early retirement for low-wage earners. It reports taxhbsidy rates with and without minimum pen- sions in the base case, the incomplete earning history case, and the tenth per- centile case.
The effect on the incentives to early retirement is very strong for the low- income individual. The variation caused by the minimum pension in the im- plicit tax from continuing to work is already very high at age fifty-five, peaks at age sixty, and remains substantial at much later ages as well. For a worker with an incomplete earnings history, the effect of the minimum pension provi- sion is also relevant until age sixty but vanishes rapidly afterward. Instead, the difference caused by the existence of the minimum pension on the taxkubsidy for the base-case worker is always negligible.
345 Social Security and Retirement in Spain
I I I I I I
50 55 60 65 69 45 age
Fig. 8.16 Hazard rate out of the labor force for men
8.3.3 Discussion Our first concern is with the relations between the incentive effects we have
computed and the retirement facts available. Figures 8.16 and 8.17 show hazard rates by age for men and women, respec-
tively. The hazard rate is defined here as minus the percentage change in the cross-sectional age-participation profile. For men, the hazard increases smoothly with age and shows clear peaks at the ages of sixty and sixty-five, corresponding, respectively, to the Spanish early and normal retirement ages. This is consistent with our calculations, which show a strong incentive for low- income earners andor workers with incomplete histories to retire as early as possible (age sixty) and for everybody else to retire at age sixty-five.
Among women, things are harder to judge. The behavior of the hazard rate for women is very erratic at almost all ages, and there are various small peaks at ages between fifty-two and sixty-one, followed by the prominent one at age sixty-five. Our reading of the data is that the only significant peaks in the haz- ard for women occur at ages sixty-one and sixty-five. All the other ones are likely to reflect pure sample noise, although one could rationalize the presence of a spike at age fifty-four through the interaction between eligibility require- ments and minimum pension provisions.
346 Michele Boldrin, Sergi Jimenez-Martin, and Franco Peracchi
1 -
.9 -
.a -
.7 -
.6 7
5 -
4 -
3 -
2 -
-
0 - ’ - +
‘x I I
45 50 55 60 65 69 I I I I
w e
Fig. 8.17 Hazard rate out of the labor force for women
Next, we would like to verify whether the recent trends in the patterns of retirement are also consistent with the structure of incentives that we have de- rived. It is pointless to apply our calculations to years before 1985. In fact, owing to the slow implementation of the 1985 reform, only very recent years may reveal anything informative with respect to the working of the current system.
Table 8.13 (based on social security administrative data) reports the distribu- tion, according to the age of the pensioner, of the new retirement pensions awarded by the general scheme (RGSS) during the years 1991 and 1994. For workers aged sixty-four or younger, we also report the percentage of the new pensioners who, for reasons detailed earlier, were exempted from the 8 percent penalty generally applicable for each year of early retirement.
The results are startling: in spite of the fairly heavy penalties associated with early retirement, more than 40 percent of individuals retire at age sixty or ear- lier. Furthermore, the percentage of those retiring earlier than age sixty-five has been increasing steadily in the last few years, from 64 percent in 1991 to 70 percent in 1994. The intermediate years (not reported) are perfectly consis- tent with this trend.
To sum up, the Spanish social security system makes retirement at earlier ages than sixty-five the only rational strategy. Indeed, for workers with earning profiles below the median or with incomplete earning histories (a situation particularly frequent among women), the incentive to retire as early as pos- sible, that is, at age sixty, is particularly strong. The available data on hazard
347 Social Security and Retirement in Spain
Table 8.13 Age Distribution of New Pensioners, 1991 and 1994
1991 1994
A s Penalty No Penalty Total Penalty No Penalty Total
rates and the recent retirement patterns are completely consistent with this pre- diction.
8.4 Conclusions
The Spanish pension system has witnessed a remarkable evolution in the last twenty-five years, moving away from a collection of dispersed and uncoor- dinated professional schemes toward a more uniform and comprehensive pub- lic system. Such a process has generated a tumultuous growth in the size and nature of public pension schemes as well as a rapid increase in the number of retirees with short contribution histories receiving the minimum public pen- sion. Together with the dramatic demographic changes affecting Spain since the late 1970, the continuous enlargement of the public pension system has been a major cause of the large financial imbalances that have come about in the last decade. This evolution is not yet complete, and the recently enacted (June 1997) changes suggest that further rationalization and uniformization of treatments will be taking place between now and the beginning of the next century.
A third factor underlying the emergence of financial distress is the strong reduction in labor force participation rates among individuals aged fifty-five to sixty-five, which began between 1975 and 1980 and is still taking place. This paper examines the interplay between the incentives generated by the public pension system and the decision to retire after age fifty-five. We quantify such incentives by computing measures of social security wealth and of the implicit taxkubsidy to keep working generated by the current system.
Our findings support the intuitive idea that pension-induced incentives mat- ter for the labor supply behavior of Spanish workers. While the Spanish system
348 Michele Boldrin, Sergi Jimenez-Martin, and Franco Peracchi
does not pay a particularly generous average pension relative to GDP per cap- ita, its “generosity” concentrates in providing relatively large minimum pen- sions to individuals with below-average working histories andor low wages. We show how this fact generates very strong incentives for people to retire as early as possible. At the same time, the pension system provides workers earn- ing average or above-average salaries and having complete working histories relatively weak financial gains from not retiring after age sixty. These financial gains completely disappear and become losses around age sixty-three, particu- larly for workers who have already reached thirty-five years of contributions. We have also shown how the disability insurance system is being used “strate- gically” by individuals who cannot legally anticipate retirement (e.g., the self- employed and farmers) actually to achieve early retirement.
The combination of these three salient features of the Spanish legislation seems to account well for the observed increase in the percentage of early re- tirees among Spanish new pensioners during the 1990s.
It should be stressed, however, that the possibility of retiring before age sixty-five is, according to current legislation, restricted to those workers who began their contribution histories before 1967. While this group represents to- day the bulk of the labor force nearing the age of retirement, its quantitative relevance will decrease rapidly in future years.
It is yet unclear whether such a privilege will be progressively extended as well to individuals who began contributing after that date. Political pressure toward such an extension is currently being applied from various quarters, and the final outcome is hard to predict.
Legislation recently enacted (26 June 1997) is ambivalent on this matter. On the one hand, it links more closely initial pensions to lifetime contribution histories, thereby starting to cut down on opportunities for “pension pur- chases,” especially among the self-employed. On the other hand, it mildly re- duces the penalization for retiring younger than age sixty-five for individuals with long contribution histories, and it leaves untouched both the disability and the minimum pension mechanisms, which we have singled out as the most powerful incentives for early retirement.
If anything, in fact, the extension from eight to fifteen of the number of years over which the benefit base is computed may have the effect of increasing the number of individuals for whom the minimum pension is binding. As we have documented, workers expecting to receive a minimum pension have a strong incentive to anticipate retirement. The final outcome of the recent legislation may therefore be that of just increasing the proportion of the workforce to whom such incentives matter.
349 Social Security and Retirement in Spain
Appendix A Data Appendix
In what follows, we briefly describe the most important data sources employed in this chapter. We also mention some other potentially useful data sources.
Micro Data
Encuesta de Poblaci6n Activa (EPA)
This is a quarterly CPS-like survey of roughly sixty thousand Spanish households carried out by the Spanish National Statistical Institute (INE). It contains fairly detailed information on labor force status, education, and fam- ily background variables but, unfortunately, no information on wages and in- comes. This feature is common to most European-style labor force surveys. Publicly released cross-sectional files are available from 1976.
From 1987, the INE also releases the Encuesta de Poblaci6n Activa Enla- zada, which is the panel version of the EPA obtained by exploiting the rotating cross-sectional nature of the survey. It contains fewer variables, but it permits one to follow individuals for up to six quarters.
Encuesta de Presupuestos Familiares (EPF) This is a cross-sectional household budget survey carried out by INE in
1973-74, 1980-81, and 1990-91, with reference to income and expenditure in the previous calendar year. The 1990-91 sample, used in this paper, contains 21,155 households and 72,123 persons.
Administrative Records from Social Security The third micro-data set used in this paper is a random sample of one of
every two hundred pensioners on file at the INSS in January 1993. The sample consists of 32,366 observations of a universe of 6,473,200 pensioners. The data provide information on initial and current pensions. The difference be- tween these two concepts is broken down into revalorization and complement to minimum pension, which permits us to construct a measure of social secu- rity generosity.
Other Micro Data The Encuesta de Estructura Salarial was carried out by the INE in 1995. It
provides detailed information on wages, working hours, and personal charac- teristics for about 175,000 workers in 19,000 establishments.
The Encuesta Continua de Presupuestos Familiares is a rotating household survey carried out quarterly by the INE since 1985. It collects data on income, consumption, and personal characteristics for about three thousand house- holds. One eighth of the sample is replaced at each rotation.
350 Michele Boldrin, Sergi Jimenez-Martin, and Franco Peracchi
Aggregate Annual or Monthly Data
The Boletin de estadisticas laborales, published by the Ministry of Labor (MTSS), contains data from 1981 on the most important social security pro- grams.
The Boletin informativo de la seguridad social, published by the Direcci6n General de la Seguridad Social, MTSS, contains detailed information on social security expenditures, including medical care, from 198 1.
The Encuesta de Salarios en la Industria y 10s Servicios is a quarterly survey on wages and hours worked carried out by the INE at the establishment level.
Appendix B An Overview of the Literature on Social Security and Retirement in Spain
We have been able to trace the existence of only one investigation of the effect of the Spanish social security system on labor supply and, in particular, retire- ment decisions. Martin and Moreno (1990) look at weekly work hours over the period 1964-84 using net and gross social security wealth as explanatory variables. A fairly simple econometric analysis leads to the conclusion that the negative income effect associated with social security contributions more than compensates for both the substitution effect toward leisure and the increase in expected wealth induced by the promise of a pension payment, thereby in- creasing the overall labor supply.
The rest of the existing literature concentrates almost exclusively on two issues: (1) the financial evolution of the system and the dramatic increase in its current account deficit as a consequence of both the system’s generosity and the adverse demographic evolution; (2) the redistributive features of the system and, in particular, the existence of a wide dispersion in the internal rates of return across different programs.
Analysis of Long-Run Sustainability
Recent years have witnessed the publication of a large number of studies concerned with the long-run viability of the Spanish public pension system and with its capability to sustain the ongoing demographic changes. Among them are the monographs by Barea (1995), Barea and Gonziiles-Piiramo (1996), Herce et al. (1996), INVERCO (1996), Ministerio de Trabajo (1993, and Piiiera and Weinstein (1996) as well as the interesting papers by Herce (1997) and Jimeno and Licandro (1996). While the various authors reach dif-
351 Social Security and Retirement in Spain
ferent conclusions about the most appropriate type of reform, they express similar concerns about the economic viability of the existing system.
Normalizing at zero the deficit of the social security system in 1995, the estimates for 2010 range from -0.8 to -3.5 percent of GDP, with an average of - 1.5 percent. For 2025, the average deficit prediction is of -2.6 percent of GDP, with a range going from - 1.0 to -4.2 percent of GDP. Most studies are based on a set of macroeconomic predictions that, while not overly optimistic, are nevertheless not obviously realistic. In general, a 3 percent per year average growth rate of GDP is assumed, together with a substantial increase in labor force participation rates (up to 70 percent in 2010) and a reduction in the unem- ployment rate from the current 23 percent to about 16-18 percent. Barring substantial structural reforms, these predictions are hardly realistic in the light of the performance of the Spanish economy over the last twenty years.
Analysis of the Redistributive Effects
Most studies concentrate on the period prior to the 1978 reform, and only a few cover more recent years. The unit of investigation is always the individual agent, not the household, and income is very often measured as an annual flow, not as total lifetime income.
For the earlier period, there is widespread consensus on the regressive nature of the combined social security and fiscal system (see, e.g., Castellano 1977; and Vereda and Moch6n 1978). The studies that we have examined, however, are imprecise and na'ive in their theoretical apparatus, the quality of the data available, and the econometric techniques adopted. We find their conclusions dubious.
After 1978, things look quite different. While an early study (Argim6n and Gonzalez-Pkamo 1987) still finds evidence of a regressive effect in the struc- ture of contributions, this is not the case when pension expenditures are taken into consideration (Medel, Molina, and Sanchez 1988). More recently, a num- ber of fairly complete studies (Monasterio and SuCez 1992; Melis and Diaz 1993; and Bandrts and Cuenca 1996) unequivocally document the very strong and progressive redistribution accomplished by the post- 1978 and post- 1985 Spanish pension systems.
These more recent studies do not restrict their analysis to annual income flows but manage to construct relatively credible indices of lifetime contribu- tions and payments according to professional status and decile position in the overall distribution of earnings and to compute internal rates of return for dif- ferent social security programs and income profiles.
Their (fairly uniform) conclusions can be summarized as follows: (a) For most social security programs, both past and current contribution/payment pro- files give rise to a large intergenerational transfer. For example, the ratio of net transfers to the total present value of pensions for individuals affiliated with
352 Michele Boldrin, Sergi Jimenez-Martin, and Franco Peracchi
REEH went from 61.2 percent before the reform to 52 percent after (using a discount rate of 3 percent). (b) The only important exception to this rule is given by the general scheme before and, especially, after the 1985 reform. In this case, net lifetime social security wealth was positive (and equal to about 30 percent of total pension present value) before the reform only if a real dis- count rate of 1 percent was used. It turned negative when a 3 percent discount rate was applied, and it remained negative in either case after the reform. It turns out to be particularly large (50 percent of total pension present value) when discounted at 3 percent. (c) Both the old and the current Spanish social security systems generate very large intragenerational transfers from the gen- eral to all the special schemes. Domestic workers and small farmers are by far the largest beneficiaries of such transfers. ( d ) If one looks at the intragenera- tional transfers occumng not across programs but across income deciles, the Spanish social security system turns out to be a very progressive one: up to 90 percent of the total present value of pensions to which individuals in the first decile of the earnings distribution are entitled represent a pure transfer. This transfer’s percentage decreases rather slowly as one moves up with earnings and changes sign only for the very last decile (or the last two, depending on the details of the calculations).
References
Argimbn, I., and J. M. Gonzalez-Pkamo. 1987. Translaci6n e incidencia de las cotizac- iones sociales por niveles de renta en Espaiia, 1980-84. Documentos de Trabajo (Working Paper) no. 1. Madrid: Fundaci6n para la Investigacion Economica y Social.
BandrCs, E., and A. Cuenca. 1996. Capitalizaci6n y transferencias en ]as pensiones de la seguridad social. In I1 simposio sobre igualdad, y distribucidn de la renta y la riqueza, vol. 7. Madrid: Fundaci6n Argentaria.
Barea, J., ed. 1995. El sistema de pensiones en EspaZa: Analisis y propuestas para su viabilidad. Madrid: Circulo de Empresarios.
Barea, J., and J. M. Gonzilez-Pkamo, eds. 1996. Pensiones y prestaciones por desem- pleo. Bilbao: Fundaci6n. Banco de Bilbao Vizcaya.
Castellano, F. 1977. Distribucih por niveles de ingreso de la cuota patronal de la segur- idad social en Espaiia. Investigaciones economicas 2: 103-24.
de las Fuentes, J. M., and B. Gonzalo. 1996. Modelos de aseguramiento en Espaiia del riesgo de pCrdida de la renta derivada de la actividad laboral a causa de la vejez. Documento de Trabajo (Working Paper), Serie Economia Publica. Bilbao: Funda- ci6n. Banco de Bilbao Vizcaya.
Durin, A. 1995. Politica de pensiones: Situaci6n y perspectivas. In Las actividades econ6micas de la personas mayores. Madrid: SECOT.
FernLndez Cordbn, J. A. 1996. Demografia, actividad y dependencia en Espaiia. Docu- mento de Trabajo (Working Paper), Serie Economia Publica. Bilbao: Fundaci6n. Banco de Bilbao Vizcaya.
Herce, J. A. 1997. La reforma de las pensiones en Espaiia: Aspectos analiticos y apli- cados. Moneda y cridito, no. 204: 105-43.
353 Social Security and Retirement in Spain
Herce, J. A., S. Sosvilla, S. Castillo, and R. Duce. 1996. El futuro de laspensiones en Espafia: Hacia un sistema mixto. Colecci6n de Estudios e Informes 8. Barcelona: Caja de Ahorros y Pensiones de Barcelona.
INVERCO. 1996. Andlisis de 10s sistemas de pensiones. Madrid: Asociacion de Insti- tuciones de Inversion Colectiva y Fondos de Pensiones.
Jimeno, J. F., and 0. Licandro. 1996. El equilibrio financier0 de un sistema de reparto de pensiones de jubilaci6n: Una aplicaci6n a1 caso espaiiol. Documento de Trabajo (Working Paper) no. 96-21. Madrid: Fundaci6n de Estudios de Economia Aplicada.
Marth, A., and L. Moreno. 1990. Efectos de las pensiones de la seguridad social sobre la oferta de trabajo en Espaiia. Investigaciones econdmicas 14:29 1-303.
Medel, B., A. Molina, and J. Sinchez. 1988. Los efectos distributivos del gasto pliblico en Espafia. Documentos de Trabajo (Working Paper) no. 28. Madrid: Fundaci6n para la Investigacion Economica y Social.
Melis, F., and C. Dim. 1993. La distribuci6n personal de salarios y pensiones en las fuentes tributarias. In I simposio sobre igualdad, y distribucidn de la renta y la riqueza, vol. 2. Madrid: Fundaci6n Argentaria.
Ministerio de Trabajo. 1995. La seguridad social en el umbra1 del siglo XXI: Estudio econdmico actuarial. Madrid.
Monasterio, C., and J. Suirez. 1992. Gasto social en pensiones. Hacienda publica es- pafiola 120-21: 119-43.
Piiiera, J., and A. Weinstein. 1996. Una propuesta de reforma del sistema de pensiones en Espafia. Madrid: Circulo de Empresarios.
Vereda, J., and F. Moch6n. 1978. Efectos redistributivos de la seguridad social. Haci- enda pliblica espaiiola 52:83-93.
Villagarcia, T. 1995. Esiste un sesgo de inactividad en la encuesta de poblaci6n activa? Documento de Trabajo (Working Paper) no. 95-04. Universidad Carlos 111, Madrid.